
Reinforcing Increase of ΔTc in MgB2 Smart Meta-Superconductors by Adjusting the Concentration of Inhomogeneous Phases

Abstract
1. Introduction
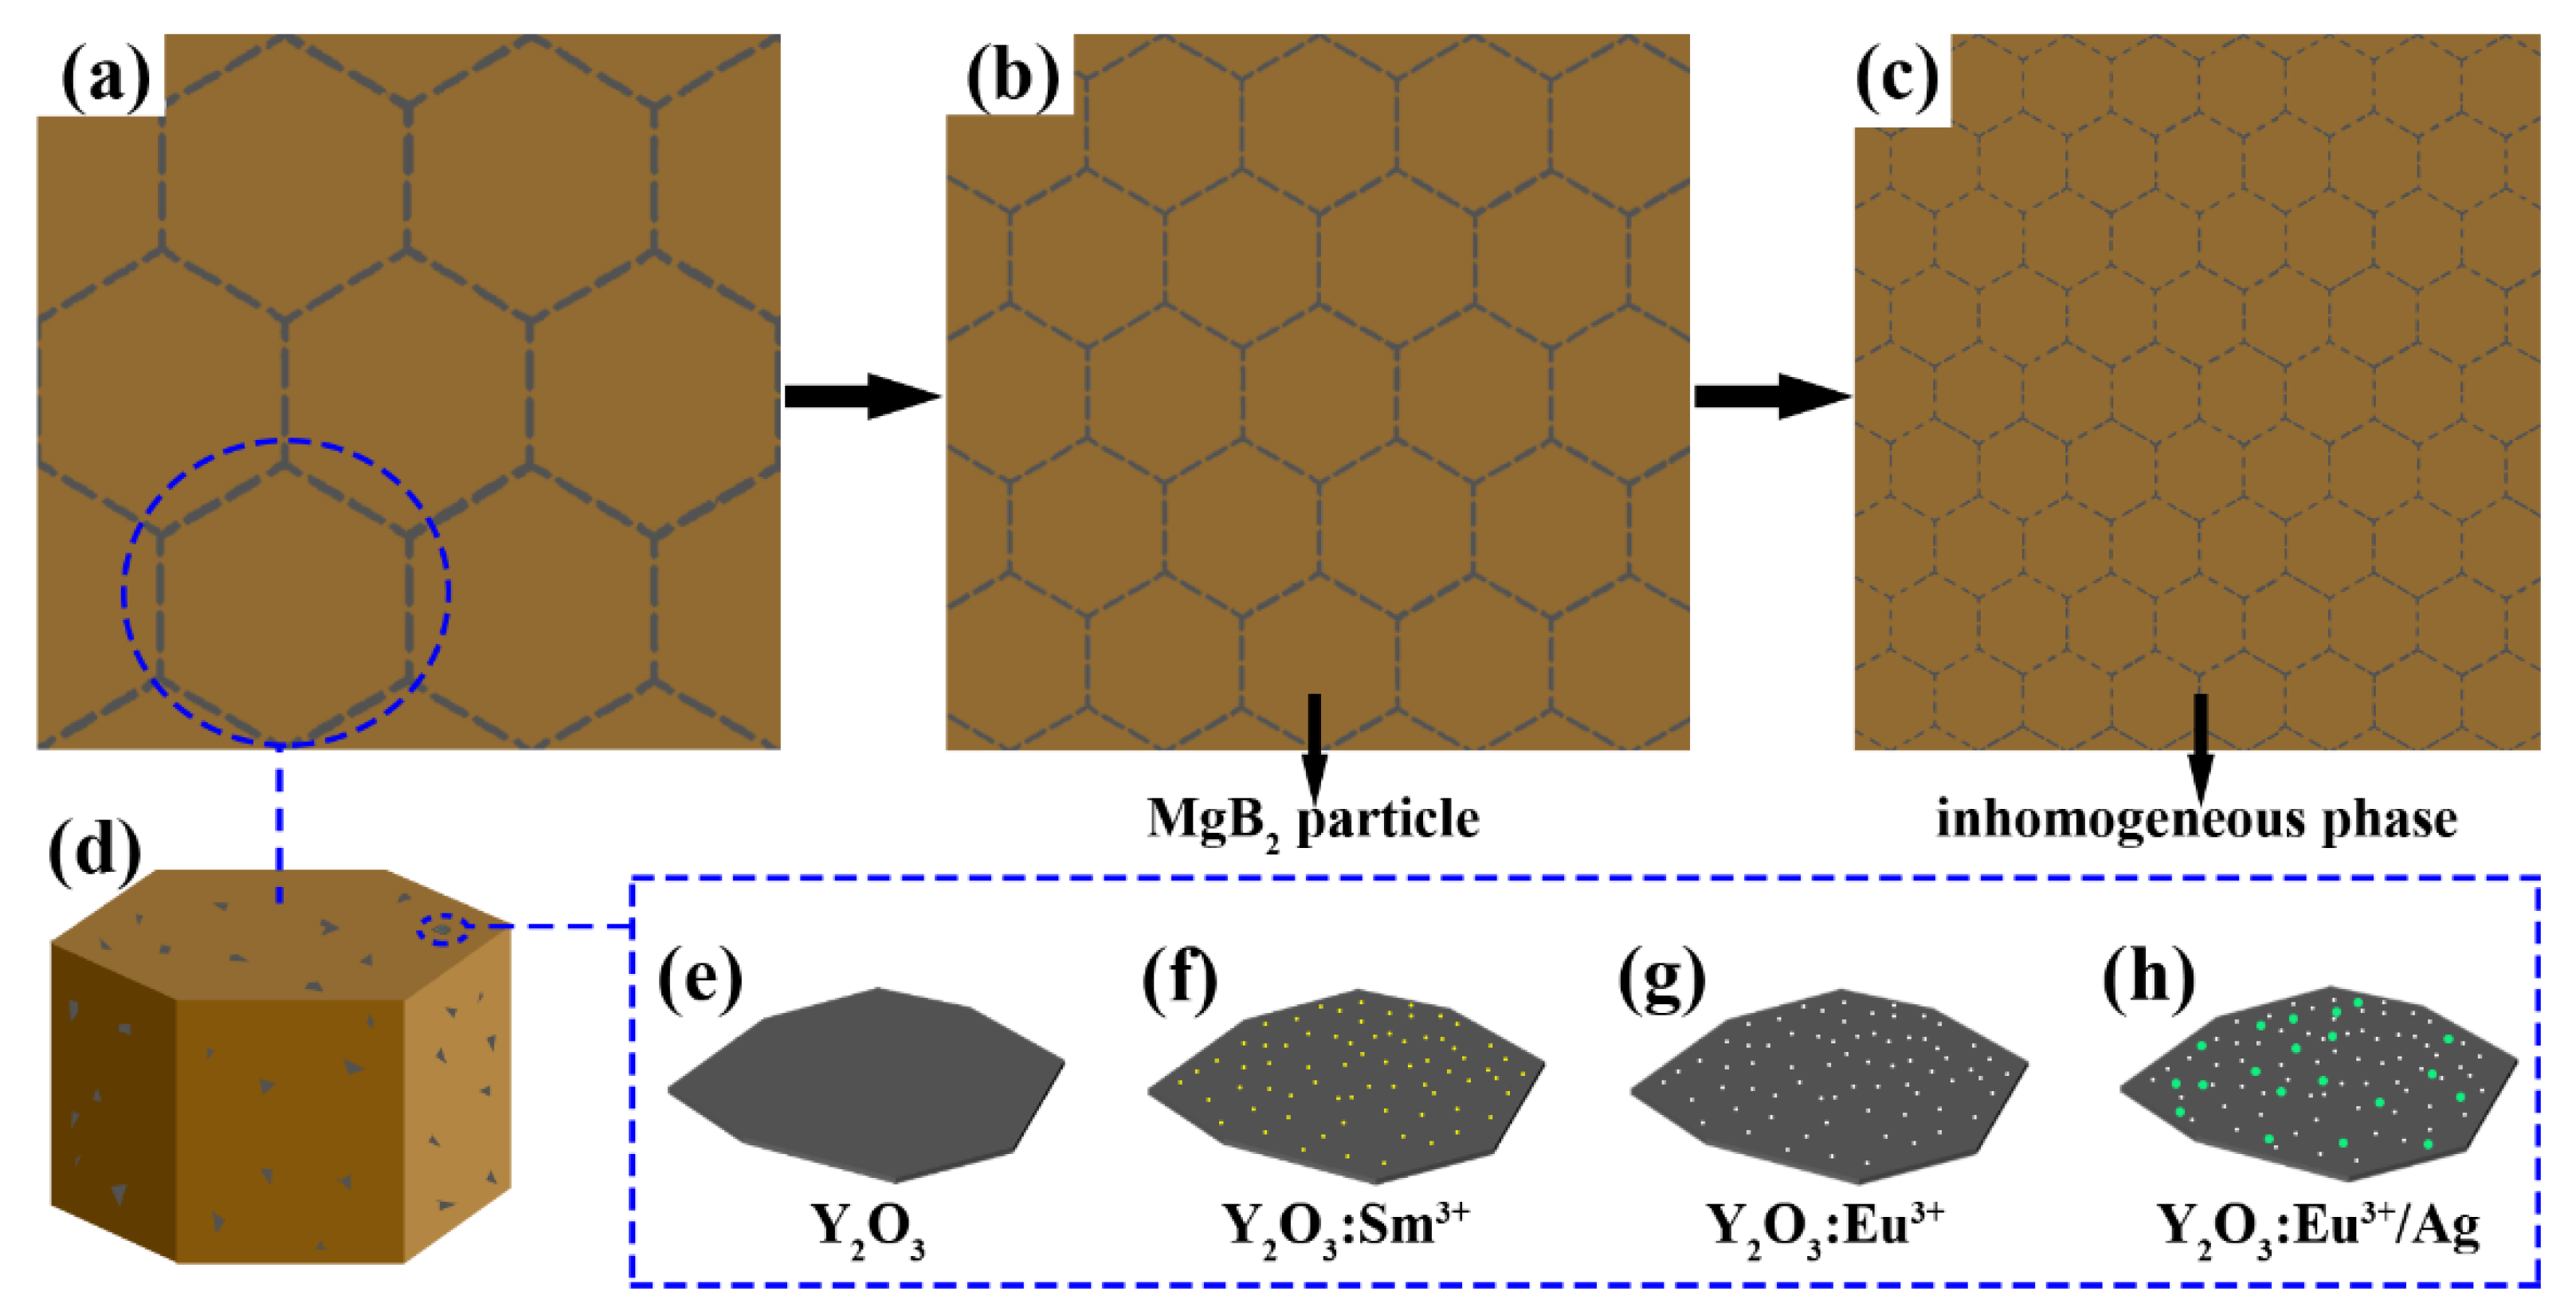
2. Model
3. Experiment
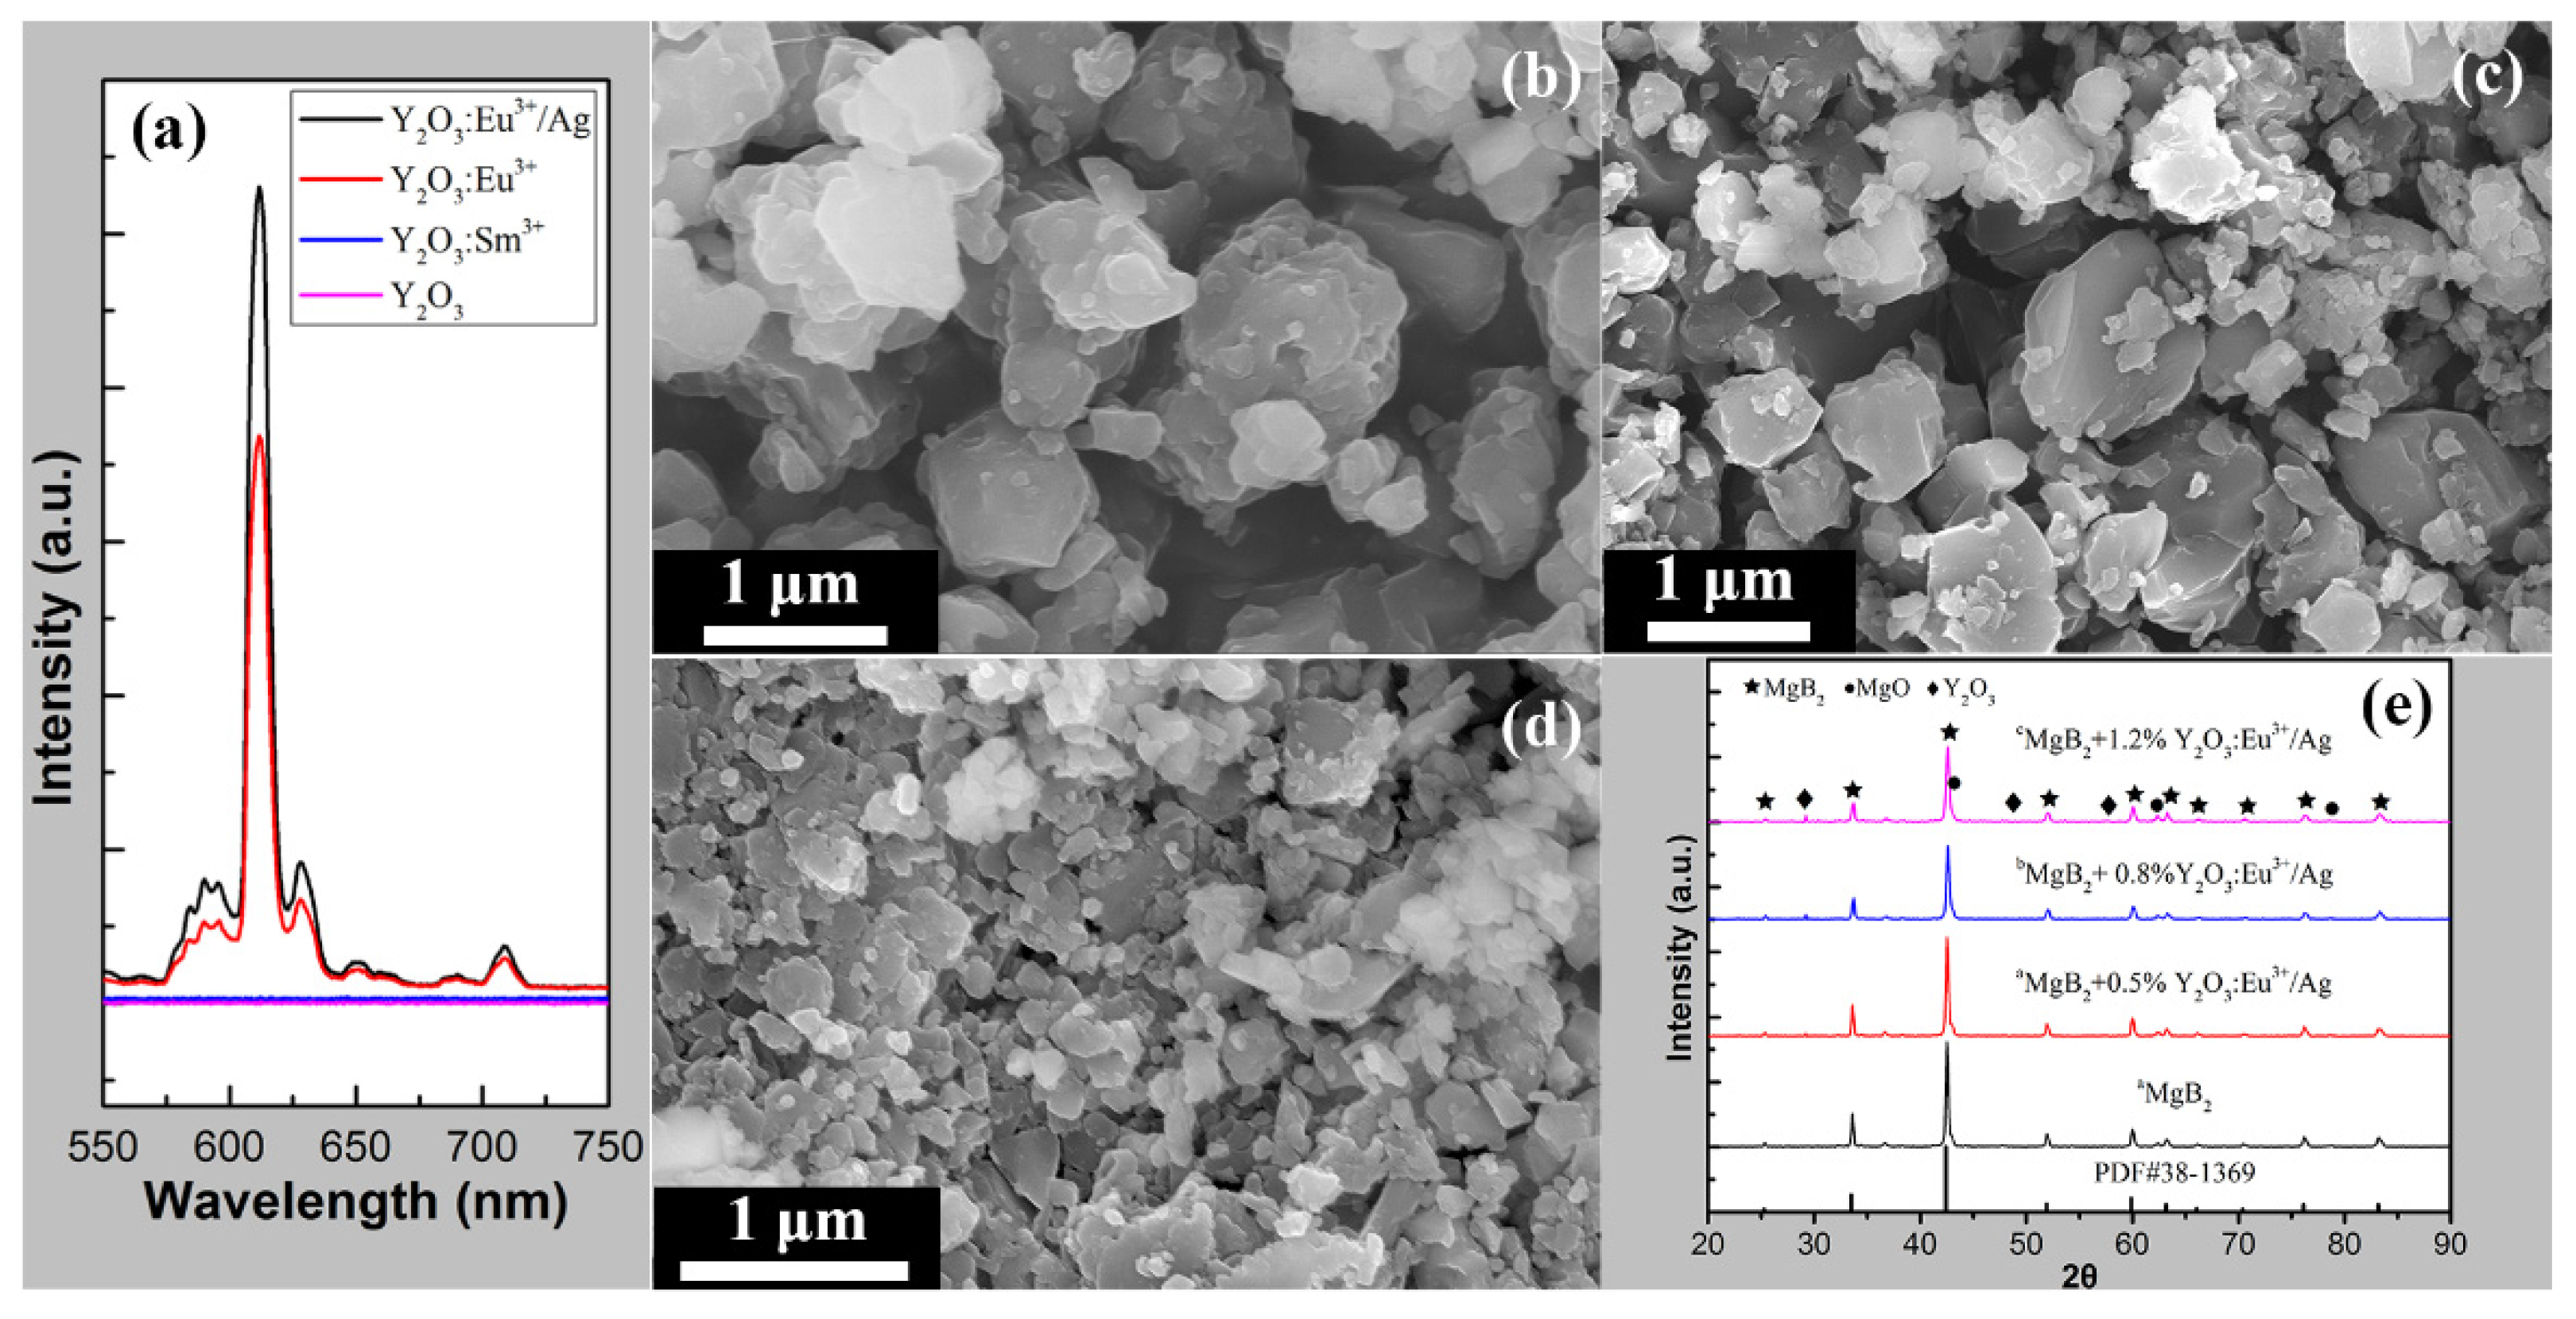
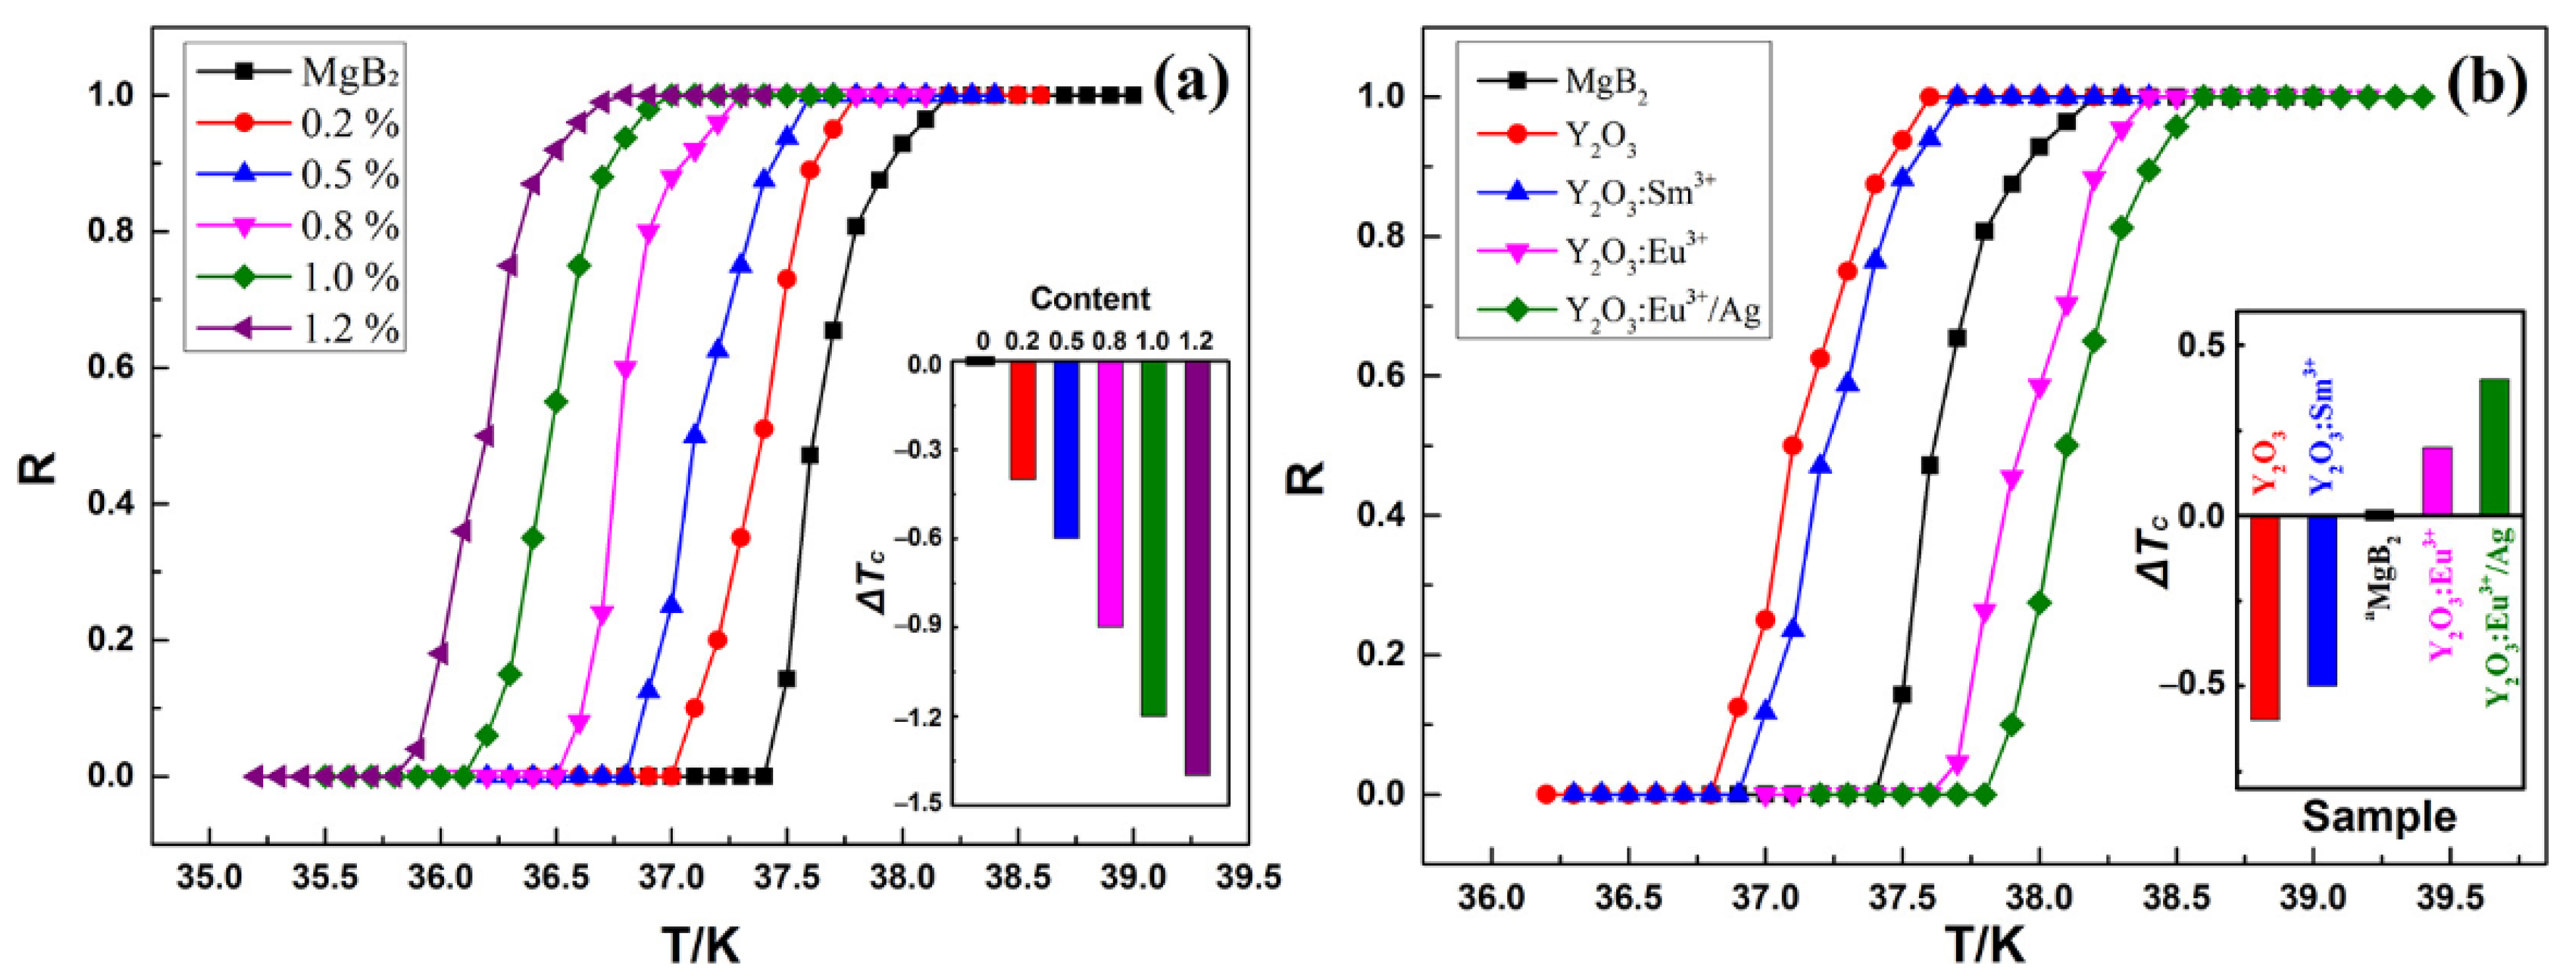
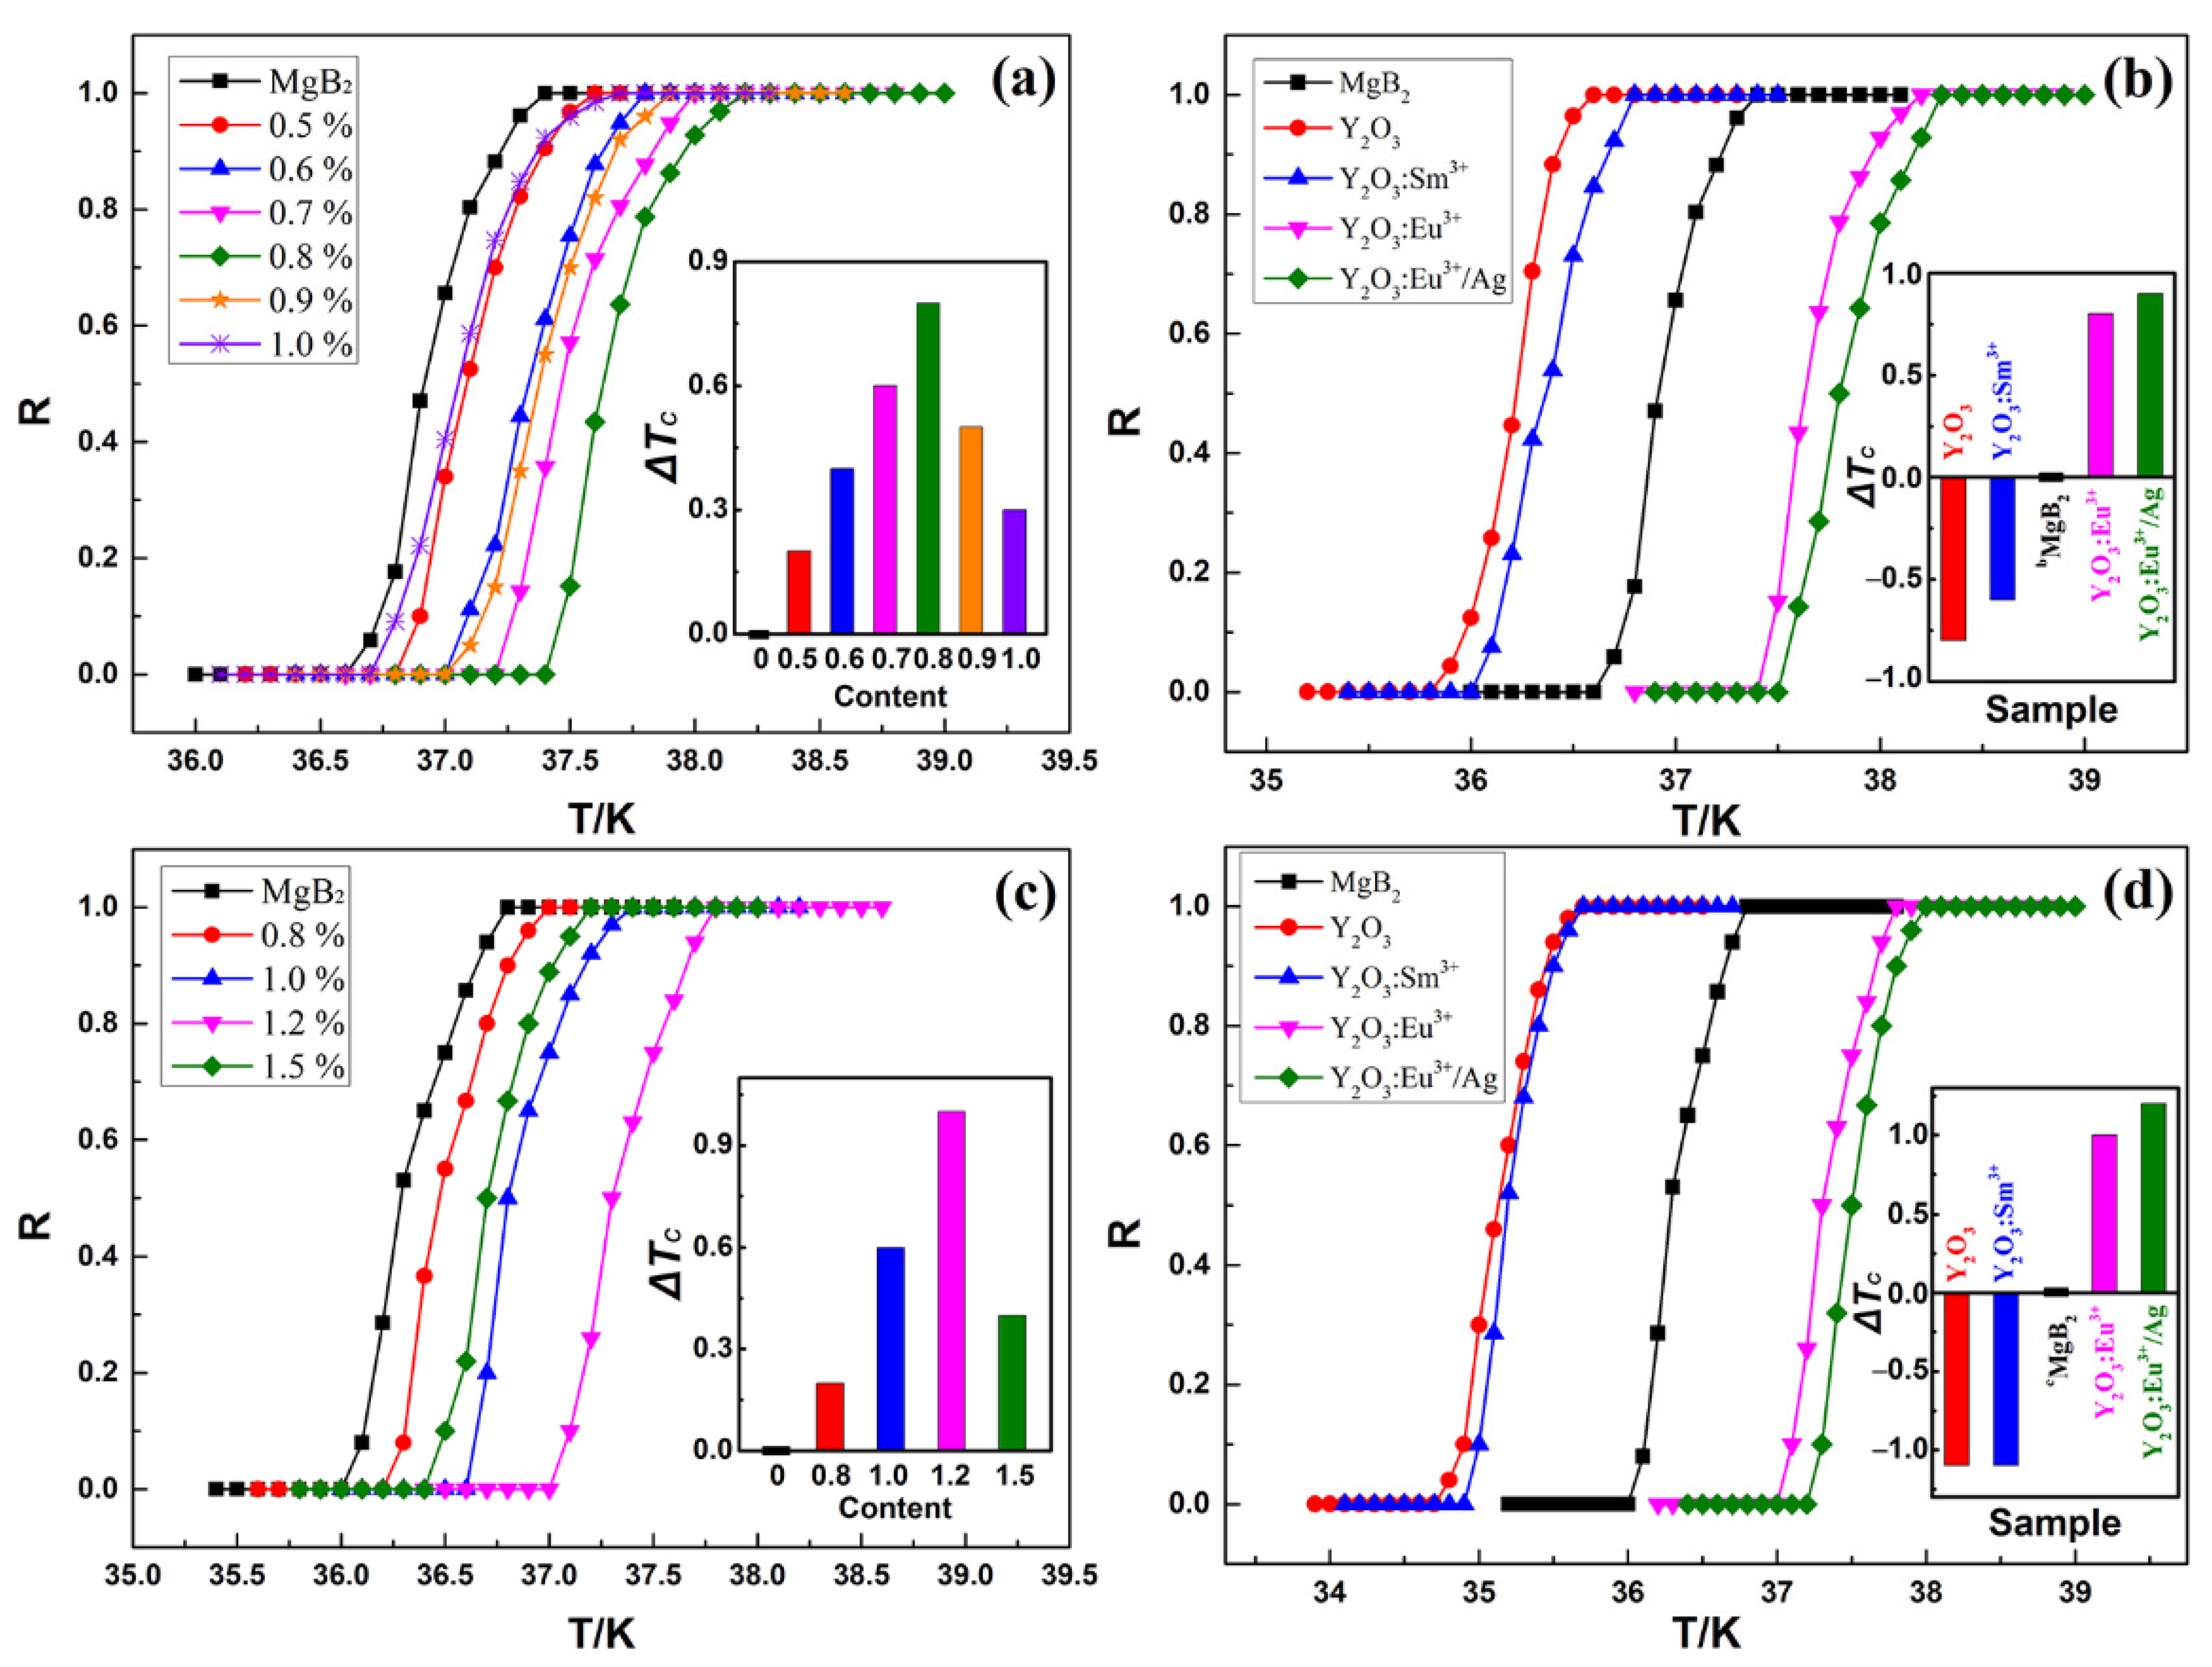
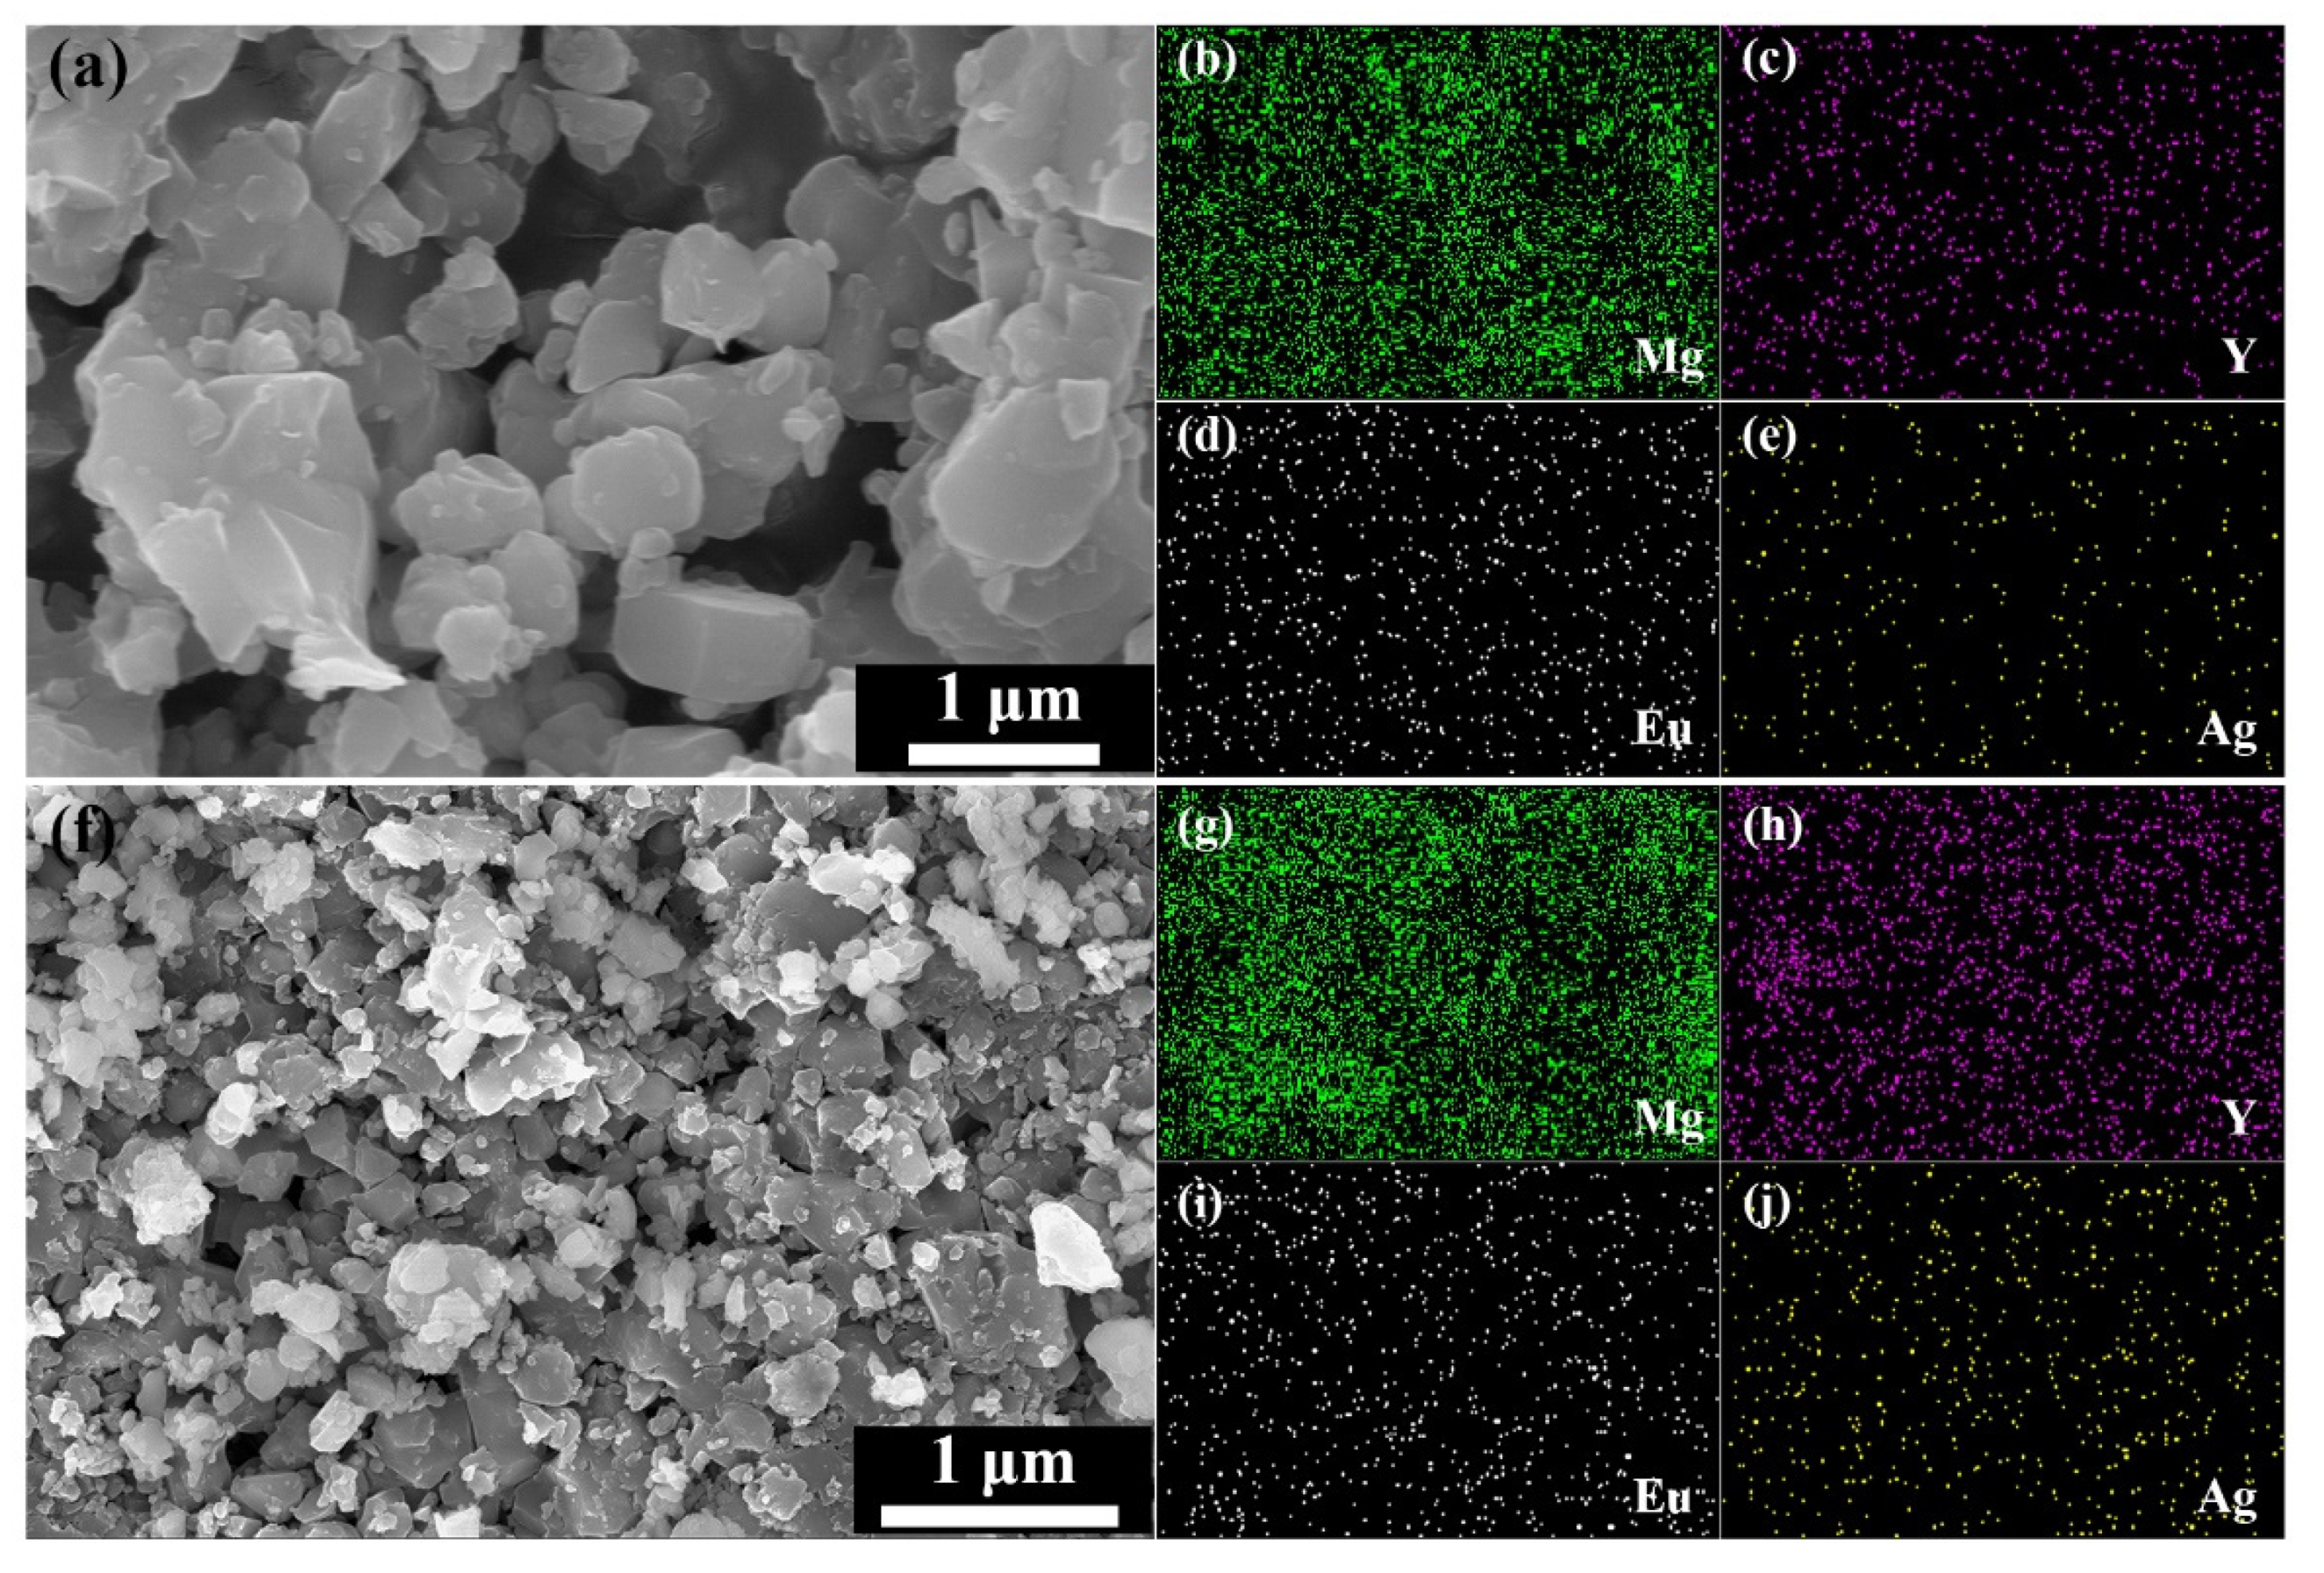
4. Results and Discussion
5. Conclusions
Author Contributions
Funding
Institutional Review Board Statement
Informed Consent Statement
Data Availability Statement
Conflicts of Interest
References
- Bardeen, J.; Cooper, L.N.; Schrieffer, J.R. Theory of Superconductivity. Phys. Rev. 1957, 108, 1175–1204. [Google Scholar] [CrossRef]
- McMillan, W.L. Transition Temperature of Strong-Coupled Superconductors. Phys. Rev. 1968, 167, 331–344. [Google Scholar] [CrossRef]
- Bednorz, J.G.; Müller, K.A. Possible high Tc superconductivity in the Ba-La-Cu-O system. Z. Phys. B-Condens. Matter 1986, 64, 189–193. [Google Scholar] [CrossRef]
- Mohd Yusuf, N.; Awang Kechik, M.; Baqiah, H.; Soo Kien, C.; Kean Pah, L.; Shaari, A.; Wan Jusoh, W.; Abd Sukor, S.; Mousa Dihom, M.; Talib, Z.; et al. Structural and Superconducting Properties of Thermal Treatment-Synthesised Bulk YBa2Cu3O7−δ Superconductor: Effect of Addition of SnO2 Nanoparticles. Materials 2018, 12, 92. [Google Scholar] [CrossRef] [PubMed]
- Kamihara, Y.; Watanabe, T.; Hirano, M.; Hosono, H. Iron-Based Layered Superconductor La[O1-XFX]FeAs (x = 0.05–0.12) with Tc = 26 K. J. Am. Chem. Soc. 2008, 130, 3296–3297. [Google Scholar] [CrossRef]
- Zhang, P.; Yaji, K.; Hashimoto, T.; Ota, Y.; Kondo, T.; Okazaki, K.; Wang, Z.; Wen, J.; Gu, G.D.; Ding, H.; et al. Observation of topological superconductivity on the surface of an iron-based superconductor. Science 2018, 360, 182–186. [Google Scholar] [CrossRef]
- Drozdov, A.P.; Eremets, M.I.; Troyan, I.A.; Ksenofontov, V.; Shylin, S.I. Conventional superconductivity at 203 kelvin at high pressures in the sulfur hydride system. Nature 2015, 525, 73–76. [Google Scholar] [CrossRef]
- Cantaluppi, A.; Buzzi, M.; Jotzu, G.; Nicoletti, D.; Mitrano, M.; Pontiroli, D.; Ricco, M.; Perucchi, A.; Di Pietro, P.; Cavalleri, A. Pressure tuning of light-induced superconductivity in K3C60. Nat. Phys. 2018, 14, 837–841. [Google Scholar] [CrossRef]
- Drozdov, A.P.; Kong, P.P.; Minkov, V.S.; Besedin, S.P.; Kuzovnikov, M.A.; Mozaffari, S.; Balicas, L.; Balakirev, F.F.; Graf, D.E.; Prakapenka, V.B.; et al. Superconductivity at 250 K in lanthanum hydride under high pressures. Nature 2019, 569, 528–531. [Google Scholar] [CrossRef]
- Snider, E.; Dasenbrock-Gammon, N.; McBride, R.; Debessai, M.; Vindana, H.; Vencatasamy, K.; Lawler, K.V.; Salamat, A.; Dias, R.P. Room-temperature superconductivity in a carbonaceous sulfur hydride. Nature 2020, 586, 373–377. [Google Scholar] [CrossRef] [PubMed]
- Fausti, D.; Tobey, R.I.; Dean, N.; Kaiser, S.; Dienst, A.; Hoffmann, M.C.; Pyon, S.; Takayama, T.; Takagi, H.; Cavalleri, A. Light-induced superconductivity in a stripe-ordered cuprate. Science 2011, 331, 189–191. [Google Scholar] [CrossRef] [PubMed]
- Cavalleri, A. Photo-induced superconductivity. Contemp. Phys. 2017, 59, 31–46. [Google Scholar] [CrossRef]
- Nagamatsu, J.; Nakagawa, N.; Muranaka, T.; Zenitani, Y.; Akimitsu, J. Superconductivity at 39 K in magnesium diboride. Nature 2001, 410, 63–64. [Google Scholar] [CrossRef]
- Bohnen, K.P.; Heid, R.; Renker, B. Phonon dispersion and electron-phonon coupling in MgB2 and AlB2. Phys. Rev. Lett. 2001, 86, 5771–5774. [Google Scholar] [CrossRef] [PubMed]
- Buzea, C.; Yamashita, T. Review of the superconducting properties of MgB2. Supercond. Sci. Technol. 2001, 14, R115–R146. [Google Scholar] [CrossRef]
- Yildirim, T.; Gulseren, O.; Lynn, J.W.; Brown, C.M.; Udovic, T.J.; Huang, Q.; Rogado, N.; Regan, K.A.; Hayward, M.A.; Slusky, J.S.; et al. Giant anharmonicity and nonlinear electron-phonon coupling in MgB2: A combined first-principles calculation and neutron scattering study. Phys. Rev. Lett. 2001, 87, 037001. [Google Scholar] [CrossRef] [PubMed]
- Singh, P.P. From E2g to other modes: Effects of pressure on electron-phonon interaction in MgB2. Phys. Rev. Lett. 2006, 97, 247002. [Google Scholar] [CrossRef]
- Vinod, K.; Varghese, N.; Syamaprasad, U. Superconductivity of MgB2 in the BCS framework with emphasis on extrinsic effects on critical temperature. Supercond. Sci. Technol. 2007, 20, R31–R45. [Google Scholar] [CrossRef]
- Varilci, A.; Yegen, D.; Tassi, M.; Stamopoulos, D.; Terzioglu, C. Effect of annealing temperature on some physical properties of MgB2 by using the Hall probe ac-susceptibility method. Phys. B: Condens. Matter 2009, 404, 4054–4059. [Google Scholar] [CrossRef]
- Zhao, Y.G.; Zhang, X.P.; Qiao, P.T.; Zhang, H.T.; Jia, S.L.; Cao, B.S.; Zhu, M.H.; Han, Z.H.; Wang, X.L.; Gu, B.L. Effect of Li doping on structure and superconducting transition temperature of Mg1-xLixB2. Phys. C 2001, 361, 91–94. [Google Scholar] [CrossRef]
- Mackinnon, I.D.R.; Winnett, A.; Alarco, J.A.; Talbot, P.C. Synthesis of MgB2 at low temperature and autogenous pressure. Materials 2014, 7, 3901–3918. [Google Scholar] [CrossRef] [PubMed]
- Ozturk, O.; Asikuzun, E.; Kaya, S.; Koc, N.S.; Erdem, M. The effect of Ar ambient pressure and annealing duration on the cicrostructure, superconducting properties and activation energies of MgB2 superconductors. J. Supercond. Nov. Magn. 2016, 30, 1161–1169. [Google Scholar] [CrossRef]
- Cheng, F.; Ma, Z.; Liu, C.; Li, H.; Shahriar, A.; Hossain, M.; Bando, Y.; Yamauchi, Y.; Fatehmulla, A.; Farooq, W.A.; et al. Enhancement of grain connectivity and critical current density in the ex-situ sintered MgB2 superconductors by doping minor Cu. J. Alloys Compd. 2017, 727, 1105–1109. [Google Scholar] [CrossRef]
- Grivel, J.C.; Rubešová, K. Increase of the critical current density of MgB2 superconducting bulk samples by means of methylene blue dye additions. Phys. C 2019, 565, 1353506. [Google Scholar] [CrossRef]
- Li, S.Y.; Xiong, Y.M.; Mo, W.Q.; Fan, R.; Wang, C.H.; Luo, X.G.; Sun, Z.; Zhang, H.T.; Li, L.; Cao, L.Z.; et al. Alkali metal substitution efffects in Mg1-xAxB2 (A = Li and Na). Phys. C 2001, 363, 219–223. [Google Scholar] [CrossRef]
- Slusky, J.S.; Rogado, N.; Regan, K.A.; Hayward, M.A.; Khalifah, P.; He, T.; Inumaru, K.; Loureiro, S.M.; Haas, M.K.; Zandbergen, H.W.; et al. Loss of superconductivity with the addition of Al to MgB2 and a structural transition in Mg1-xAlxB2. Nature 2001, 410, 343. [Google Scholar] [CrossRef] [PubMed]
- Dou, S.X.; Soltanian, S.; Horvat, J.; Wang, X.L.; Zhou, S.H.; Ionescu, M.; Liu, H.K. Enhancement of the critical current density and flux pinning of MgB2 superconductor by nanoparticle SiC doping. Appl. Phys. Lett. 2002, 81, 3419–3421. [Google Scholar] [CrossRef]
- Li, G.Z.; Sumption, M.D.; Rindfleisch, M.A.; Thong, C.J.; Tomsic, M.J.; Collings, E.W. Enhanced higher temperature (20–30 K) transport properties and irreversibility field in nano-Dy2O3 doped advanced internal Mg infiltration processed MgB2 composites. Appl. Phys. Lett. 2014, 105, 112603. [Google Scholar] [CrossRef]
- Susner, M.A.; Bohnenstiehl, S.D.; Dregia, S.A.; Sumption, M.D.; Yang, Y.; Donovan, J.J.; Collings, E.W. Homogeneous carbon doping of magnesium diboride by high-temperature, high-pressure synthesis. Appl. Phys. Lett. 2014, 104, 162603. [Google Scholar] [CrossRef]
- Shahabuddin, M.; Madhar, N.A.; Alzayed, N.S.; Asif, M. Uniform dispersion and exfoliation of multi-walled carbon nanotubes in CNT-MgB2 superconductor composites using surfactants. Materials 2019, 12, 3044. [Google Scholar] [CrossRef]
- Liu, H.; Zhao, X.P.; Yang, Y.; Li, Q.W.; Lv, J. Fabrication of infrared left-handed metamaterials via double template-assisted electrochemical deposition. Adv. Mater. 2008, 20, 2050–2054. [Google Scholar] [CrossRef]
- Smolyaninova, V.N.; Zander, K.; Gresock, T.; Jensen, C.; Prestigiacomo, J.C.; Osofsky, M.S.; Smolyaninov, I.I. Using metamaterial nanoengineering to triple the superconducting critical temperature of bulk aluminum. Sci. Rep. 2015, 5, 15777. [Google Scholar] [CrossRef] [PubMed]
- Smolyaninov, I.I.; Smolyaninova, V.N. Theoretical modeling of critical temperature increase in metamaterial superconductors. Phys. Rev. B 2016, 93, 184510. [Google Scholar] [CrossRef]
- Jiang, W.T.; Xu, Z.L.; Chen, Z.; Zhao, X.P. Introduce uniformly distributed ZnO nano-defects into BSCCO superconductors by nano-composite method. J. Funct. Mater. 2007, 38, 157–160. Available online: http://www.cnki.com.cn/Article/CJFDTOTAL-GNCL200701046.htm (accessed on 30 April 2021). (In Chinese).
- Xu, S.H.; Zhou, Y.W.; Zhao, X.P. Research and development of inorganic powder EL materials. Mater. Rep. 2007, 21, 162–166. Available online: http://www.cnki.com.cn/Article/CJFDTotal-CLDB2007S3048.htm (accessed on 30 April 2021). (In Chinese).
- Zhang, Z.W.; Tao, S.; Chen, G.W.; Zhao, X.P. Improving the critical temperature of MgB2 superconducting metamaterials induced by electroluminescence. J. Supercond. Nov. Magn. 2016, 29, 1159–1162. [Google Scholar] [CrossRef][Green Version]
- Tao, S.; Li, Y.B.; Chen, G.W.; Zhao, X.P. Critical temperature of smart meta-superconducting MgB2. J. Supercond. Nov. Magn. 2017, 30, 1405–1411. [Google Scholar] [CrossRef]
- Chen, H.G.; Li, Y.B.; Chen, G.W.; Xu, L.X.; Zhao, X.P. The effect of inhomogeneous phase on the critical temperature of smart meta-superconductor MgB2. J. Supercond. Nov. Magn. 2018, 31, 3175–3182. [Google Scholar] [CrossRef]
- Li, Y.B.; Chen, H.G.; Qi, W.C.; Chen, G.W.; Zhao, X.P. Inhomogeneous phase effect of smart meta-superconducting MgB2. J. Low. Temp. Phys. 2018, 191, 217–227. [Google Scholar] [CrossRef]
- Li, Y.B.; Chen, H.G.; Wang, M.Z.; Xu, L.X.; Zhao, X.P. Smart meta-superconductor MgB2 constructed by the dopant phase of luminescent nanocomposite. Sci. Rep. 2019, 9, 14194. [Google Scholar] [CrossRef]
- Chen, H.G.; Li, Y.B.; Wang, M.Z.; Han, G.Y.; Shi, M.; Zhao, X.P. Smart metastructure method for increasing Tc of Bi(Pb)SrCaCuO high-temperature superconductors. J. Supercond. Nov. Magn. 2020, 33, 3015–3025. [Google Scholar] [CrossRef]
- Chen, H.G.; Wang, M.Z.; Qi, Y.; Li, Y.B.; Zhao, X.P. Relationship between the TC of Smart Meta-Superconductor Bi(Pb)SrCaCuO and Inhomogeneous Phase Content. Nanomaterials 2021, 11, 1061. [Google Scholar] [CrossRef]
- Chen, G.W.; Qi, W.C.; Li, Y.B.; Yang, C.S.; Zhao, X.P. Hydrothermal synthesis of Y2O3:Eu3+ nanorods and its growth mechanism and luminescence properties. J. Mater. Sci. Mater. Electron. 2016, 27, 5628–5634. [Google Scholar] [CrossRef]
- Wang, M.Z.; Xu, L.X.; Chen, G.W.; Zhao, X.P. Topological luminophor Y2O3:Eu3++Ag with high electroluminescence performance. ACS Appl. Mater. Interfaces 2019, 11, 2328–2335. [Google Scholar] [CrossRef]
- Xu, L.X.; Wang, M.Z.; Liu, Z.X.; Zhao, X.P. Nano-topological luminophor Y2O3:Eu3+ + Ag with concurrent photoluminescence and electroluminescence. J. Mater. Sci. Mater. Electron. 2019, 30, 20243–20252. [Google Scholar] [CrossRef]
- Eyidi, D.; Eibl, O.; Wenzel, T.; Nickel, K.G.; Giovannini, M.; Saccone, A. Phase analysis of superconducting polycrystalline MgB2. Micron 2003, 34, 85–96. [Google Scholar] [CrossRef]
- Shi, Q.Z.; Liu, Y.C.; Gao, Z.M.; Zhao, Q. Formation of MgO whiskers on the surface of bulk MgB2 superconductors during in situ sintering. J. Mater. Sci. 2007, 43, 1438–1443. [Google Scholar] [CrossRef]
- Ma, Z.Q.; Liu, Y.C.; Shi, Q.Z.; Zhao, Q.; Gao, Z.M. The improved superconductive properties of MgB2 bulks with minor Cu addition through reducing the MgO impurity. Phys. C 2008, 468, 2250–2253. [Google Scholar] [CrossRef]
- Singh, D.K.; Tiwari, B.; Jha, R.; Kishan, H.; Awana, V.P.S. Role of MgO impurity on the superconducting properties of MgB2. Phys. C 2014, 505, 104–108. [Google Scholar] [CrossRef]
- Wang, C.C.; Zeng, R.; Xu, X.; Dou, S.X. Superconducting transition width under magnetic field in MgB2 polycrystalline samples. J. Appl. Phys. 2010, 108, 093907. [Google Scholar] [CrossRef]
- Dogruer, M.; Yildirim, G.; Ozturk, O.; Terzioglu, C. Analysis of indentation size effect on mechanical properties of Cu-diffused bulk MgB2 superconductor using experimental and different theoretical models. J. Supercond. Nov. Magn. 2012, 26, 101–109. [Google Scholar] [CrossRef]
- Mizutani, S.; Yamamoto, A.; Shimoyama, J.-I.; Ogino, H.; Kishio, K. Self-sintering-assisted high intergranular connectivity in ball-milled ex situ MgB2 bulks. Supercond. Sci. Technol. 2014, 27, 114001. [Google Scholar] [CrossRef]
- Ozturk, O.; Asikuzun, E.; Kaya, S. Significant change in micro mechanical, structural and electrical properties of MgB2 superconducting ceramics depending on argon ambient pressure and annealing duration. J. Mater. Sci. Mater. Electron. 2015, 26, 3840–3852. [Google Scholar] [CrossRef]


| ΔTcs | Y2O3 | Y2O3:Sm3+ | Y2O3:Eu3+ | Y2O3:Eu3+/Ag |
|---|---|---|---|---|
| aMgB2 (0.5%) | −0.6 K | −0.5 K | 0.2 K | 0.4 K |
| bMgB2 (0.8%) | −0.8 K | −0.6 K | 0.8 K | 0.9 K |
| cMgB2 (1.2%) | −1.1 K | −1.1 K | 1.0 K | 1.2 K |
Publisher’s Note: MDPI stays neutral with regard to jurisdictional claims in published maps and institutional affiliations. |
© 2021 by the authors. Licensee MDPI, Basel, Switzerland. This article is an open access article distributed under the terms and conditions of the Creative Commons Attribution (CC BY) license (https://creativecommons.org/licenses/by/4.0/).
Share and Cite
Li, Y.; Han, G.; Zou, H.; Tang, L.; Chen, H.; Zhao, X. Reinforcing Increase of ΔTc in MgB2 Smart Meta-Superconductors by Adjusting the Concentration of Inhomogeneous Phases. Materials 2021, 14, 3066. https://doi.org/10.3390/ma14113066
Li Y, Han G, Zou H, Tang L, Chen H, Zhao X. Reinforcing Increase of ΔTc in MgB2 Smart Meta-Superconductors by Adjusting the Concentration of Inhomogeneous Phases. Materials. 2021; 14(11):3066. https://doi.org/10.3390/ma14113066
Chicago/Turabian StyleLi, Yongbo, Guangyu Han, Hongyan Zou, Li Tang, Honggang Chen, and Xiaopeng Zhao. 2021. "Reinforcing Increase of ΔTc in MgB2 Smart Meta-Superconductors by Adjusting the Concentration of Inhomogeneous Phases" Materials 14, no. 11: 3066. https://doi.org/10.3390/ma14113066
APA StyleLi, Y., Han, G., Zou, H., Tang, L., Chen, H., & Zhao, X. (2021). Reinforcing Increase of ΔTc in MgB2 Smart Meta-Superconductors by Adjusting the Concentration of Inhomogeneous Phases. Materials, 14(11), 3066. https://doi.org/10.3390/ma14113066