
Effect of Surface Roughness Characteristics on Structural Performance of Hollow Core Slabs

 , ,
, , 
Abstract
1. Introduction
2. Major Structural Design Criteria of the HCS
2.1. Flexural Strength
2.2. Horizontal Shear Strength
3. Experimental Program
3.1. Materials
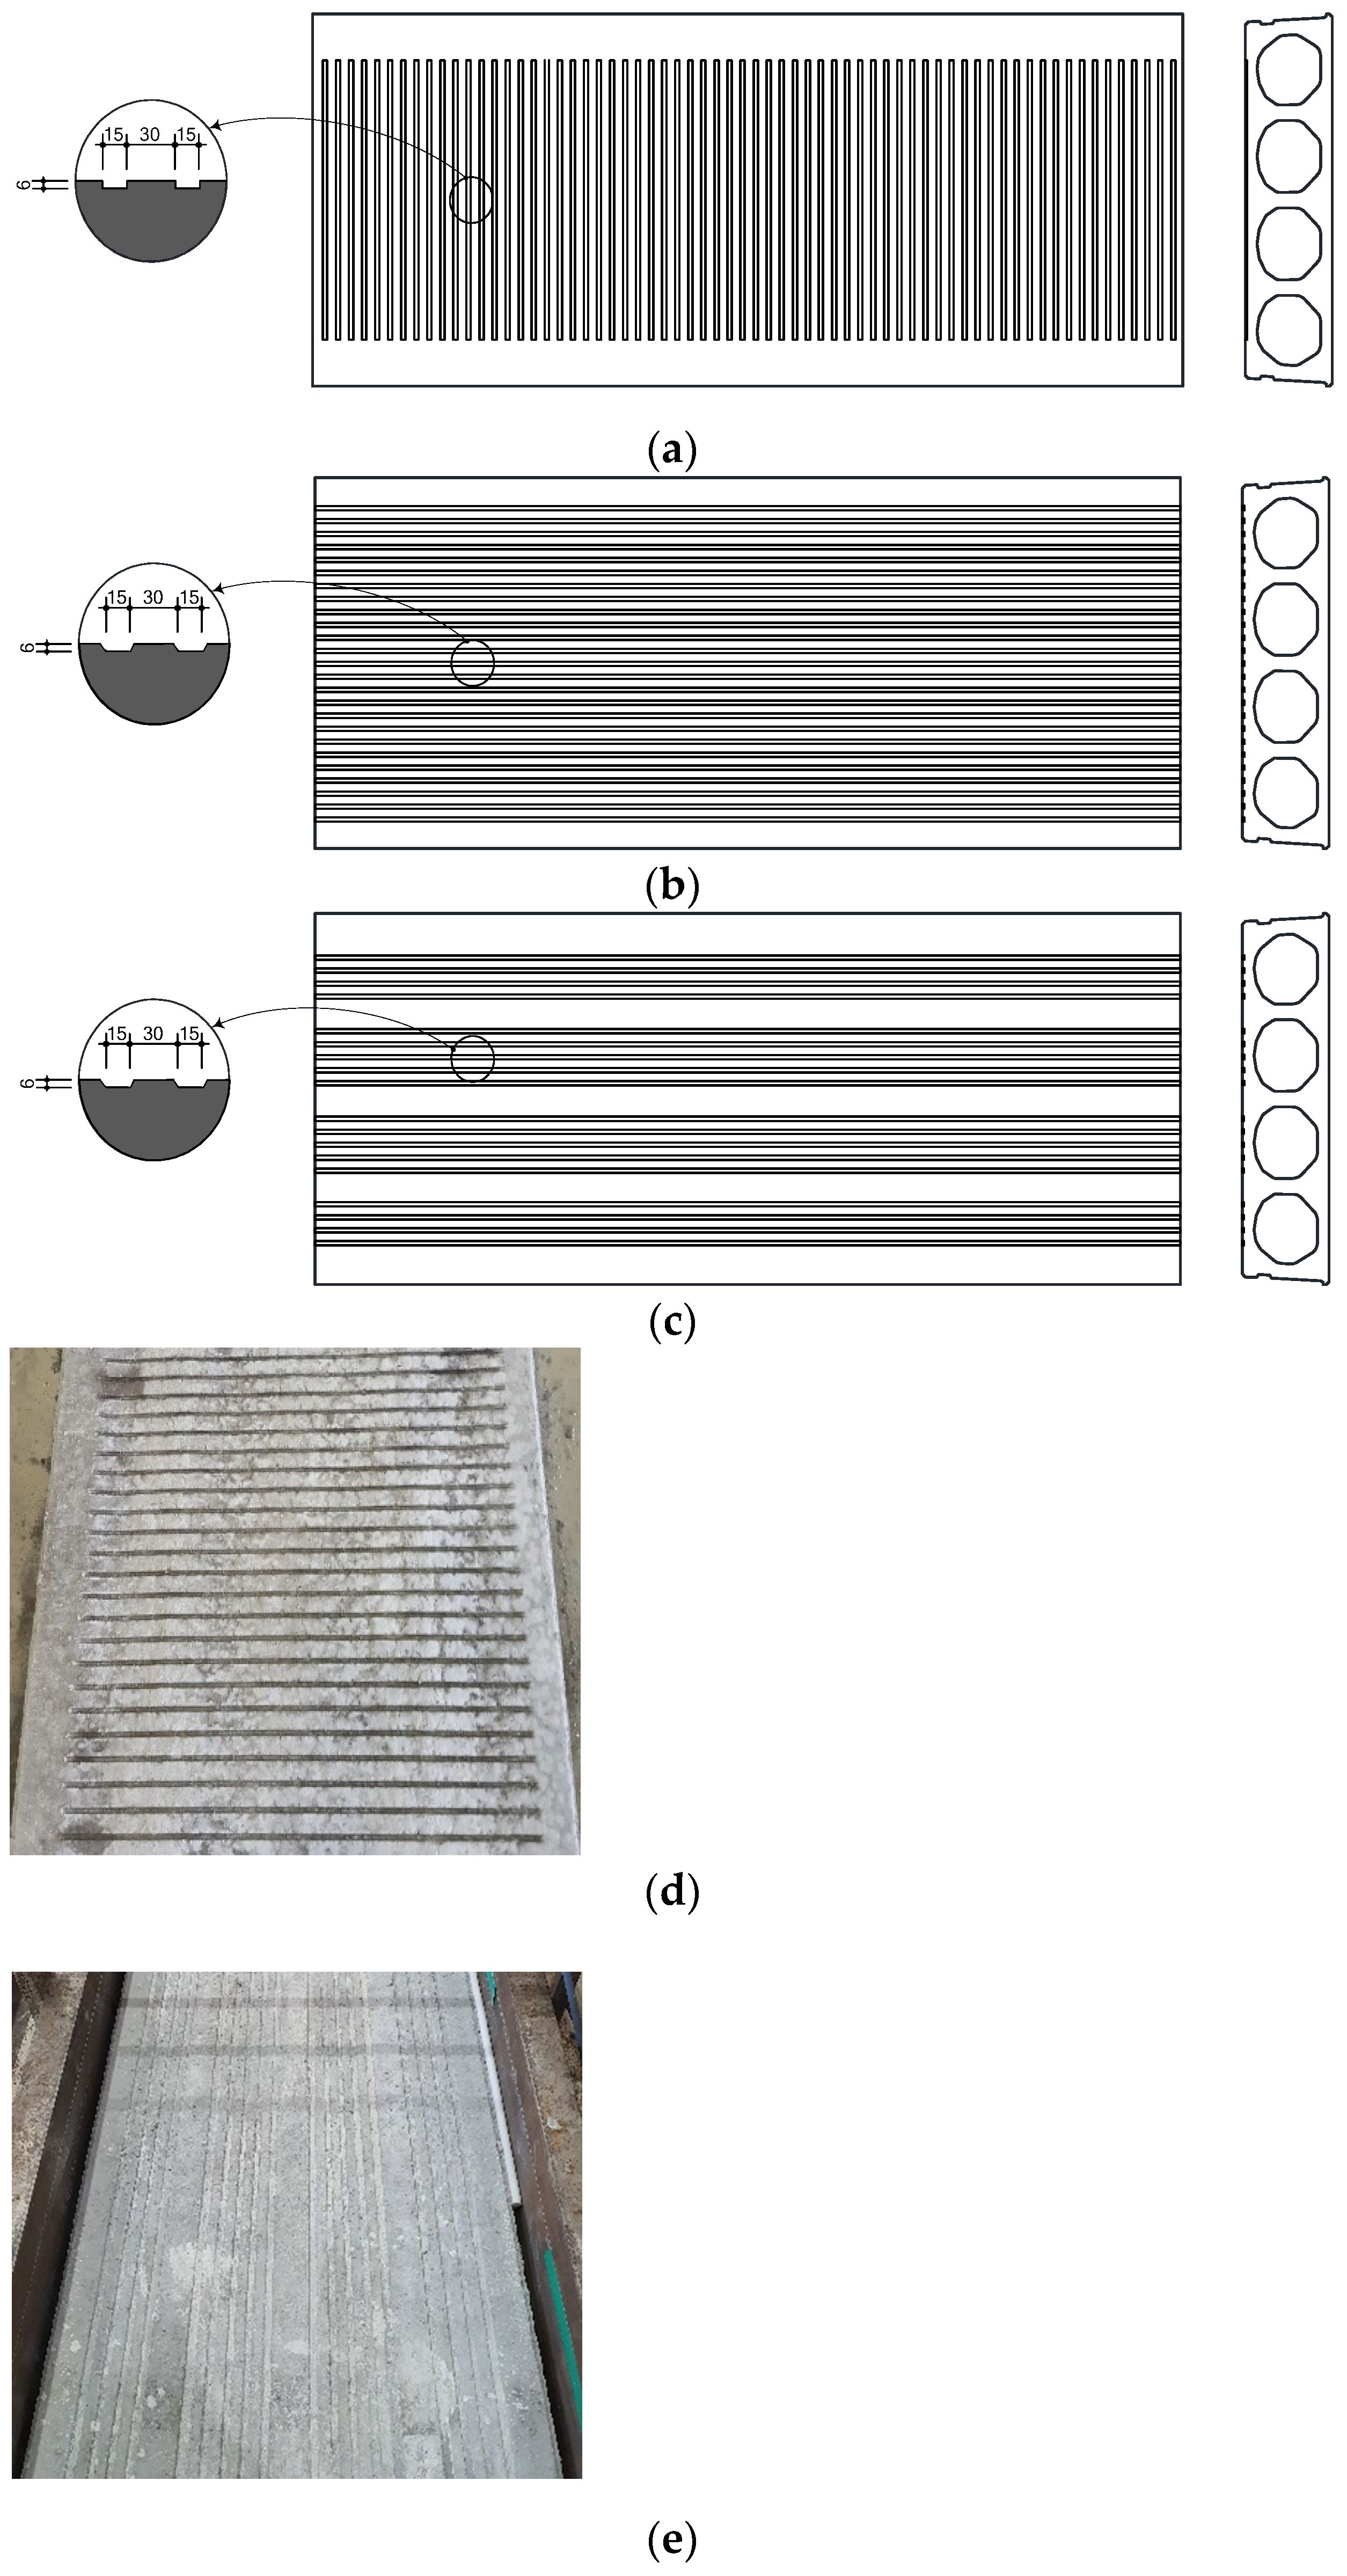
3.2. Specimens
3.3. Loading and Measurement Methods
4. Experimental Results and Analysis
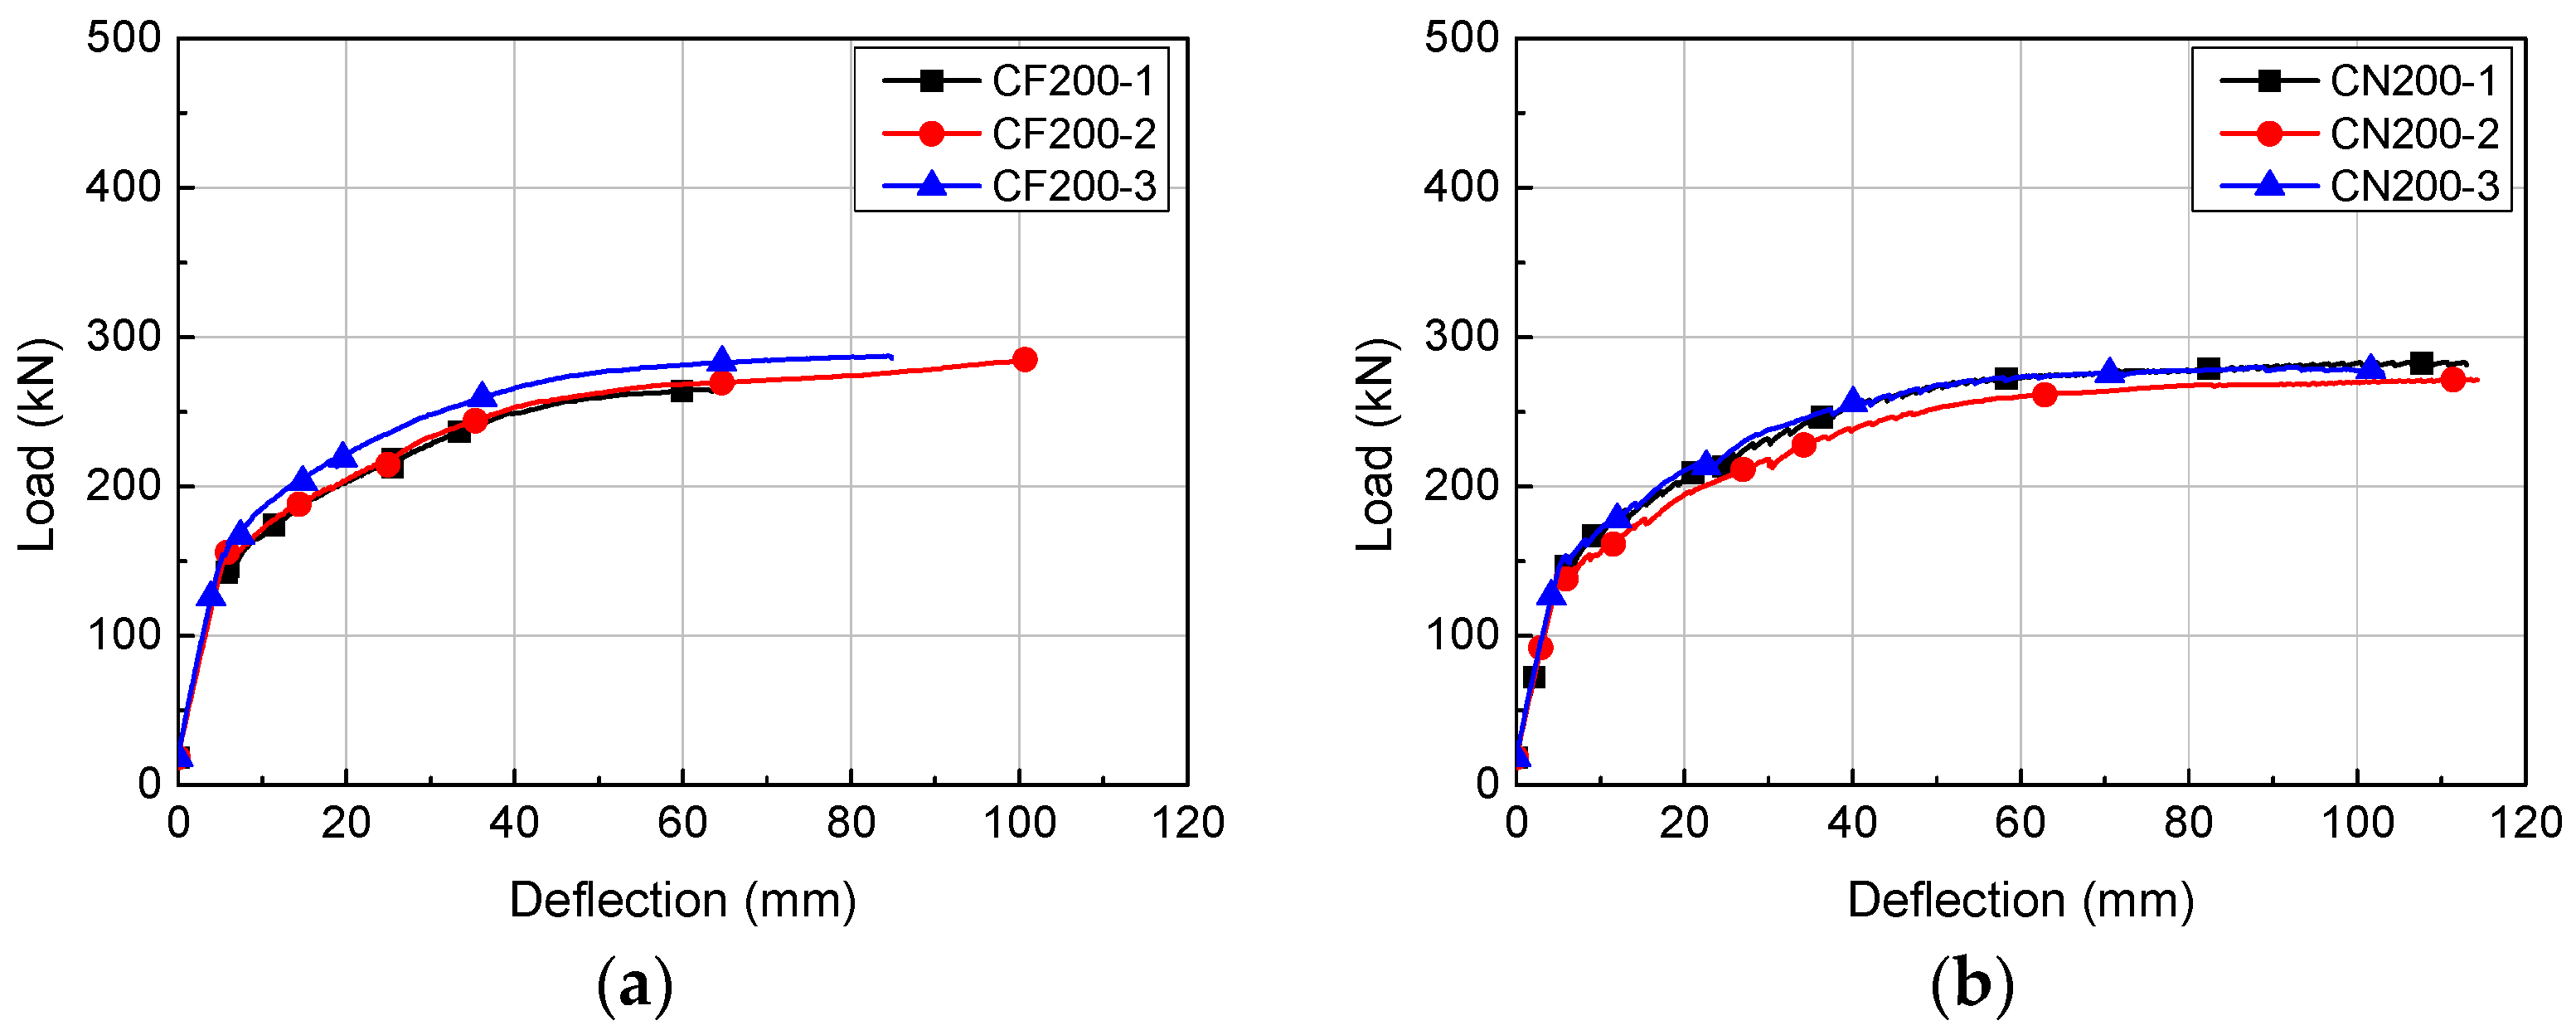
4.1. Load-Deflection Relationship
4.2. Cracking Patterns
4.3. Flexural Strength
4.4. Horizontal Shear Strength Review
5. Conclusions
- The HCS with topping concrete exhibited ductile flexural behavior up to the peak load regardless of the cross-sectional height and direction of interface roughness. For the H200 series and H320 series, specimens with interface roughness applied in the member length direction regardless of interface roughness area had deformation higher by about 11–27% at peak load than specimens with interface roughness applied in the width (horizontal) direction. As such, the peak deflection of the HCS with topping concrete can be improved by applying interface roughness in the length direction of members and increasing the roughness area.
- Comparing the crack moment and flexural strength of the HCS with topping concrete to predictions based on KCI 2017 and ACI 318-19, the experimental-to-predicted ratios averaged 0.91−1.11 for crack moment and 0.98-1.08 for flexural strength. The predictions were fairly accurate for HCS with topping concrete, regardless of the cross-sectional height and interface roughness. Moreover, the flexural strength values obtained from experiments were higher than the crack moment values by 1.64−1.93 on average, thereby satisfying the requirement of flexural moment having to be at least 1.2 times larger than crack moment in order to induce ductile failure, as specified in KCI 2017 and ACI 318-19.
- The flexural strength of HCS with topping concrete was about 1–7% higher on average in the CN series, which applied grooves in the length direction of the members, compared to the CF series in which interface roughness was applied in the width direction of the members. When interface roughness is applied in the length direction, the structural performance requirement can be met even if the number of grooves is reduced by about 28%.
- The horizontal shear strength acting at the interface during the flexural failure, obtained from the interfacial horizontal shear force of HCS with topping concrete, was 1.04 times larger than the horizontal shear strength proposed in the design codes (except EC 2), such as KCI 2017, ACI 318-19, and the PCI Design Handbook. All specimens avoided horizontal shear failure before flexural failure and satisfied the flexural strength requirement. The required horizontal shear strength for composite connections specified in EC 2 is also presumed to have been satisfied, thus satisfying the horizontal shear strength requirement at the interface for composite connections. Further research should be conducted using diverse variables to achieve outstanding structural performance even with interface roughness applied in the lengthwise direction. A more rational method of evaluating horizontal shear strength should be developed, as well.
Author Contributions
Funding
Institutional Review Board Statement
Informed Consent Statement
Data Availability Statement
Acknowledgments
Conflicts of Interest
References
- Becker, R.J.; Buettner, D.R. Shear tests of extruded hollow-core slabs. PCI J. 1985, 30, 40–54. [Google Scholar] [CrossRef]
- Hawkins, N.M.; Ghosh, S.K. Shear strength of hollow-core slabs. PCI J. 2006, 51, 110–114. [Google Scholar]
- Mones, R.M.; Breña, S.F. Hollow-core slabs with cast-in-place concrete toppings: A study of interfacial shear strength. PCI J. 2013, 58, 124–141. [Google Scholar] [CrossRef]
- Pajari, M. Web shear failure in prestressed hollow core slabs. J. Struct. Eng. 2009, 42, 83–104. [Google Scholar]
- Palmer, K.D.; Schultz, A.E. Factors affecting web-shear capacity of deep hollow-core units. PCI J. 2010, 55, 123–146. [Google Scholar] [CrossRef]
- Palmer, K.D.; Schultz, A.E. Experimental investigation of the web-shear strength of deep hollow-core units. PCI J. 2011, 56, 83–104. [Google Scholar] [CrossRef]
- Lee, Y.J.; Kim, H.G.; Kim, M.J.; Kim, D.H.; Kim, K.H. Shear performance for prestressed concrete hollow core slabs. Appl. Sci. 2020, 10, 1636. [Google Scholar] [CrossRef]
- Im, J.H.; Park, M.K.; Lee, D.H.; Seo, S.Y.; Kim, K.S. Evaluation of horizontal shear strength of prestressed hollow-core slabs with cast-in-place topping concrete. J. Korea Concr. Inst. 2014, 26, 741–749. [Google Scholar] [CrossRef]
- Lee, Y.J.; Kim, H.K.; Kim, M.J.; Lee, J.S.; Kim, K.H. Evaluation of structural performance for prestressed concrete hollow core slabs. J. Korea Concr. Inst. 2019, 31, 505–512. [Google Scholar] [CrossRef]
- Jang, H.J.; Ryu, J.H.; Kim, S.M.; Ju, Y.K.; Kim, S.D. An evaluation on the flexural capacity of void slabs with prestressed half PC. J. Archit. Inst. Korea 2012, 28, 11–18. [Google Scholar]
- Hong, G.H.; Park, H.G.; Hwang, J.S. A study on the performance of heavy-weight floor impact noise of hollow core slabs. J. Archit. Inst. Korea 2008, 24, 355–362. [Google Scholar]
- Brunesi, E.; Bolognini, D.; Nascimbene, R. Evaluation of the shear capacity of precast-prestressed hollow core slabs: Numerical and experimental comparisons. Mater. Struct. 2015, 48, 1503–1521. [Google Scholar] [CrossRef]
- El-Sayed, A.K.; Al-Negheimish, A.I.; Alhozaimy, A.M. Web shear resistance of prestressed precast deep hollow core slabs. ACI Struct. J. 2019, 116, 139–150. [Google Scholar]
- Park, M.K.; Lee, D.H.; Han, S.J.; Kim, K.S. Web-shear capacity of thick precast prestressed hollow-core slab units produced by extrusion method. Int. J. Concr. Struct. Mater. 2019, 13, 19–32. [Google Scholar] [CrossRef]
- Ruggieri, S.; Porco, F.; Uva, G. A practical approach for estimating the floor deformability in existing RC buildings: Evaluation of the effects in the structural response and seismic fragility. Bull. Earthquake Eng. 2020, 18, 2083–2113. [Google Scholar] [CrossRef]
- Ruggieri, S.; Porco, F.; Uva, G. A numerical procedure for modeling the floor deformability in seismic analysis of existing RC buildings. J. Build. Eng. 2018, 19, 273–284. [Google Scholar] [CrossRef]
- Michelini, E.; Bernardi, P.; Cerioni, R.; Belletti, B. Experimental and numerical assessment of flexural and shear behavior of precast prestressed deep hollow-core slabs. Int. J. Concr. Struct. Mater. 2020, 14, 1–17. [Google Scholar] [CrossRef]
- Girhammar, U.A.; Pajari, M. Tests and analysis on shear strength of composite slabs of hollow core units and concrete topping. Const. Build. Mater. 2008, 22, 1708–1722. [Google Scholar] [CrossRef]
- Tassios, T.P.; Vintzēleou, E.N. Concrete-to-concrete friction. J. Struct. Eng. 1987, 113, 832–849. [Google Scholar] [CrossRef]
- Gohnert, M. Proposed theory to determine the horizontal shear between composite precast and in situ concrete. Cem. Concr. Compos. 2000, 22, 469–476. [Google Scholar] [CrossRef]
- Beushausen, H.D. Shear strength unreinforced interfaces: Precast concrete elements and in situ topping. Betonwerk und Fertigteiltechnik 2001, 67, 64–69. [Google Scholar]
- Santos, P.M.; Júlio, E.N. A state-of-the-art review on shear-friction. Eng. Struct. 2012, 45, 435–448. [Google Scholar] [CrossRef]
- Korea Concrete Institute. KCI Model. Code 2017; Kimoondang Publishing Company: Seoul, Korea, 2017. (In Korean) [Google Scholar]
- ACI Committee 318. Building Code Requirements for Structural Concrete (ACI 318-19) and Commentary (ACI 318R-19); American Concrete Institute (ACI): Farmington Hills, MI, USA, 2019. [Google Scholar]
- Precast/Prestressed Concrete Institute. PCI Manual for the Design of Hollow Core Slabs, 2nd ed.; PCI Hollow Core Slab Producers Committee: Chicago, IL, USA, 1988. [Google Scholar]
- British Standard Institution. Eurocode 2: Design of Concrete Structures (BS EN 1992-1-1:2004); British Standard Institution (BSI): London, UK, 2004. [Google Scholar]
- ASTM International. Standard Practice for Making and Curing Concrete Test. Specimens in the Laboratory (C192/C192M-19); American Society for Testing Materials: West Conshohocken, PA, USA, 2020. [Google Scholar]
- Korean Standards Association. Standard Test. Method for Making and Curing Concrete Specimens (KS F 2403); Korean Standards Association: Seoul, Korea, 2019.
- ASTM International. Standard Specification for Low-Relaxation, Seven-Wire Steel Strand for Prestressed Concrete (A416/A416M-18); American Society for Testing Materials: West Conshohocken, PA, USA, 2019. [Google Scholar]
- Korean Standards Association. Uncoated Stress-Relieved Steel Wires and Strands for Prestressed Concrete (KS D 7002); Korean Standards Association: Seoul, Korea, 2019.


| Surface Type | Compressive Strength of Topping Concrete (MPa) | ||
|---|---|---|---|
| 25 | 40 | ||
| Very smooth | A surface cast against steel, plastic, or specially prepared wooden molds | 0.30 | 0.41 |
| Smooth | A slipformed or extruded surface, or a free surface left without further treatment after vibration | 0.42 | 0.57 |
| Rough | A surface with at least 3 mm roughness at about 40 mm spacing, achieved by raking, exposing of aggregate, or other methods giving an equivalent behavior | 0.54 | 0.74 |
| Indented | A surface with indentations complying with Figure 1 | 0.60 | 0.82 |
| Specimens | f’c (MPa) | Size (mm) | Prestressing Strand | a/d | H (mm) | N | ||||
|---|---|---|---|---|---|---|---|---|---|---|
| HCS | Topping | h | b | l | Bottom | Top | ||||
| CF200 | 56.6 | 38.9 | 200 | 1200 | 5000 | 7-Φ12.7 | 2-Φ9.5 | 8.47 | 80 | 3 |
| CN200 | 3 | |||||||||
| CF320 | 62.6 | 33.7 | 320 | 10-Φ12.7 | 2-Φ9.5 | 5.19 4.65 * | 120 | 3 | ||
| CC320 | 61.4 | 3 | ||||||||
| CN320 | 51.8 | 32.1 | 3 | |||||||
| CF400 | 51.7 | 35.9 | 400 | 7000 | 10-Φ12.7 | 3-Φ12.7 | 6.06 | 3 | ||
| CN400 | 3 | |||||||||
| Specimens | f’c (MPa) | H (mm) | Experimental Results | Analytical Results (KCI 2017&ACI 318-19) | Exp. /Ana. | ||||||
|---|---|---|---|---|---|---|---|---|---|---|---|
| Pcr (kN) | δcr (mm) | Ppeak (kN) | δpeak (mm) | Mcr (kN∙m) | Mn (kN∙m) | Mcr, exp /Mcr, ana | Mpeak, exp /Mn, ana | ||||
| CF200 | 1 | f’c,HCS = 56.6 f’c,T = 38.9 | 71.8 | 148.7 | 5.39 | 264.7 | 61.08 | 161.1 | 267.7 | 0.96 | 1.03 |
| 2 | 78.3 | 155.7 | 5.80 | 284.7 | 100.75 | 166.3 | 275.9 | 0.97 | 1.07 | ||
| 3 | 76.3 | 154.2 | 5.36 | 287.2 | 83.87 | 164.7 | 273.4 | 0.97 | 1.09 | ||
| Mean | 152.9 | 5.52 | 278.9 | 81.90 | 164.0 | 272.3 | 0.97 | 1.06 | |||
| CN200 | 1 | f’c,HCS = 56.6 f’c,T = 38.9 | 77.3 | 147.2 | 5.67 | 283.2 | 108.58 | 165.5 | 274.7 | 0.92 | 1.07 |
| 2 | 75.2 | 140.7 | 5.60 | 289.2 | 115.77 | 163.8 | 272.0 | 0.89 | 1.10 | ||
| 3 | 80.3 | 153.2 | 5.83 | 279.2 | 86.77 | 167.9 | 278.5 | 0.95 | 1.04 | ||
| Mean | 147.0 | 5.70 | 283.9 | 103.71 | 165.7 | 275.1 | 0.92 | 1.07 | |||
| CF320 | 1 | f’c,HCS = 62.6 f’c,T = 33.7 | 119.5 | 335.0 | 5.30 | 585.5 | 24.02 | 407.3 | 634.0 | 0.85 | 0.96 |
| 3 | 121.0 | 348.0 | 5.16 | 579.5 | 22.99 | 409.3 | 636.8 | 0.88 | 0.94 | ||
| 2 | 116.0 | 381.5 | 5.01 | 622.5 | 26.68 | 402.7 | 627.7 | 0.98 | 1.03 | ||
| Mean | 354.8 | 5.16 | 595.8 | 24.56 | 406.4 | 632.8 | 0.91 | 0.98 | |||
| CC320 | 1 | f’c,HCS = 61.4 f’c,T = 33.7 | 120.0 | 441.0 | 5.32 | 668.0 | 27.22 | 407.1 | 635.0 | 0.99 | 0.96 |
| 2 | 94.3 | 353.0 | 5.19 | 585.5 | 28.02 | 373.4 | 588.1 | 0.98 | 1.03 | ||
| 3 | 108.0 | 353.5 | 5.20 | 640.0 | 36.41 | 391.2 | 613.1 | 0.94 | 1.08 | ||
| Mean | 382.5 | 5.24 | 631.2 | 30.55 | 390.6 | 612.1 | 0.97 | 1.03 | |||
| CN320 | 1 | f’c,HCS = 51.8 f’c,T = 32.1 | 120.3 | 361.0 | 4.29 | 633.5 | 27.51 | 399.3 | 632.1 | 0.94 | 1.04 |
| 2 | 116.0 | 358.0 | 4.01 | 607.0 | 23.15 | 393.7 | 624.2 | 0.94 | 1.01 | ||
| 3 | 118.8 | 370.5 | 4.08 | 660.0 | 30.94 | 397.4 | 629.3 | 0.97 | 1.09 | ||
| Mean | 363.2 | 4.13 | 633.5 | 27.20 | 396.8 | 628.5 | 0.95 | 1.05 | |||
| CF400 | 1 | f’c,HCS = 51.7 f’c,T = 35.9 | 93.2 | 301.7 | 7.27 | 501.3 | 50.74 | 433.1 | 727.2 | 1.04 | 1.03 |
| 2 | 98.0 | 298.8 | 5.86 | 532.0 | 60.34 | 438.6 | 735.9 | 1.02 | 1.08 | ||
| 3 | 96.5 | 285.9 | 5.70 | 520.8 | 70.40 | 436.9 | 733.2 | 0.98 | 1.07 | ||
| Mean | 295.5 | 6.28 | 518.0 | 60.49 | 436.2 | 732.1 | 1.02 | 1.06 | |||
| CN400 | 1 | f’c,HCS = 51.7 f’c,T = 35.9 | 105.8 | 332.4 | 6.12 | 537.4 | 58.44 | 447.5 | 750.2 | 1.11 | 1.07 |
| 2 * | 112.0 | - | - | - | - | - | - | - | - | ||
| 3 | 104.5 | 326.2 | 6.27 | 542.4 | 57.82 | 446.0 | 747.8 | 1.10 | 1.09 | ||
| Mean | 329.3 | 6.20 | 539.9 | 58.13 | 446.8 | 749.0 | 1.11 | 1.08 | |||
| Specimens | f’c (MPa) | Joint Surface | Experimental Results | Analytical Results | Exp./Ana. | |||||
|---|---|---|---|---|---|---|---|---|---|---|
| bv (mm) | lvh (mm) | Fh (kN) | υh, exp (MPa) | υnh, KCI (υnh, ACI&PCI) (MPa) | υnh, EC 2 (MPa) | υh, exp/υnh, KCI (υnh, ACI&PCI) | υh, exp/υnh, EC 2 | |||
| CF200 | 1 | f’c,HCS = 56.6 f’c,T = 38.9 | 1200 | 2075 | 1452 | 0.583 | 0.56 (0.55) | 0.72 | 1.04(1.06) | 0.81 |
| 2 | 1456 | 0.585 | 1.04(1.06) | 0.81 | ||||||
| 3 | 1456 | 0.584 | 1.04(1.06) | 0.81 | ||||||
| Mean | 1455 | 0.584 | - | - | 1.04(1.06) | 0.81 | ||||
| CN200 | 1 | f’c,HCS = 56.6 f’c,T = 38.9 | 1200 | 2075 | 1456 | 0.585 | 0.56 (0.55) | 0.80 | 1.04(1.06) | 0.73 |
| 2 | 1455 | 0.584 | 1.04(1.06) | 0.73 | ||||||
| 3 | 1457 | 0.585 | 1.05(1.06) | 0.73 | ||||||
| Mean | 1456 | 0.585 | - | - | 1.04(1.06) | 0.73 | ||||
| CF320 | 1 | f’c,HCS = 62.6 f’c,T = 33.7 | 1200 | 2075 | 1993 | 0.800 | 0.56 (0.55) | 0.66 | 1.43(1.45) | 1.21 |
| 3 | 1994 | 0.801 | 1.43(1.46) | 1.21 | ||||||
| 2 | 1990 | 0.799 | 1.43(1.45) | 1.21 | ||||||
| Mean | 1992 | 0.800 | - | - | 1.43(1.45) | 1.21 | ||||
| CC320 | 1 | f’c,HCS = 61.4 f’c,T = 33.7 | 1200 | 1825 | 1993 | 0.910 | 0.56 (0.55) | 0.73 | 1.63(1.65) | 1.25 |
| 2 | 2075 | 1969 | 0.791 | 1.41(1.44) | 1.08 | |||||
| 3 | 1982 | 0.796 | 1.42(1.45) | 1.09 | ||||||
| Mean | 1982 | 0.832 | - | - | 1.49(1.51) | 1.14 | ||||
| CN320 | 1 | f’c,HCS = 51.8 f’c,T = 32.1 | 1200 | 2075 | 1988 | 0.798 | 0.56 (0.55) | 0.71 | 1.43(1.45) | 1.12 |
| 2 | 1984 | 0.797 | 1.42(1.45) | 1.12 | ||||||
| 3 | 1987 | 0.798 | 1.42(1.45) | 1.12 | ||||||
| Mean | 1986 | 0.798 | - | - | 1.42(1.45) | 1.12 | ||||
| CF400 | 1 | f’c,HCS = 51.7 f’c,T = 35.9 | 1200 | 3000 | 2219 | 0.616 | 0.56 (0.55) | 0.69 | 1.10(1.12) | 0.89 |
| 2 | 2229 | 0.619 | 1.11(1.13) | 0.90 | ||||||
| 3 | 2226 | 0.618 | 1.10(1.12) | 0.90 | ||||||
| Mean | 2225 | 0.618 | - | - | 1.10(1.12) | 0.90 | ||||
| CN400 | 1 | f’c,HCS = 51.7 f’c,T = 35.9 | 1200 | 3000 | 2245 | 0.624 | 0.56 (0.55) | 0.76 | 1.11(1.13) | 0.82 |
| 2 * | - | - | - | - | ||||||
| 3 | 2242 | 0.623 | 1.11(1.13) | 0.82 | ||||||
| Mean | 2243 | 0.623 | - | - | 1.11(1.13) | 0.82 | ||||
Publisher’s Note: MDPI stays neutral with regard to jurisdictional claims in published maps and institutional affiliations. |
© 2021 by the authors. Licensee MDPI, Basel, Switzerland. This article is an open access article distributed under the terms and conditions of the Creative Commons Attribution (CC BY) license (https://creativecommons.org/licenses/by/4.0/).
Share and Cite
Lee, Y.-J.; Kim, H.-G.; Jeong, C.-Y.; Kim, D.-H.; Han, S.-P.; Kim, K.-H. Effect of Surface Roughness Characteristics on Structural Performance of Hollow Core Slabs. Materials 2021, 14, 2610. https://doi.org/10.3390/ma14102610
Lee Y-J, Kim H-G, Jeong C-Y, Kim D-H, Han S-P, Kim K-H. Effect of Surface Roughness Characteristics on Structural Performance of Hollow Core Slabs. Materials. 2021; 14(10):2610. https://doi.org/10.3390/ma14102610
Chicago/Turabian StyleLee, Yong-Jun, Hyeong-Gook Kim, Chan-Yu Jeong, Dong-Hwan Kim, Sang-Pil Han, and Kil-Hee Kim. 2021. "Effect of Surface Roughness Characteristics on Structural Performance of Hollow Core Slabs" Materials 14, no. 10: 2610. https://doi.org/10.3390/ma14102610
APA StyleLee, Y.-J., Kim, H.-G., Jeong, C.-Y., Kim, D.-H., Han, S.-P., & Kim, K.-H. (2021). Effect of Surface Roughness Characteristics on Structural Performance of Hollow Core Slabs. Materials, 14(10), 2610. https://doi.org/10.3390/ma14102610