Application of Spectroscopy in Additive Manufacturing


Abstract
1. Introduction
2. AM Techniques
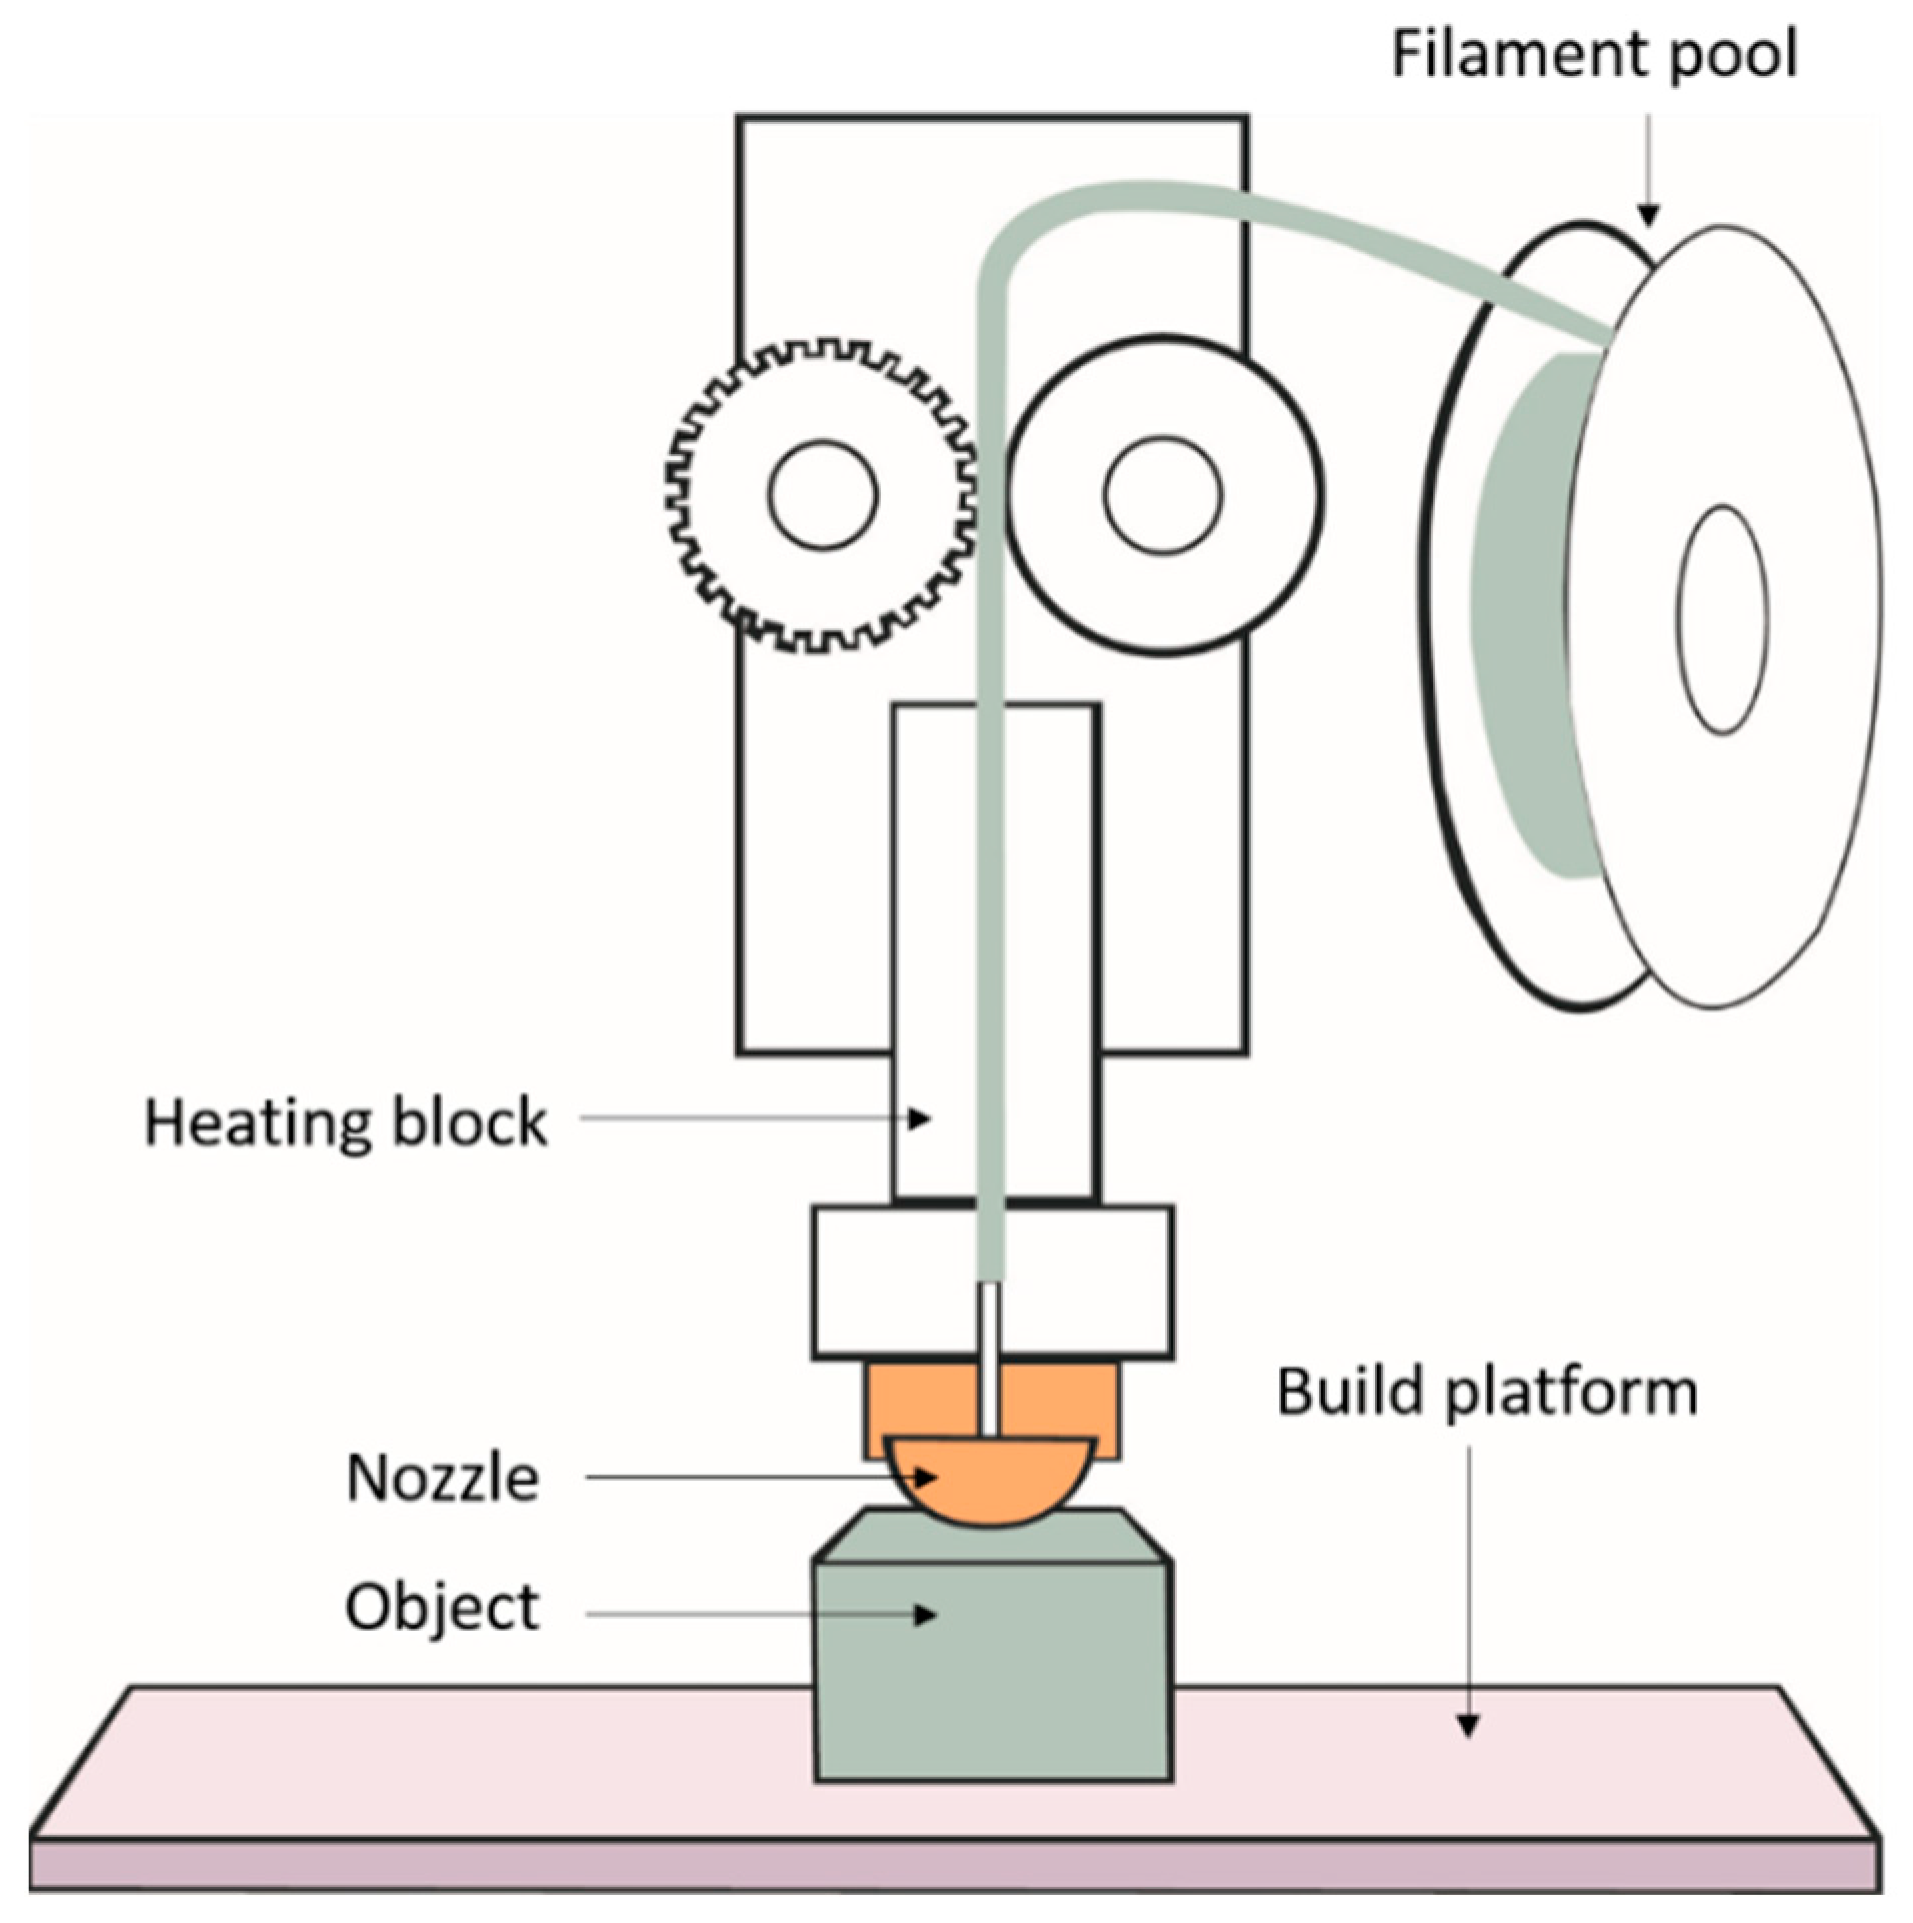
2.1. Fused Deposition Modelling (FDM)
2.2. Powder Bed Fusion
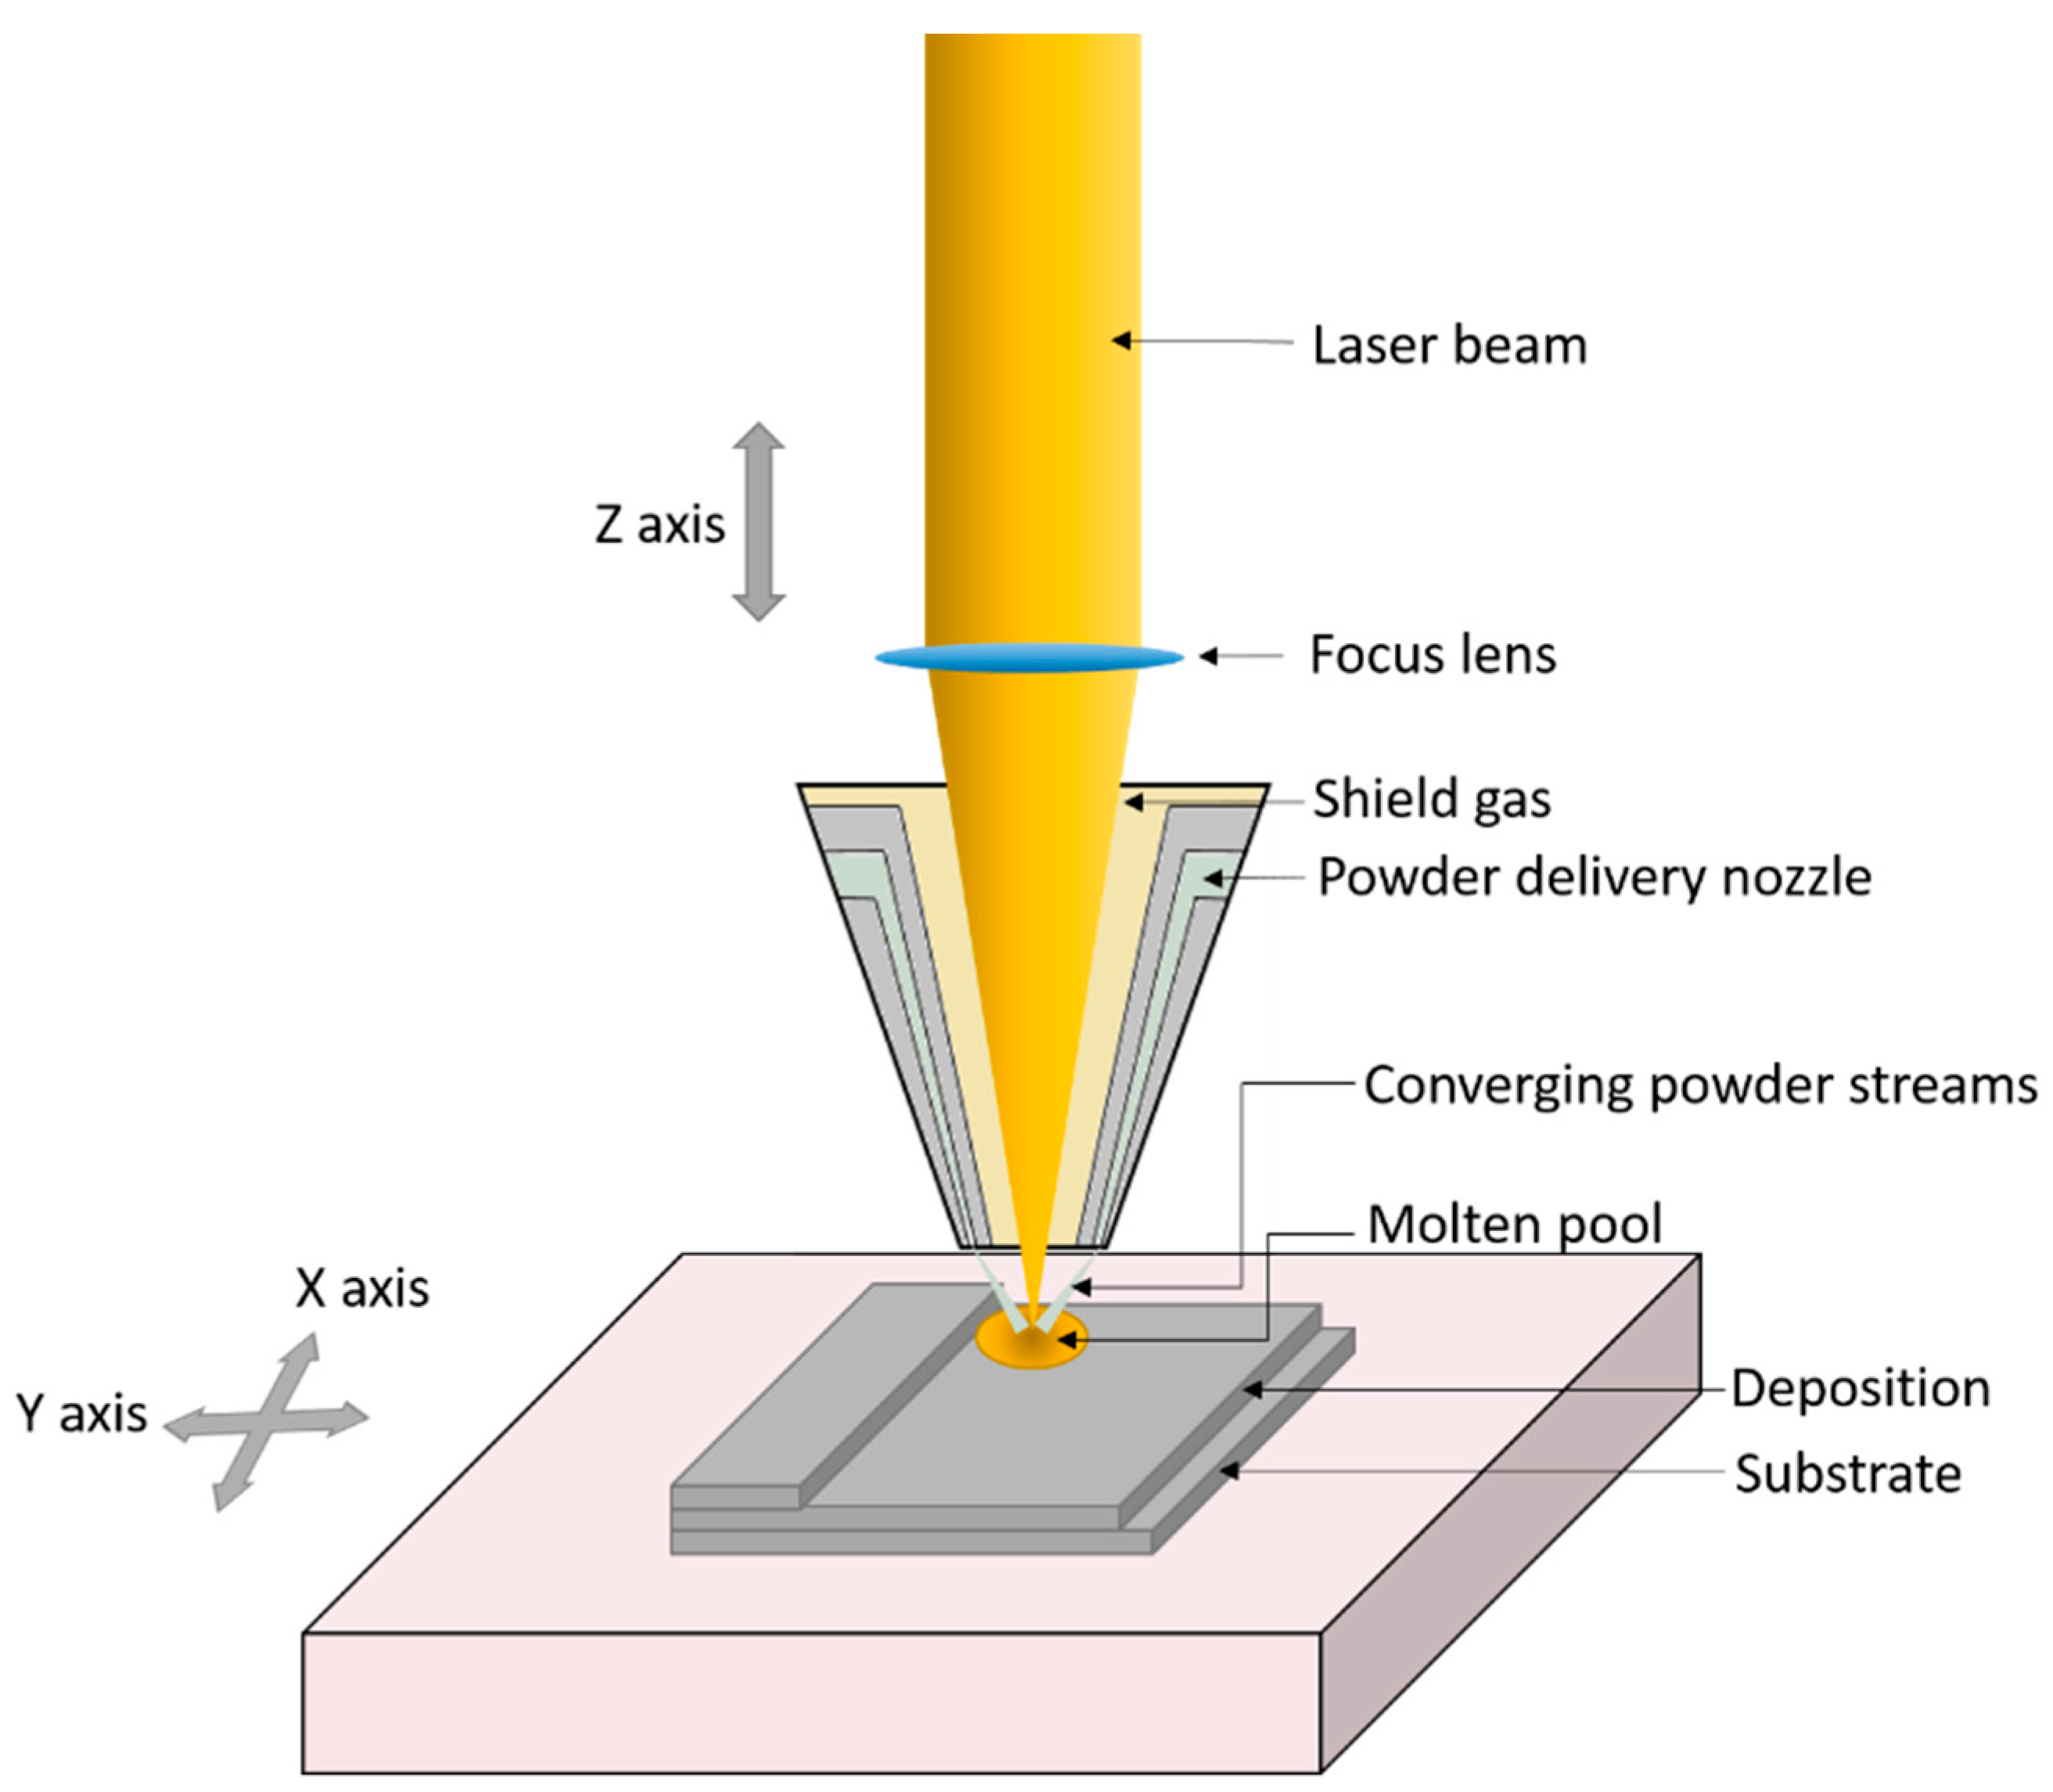
2.3. Laser Engineered Net Shaping (LENS)
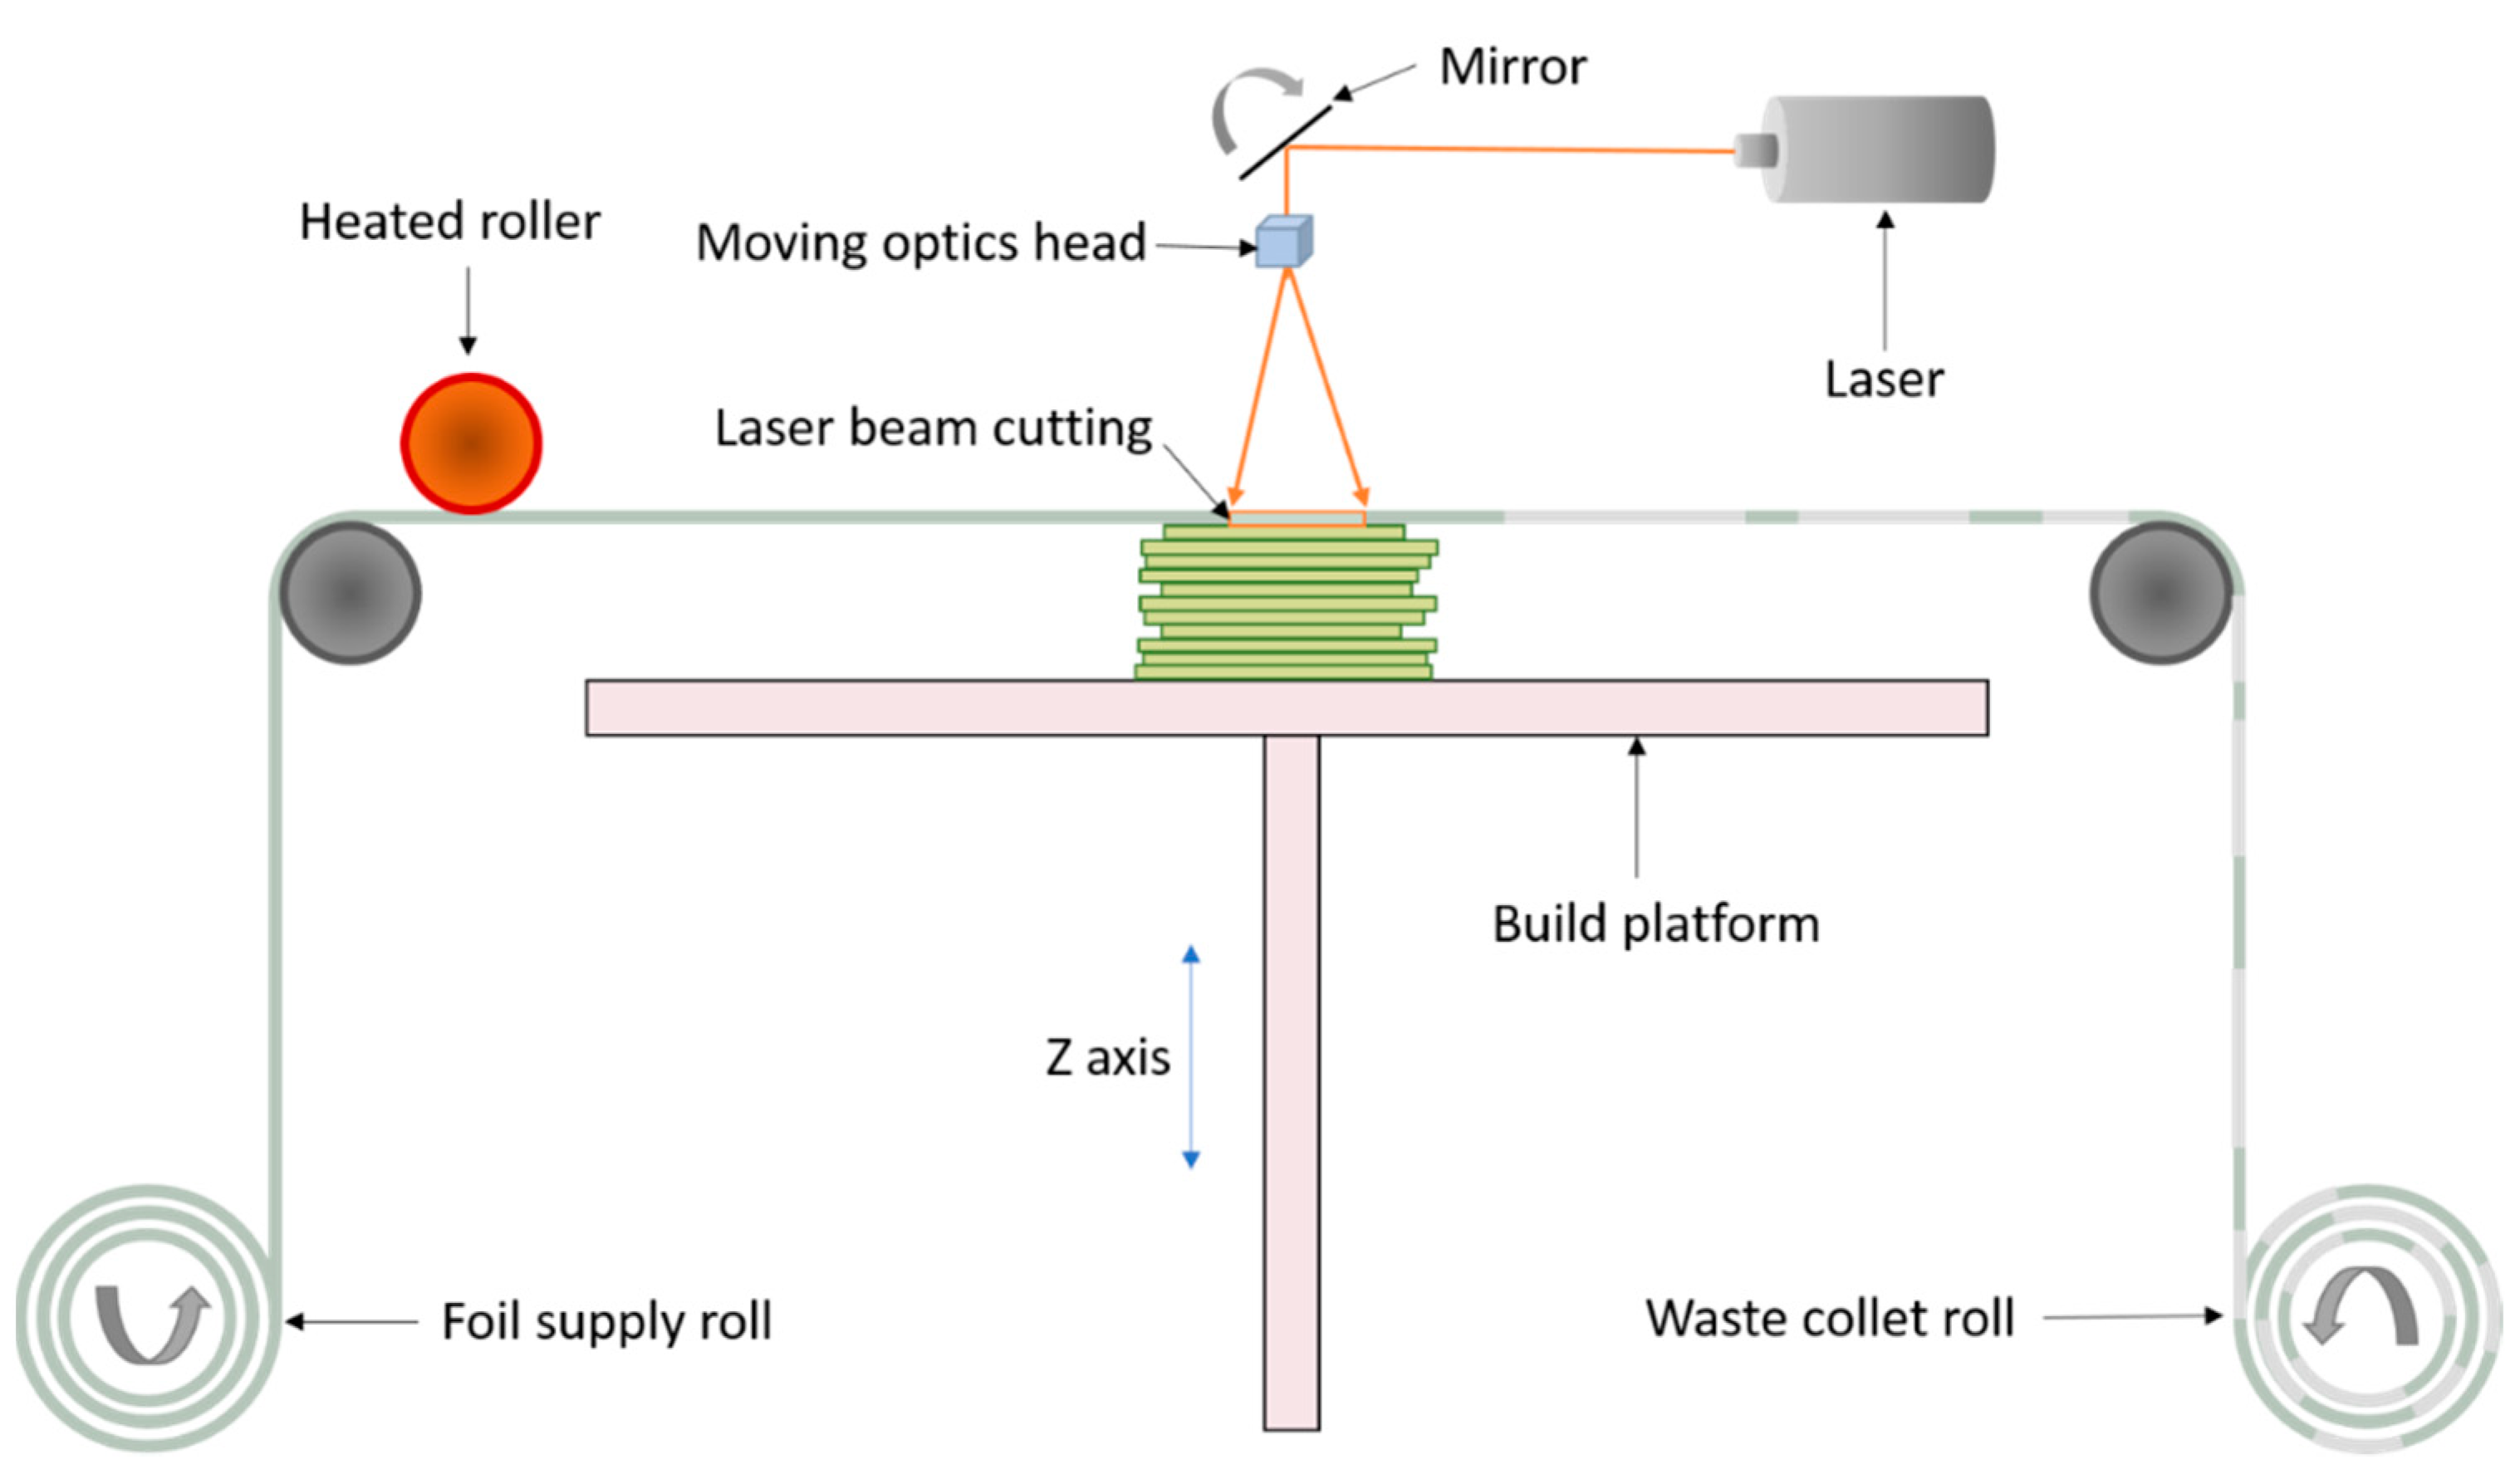
2.4. Laminated Object Manufacturing (LOM)
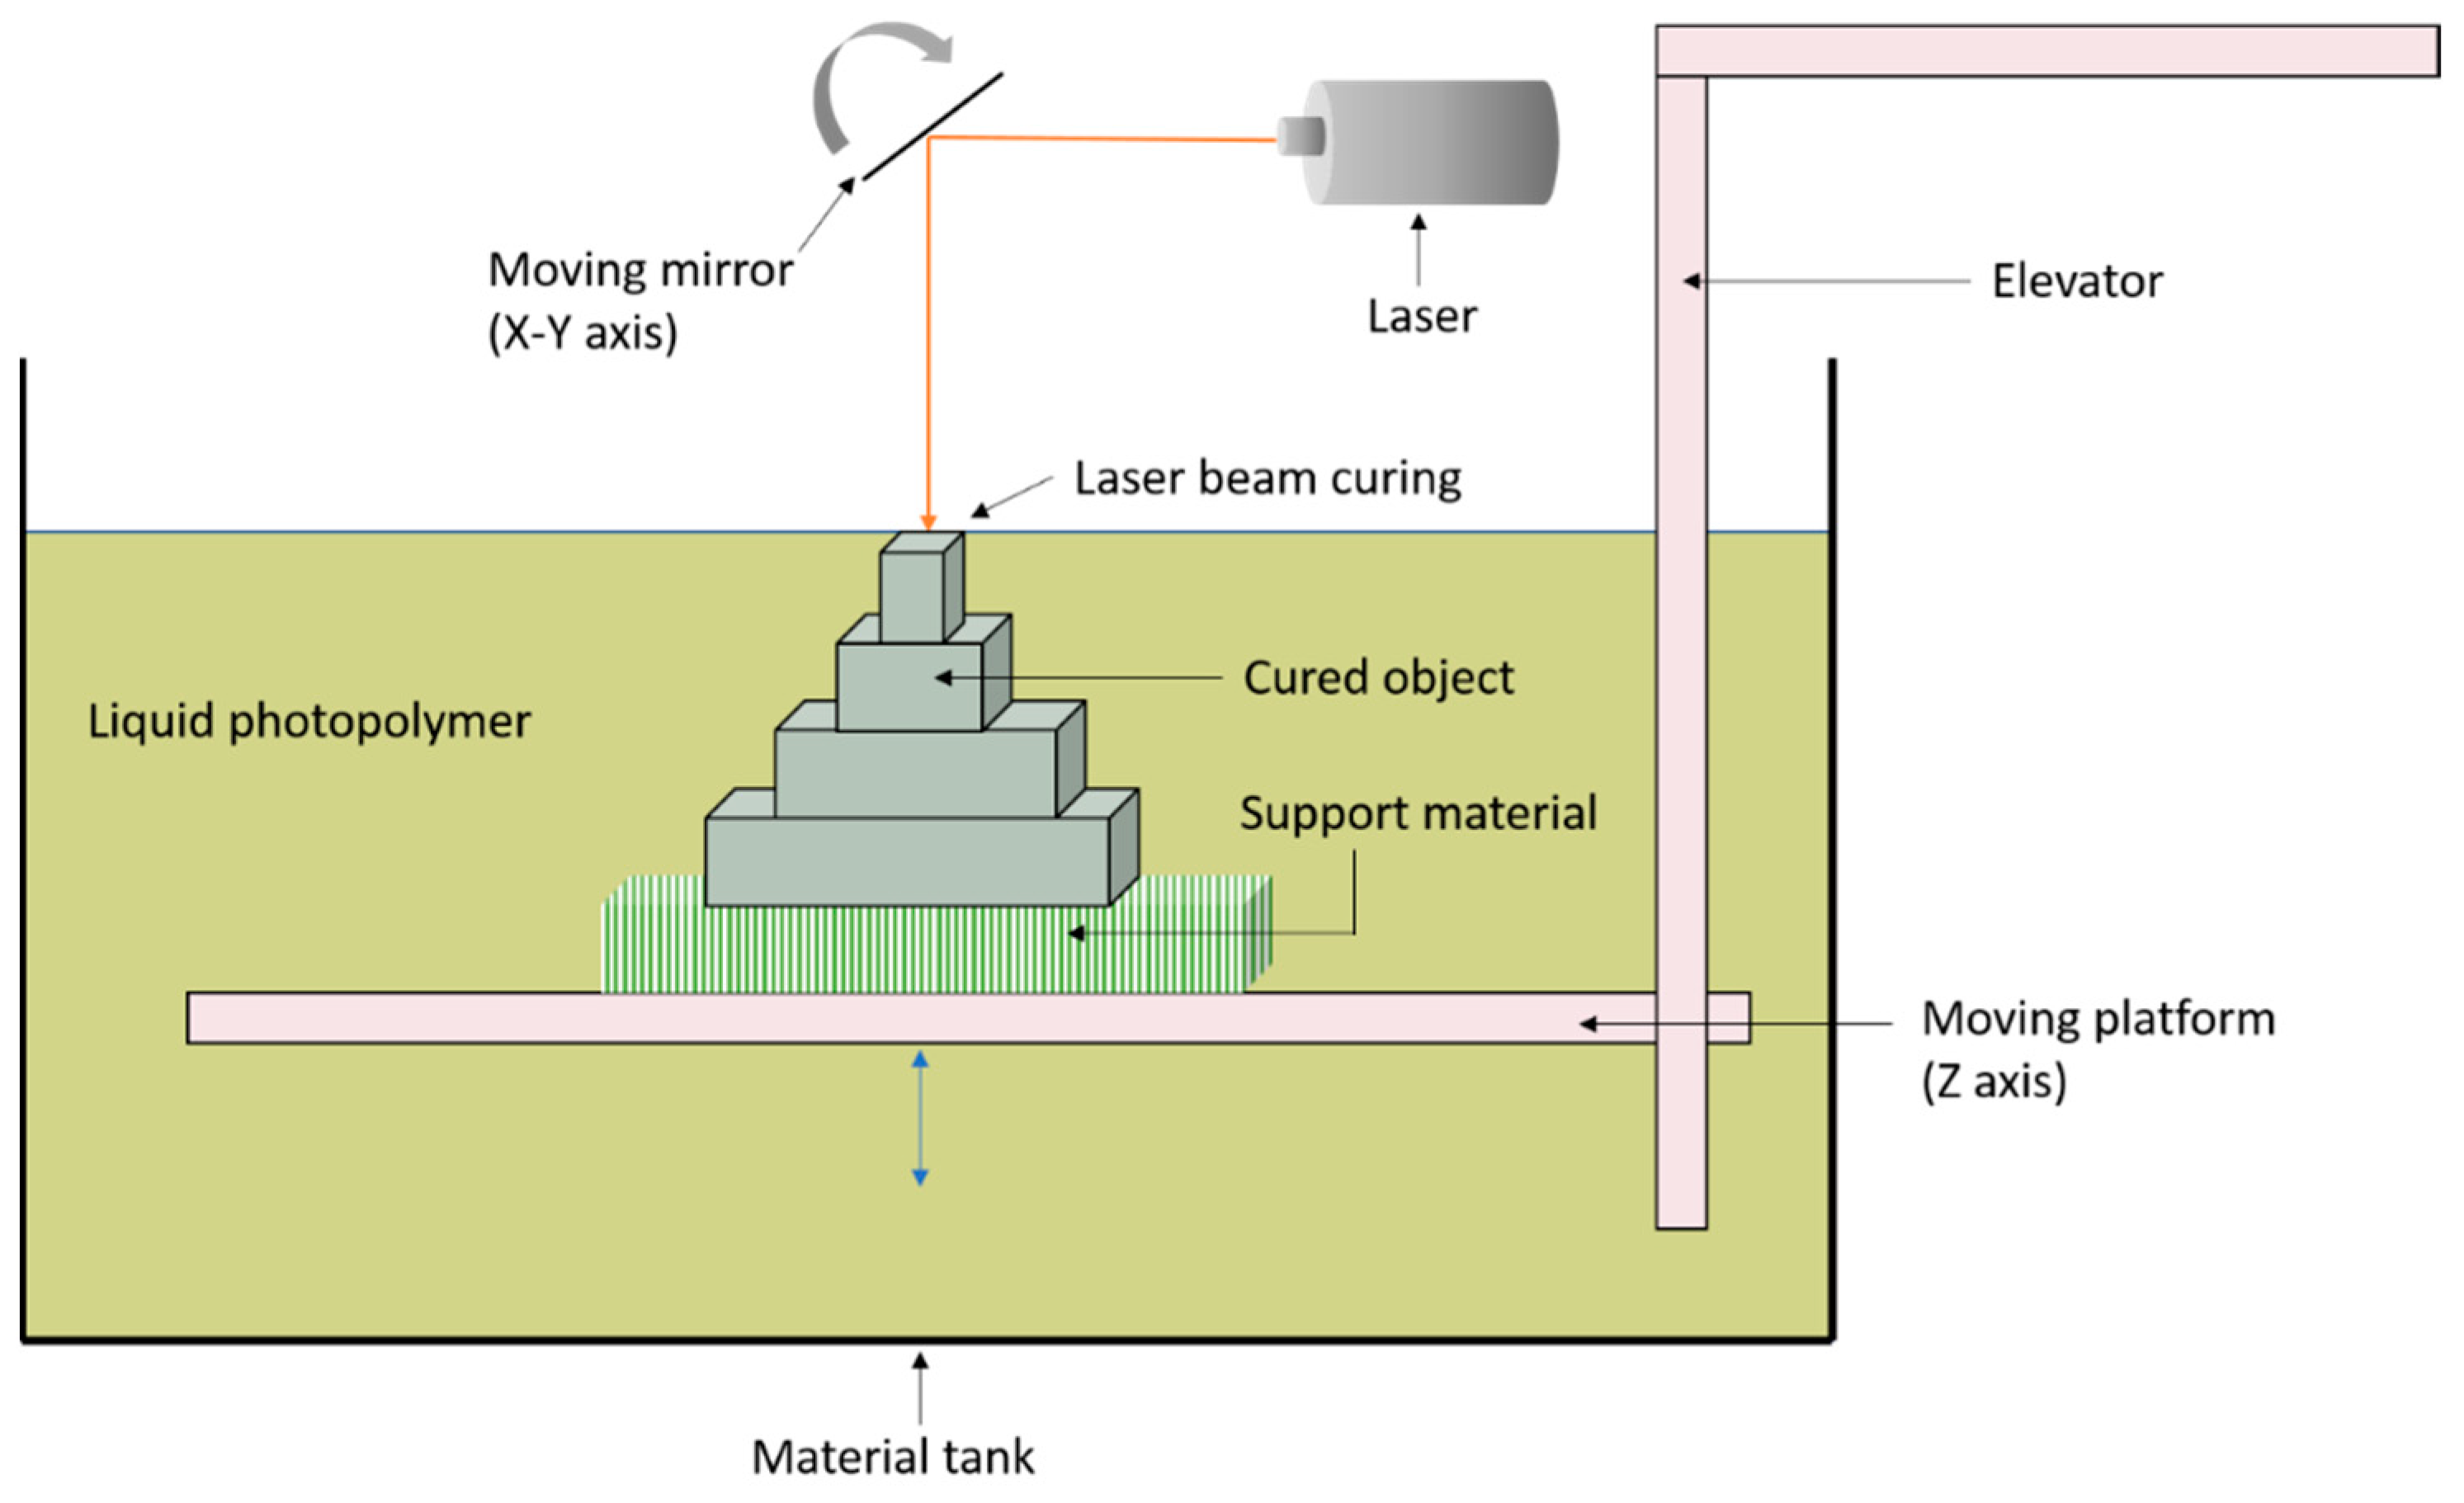
2.5. Stereolithography (SLA)
2.6. Inkjet Printing
3. Spectroscopy and Its Application in AM Techniques
3.1. Spectroscopic Characterisations
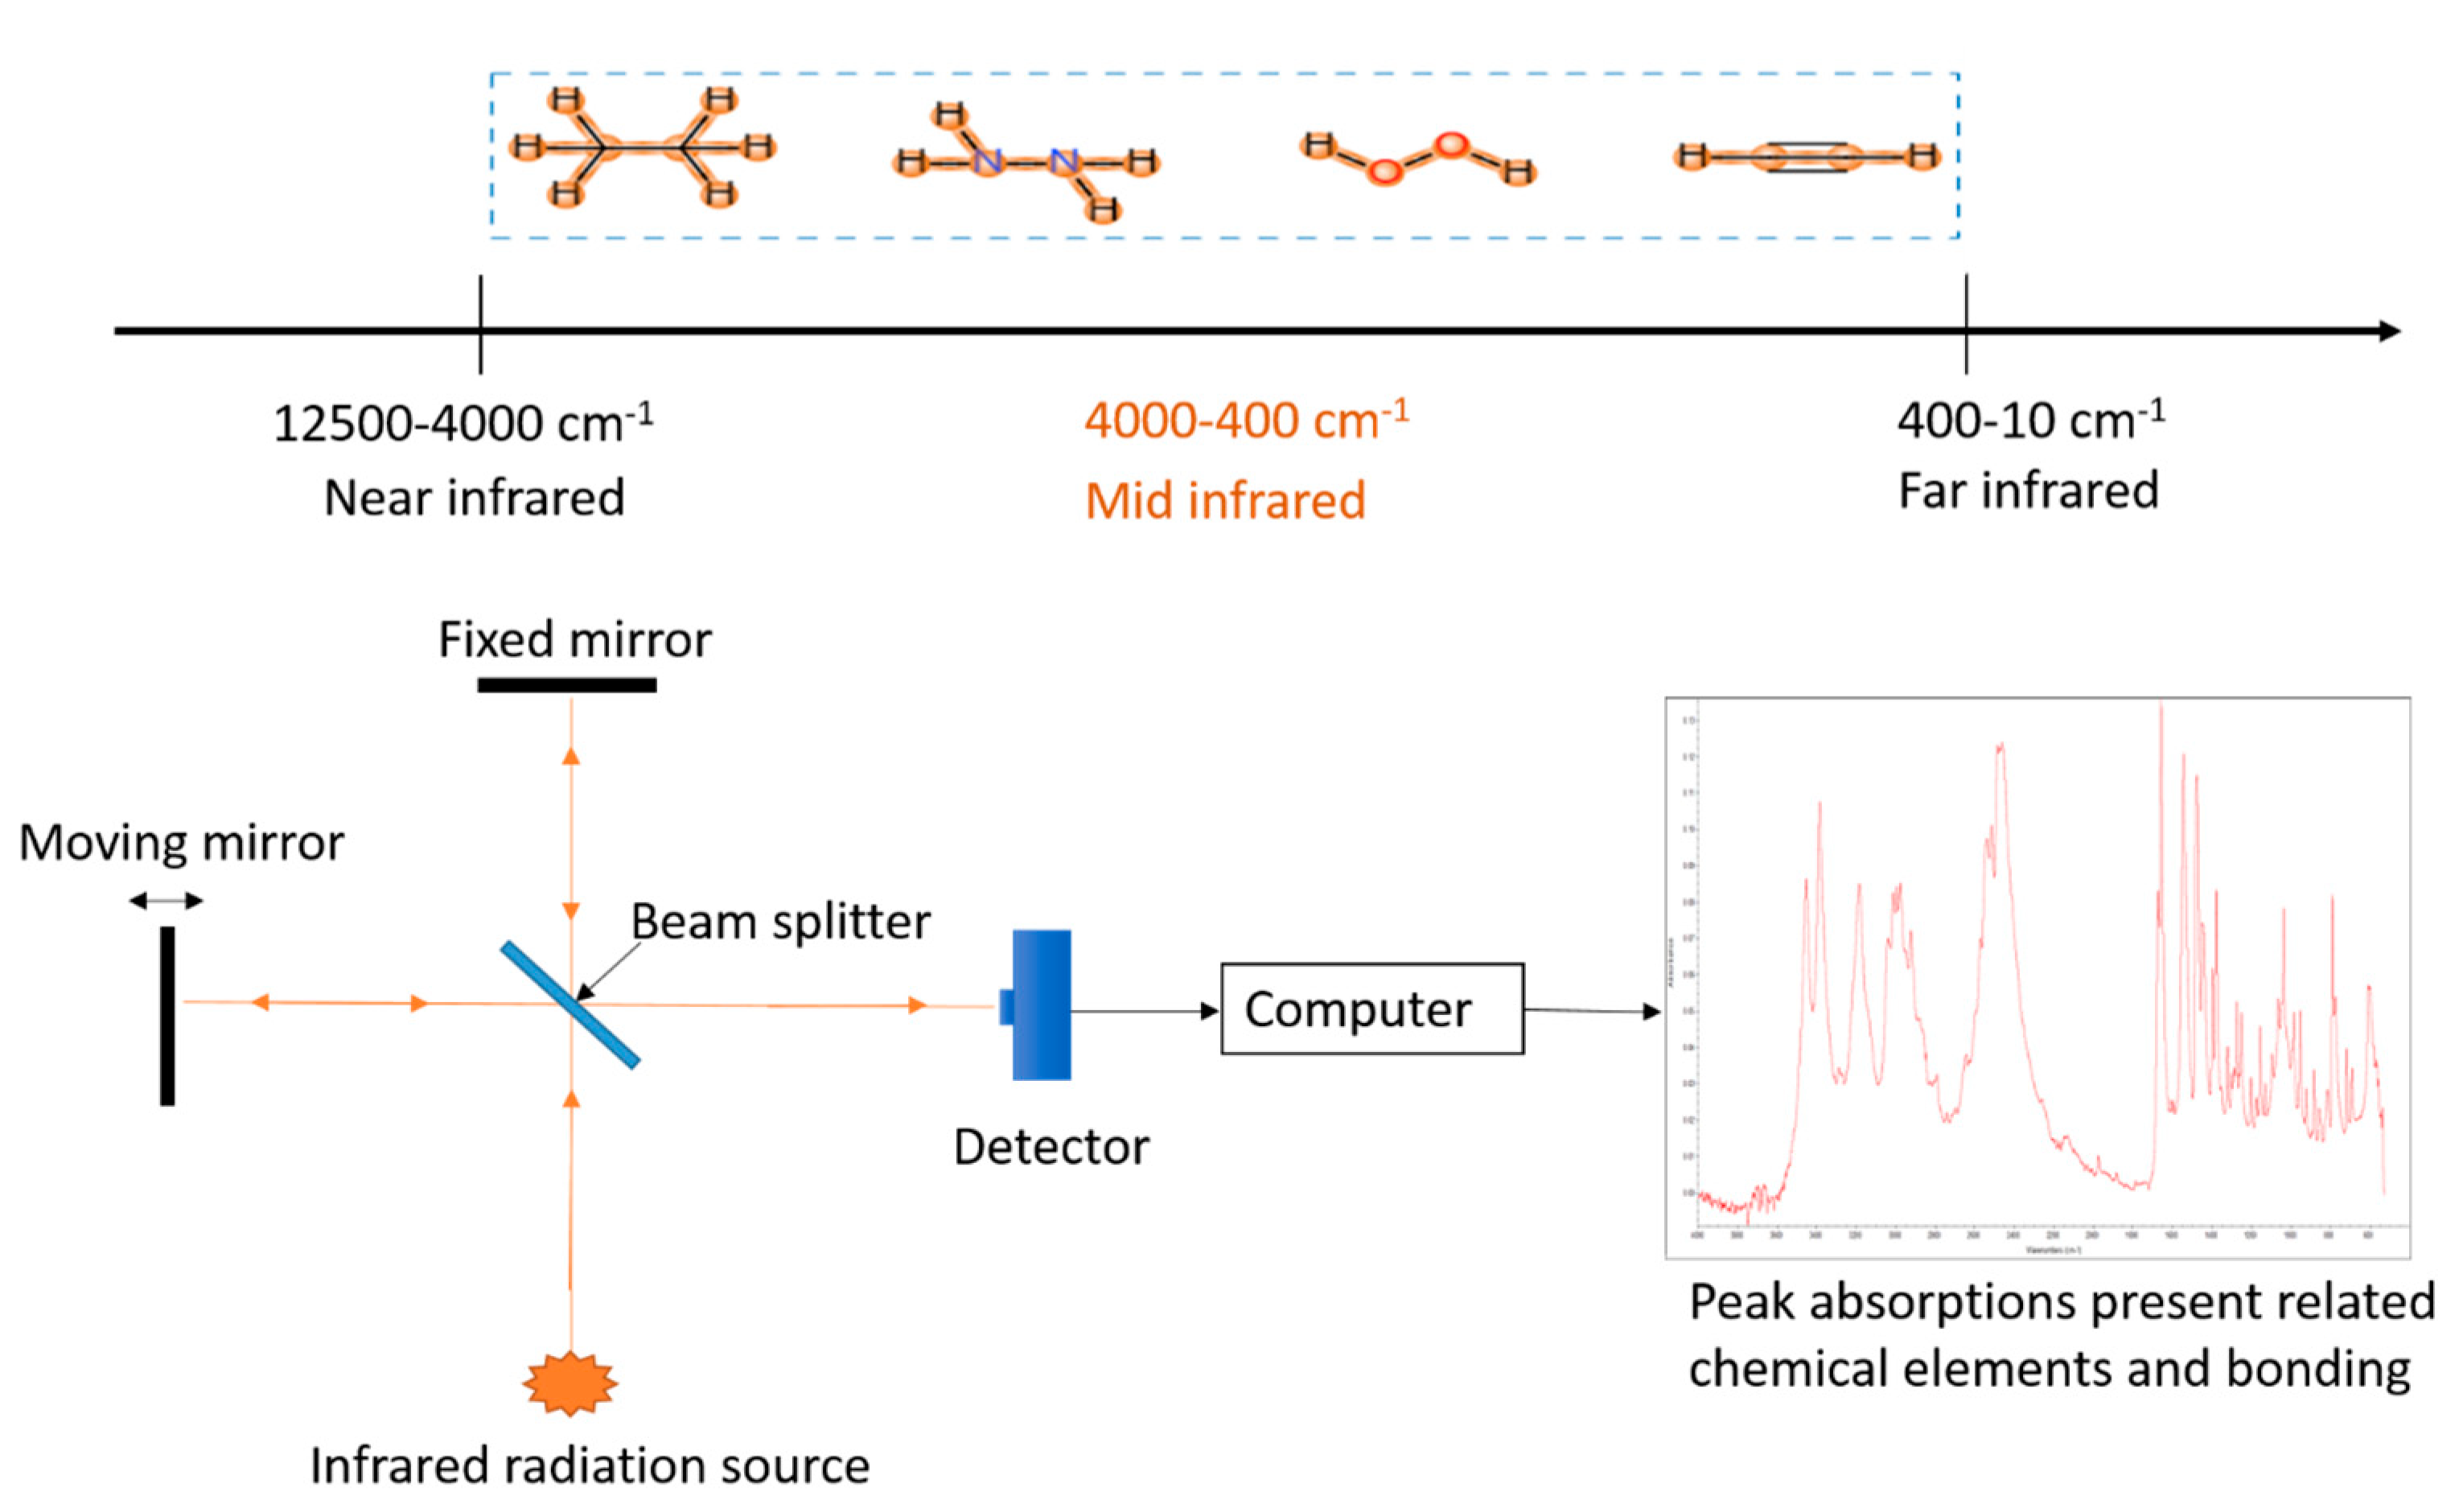
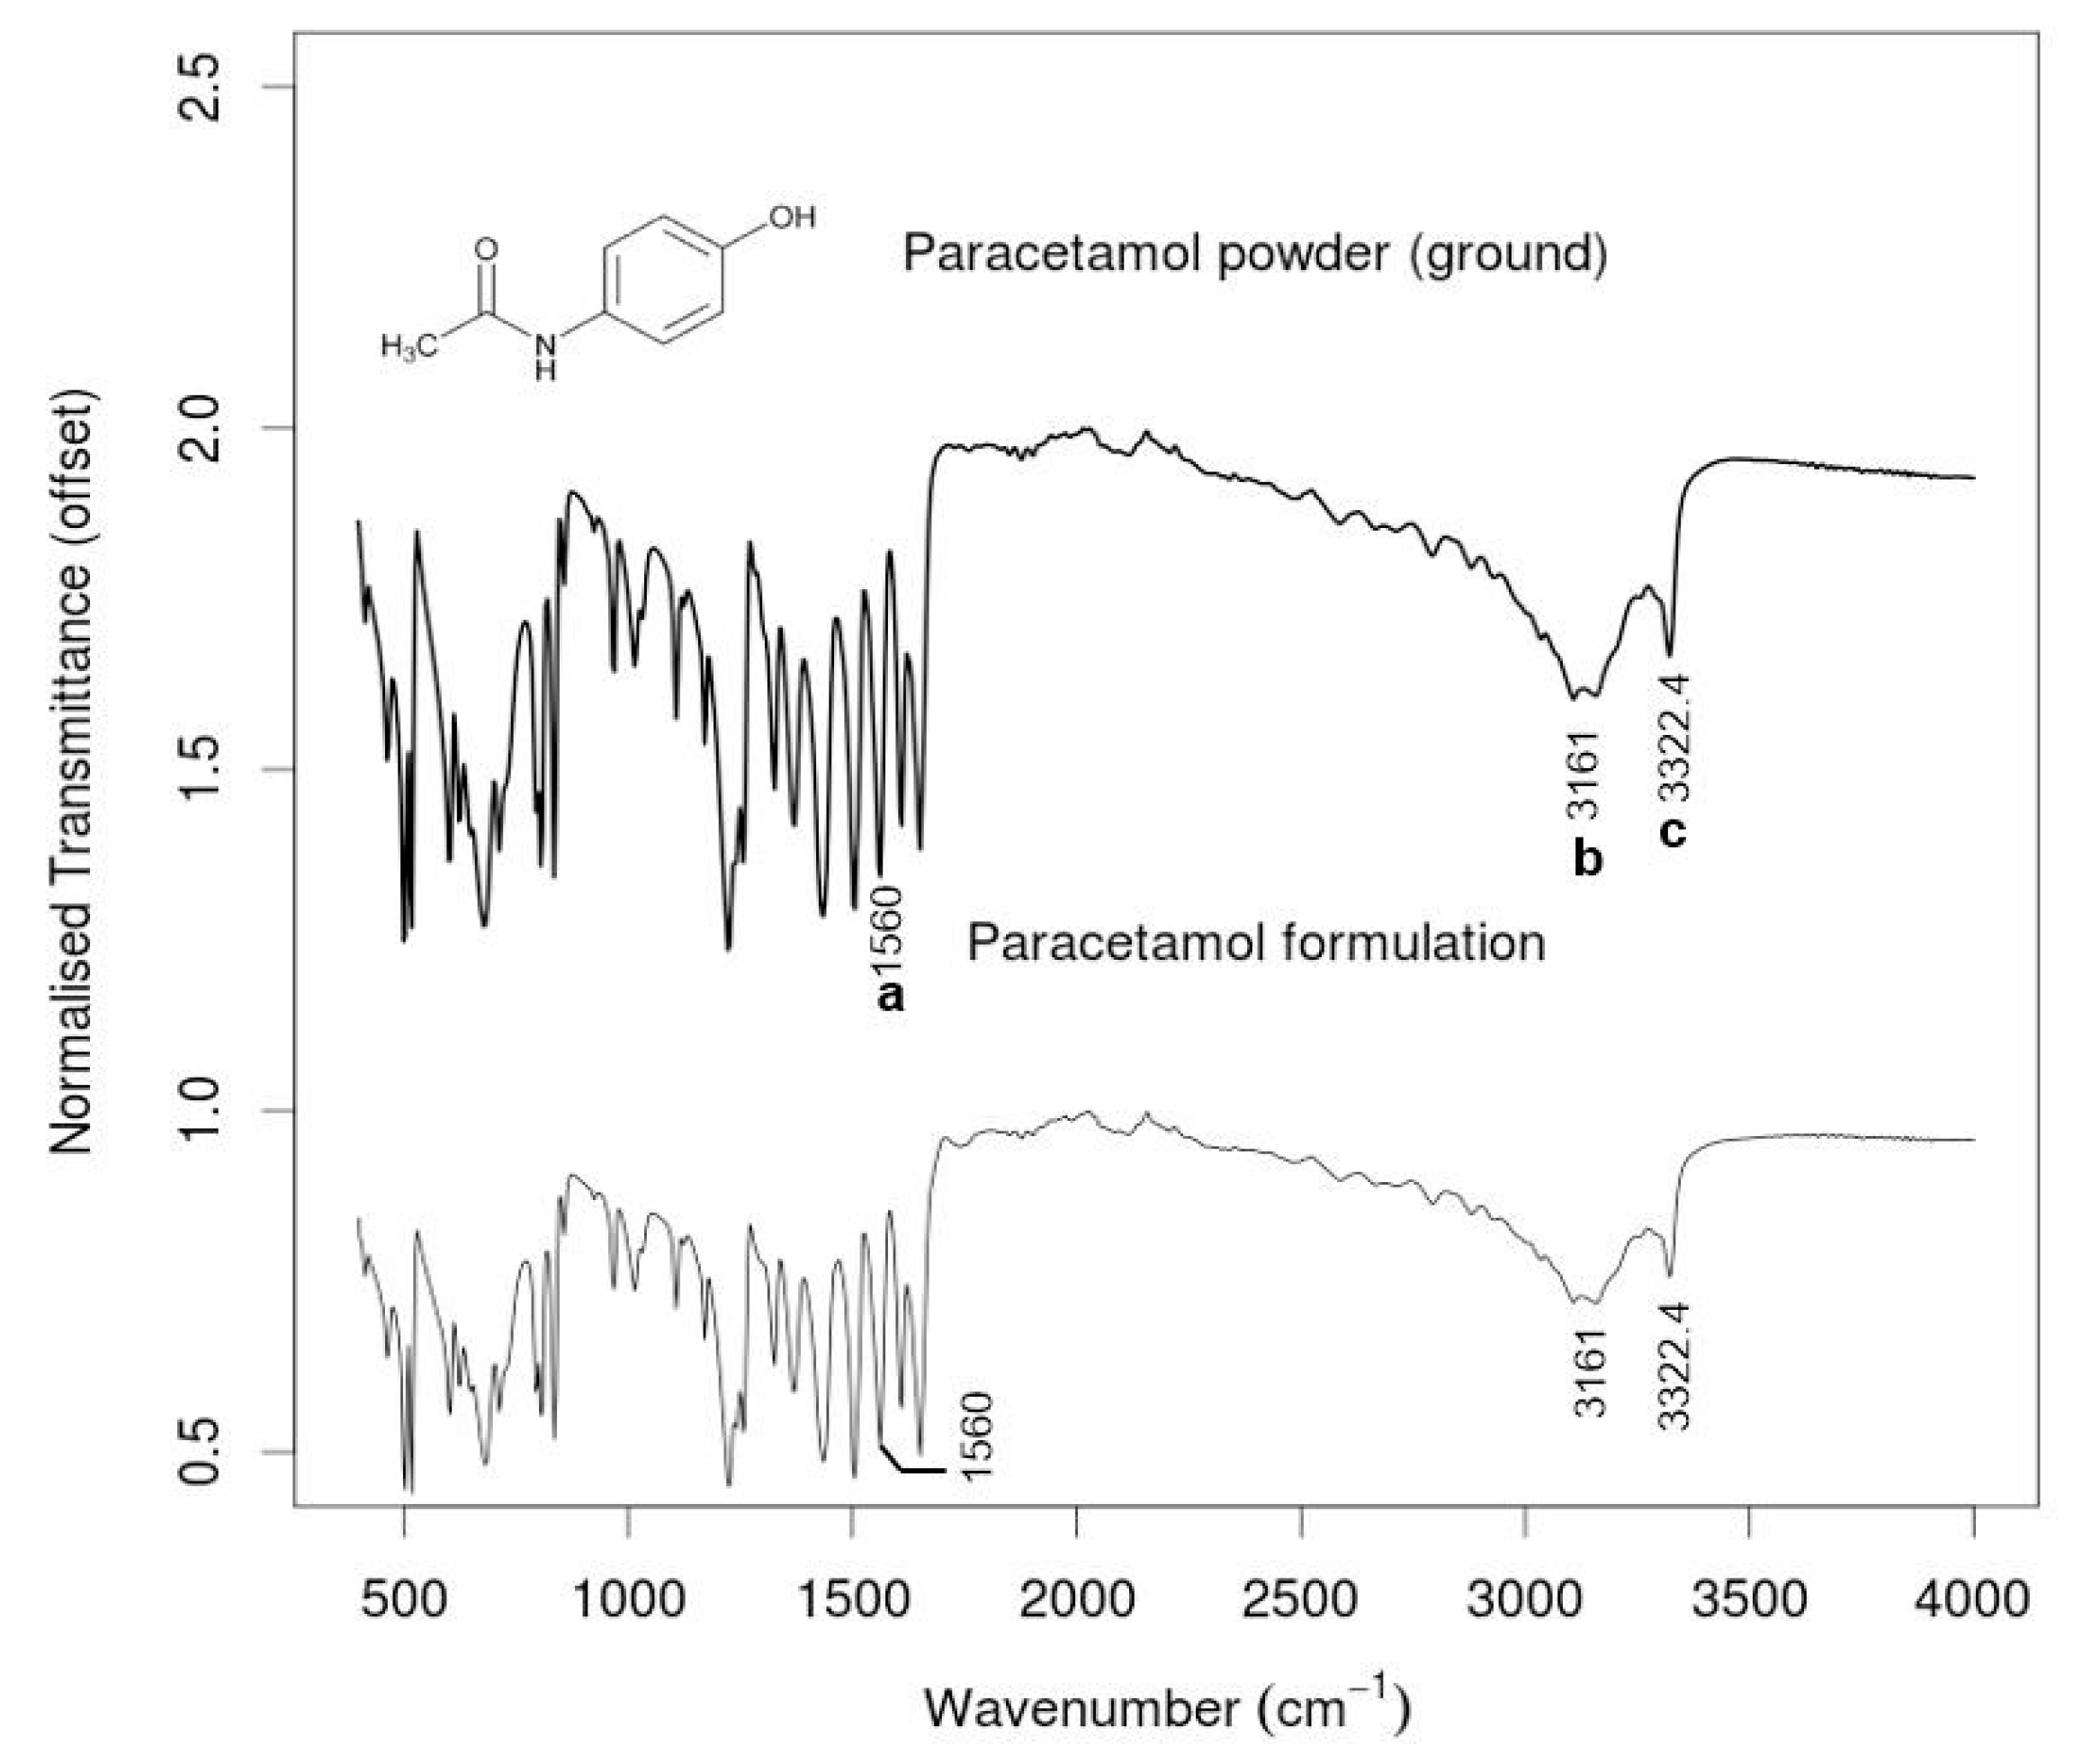
3.1.1. FTIR Spectroscopy
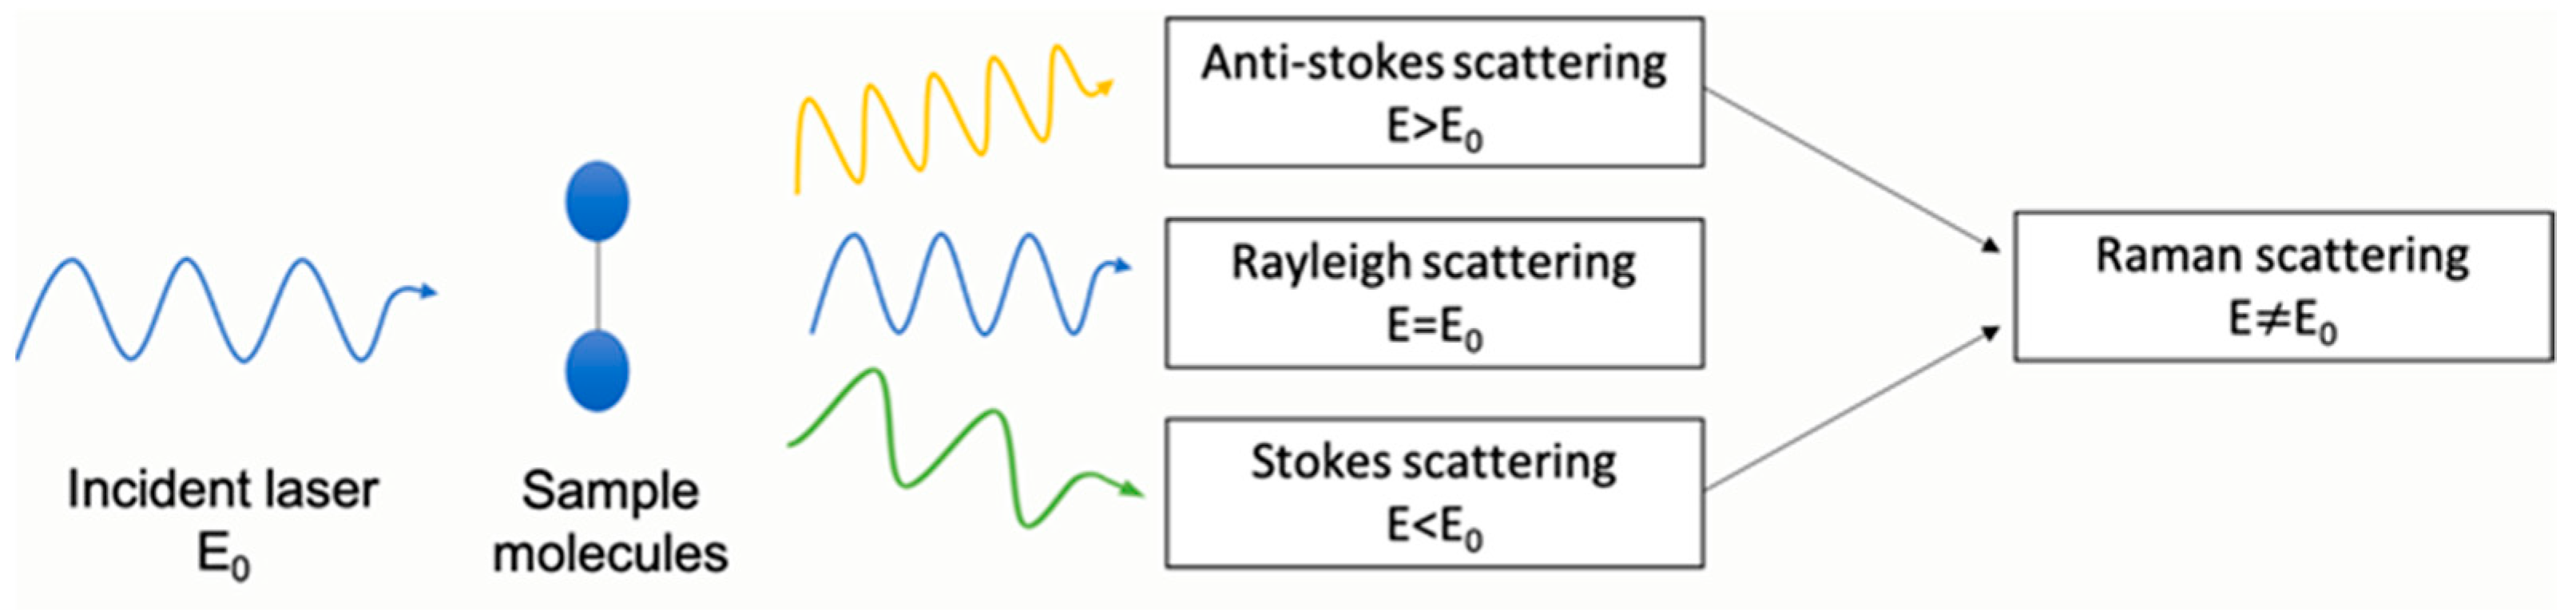
3.1.2. Raman Spectroscopy
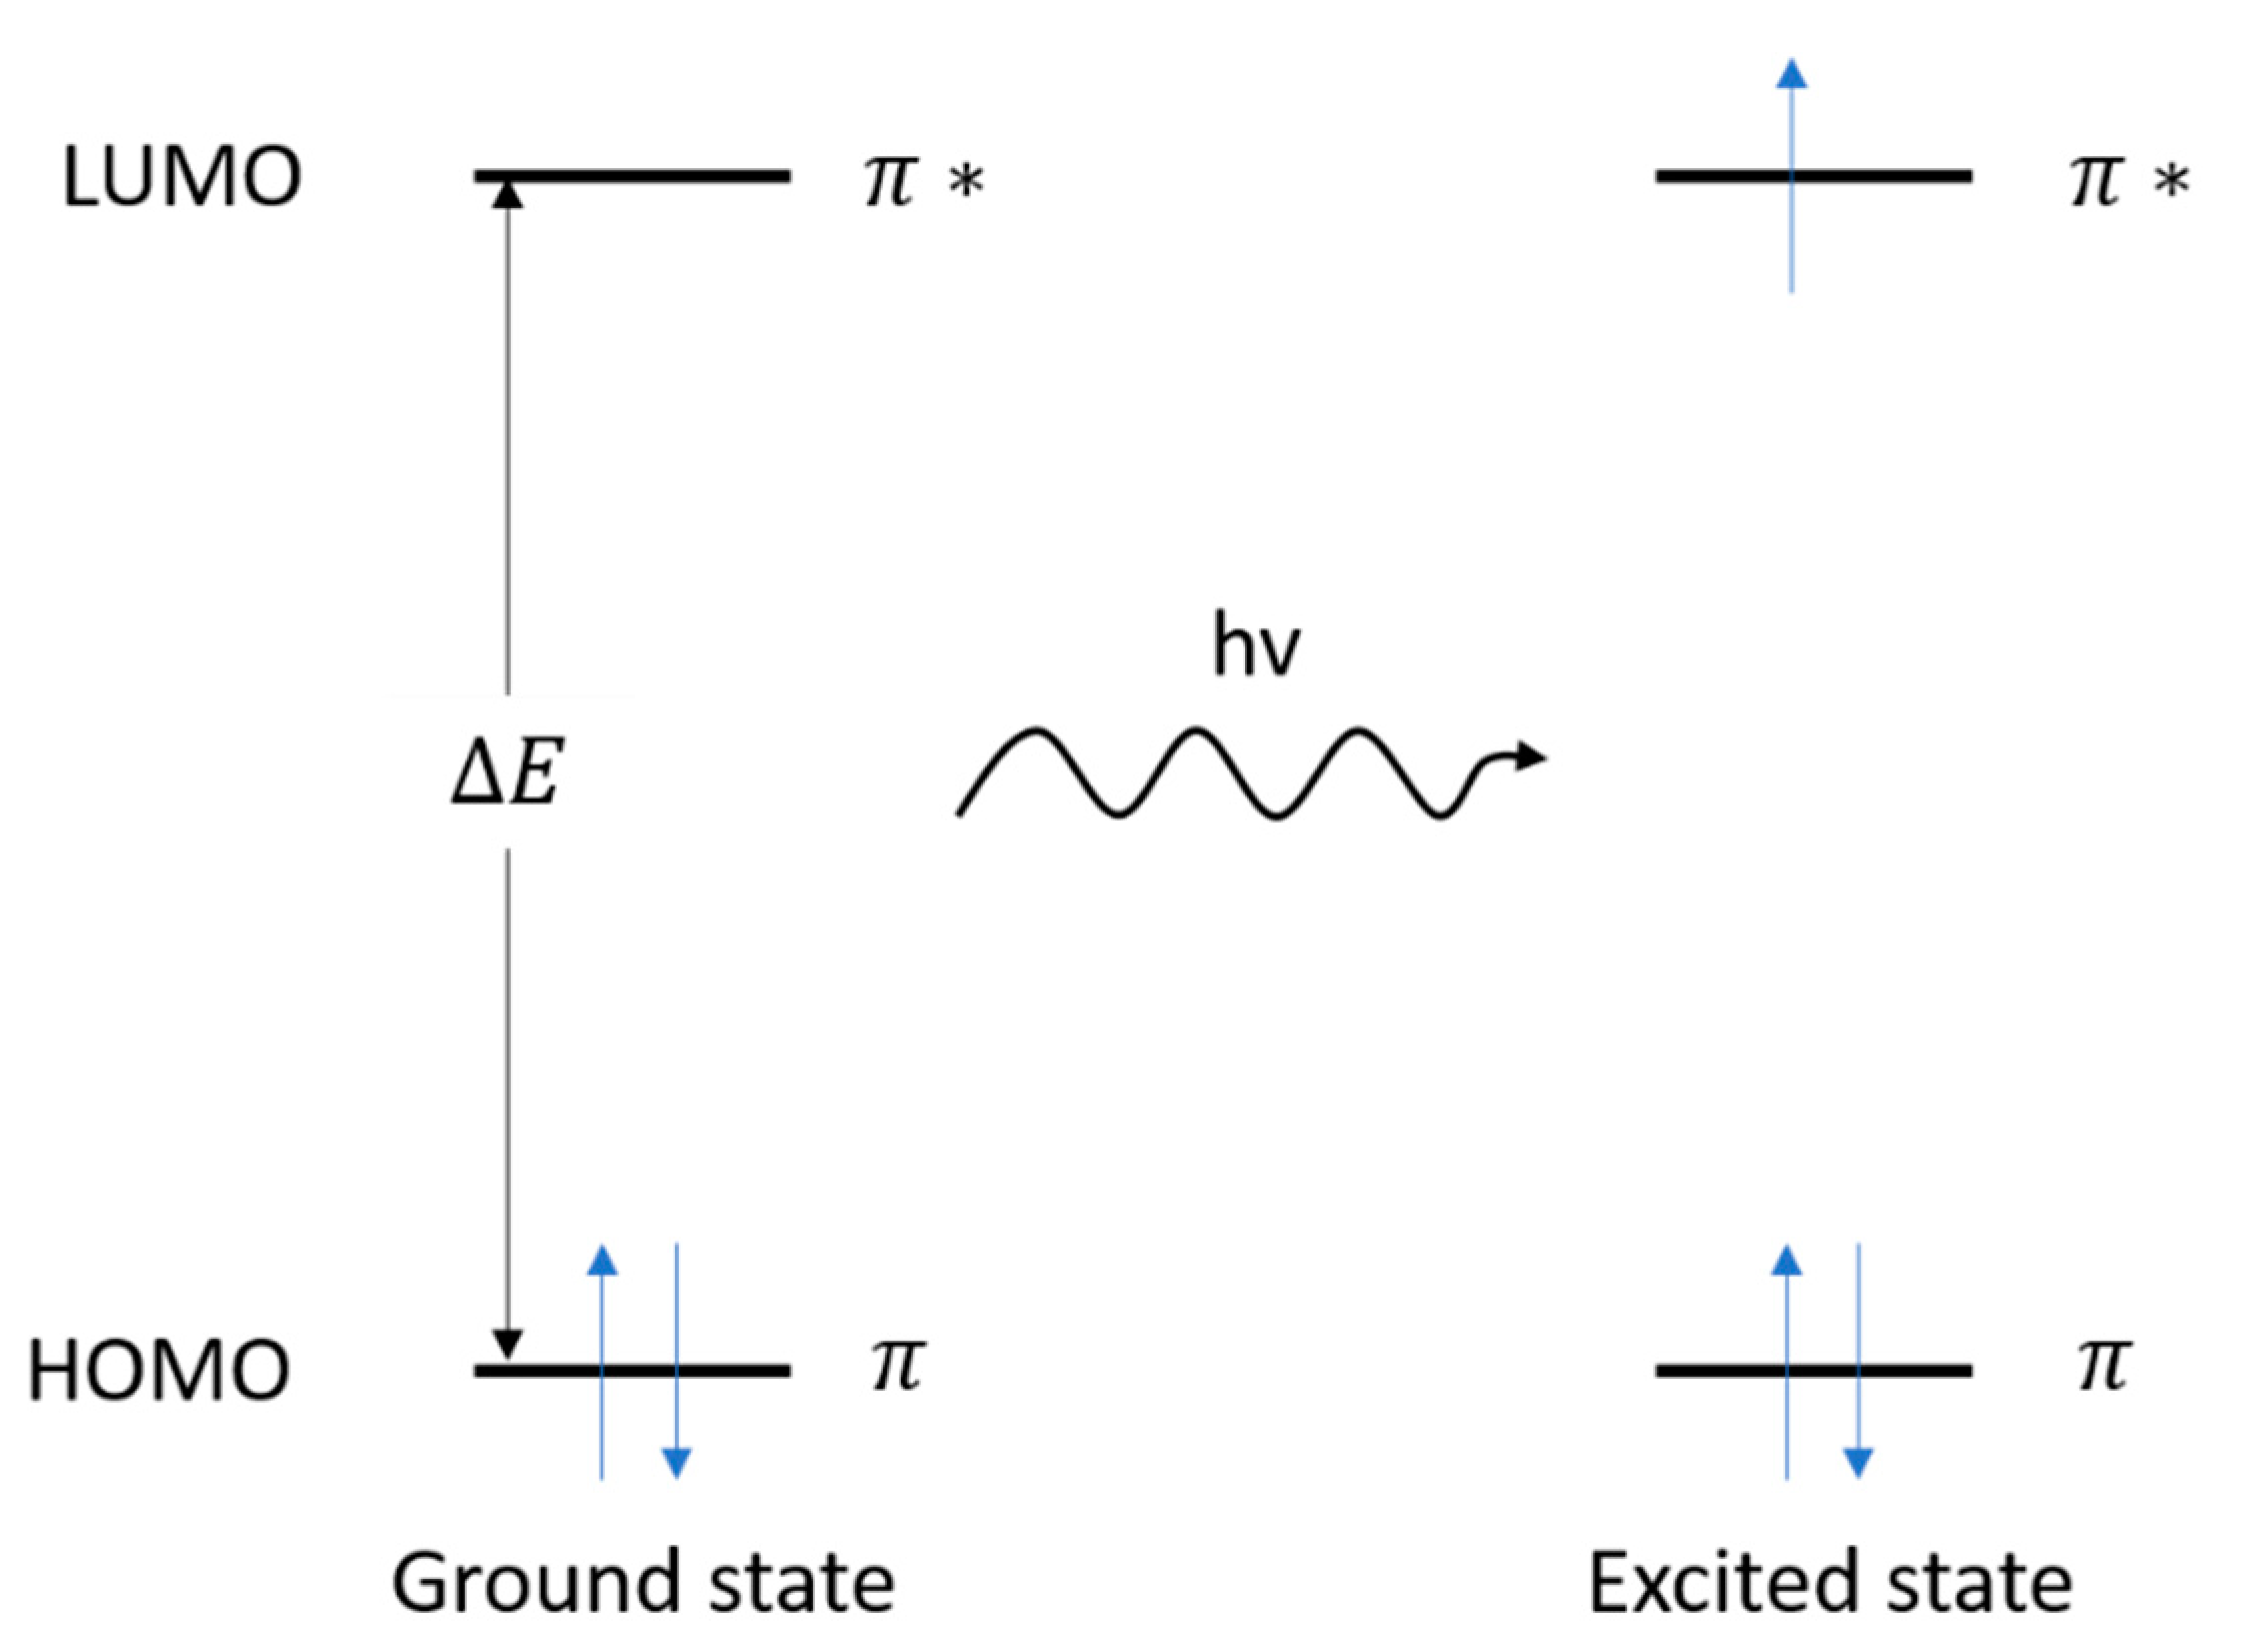
3.1.3. UV-Vis Spectroscopy
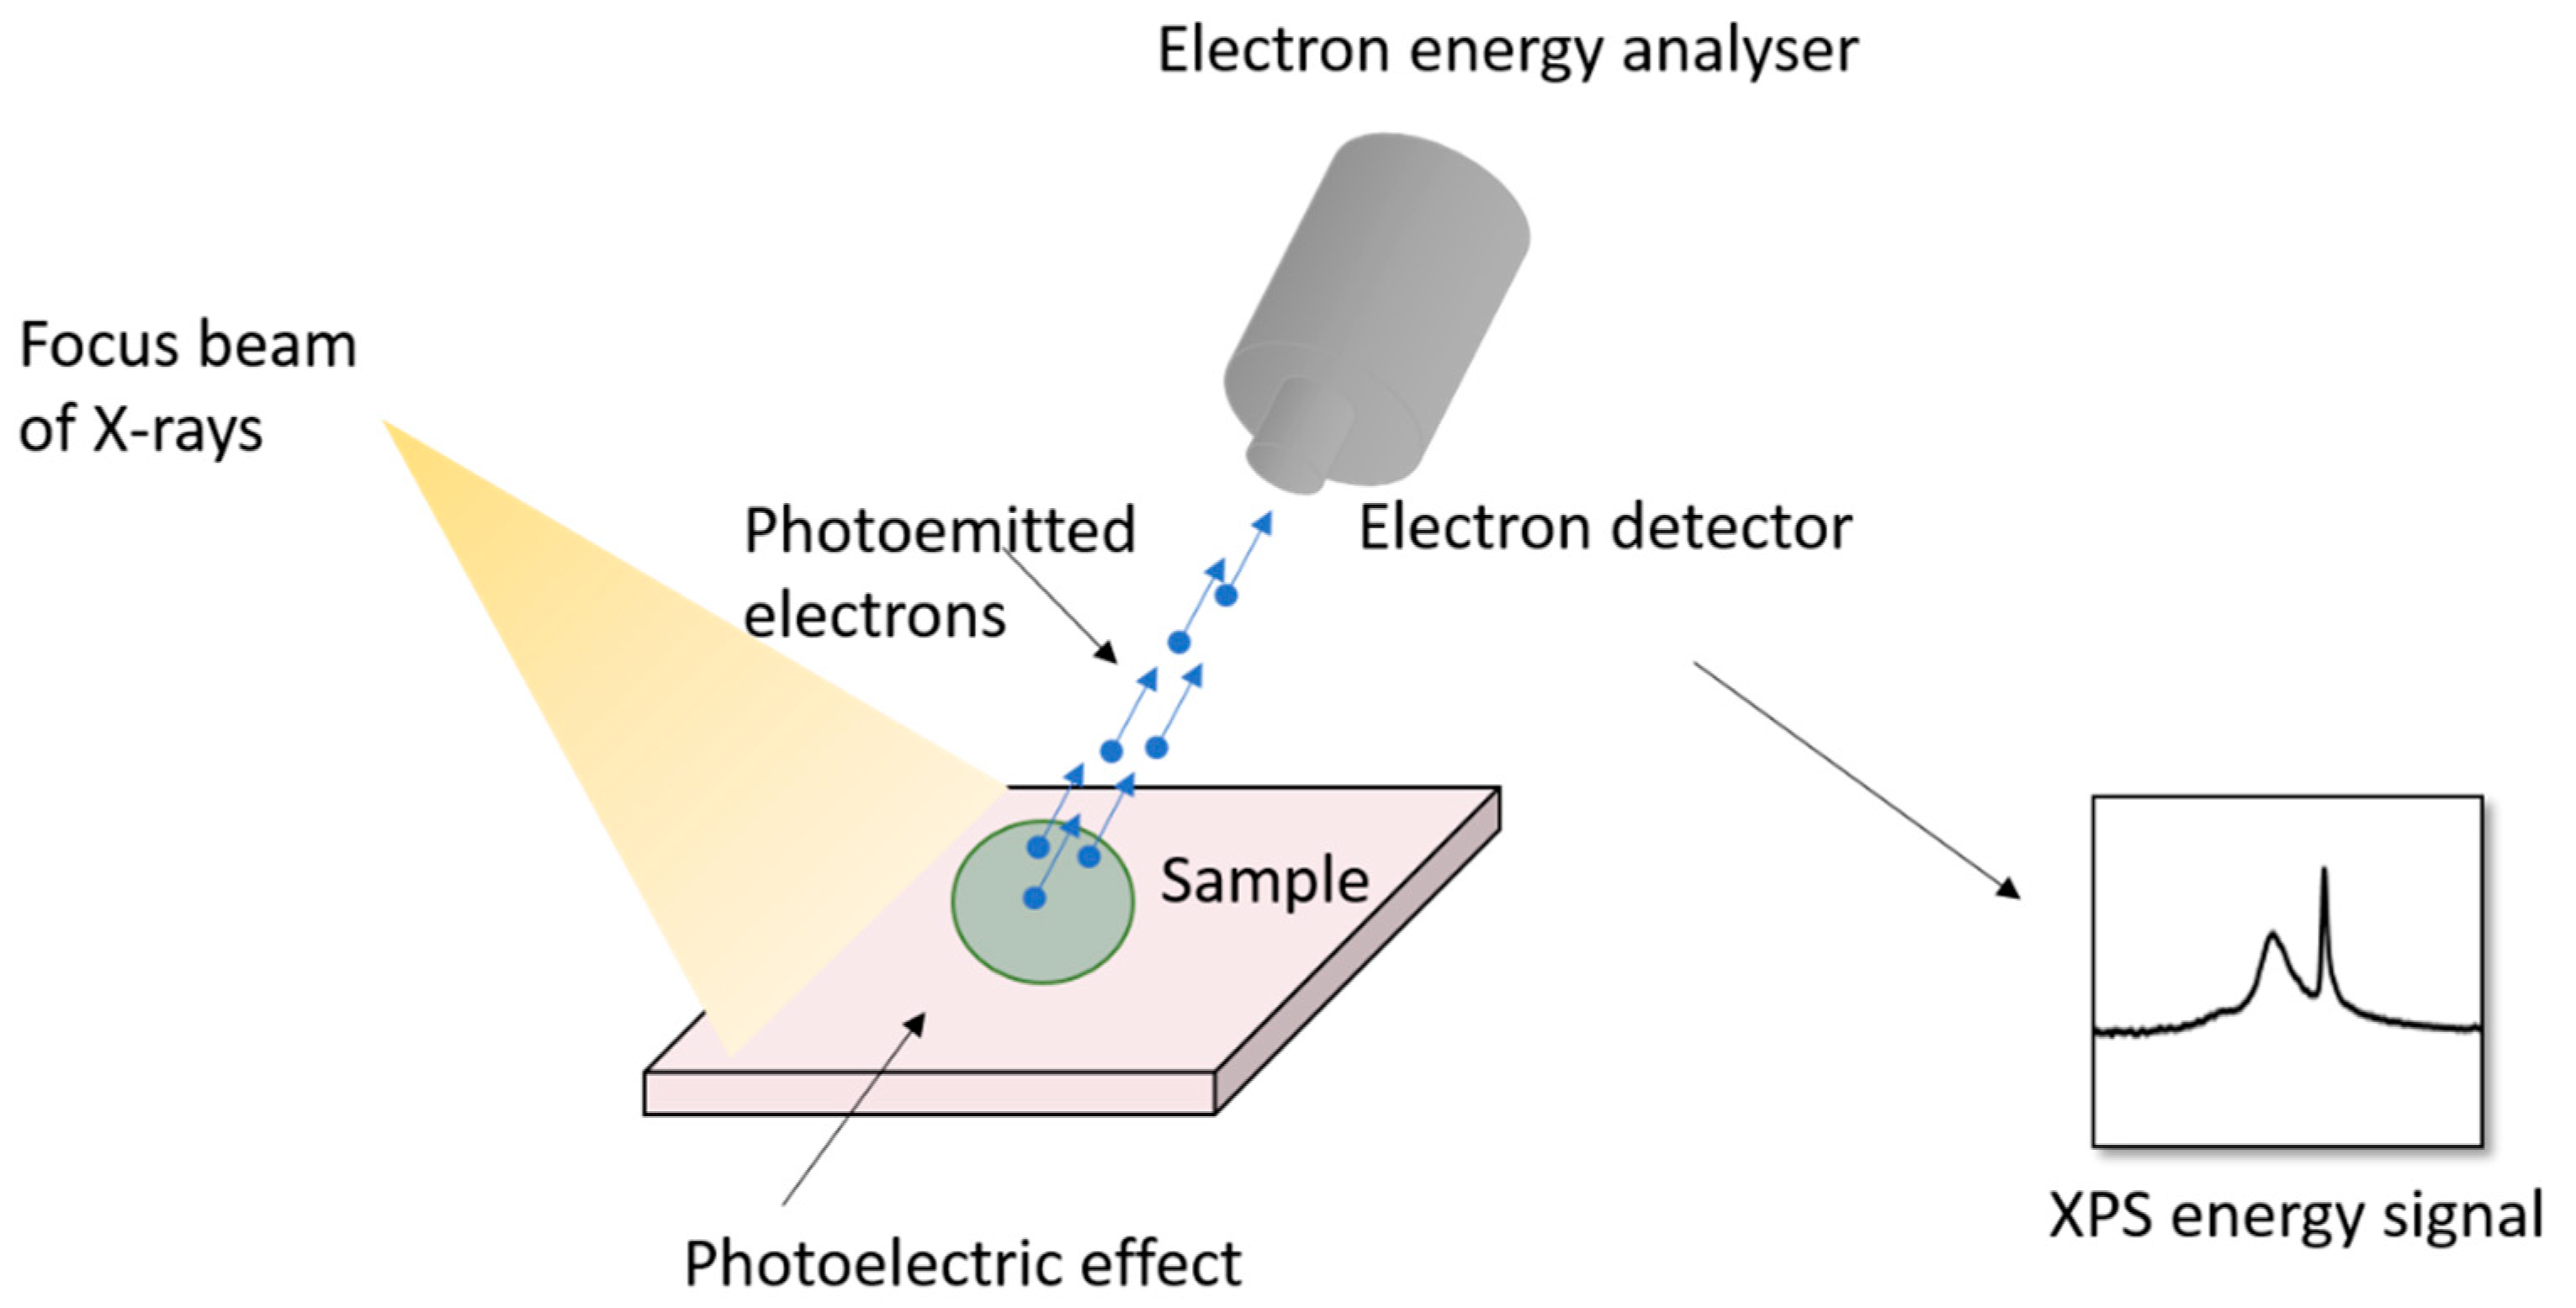
3.1.4. XPS
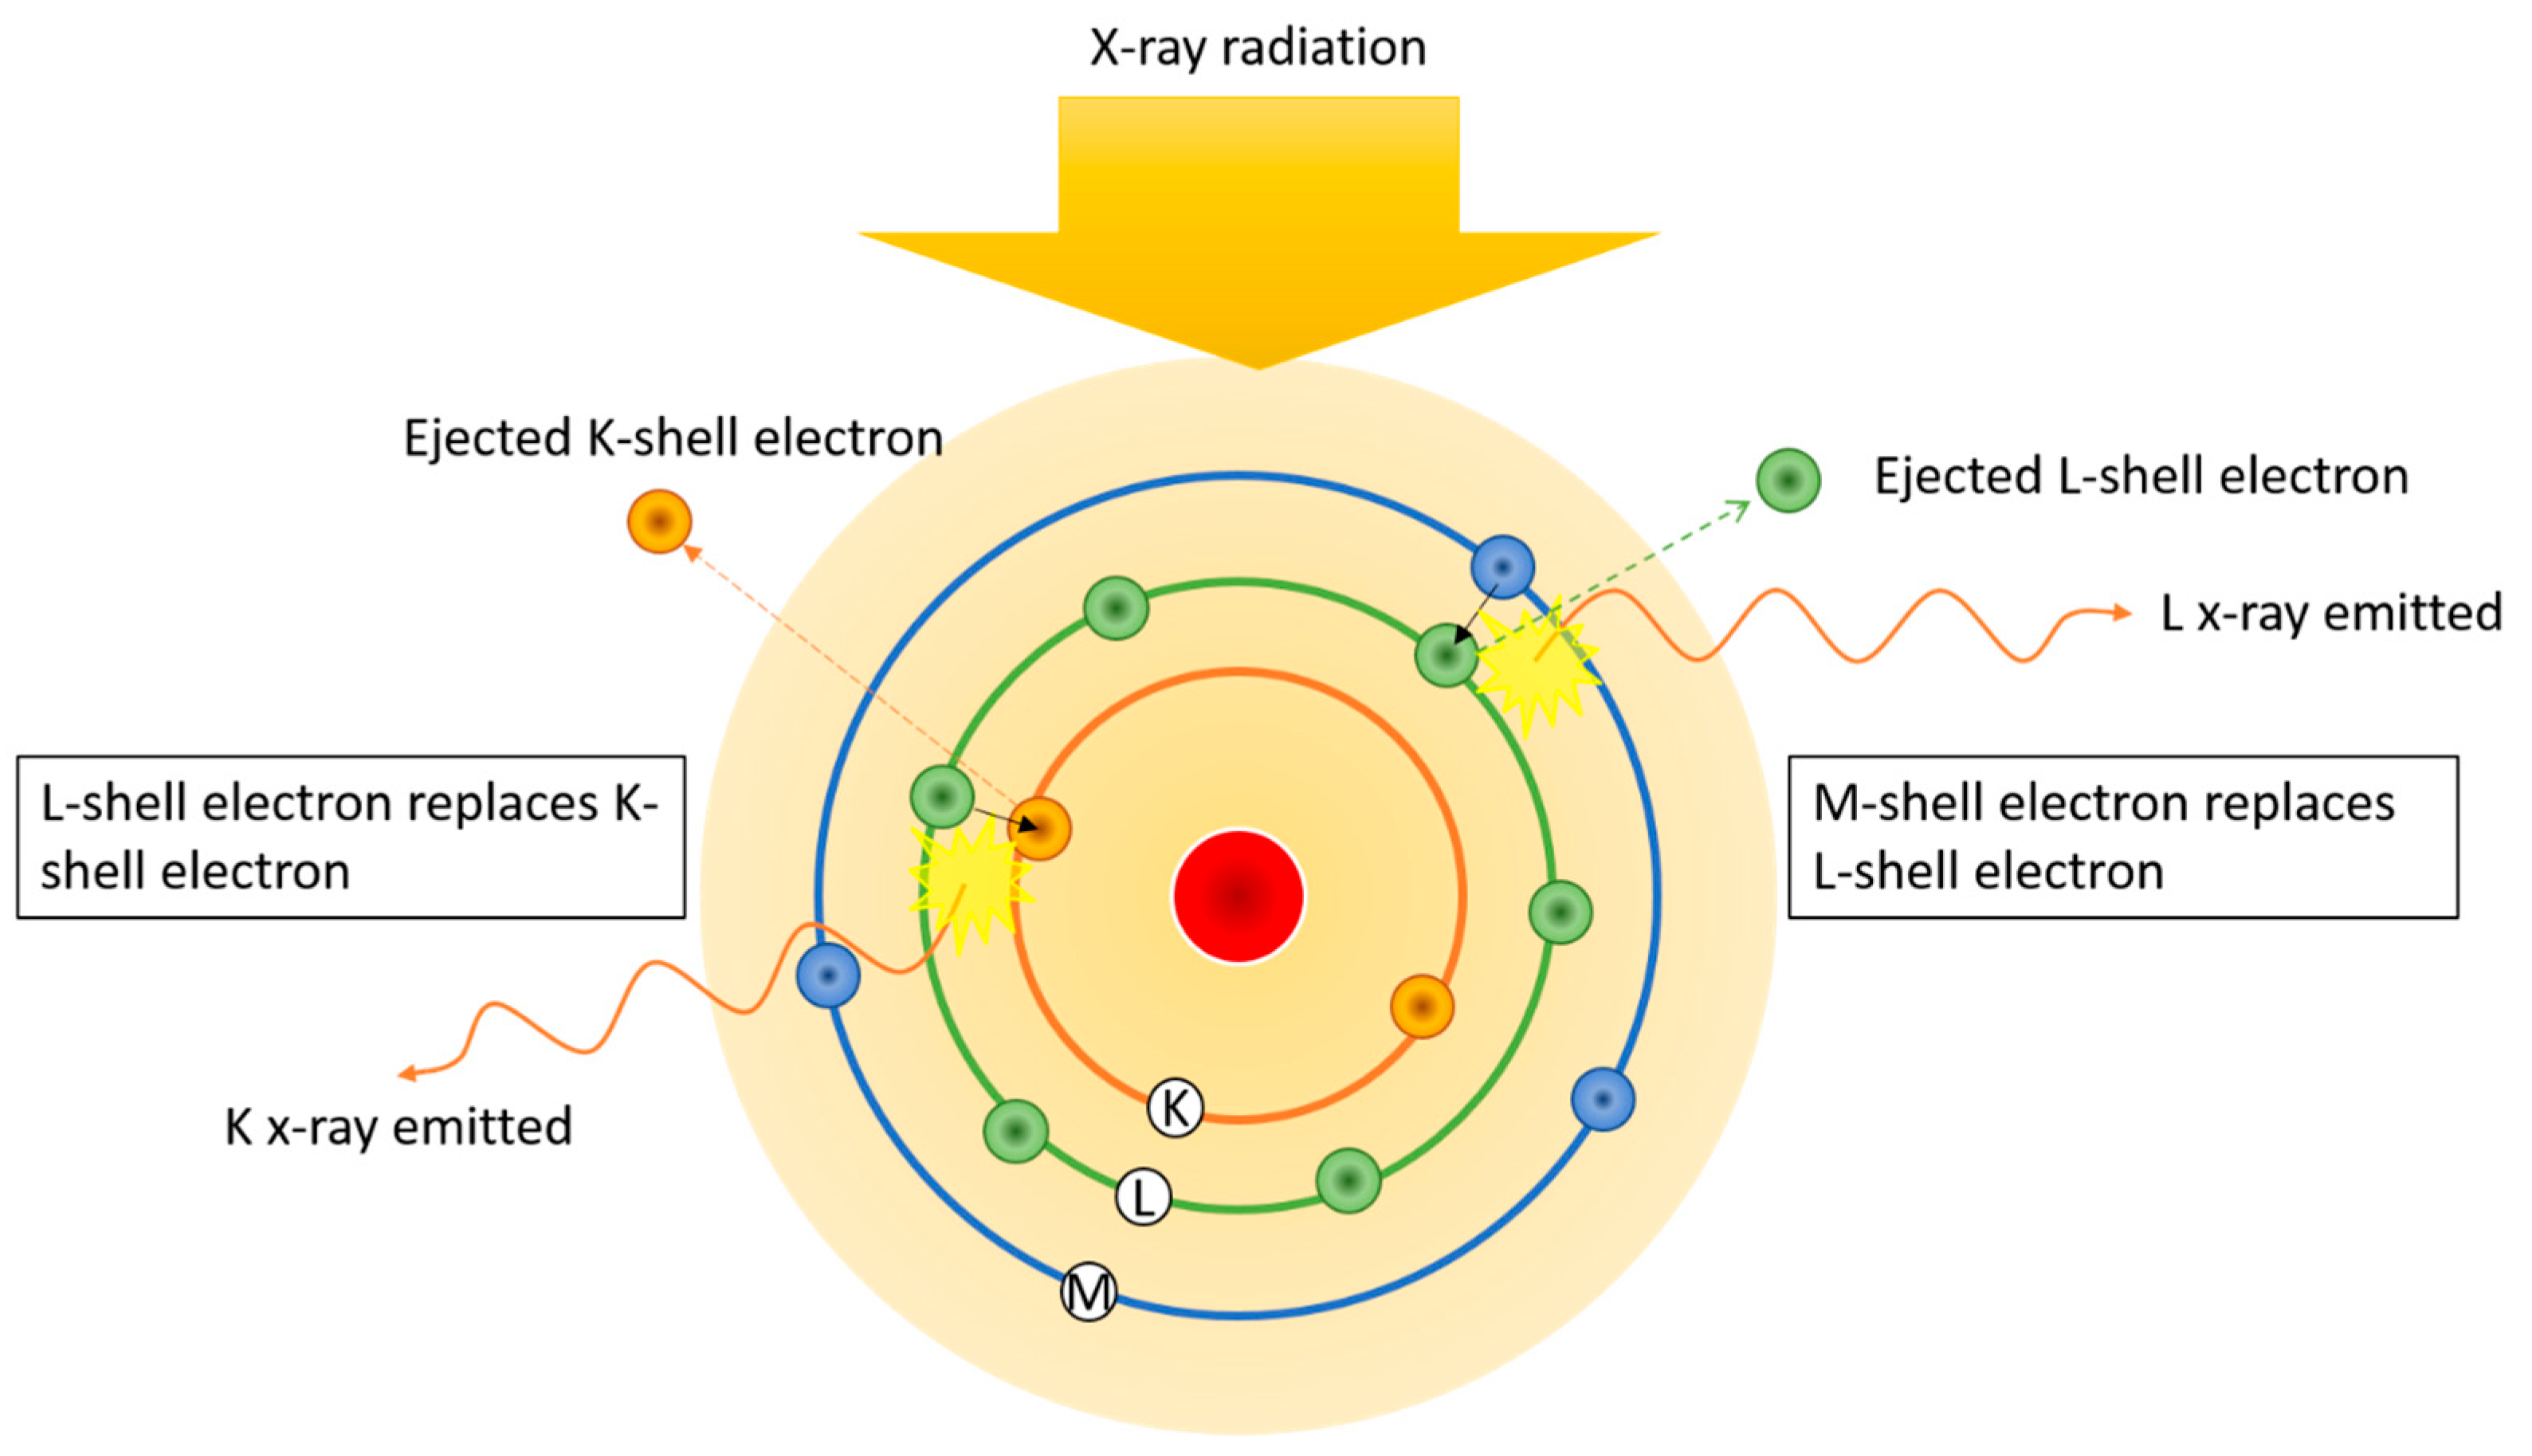
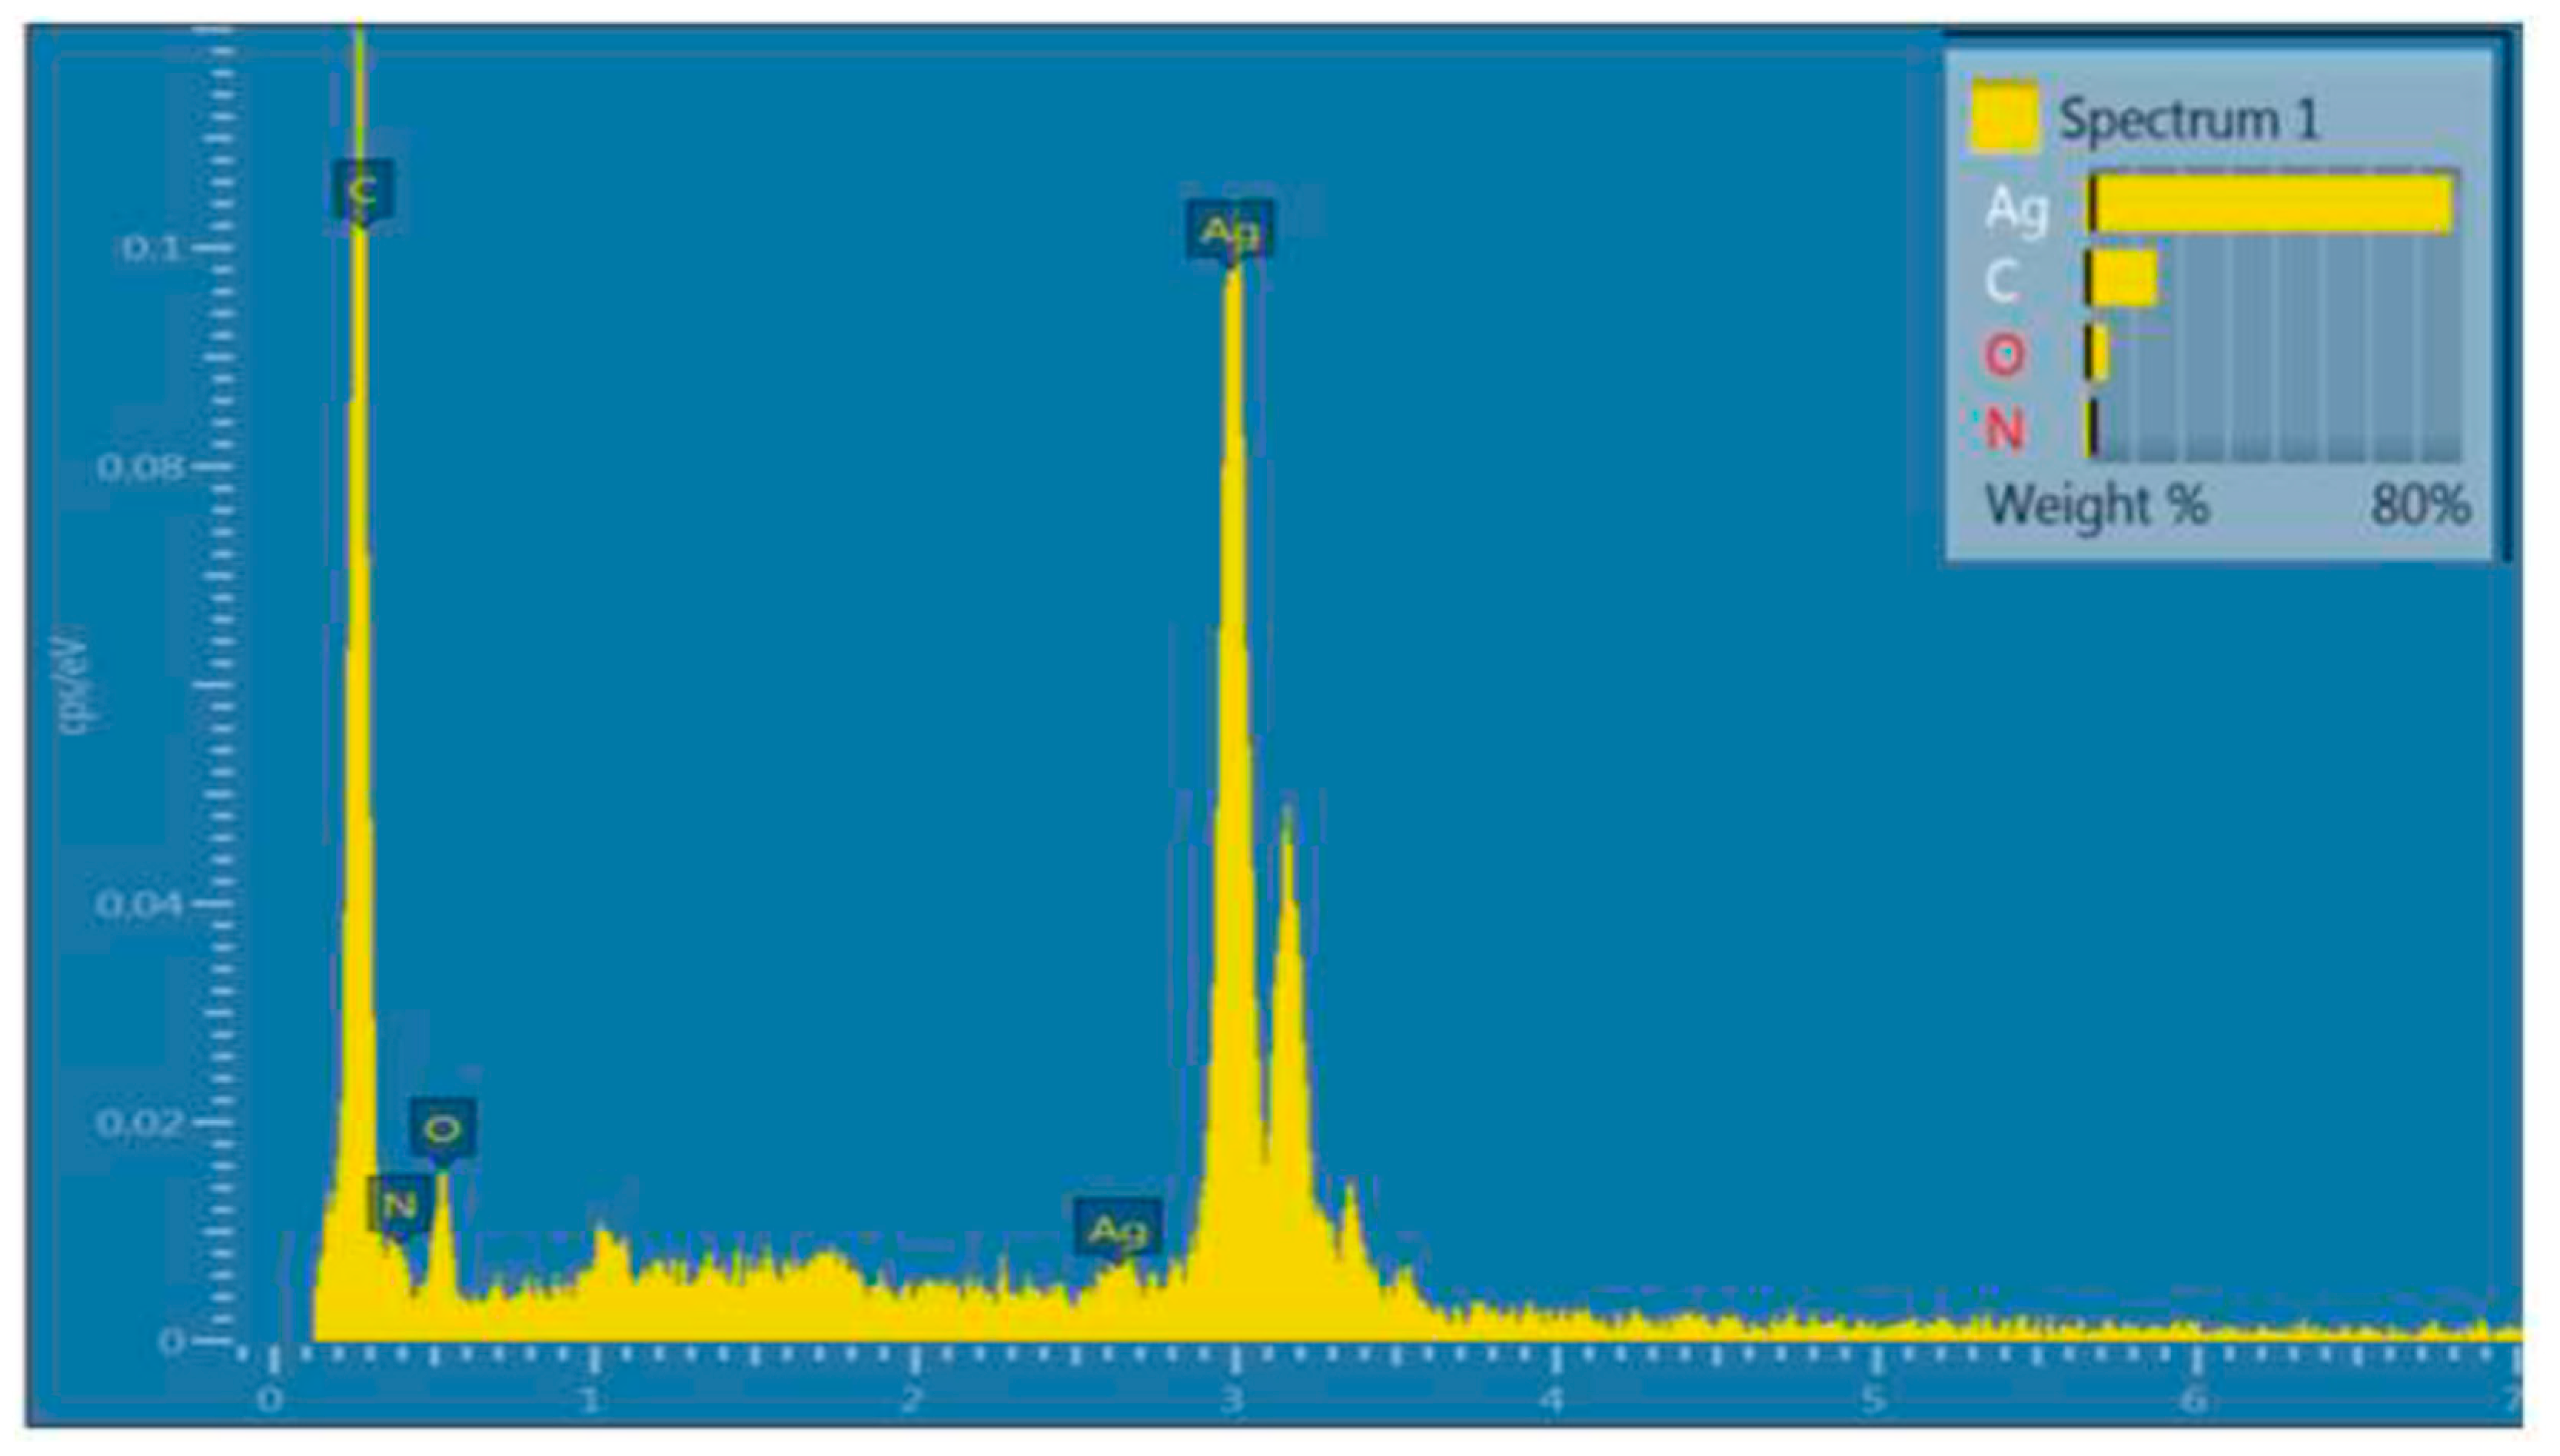
3.1.5. EDXS
3.2. Applications of Spectroscopy
3.2.1. Biomedical Applications
3.2.2. Electronics
3.2.3. Aerospace Applications
3.2.4. Protective Applications
3.2.5. 4D Printing Applications
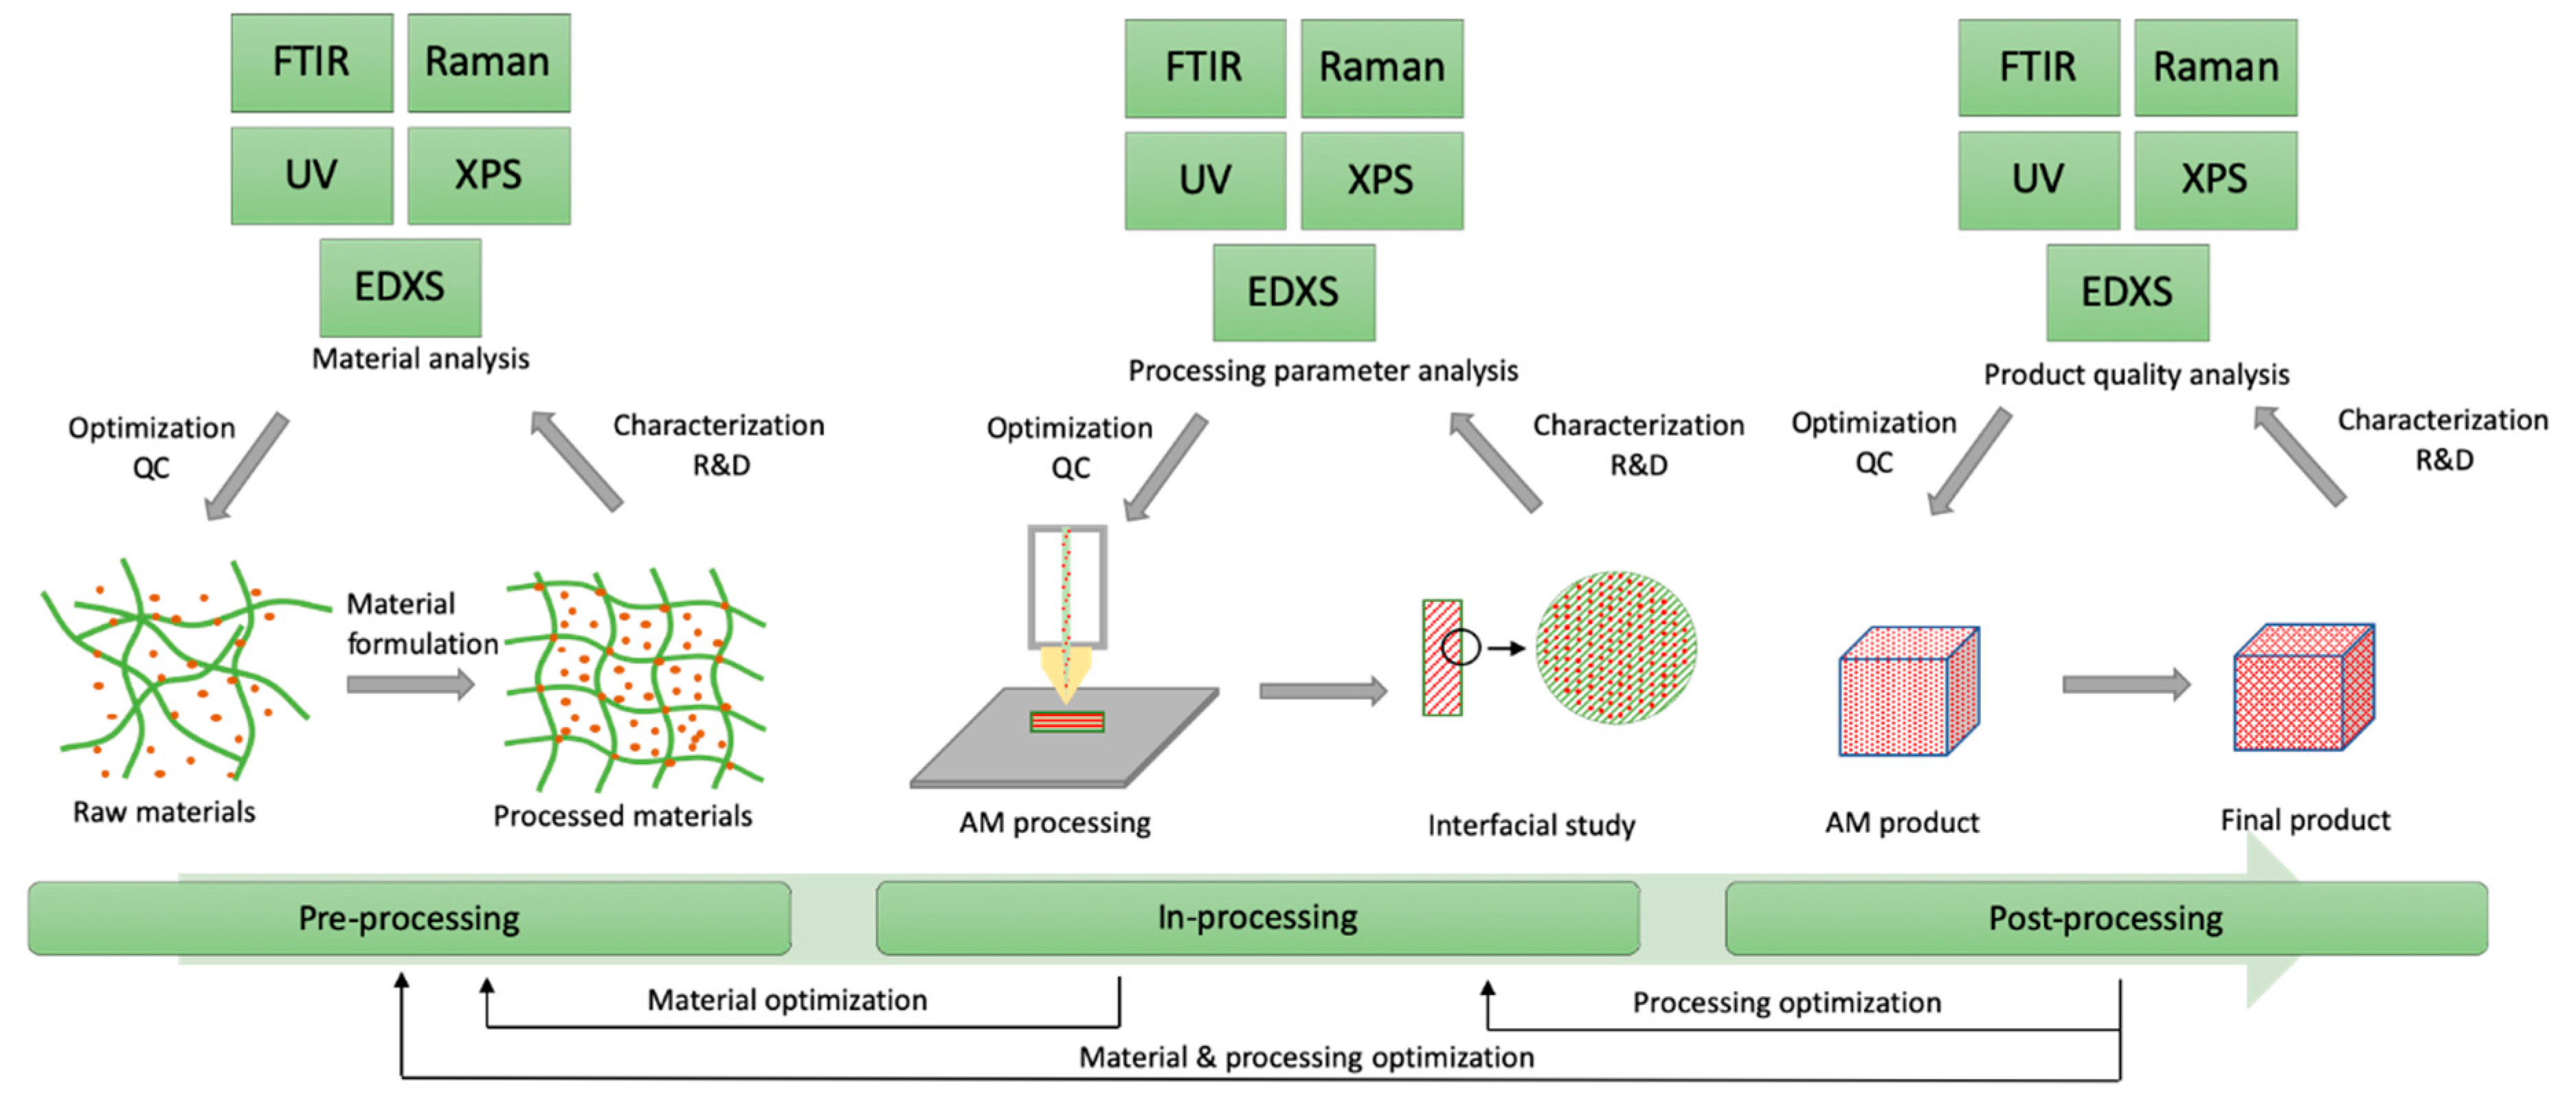
4. Spectroscopy in AM Process Loop
5. Summary and Outlook
Author Contributions
Funding
Institutional Review Board Statement
Informed Consent Statement
Data Availability Statement
Conflicts of Interest
References
- Data, R.A. Additive Manufacturing Market to Reach USD 23.33 Billion by 2026. Available online: https://www.reportsanddata.com/press-release/global-additive-manufacturing-market (accessed on 10 January 2020).
- Krimi, I.; Lafhaj, Z.; Ducoulombier, L. Prospective study on the integration of additive manufacturing to building industry—Case of a French construction company. Addit. Manuf. 2017, 16, 107–114. [Google Scholar] [CrossRef]
- Zhang, Z.; Li, H.; Fogel, G.R.; Xiang, D.; Liao, Z.; Liu, W. Finite element model predicts the biomechanical performance of transforaminal lumbar interbody fusion with various porous additive manufactured cages. Comput. Biol. Med. 2018, 95, 167–174. [Google Scholar] [CrossRef] [PubMed]
- Kumar, Y.R.; Kankanala, L.; Alwala, A. Assessment and treatment planning in maxillofacial surgery by using additive manufacturing technology. Mater. Today Proc. 2018, 5, 4162–4166. [Google Scholar]
- Reddy, K.V.P.; Mirzana, I.M.; Reddy, A.K. Application of Additive Manufacturing technology to an Aerospace component for better trade-off’s. Mater. Today Proc. 2018, 5, 3895–3902. [Google Scholar] [CrossRef]
- Dama, K.K.; Malyala, S.K.; Babu, V.S.; Rao, R.; Shaik, I.J. Development of Automotive FlexBody Chassis Structure in Conceptual Design Phase using Additive Manufacturing. Mater. Today Proc. 2017, 4, 9919–9923. [Google Scholar] [CrossRef]
- Renishaw 3D prints watch parts. Metal. Powder Rep. 2017, 72, 435. [CrossRef]
- 3D printed parts for US nuclear. Metal. Powder Rep. 2018, 73, 339. [CrossRef]
- 3D printed part for arm powered bike. Metal. Powder Rep. 2019, 74, 36. [CrossRef]
- Siemens 3D prints turbine component. Metal. Powder Rep. 2019, 74, 36. [CrossRef]
- Middelkoop, V.; Vamvakeros, A.; De Wit, D.; Jacques, S.D.; Danaci, S.; Jacquot, C.; De Vos, Y.; Matras, D.; Price, S.W.; Beale, A.M. 3D printed Ni/Al2O3 based catalysts for CO2 methanation-a comparative and operando XRD-CT study. J. CO2 Util. 2019, 33, 478–487. [Google Scholar] [CrossRef]
- Wong, K.V.; Hernandez, A. A review of additive manufacturing. ISRN Mech. Eng. 2012, 2012, 1–10. [Google Scholar] [CrossRef]
- Singh, S.; Ramakrishna, S.; Singh, R. Material issues in additive manufacturing: A review. Manuf. Process. 2017, 25, 185–200. [Google Scholar] [CrossRef]
- Fera, M.; Fruggiero, F.; Lambiase, A.; Macchiaroli, R. State of the art of additive manufacturing: Review for tolerances, mechanical resistance and production costs. Cogent Eng. 2016, 3, 1261503. [Google Scholar] [CrossRef]
- Camacho, D.D.; Clayton, P.; O’Brien, W.J.; Seepersad, C.; Juenger, M.; Ferron, R.; Salamone, S. Applications of additive manufacturing in the construction industry–A forward-looking review. Autom. Constr. 2018, 89, 110–119. [Google Scholar] [CrossRef]
- Ngo, T.D.; Kashani, A.; Imbalzano, G.; Nguyen, K.T.; Hui, D. Additive manufacturing (3D printing): A review of materials, methods, applications and challenges. Compos. Part B Eng. 2018, 143, 172–196. [Google Scholar] [CrossRef]
- Prakash, K.S.; Nancharaih, T.; Rao, V.S. Additive Manufacturing Techniques in Manufacturing-An Overview. Mater. Today Proc. 2018, 5, 3873–3882. [Google Scholar] [CrossRef]
- Lu, Q.Y.; Wong, C.H. Additive manufacturing process monitoring and control by non-destructive testing techniques: Challenges and in-process monitoring. Virtual Phys. Prototyp. 2018, 13, 39–48. [Google Scholar] [CrossRef]
- Momeni, F.; Liu, X.; Ni, J. A review of 4D printing. Mater. Des. 2017, 122, 42–79. [Google Scholar] [CrossRef]
- Shiblee, M.N.I.; Ahmed, K.; Kawakami, M.; Furukawa, H. 4D Printing of Shape-Memory Hydrogels for Soft-Robotic Functions. Adv. Mater. Technol. 2019, 4, 1900071. [Google Scholar] [CrossRef]
- Kumar, P.; Ahuja, I.; Singh, R. Application of fusion deposition modelling for rapid investment casting- a review. Int. J. Mater. Eng. Innov. 2012, 3, 204. [Google Scholar] [CrossRef]
- Upcraft, S.; Fletcher, R. The rapid prototyping technologies. Assem. Autom. 2003, 23, 318–330. [Google Scholar] [CrossRef]
- Long, J.; Gholizadeh, H.; Lu, J.; Bunt, C.; Seyfoddin, A. Application of fused deposition modelling (FDM) method of 3D printing in drug delivery. Curr. Pharm. Des. 2017, 23, 433–439. [Google Scholar] [CrossRef]
- Sood, A.K.; Ohdar, R.K.; Mahapatra, S.S. Parametric appraisal of mechanical property of fused deposition modelling processed parts. Mater. Des. 2010, 31, 287–295. [Google Scholar] [CrossRef]
- Chohan, J.S.; Singh, R.; Boparai, K.S.; Penna, R.; Fraternali, F. Dimensional accuracy analysis of coupled fused deposition modeling and vapour smoothing operations for biomedical applications. Compos. Part B Eng. 2017, 117, 138–149. [Google Scholar] [CrossRef]
- Lee, H.; Lim, C.H.J.; Low, M.J.; Tham, N.; Murukeshan, V.M.; Kim, Y.-J. Lasers in additive manufacturing: A review. Int. J. Precis. Eng. Manuf. Technol. 2017, 4, 307–322. [Google Scholar] [CrossRef]
- Tang, H.-H.; Chiu, M.-L.; Yen, H.-C. Slurry-based selective laser sintering of polymer-coated ceramic powders to fabricate high strength alumina parts. J. Eur. Ceram. Soc. 2011, 31, 1383–1388. [Google Scholar] [CrossRef]
- Melchels, F.P.; Feijen, J.; Grijpma, D.W. A review on stereolithography and its applications in biomedical engineering. Biomaterials 2010, 31, 6121–6130. [Google Scholar] [CrossRef]
- Liu, T.; Guessasma, S.; Zhu, J.; Zhang, W.; Nouri, H.; Belhabib, S. Microstructural defects induced by stereolithography and related compressive behaviour of polymers. J. Mater. Process. Technol. 2018, 251, 37–46. [Google Scholar] [CrossRef]
- Dulieu-Barton, J.; Fulton, M. Mechanical properties of a typical stereolithography resin. Strain 2000, 36, 81–87. [Google Scholar] [CrossRef]
- Tibbits, S. The Emergence of “4D Printing”. TED Talk. 2013. Available online: https://www.ted.com/talks/skylar_tibbits_the_emergence_of_4d_printing (accessed on 10 January 2020).
- Ding, Z.; Yuan, C.; Peng, X.; Wang, T.; Qi, H.J.; Dunn, M.L. Direct 4D printing via active composite materials. Sci. Adv. 2017, 3, e1602890. [Google Scholar] [CrossRef]
- Yang, H.; Leow, W.R.; Wang, T.; Wang, J.; Yu, J.; He, K.; Qi, D.; Wan, C.; Chen, X. 3D printed photoresponsive devices based on shape memory composites. Adv. Mater. 2017, 29, 1701627. [Google Scholar] [CrossRef] [PubMed]
- Raviv, D.; Zhao, W.; McKnelly, C.; Papadopoulou, A.; Kadambi, A.; Shi, B.; Hirsch, S.; Dikovsky, D.; Zyracki, M.; Olguin, C. Active printed materials for complex self-evolving deformations. Sci. Rep. 2014, 4, 7422. [Google Scholar] [CrossRef] [PubMed]
- Nadgorny, M.; Xiao, Z.; Chen, C.; Connal, L.A. Three-dimensional printing of pH-responsive and functional polymers on an affordable desktop printer. ACS Appl. Mater. Interfaces 2016, 8, 28946–28954. [Google Scholar] [CrossRef] [PubMed]
- Kollamaram, G.; Croker, D.M.; Walker, G.M.; Goyanes, A.; Basit, A.W.; Gaisford, S. Low temperature fused deposition modeling (FDM) 3D printing of thermolabile drugs. Int. J. Pharm. 2018, 545, 144–152. [Google Scholar] [CrossRef] [PubMed]
- Esposito Corcione, C.; Gervaso, F.; Scalera, F.; Montagna, F.; Sannino, A.; Maffezzoli, A. The feasibility of printing polylactic acid–nanohydroxyapatite composites using a low-cost fused deposition modeling 3D printer. J. Appl. Polym. Sci. 2017, 134, 13. [Google Scholar] [CrossRef]
- Haq, R.H.A.; Rahman, M.N.A.; Ariffin, A.M.T.; Hassan, M.F.; Yunos, M.Z.; Adzila, S. Characterization and Mechanical Analysis of PCL/PLA Composites for FDM Feedstock Filament; IOP Conference Series: Materials Science and Engineering; IOP Publishing: Bristol, UK, 2017. [Google Scholar]
- Ivanov, E.; Kotsilkova, R.; Xia, H.; Chen, Y.; Donato, R.K.; Donato, K.; Godoy, A.P.; Di Maio, R.; Silvestre, C.; Cimmino, S. PLA/graphene/MWCNT composites with improved electrical and thermal properties suitable for FDM 3D printing applications. Appl. Sci. 2019, 9, 1209. [Google Scholar] [CrossRef]
- Bi, H.; Ren, Z.; Guo, R.; Xu, M.; Song, Y. Fabrication of flexible wood flour/thermoplastic polyurethane elastomer composites using fused deposition molding. Ind. Crop. Prod. 2018, 122, 76–84. [Google Scholar] [CrossRef]
- Long, J.; Nand, A.V.; Ray, S.; Mayhew, S.; White, D.; Bunt, C.R.; Seyfoddin, A. Development of customised 3D printed biodegradable projectile for administrating extended-release contraceptive to wildlife. Int. J. Pharm. 2018, 548, 349–356. [Google Scholar] [CrossRef]
- Cuiffo, M.A.; Snyder, J.; Elliott, A.M.; Romero, N.; Kannan, S.; Halada, G.P. Impact of the fused deposition (FDM) printing process on polylactic acid (PLA) chemistry and structure. Appl. Sci. 2017, 7, 579. [Google Scholar] [CrossRef]
- McCullough, E.J.; Yadavalli, V.K. Surface modification of fused deposition modeling ABS to enable rapid prototyping of biomedical microdevices. J. Mater. Process. Technol. 2013, 213, 947–954. [Google Scholar] [CrossRef]
- Domingos, M.; Chiellini, F.; Cometa, S.; De Giglio, E.; Grillo-Fernandes, E.; Bártolo, P.; Chiellini, E. Evaluation of in vitro degradation of PCL scaffolds fabricated via BioExtrusion. Part 1: Influence of the degradation environment. Virtual Phys. Prototyp. 2011, 6, 157–165. [Google Scholar] [CrossRef]
- Srinivas, V.; van Hooy-Corstjens, C.S.; Harings, J.A. Correlating molecular and crystallization dynamics to macroscopic fusion and thermodynamic stability in fused deposition modeling; a model study on polylactides. Polymer 2018, 142, 348–355. [Google Scholar] [CrossRef]
- Reyes-Rodríguez, A.; Dorado-Vicente, R.; Mayor-Vicario, R. Dimensional and form errors of PC parts printed via Fused Deposition Modelling. Procedia Manuf. 2017, 13, 880–887. [Google Scholar] [CrossRef]
- Schwab, H.; Prashanth, K.; Löber, L.; Kühn, U.; Eckert, J. Selective laser melting of Ti-45Nb alloy. Metals 2015, 5, 686–694. [Google Scholar] [CrossRef]
- Kreitcberg, A.; Brailovski, V.; Prokoshkin, S. New biocompatible near-beta Ti-Zr-Nb alloy processed by laser powder bed fusion: Process optimization. J. Mater. Process. Technol. 2018, 252, 821–829. [Google Scholar] [CrossRef]
- Zeng, L.; Xiang, N.; Wei, B. A comparison of corrosion resistance of cobalt-chromium-molybdenum metal ceramic alloy fabricated with selective laser melting and traditional processing. J. Prosthet. Dent. 2014, 112, 1217–1224. [Google Scholar] [CrossRef]
- Ghosh, S.; Abanteriba, S.; Wong, S.; Houshyar, S. Selective laser melted titanium alloys for hip implant applications: Surface modification with new method of polymer grafting. J. Mech. Behav. Biomed. Mater. 2018, 87, 312–324. [Google Scholar] [CrossRef]
- Hui, D.; Goodridge, R.; Scotchford, C.; Grant, D. Laser sintering of nano-hydroxyapatite coated polyamide 12 powders. Addit. Manuf. 2018, 22, 560–570. [Google Scholar] [CrossRef]
- Wiria, F.; Leong, K.; Chua, C.; Liu, Y. Poly-ε-caprolactone/hydroxyapatite for tissue engineering scaffold fabrication via selective laser sintering. Acta Biomater. 2007, 3, 1–12. [Google Scholar] [CrossRef]
- Guo, J.; Bai, J.; Liu, K.; Wei, J. Surface quality improvement of selective laser sintered polyamide 12 by precision grinding and magnetic field-assisted finishing. Mater. Des. 2018, 138, 39–45. [Google Scholar] [CrossRef]
- Zhou, W.; Sun, X.; Kikuchi, K.; Nomura, N.; Yoshimi, K.; Kawasaki, A. In situ synthesized TiC/Mo-based composites via laser powder bed fusion. Mater. Des. 2018, 146, 116–124. [Google Scholar] [CrossRef]
- Gan, M.X.; Wong, C.H. Properties of selective laser melted spodumene glass-ceramic. J. Eur. Ceram. Soc. 2017, 37, 4147–4154. [Google Scholar] [CrossRef]
- Kunce, I.; Polanski, M.; Karczewski, K.; Plocinski, T.; Kurzydlowski, K. Microstructural characterisation of high-entropy alloy AlCoCrFeNi fabricated by laser engineered net shaping. J. Alloy. Compd. 2015, 648, 751–758. [Google Scholar] [CrossRef]
- Ke, D.; Vu, A.A.; Bandyopadhyay, A.; Bose, S. Compositionally graded doped hydroxyapatite coating on titanium using laser and plasma spray deposition for bone implants. Acta Biomater. 2019, 84, 414–423. [Google Scholar] [CrossRef]
- Revathi, A.; Mitun, D.; Balla, V.K.; Dwaipayan, S.; Devika, D.; Manivasagam, G. Surface properties and cytocompatibility of Ti-6Al-4V fabricated using Laser Engineered Net Shaping. Mater. Sci. Eng. C 2019, 100, 104–116. [Google Scholar] [CrossRef]
- Polanski, M.; Kwiatkowska, M.; Kunce, I.; Bystrzycki, J. Combinatorial synthesis of alloy libraries with a progressive composition gradient using laser engineered net shaping (LENS): Hydrogen storage alloys. Int. J. Hydrog. Energy 2013, 38, 12159–12171. [Google Scholar] [CrossRef]
- Fan, Z.; Zhao, Y.; Lu, M.; Huang, H. Yttria stabilized zirconia (YSZ) thin wall structures fabricated using laser engineered net shaping (LENS). Int. J. Adv. Manuf. Technol. 2019, 105, 4491–4498. [Google Scholar] [CrossRef]
- Luong, D.X.; Subramanian, A.K.; Silva, G.A.L.; Yoon, J.; Cofer, S.; Yang, K.; Owuor, P.S.; Wang, T.; Wang, Z.; Lou, J. Laminated Object Manufacturing of 3D-Printed Laser-Induced Graphene Foams. Adv. Mater. 2018, 30, 1707416. [Google Scholar] [CrossRef]
- Das, A.; Madras, G.; Dasgupta, N.; Umarji, A.M. Binder removal studies in ceramic thick shapes made by laminated object manufacturing. J. Eur. Ceram. Soc. 2003, 23, 1013–1017. [Google Scholar] [CrossRef]
- Axelsson, S. Surface Characterization of Titanium Powders with X-ray Photoelectron Spectroscopy. Diploma Work No. 103/2012. Master’s Thesis, Chalmers University of Technology, Gothenburg, Sweden, 2012. [Google Scholar]
- Liu, S.; Ye, F.; Liu, L.; Liu, Q. Feasibility of preparing of silicon nitride ceramics components by aqueous tape casting in combination with laminated object manufacturing. Mater. Des. 2015, 66, 331–335. [Google Scholar] [CrossRef]
- Krinitcyn, M.; Fu, Z.; Harris, J.; Kostikov, K.; Pribytkov, G.A.; Greil, P.; Travitzky, N. Laminated Object Manufacturing of in-situ synthesized MAX-phase composites. Ceram. Int. 2017, 43, 9241–9245. [Google Scholar] [CrossRef]
- Zhao, T.; Yu, R.; Li, X.; Cheng, B.; Zhang, Y.; Yang, X.; Zhao, X.; Zhao, Y.; Huang, W. 4D printing of shape memory polyurethane via stereolithography. Eur. Polym. J. 2018, 101, 120–126. [Google Scholar] [CrossRef]
- Credi, C.; Levi, M.; Turri, S.; Simeone, G. Stereolithography of perfluoropolyethers for the microfabrication of robust omniphobic surfaces. Appl. Surf. Sci. 2017, 404, 268–275. [Google Scholar] [CrossRef]
- Economidou, S.N.; Pere, C.P.P.; Reid, A.; Uddin, M.J.; Windmill, J.F.; Lamprou, D.A.; Douroumis, D. 3D printed microneedle patches using stereolithography (SLA) for intradermal insulin delivery. Mater. Sci. Eng. C 2019, 102, 743–755. [Google Scholar] [CrossRef]
- Park, H.K.; Shin, M.; Kim, B.; Park, J.W.; Lee, H. A visible light-curable yet visible wavelength-transparent resin for stereolithography 3D printing. NPG Asia Mater. 2018, 10, 82. [Google Scholar] [CrossRef]
- Zanchetta, E.; Cattaldo, M.; Franchin, G.; Schwentenwein, M.; Homa, J.; Brusatin, G.; Colombo, P. Stereolithography of SiOC ceramic microcomponents. Adv. Mater. 2016, 28, 370–376. [Google Scholar] [CrossRef]
- Huang, R.-J.; Jiang, Q.-G.; Wu, H.-D.; Li, Y.-H.; Liu, W.-Y.; Lu, X.-X.; Wu, S.-H. Fabrication of complex shaped ceramic parts with surface-oxidized Si3N4 powder via digital light processing based stereolithography method. Ceram. Int. 2019, 45, 5158–5162. [Google Scholar] [CrossRef]
- Azarmi, F.; Amiri, A. Microstructural evolution during fabrication of alumina via laser stereolithography technique. Ceram. Int. 2019, 45, 271–278. [Google Scholar] [CrossRef]
- Salaoru, I.; Zhou, Z.; Morris, P.; Gibbons, G.J. Inkjet printing of polyvinyl alcohol multilayers for additive manufacturing applications. J. Appl. Polym. Sci. 2016, 133, 25. [Google Scholar] [CrossRef]
- Edinger, M.; Bar-Shalom, D.; Rantanen, J.; Genina, N. Visualization and non-destructive quantification of inkjet-printed pharmaceuticals on different substrates using Raman spectroscopy and Raman chemical imaging. Pharm. Res. 2017, 34, 1023–1036. [Google Scholar] [CrossRef]
- Castro, M.; Rodríguez-González, P.; Barreiro, J.; Fernández-Abia, A. Behaviour of infiltrating materials on Calcium Sulphate hemihydrate parts made by 3D printing. Procedia Manuf. 2017, 13, 848–855. [Google Scholar] [CrossRef]
- Kim, G.H.; Kim, H.S.; Shin, H.S.; Du Ahn, B.; Kim, K.H.; Kim, H.J. Inkjet-printed InGaZnO thin film transistor. Thin Solid Films 2009, 517, 4007–4010. [Google Scholar] [CrossRef]
- Vaithilingam, J.; Saleh, E.; Körner, L.; Wildman, R.D.; Hague, R.J.; Leach, R.K.; Tuck, C.J. 3-Dimensional inkjet printing of macro structures from silver nanoparticles. Mater. Des. 2018, 139, 81–88. [Google Scholar] [CrossRef]
- Miao, S.; Zhu, W.; Castro, N.J.; Nowicki, M.; Zhou, X.; Cui, H.; Fisher, J.P.; Zhang, L.G. 4D printing smart biomedical scaffolds with novel soybean oil epoxidized acrylate. Sci. Rep. 2016, 6, 27226. [Google Scholar] [CrossRef]
- Kuang, X.; Chen, K.; Dunn, C.K.; Wu, J.; Li, V.C.; Qi, H.J. 3D printing of highly stretchable, shape-memory, and self-healing elastomer toward novel 4D printing. ACS Appl. Mater. Interfaces 2018, 10, 7381–7388. [Google Scholar] [CrossRef]
- Shie, M.-Y.; Chang, W.-C.; Wei, L.-J.; Huang, Y.-H.; Chen, C.-H.; Shih, C.-T.; Chen, Y.-W.; Shen, Y.-F. 3D printing of cytocompatible water-based light-cured polyurethane with hyaluronic acid for cartilage tissue engineering applications. Materials 2017, 10, 136. [Google Scholar] [CrossRef]
- Rahi, S.K.; Hassan, E.S.; Abd, A.N. Spectroscopic Methods Studies in Polymer. World Sci. News 2016, 42, 41–53. [Google Scholar]
- Rieppo, L.; Töyräs, J.; Saarakkala, S. Vibrational spectroscopy of articular cartilage. Appl. Spectrosc. Rev. 2016, 52, 249–266. [Google Scholar] [CrossRef]
- Martin, B.; Puentes, J.; Wruck, L.; Osswald, T.A. Degree of cure of epoxy/acrylic photopolymers: Characterization with raman spectroscopy and a modified phenomenological model. Polym. Eng. Sci. 2018, 58, 228–237. [Google Scholar] [CrossRef]
- Hu, Z.; Chen, F.; Xu, J.; Nian, Q.; Lin, D.; Chen, C.; Zhu, X.; Chen, Y.; Zhang, M. 3D printing graphene-aluminum nanocomposites. J. Alloy. Compd. 2018, 746, 269–276. [Google Scholar] [CrossRef]
- Desimoni, E.; Brunetti, B. X-ray photoelectron spectroscopic characterization of chemically modified electrodes used as chemical sensors and biosensors: A review. Chemosensors 2015, 3, 70–117. [Google Scholar] [CrossRef]
- Khaled, S.A.; Alexander, M.R.; Wildman, R.D.; Wallace, M.J.; Sharpe, S.; Yoo, J.; Roberts, C.J. 3D extrusion printing of high drug loading immediate release paracetamol tablets. Int. J. Pharm. 2018, 538, 223–230. [Google Scholar] [CrossRef] [PubMed]
- Clark, E.A.; Alexander, M.R.; Irvine, D.J.; Roberts, C.J.; Wallace, M.J.; Sharpe, S.; Yoo, J.; Hague, R.J.; Tuck, C.J.; Wildman, R.D. 3D printing of tablets using inkjet with UV photoinitiation. Int. J. Pharm. 2017, 529, 523–530. [Google Scholar] [CrossRef] [PubMed]
- Boetker, J.; Water, J.J.; Aho, J.; Arnfast, L.; Bohr, A.; Rantanen, J. Modifying release characteristics from 3D printed drug-eluting products. Eur. J. Pharm. Sci. 2016, 90, 47–52. [Google Scholar] [CrossRef] [PubMed]
- Kyobula, M.; Adedeji, A.; Alexander, M.R.; Saleh, E.; Wildman, R.; Ashcroft, I.; Gellert, P.R.; Roberts, C.J. 3D inkjet printing of tablets exploiting bespoke complex geometries for controlled and tuneable drug release. J. Control. Release 2017, 261, 207–215. [Google Scholar] [CrossRef] [PubMed]
- Santos, C.F.; Silva, A.P.; Lopes, L.; Pires, I.; Correia, I.J. Design and production of sintered β-tricalcium phosphate 3D scaffolds for bone tissue regeneration. Mater. Sci. Eng. C 2012, 32, 1293–1298. [Google Scholar] [CrossRef]
- Dávila, J.; Freitas, M.S.D.; Inforçatti, N.P.; Silveira, Z.D.C.; Silva, J.V.L.D.; D’Ávila, M.A. Fabrication of PCL/β-TCP scaffolds by 3D mini-screw extrusion printing. J. Appl. Polym. Sci. 2016, 133. [Google Scholar] [CrossRef]
- Trelewicz, J.R.; Halada, G.P.; Donaldson, O.K.; Manogharan, G. Microstructure and corrosion resistance of laser additively manufactured 316L stainless steel. JOM 2016, 68, 850–859. [Google Scholar] [CrossRef]
- Taylor, S.L.; Ibeh, A.J.; Jakus, A.E.; Shah, R.N.; Dunand, D.C. NiTi-Nb micro-trusses fabricated via extrusion-based 3D-printing of powders and transient-liquid-phase sintering. Acta Biomater. 2018, 76, 359–370. [Google Scholar] [CrossRef]
- Branco, A.C.; Silva, R.; Santos, T.; Jorge, H.; Rodrigues, A.R.; Fernandes, R.; Bandarras, S.; Barahona, I.; Matos, A.P.A.; Lorenz, K.; et al. Suitability of 3D printed pieces of nanocrystalline zirconia for dental applications. Dent. Mater. 2020, 36, 442–455. [Google Scholar] [CrossRef]
- Galante, R.; Figueiredo-Pina, C.G.; Serro, A.P. Additive manufacturing of ceramics for dental applications: A review. Dent. Mater. 2019, 35, 825–846. [Google Scholar] [CrossRef] [PubMed]
- Nagarath, M.; Sikora, A.; Graca, J.; Chinnici, J.L.; Rahman, S.U.; Reddy, S.G.; Ponnusamy, S.; Maddi, A.; Arany, P.R. Functionalized prosthetic interfaces using 3D printing: Generating infection-neutralizing prosthesis in dentistry. Mater. Today Commun. 2018, 15, 114–119. [Google Scholar] [CrossRef]
- Lima, D.D.; Mantri, S.A.; Mikler, C.V.; Contieri, R.; Yannetta, C.J.; Campo, K.N.; Lopes, E.S.; Styles, M.J.; Borkar, T.; Caram, R.; et al. Laser additive processing of a functionally graded internal fracture fixation plate. Mater. Des. 2017, 130, 8–15. [Google Scholar] [CrossRef]
- Zanocco, M.; Boschetto, F.; Zhu, W.; Marin, E.; McEntire, B.J.; Bal, B.S.; Adachi, T.; Yamamoto, T.; Kanamura, N.; Ohgitani, E.; et al. 3D-additive deposition of an antibacterial and osteogenic silicon nitirde coating on orthopedic titanium substrate. J. Mech. Behav. Biomed. Mater. 2020, 103, 103557. [Google Scholar] [CrossRef]
- Ghosh, S.; Abanteriba, S.; Wong, S.; Brkljaca, R.; Houshyar, S. Optimisation of grafted phosphorcholine-based polymer on additively manufactured titanium substrate for hip arthroplastry. Mater. Sci. Eng. C 2019, 101, 696–706. [Google Scholar] [CrossRef]
- Hu, Z.; Chen, F.; Lin, D.; Nian, Q.; Parandoush, P.; Zhu, X.; Shao, Z.; Cheng, G.J. Laser additive manufacturing bulk graphene–copper nanocomposites. Nanotechnology 2017, 28, 445705. [Google Scholar] [CrossRef]
- Wang, X.; Jiang, M.; Zhou, Z.; Gou, J.; Hui, D. 3D printing of polymer matrix composites: A review and prospective. Compos. Part B Eng. 2017, 110, 442–458. [Google Scholar] [CrossRef]
- Appleyard, D. Powering up on powder technology. Met. Powder Rep. 2015, 70, 285–289. [Google Scholar] [CrossRef]
- Watkins, T.; Bilheux, H.; An, K.; Payzant, A.; Dehoff, R.; Duty, C.; Peter, W.; Blue, C.; Brice, C.A. Neutron characterization for additive manufacturing. Adv. Mater. Process. 2013, 23–27. [Google Scholar]
- Fujii, H.T.; Goto, Y.; Sato, Y.S.; Kokawa, H. Microstructure and lap shear strength of the weld interface in ultrasonic welding of Al alloy to stainless steel. Scr. Mater. 2016, 116, 135–138. [Google Scholar] [CrossRef]
- Xing, H.; Zou, B.; Lai, Q.; Huang, C.; Chen, Q.; Fu, X.; Shi, Z. Preparation and characterization of UV curable Al2O3 suspensions applying for stereolithography 3D printing ceramic microcomponent. Powder Technol. 2018, 338, 153–161. [Google Scholar] [CrossRef]
- Sun, B.; Kulinsky, L. Fabrication of regular polystyrene foam structures with selective laser sintering. Mater. Today Commun. 2017, 13, 346–353. [Google Scholar] [CrossRef]
- Manapat, J.Z.; Mangadlao, J.D.; Tiu, B.D.B.; Tritchler, G.C.; Advincula, R.C. High-strength stereolithographic 3D printed nanocomposites: Graphene oxide metastability. ACS Appl. Mater. Interfaces 2017, 9, 10085–10093. [Google Scholar] [CrossRef] [PubMed]
- O’Connor, H.J.; Dickson, A.N.; Dowling, D.P. Evaluation of the mechanical performance of polymer parts fabricated using a production scale multi jet fusion printing process. Addit. Manuf. 2018, 22, 381–387. [Google Scholar] [CrossRef]
- Mani, M.; Lane, B.M.; Donmez, M.A.; Feng, S.C.; Moylan, S.P. A review on measurement science needs for real-time control of additive manufacturing metal powder bed fusion processes. Int. J. Prod. Res. 2016, 55, 1400–1418. [Google Scholar] [CrossRef]
- Tofail, S.A.; Koumoulos, E.P.; Bandyopadhyay, A.; Bose, S.; O’Donoghue, L.; Charitidis, C. Additive manufacturing: Scientific and technological challenges, market uptake and opportunities. Mater. Today 2018, 21, 22–37. [Google Scholar] [CrossRef]
- Hahnlen, R.; Dapina, M.J. NiTi-Al interface strength in ultrasonic additive manufacturing composites. Compos. Part. B 2014, 59, 101–108. [Google Scholar] [CrossRef]
- Palanivel, S.; Nelaturu, P.; Glass, B.; Mishra, R.S. Friction stir additive manufacturing for high structural performance through microstructural control in an Mg based WE43 alloy. Mater. Des. 2015, 65, 934–952. [Google Scholar] [CrossRef]
- Honarvar, F.; Varvani-Farahani, A. A review of ultrasonic testing applications in additive manufacturing: Defect evaluation, material characterization, and process control. Ultrasonic 2020, 108, 106227. [Google Scholar] [CrossRef]
- Tomata, Y. Crystallographic characterization of steel microstructure using neutron diffraction. Sci. Technol. Adv. Mater. 2019, 20, 1189–1206. [Google Scholar] [CrossRef]
- Rossin, J.; Goodlet, B.; Torbet, C.; Musinski, W.; Cox, M.; Miller, J.; Groeber, M.; Mayes, A.; Biedermann, E.; Smith, S.; et al. Assessment of grain structure in additively manufactured nickel alloys. Mater. Charact. 2020, 167, 110501. [Google Scholar] [CrossRef]
- Lednev, V.N.; Tretyakov, R.S.; Sdvizhenskii, P.A.; Grishin, M.Y.; Asyutin, R.D.; Pershin, S.M. Laser induced breakdown spectroscopy for in situ multielemental analysis during additive manufacturing process. J. Phys. Conf. Ser. 2018, 1109, 012050. [Google Scholar] [CrossRef]
- Lednev, V.N.; Sdvizhenskii, P.A.; Asyutin, R.D.; Tretyakov, S.M.; Grishin, M.Y.; Stavertiy, A.Y.; Pershin, S.M. In situ multi-elemental analysis by laser breakdown spectroscopy in additive manufacturing. Addit. Manuf. 2019, 25, 64–70. [Google Scholar] [CrossRef]
- Zhang, C.; Gao, M.; Chen, C.; Zeng, X. Spectral diagnosis of wire arc additive manufacturing of Al alloys. Addit. Manuf. 2019, 30, 100869. [Google Scholar] [CrossRef]


| Sector | Company/Institute | Year | AM technique and Materials | Development | Parts Function |
|---|---|---|---|---|---|
| Consumer goods | Holthinrichs Watches | 2017 | Laser powder bed fusion; stainless steel 316L. | Parts for limited edition watches [7]. | 3D printed case, crown and buckle. |
| Nuclear energy | US Department of Energy | 2018 | Dissolvable materials. | Nuclear plant components [8]. | Dissolvable supports with improved topology and microstructure. |
| Manufacturing | Renishaw | 2019 | N/A | Parts for arm powered bike [9] | Central titanium support (CTS) |
| Manufacturing | Siemens | 2019 | N/A | Components for aeroderivative gas turbine [10]. | Dry low emission (DLE) pre-mixer |
| Catalysts | Flemish Institute for Technological Research | 2019 | 3D fibre deposition technique; Ni-alumina catalysts | Ni-alumina-based catalysts for CO2 methanation [11]. | CO2 conversion and selectivity to methane |
| AM Techniques | Input Stock | Working Principle | Advantages | Disadvantages | Materials | Spectroscopic Characterisations | |
|---|---|---|---|---|---|---|---|
| Class | Specifications | ||||||
| FDM | Solid | Thermal fusion; Nozzle extrusion deposition. | Low cost; High speed/ | Limited to thermal-stable substances; Mechanical weakness; Rough appearance; Limited to thermoplastic materials. | Composite | Vinylpyrrolidone—vinyl acetate copolymers and polyvinyl pyrrolidone loaded with mannitol, ramipril and magnesium carbonate [36] Polylactic acid with nanohydroxyapatite [37] Polycaprolactone and polylactic acid composites [38] polylactic acid with graphene nanoplates/multi-walled carbon nanotubes [39] wood flour with thermoplastic polyurethane [40] | FTIR [38,40,41,42,43] Raman [36,39,42] XPS [40,42,44] EDXS [37,44] |
| Polymer | Polylactic acid [42,45] Polycarbonate [46] poly (acrylonitrile butadiene styrene) [43] poly(ϵ-caprolactone) [44] | ||||||
| Powder bed fusion | Powder | Laser sintering/fusion; Local in situ fusion; Material powder bed. | Wide materials choices; Good mechanical consolidation | Limited accuracy; Required gas atmosphere; Undesired porosity and balling; Residual stresses, Cracks or layer delamination; Microstructure inhomogeneity | Alloy | Titanium alloys (Ti-45Nb) [47] Titanium-zirconium-niobium [48] Cobalt-chromium-molybdenum [49] | FTIR [50,51,52] Raman [53,54] XPS [49,50,53] EDXS [47,48,50,54,55] |
| Composite | Titanium alloy (Ti-6Al-4V) with poly (2-methacryloyloxyethyl phosphorylcholine) [50] Carbon nanotube/molybdenum-titanium-aluminium [54] Polyamide 12 coated with hydroxyapatite nanoparticles [51] Poly-ε-caprolactone and hydroxyapatite [52] | ||||||
| Polymer | Polyamide 12 [53] | ||||||
| Ceramic | Spodumene powder [55] | ||||||
| LENS | Powder | Laser melting; Local powder feeding. | Repairing parts; Material graded deposition; | Stress residuals | Alloy | AlCoCrFeNi [56] Hydroxyapatite coating on titanium alloy (ti6al4v) [57] Titanium powder [58] Fe–Ti alloys [59] | FTIR [57] Raman [60] UV-vis spectroscopy [57] XPS [58] EDXS [56,59] |
| Ceramic | Yttria stabilised zirconia [60] | ||||||
| LOM | Solid | CO2 laser melting; Laminated layer building and adhesion. | Large object manufacture; low cost. | Low surface definition; challenge in complex internal structures. | Graphene | Laser-introduced graphene [61] | FTIR [62] Raman [61] XPS [61,63] EDXS [64,65] |
| Alloy | Titanium alloy (Ti-6Al-4V) [63] | ||||||
| Ceramic | Titanium carbide—silicon carbide [65] Silicon nitride [64] Alumina [62] | ||||||
| SLA | Liquid | Liquid monomers by UV polymerisation; laser beam solidification. | High printing accuracy and smooth finishing | High cost; time consuming processing; brittle components; very limited choice of raw materials (only UV-resistant) | Polymer | Polyurethane acrylate, epoxy acrylate, isobornyl acrylate [66] Perfluoropolyether [67] Resin [68,69] | FTIR [66,70,71] Raman [68] UV-vis spectroscopy [67,69] XPS [71] EDXS [72] |
| Ceramic | Alumina [72] Silicon oxycarbide [70] Silicon nitride [71] | ||||||
| Inkjet printing | Powder | Ceramic ink droplets; solidification by drying liquid layers. | Complex structures; | Expensive ink; limited in high volume manufacturing; low printing speed. | Polymer | Polyvinyl alcohol [73] | FTIR [73,74] Raman [74,75] XPS [76] EDXS [75,77] |
| Ceramic | Alumina [77] Calcium sulphate hemihydrate [75] | ||||||
| Composite | Lactic acid and ethanol [74] Indium nitrate hydrate, gallium nitrate hydrate and zinc acetate dihydrate [76] | ||||||
| 4D printing | Solid | Using 3D printing facility and smart materials to achieve a stimulation-responded structure. | Self-assembly; reconfiguration; transformation (save space for storage/transport); multi-functionality; self-repairing. | Based on the 3D printing techniques involved. | Temperature-responsive | Soybean oil epoxidised acrylate [78] PCL-based resin [79] | FTIR [20,35,66,78,79] UV-vis spectroscopy [35] Raman [80] EDXS [35] |
| Light-responsive | Polyurethane acrylate with epoxy acrylate, isobornyl acrylate and radical photoinitiator [66] Polyurethane [80] | ||||||
| Water-responsive | Poly(N,N-dimethyl acrylamide-co-stearyl acrylate) [20] | ||||||
| pH-responsive | Poly(2-vinylpyridine) with addition of 12% acrylonitrile−butadiene−styrene (ABS) [35] | ||||||
| Spectroscopy | Wave Propagation Principle | Effective Penetration Depth | Materials Analysed | Sample Preparation | AM Process-Control Loop | Spectroscopy Function | Diagnosis by Spectroscopy in AM Process |
|---|---|---|---|---|---|---|---|
| FTIR | Refraction | 0.5–3 µm | Polymers, ceramics | FTIR spectrometer equipped with attenuated total reflectance accessory is capable of analyzing solids and requires minimal sample preparation. A small piece of specimen is placed directly on the stage for analysis. | Pre-processing | Elemental, molecular characters and functional bonding; predict potential reactions. | Raw material blending; additive homogeneity. |
| In-processing | Stability or chemical bonding changes. | Proper temperature control; degradation of feeding materials. | |||||
| Post-processing | Interactions between materials; phase solubility/precipitation. | Degradation or changes in materials properties; blending uniformity. | |||||
| Raman | Diffraction | 0.2–10 µm | Polymers, ceramics | Sample areas from 200 × 200 µm2 up to 50 × 50 mm2 can be scanned. Essentially no sample preparation is required. A small piece of specimen is placed of the sample stage for analysis. | Pre-processing | Molecular and bonding. | Raw material blending; additive homogeneity. |
| In-processing | Microstructure, gains, cracks, imperfections. | Influence of local heating; interfacial interaction between layer to layer; structural defect. | |||||
| Post-processing | Stability, existence/distribution of additives. | Degradation or changes in materials properties; dispersion guidelines. | |||||
| UV-vis spectroscopy | Refraction | 1–10 µm | Polymers, ceramics | Thin transparent films can be directly analyzed in the transmission mode. Diffuse reflectance mode can be employed for solid samples. Powders are diluted with a barium sulfate standard | Pre-processing | Elemental information | Raw material selection. |
| In-processing | Stability or chemical bonding changes. | Degradation or changes in materials properties; bonding development or disruption during fusion. | |||||
| Post-processing | Chemical or bonding changes | Materials property evaluation; absorbance assessment; functionality. | |||||
| XPS | Diffraction | 1–10 nm | Polymers, ceramics, metals | Minimal sample preparation is required. Powders are pressed into clean indium foils. Solid samples are secured on the sample holder using carbon tapes. | Pre-processing | Elemental and molecular characters, chemical bonding. | Raw material selection and blending; addictive homogeneity. |
| In-processing | Chemical changes in materials | Degradation/changes in materials properties; influence of local heating on materials. | |||||
| Post-processing | Chemical changes; molecular bonding changes. | Degradation/changes in materials properties; metal oxidation. | |||||
| EDXS | Diffraction | 1–2 µm | Polymers, ceramics, metals | Small pieces fo solid samples are secured on the sample stubs with carbon tapes. Non-conductive samples are usually coated with gold or platinum particles. | Pre-processing | Elemental and molecular characters, chemical bonding. | Dispersion guidelines; material blending and selection assessment. |
| In-processing | Bond regions, distribution of elements. | Influence of local heating; interfacial interaction between layer to layer; interlayer adhesion; Insufficient fusion or melt; flow rate control. | |||||
| Post-processing | Elemental composition, atom structure, distribution map. | Porosity or structural defect; functionality; dispersion assessment. |
Publisher’s Note: MDPI stays neutral with regard to jurisdictional claims in published maps and institutional affiliations. |
© 2021 by the authors. Licensee MDPI, Basel, Switzerland. This article is an open access article distributed under the terms and conditions of the Creative Commons Attribution (CC BY) license (http://creativecommons.org/licenses/by/4.0/).
Share and Cite
Long, J.; Nand, A.; Ray, S. Application of Spectroscopy in Additive Manufacturing. Materials 2021, 14, 203. https://doi.org/10.3390/ma14010203
Long J, Nand A, Ray S. Application of Spectroscopy in Additive Manufacturing. Materials. 2021; 14(1):203. https://doi.org/10.3390/ma14010203
Chicago/Turabian StyleLong, Jingjunjiao, Ashveen Nand, and Sudip Ray. 2021. "Application of Spectroscopy in Additive Manufacturing" Materials 14, no. 1: 203. https://doi.org/10.3390/ma14010203
APA StyleLong, J., Nand, A., & Ray, S. (2021). Application of Spectroscopy in Additive Manufacturing. Materials, 14(1), 203. https://doi.org/10.3390/ma14010203