Article

Predicting the Thermodynamic Ideal Glass Transition Temperature in Glass-Forming Liquids

School of Materials and Chemical Engineering, Xi’an Technological University, Xi’an 710021, China
*
Author to whom correspondence should be addressed.
Materials 2020, 13(9), 2151; https://doi.org/10.3390/ma13092151
Submission received: 7 April 2020 / Revised: 28 April 2020 / Accepted: 1 May 2020 / Published: 6 May 2020

Abstract

:
The Kauzmann temperature TK is a lower limit of glass transition temperature, and is known as the ideal thermodynamic glass transition temperature. A supercooled liquid will condense into glass before TK. Studying the ideal glass transition temperature is beneficial to understanding the essence of glass transition in glass-forming liquids. The Kauzmann temperature TK values are predicted in 38 kinds of glass-forming liquids. In order to acquire the accurate predicted TK by using a new deduced equation, we obtained the best fitting parameters of the deduced equation with the high coefficient of determination (R2 = 0.966). In addition, the coefficients of two reported relations are replaced by the best fitting parameters to obtain the accurate predicted TK, which makes the R2 values increase from 0.685 and 0.861 to 0.970 and 0.969, respectively. Three relations with the best fitting parameters are applied to obtain the accurate predicted TK values.

1. Introduction

If crystallization can be avoided by sufficiently rapid cooling, a supercooled liquid will become a glassy state at glass transition temperature Tg, at which the viscosity of the supercooled liquid is typically 1012 Pa s (10 poise = 1 Pa s) [1,2,3,4,5]. Liquid–glass transitions are generally observed in various supercooled liquids, including molecular liquids, ionic liquids, metallic liquids, oxides, and chalcogenides [5,6]. Figure 1 shows the temperature dependence of the entropy difference between various supercooled liquids and their crystalline phases [5,7]. With temperature decreases, their entropic surplus is consumed, and the glass transition sets in when the slope of the curve changes. For lactic acid, its glass transition temperature Tg has been marked in Figure 1. Its curve can then be extrapolated to the Kauzmann temperature TK, at which point ΔS will vanish. In other words, the entropy of the supercooled liquid equals the entropy of its crystalline counterpart at TK. Below TK, the entropy of the supercooled liquid will become less than that of its crystalline phase. However, it is difficult to see how a disordered and nonperiodic liquid has a lower entropy than a periodic crystal of the same density [8]. As a consequence, Kauzmann temperature TK is a lower limit of glass transition temperature (i.e., the thermodynamic ideal glass transition temperature) and the supercooled liquid will condense into glass, having the same entropy as the perfect crystal at TK [8].
The glass transition temperature Tg plays an important role in liquid–glass transition. Tg has significant thermophysical properties for predicting glass-forming ability (GFA) and the stability of glass formers. Thermodynamically, the lowest value of Tg is the Kauzmann temperature TK for a certain glass-forming liquid. In other words, the Kauzmann temperature TK is the lowest temperature at which a supercooled liquid can exist. The Kauzmann temperature TK is studied, which is beneficial to understand the nature of glass transition, and to find a correlation between the measured glass transition temperature Tg and the thermodynamically ideal glass transition temperature TK. In addition, it can be seen that fragility parameter m is related to Tg and TK (see below). The fragility parameter m is applied to describe the degree of departure from an Arrhenius relation of the temperature dependence of viscosity. That is, Tg and TK can also be applied to describe the temperature dependence of viscosity in glass-forming liquids. Therefore, studying the temperature TK is a classic problem in amorphous materials. TK temperatures in various glass-forming liquids have been calculated, such as in metallic liquids [4,9,10,11,12,13,14,15,16], molecular liquids [6,17], ionic liquids [6,17], and oxides [6,12]. The Kauzmann temperature TK will be predicted by Tg and m in glass-forming liquids.

2. Expressions of Predicting TK

Universally, TK can be acquired by [5,9,11,14,18]:
Δ S m = T K T m Δ c p l c ( T ) T d T
where ΔSm is the entropy of fusion at the melting point Tm, and Δcpl-c(T) is the specific heat capacity difference between the supercooled liquid and its crystalline counterpart. If ΔSm and Δcpl-c(T) are acquired, TK will be calculated. The entropy of fusion ΔSm, can be obtained by ΔSmHm/Tm, where ΔHm is the heat of fusion, which can be obtained by the integration of the melting peak [19]. The so-called “step method”, which consists of heating the sample to a certain temperature with a constant rate, and then annealing isothermally during each step, can be applied to determine the specific heat capacity of the sample on heating, in reference to the specific heat capacity of a standard sapphire [4,15]. The data of cp(T)sample can be calculated by the following equations [4,15]:
c p ( T ) sample = Q s a m p l e Q p a n Q s a p p h i r e Q p a n × m sapphire × μ sample m sample × μ sapphire × c p ( T ) sapphire
where cp(T)sample and cp(T)sapphire are the specific heat capacity of sample and sapphire, respectively, mi the mass, μi the mole mass, and Q i the heat flux. Meanwhile, the temperature dependence of the specific heat capacity cpliquid(T) of the supercooled liquid can be expressed as [4,11,15]:
c p ( T ) = 3 R + a T + b T 2
where R is gas constant. The specific heat capacity cpcrystal(T) of the crystal can be expressed as [4,11,15]:
c p ( T ) = 3 R + c T + d T 2
The parameters of expressions for cpliquid(T) and cpcrystal(T) can be determined by fitting the data measured in steps in reference to sapphire. Therefore, the specific heat capacity difference between the supercooled liquid and its crystalline counterpart can be calculated by Equations (3) and (4), with the known parameters. TK can be calculated by the above formulas so far. From the above analysis, acquiring the Kauzmann temperature TK is cumbersome and time-consuming. Therefore, the easily obtained parameters are applied to predict TK.
The Angell’s fragility parameter m, based on viscosity or relaxation time, is defined as [1,20,21,22,23]:
m = d lg ( η ) d ( T g / T ) | T = T g = d lg ( τ ) d ( T g / T ) | T = T g = D T 0 T g ( T g T 0 ) 2 ln ( 10 )
A similar fragility has been defined as [17]:
m S = d [ lg ( η ( T ) ) / η 0 lg ( η ( T g ) / η 0 ) ] d ( T g / T ) | T = T g = m m min
where mmin = log10(ηg/η0). ηg denotes viscosity (typically 1012 Pa s) at glass transition temperature Tg. η0 is the high temperature limit of viscosity, which can be determined by the following equation [2,24]:
η 0 = h N A ρ / M
where h is Planck’s constant, NA is Avogadro’s number, ρ is the density of the liquid and M is the molar mass. The η0 value is about set as 10−5 Pa s [2,17,24,25,26]. Thus, generally, the log10(ηg/η0) value is equal to 17. The expressions related to TK have been studied, and they can be utilized to calculate TK, which make calculation simpler. TK as a function of Tg and Angell’s fragility parameter m has been reported, and the expression can be described by [1,16,17,25]:
m s = m m min = T g T g T K
From Equation (8), TK can be expressed as:
T K = T g m min T g / m
The other expression of TK as a function of Tg and m can be expressed as [1,16,17,25]:
m s = m m min = T g 2 + T K 2 T g 2 T K 2
Equation (10) is transformed into:
T K = T g × [ ( m m min ) / ( m + m min ) ] 1 / 2
Furthermore, a new expression of predicting TK as a function of Tg and m is also deduced by us, and this expression is derived as follows. Another expression of the Kauzmann temperature is presented by [27]:
T K = T m ( 1 + Δ H m T g Δ c p l c ( T g ) ) 1
Additionally, m can be calculated by the following Equation [27]:
m = Λ a Δ c p l g ( T g ) Δ S m
where Λa is the constant and equals 40. Δcpl-g(Tg)=cpliquid(Tg)-cpglass(Tg) is the specific heat capacity difference between the supercooled liquid and its glass state at Tg. When Δcpl-g(Tg) is replaced by Δcpl-c(Tg), the numerical factor would increase from 40 to 43, but the quality of the correlation remains unchanged, where Δcpl-c(Tg)=cpliquid(Tg)-cpcrystal(Tg) is the specific heat capacity difference between the supercooled liquid and its crystalline counterpart at Tg [27]. Hence, Δcpl-g(Tg) is replaced by Δcpl-c(Tg), and m can be expressed as:
m = Λ b Δ c p l c ( T g ) Δ S m
where Λb is the constant and equals 43. The ratio Tm/Tg is about constant Λc, which equals 3/2 [27,28,29,30]. Plugging this Tm/Tg relation into Equation (14):
m = Λ b Λ c T g Δ c p l c ( T g ) Δ H m
From Equation (12) and Equation (15), we obtain:
T K = Λ c T g ( 1 + Λ b Λ c m ) 1 = Λ c T g ( m m + Λ b Λ c )
The expanded Equation (16) can be expressed by:
T K = Λ c T g Λ b Λ c 2 T g m + Λ b Λ c
It can be seen that these expressions of predicting TK are expressed as the function of Tg and m from Equations (9), (11), and (17). Because Tg and m have been reported for a lot of glass-forming liquids, predicting TK will be made simpler and more convenient by the above formulae.

3. Methods

As can be seen from the above, Equations (9), (11), and (17) can be applied to predict TK. In order to obtain accurate TK values, the coefficient of determination, R2 is applied to evaluate the accuracy of the predicted TK. In statistics, generally, R2 is defined as: R2 = 1−SSres/SStot, where SSres is the sum of squares of residuals and SStot is the total sum of squares. R2 is a statistical measure of how well the predicted TK values approximate the reported TK values. The higher is the R2 value (0 ≤ R2 ≤ 1), the more accurate is the predicted TK. The predicted TK values perfectly fit the reported TK when R2 equals 1.

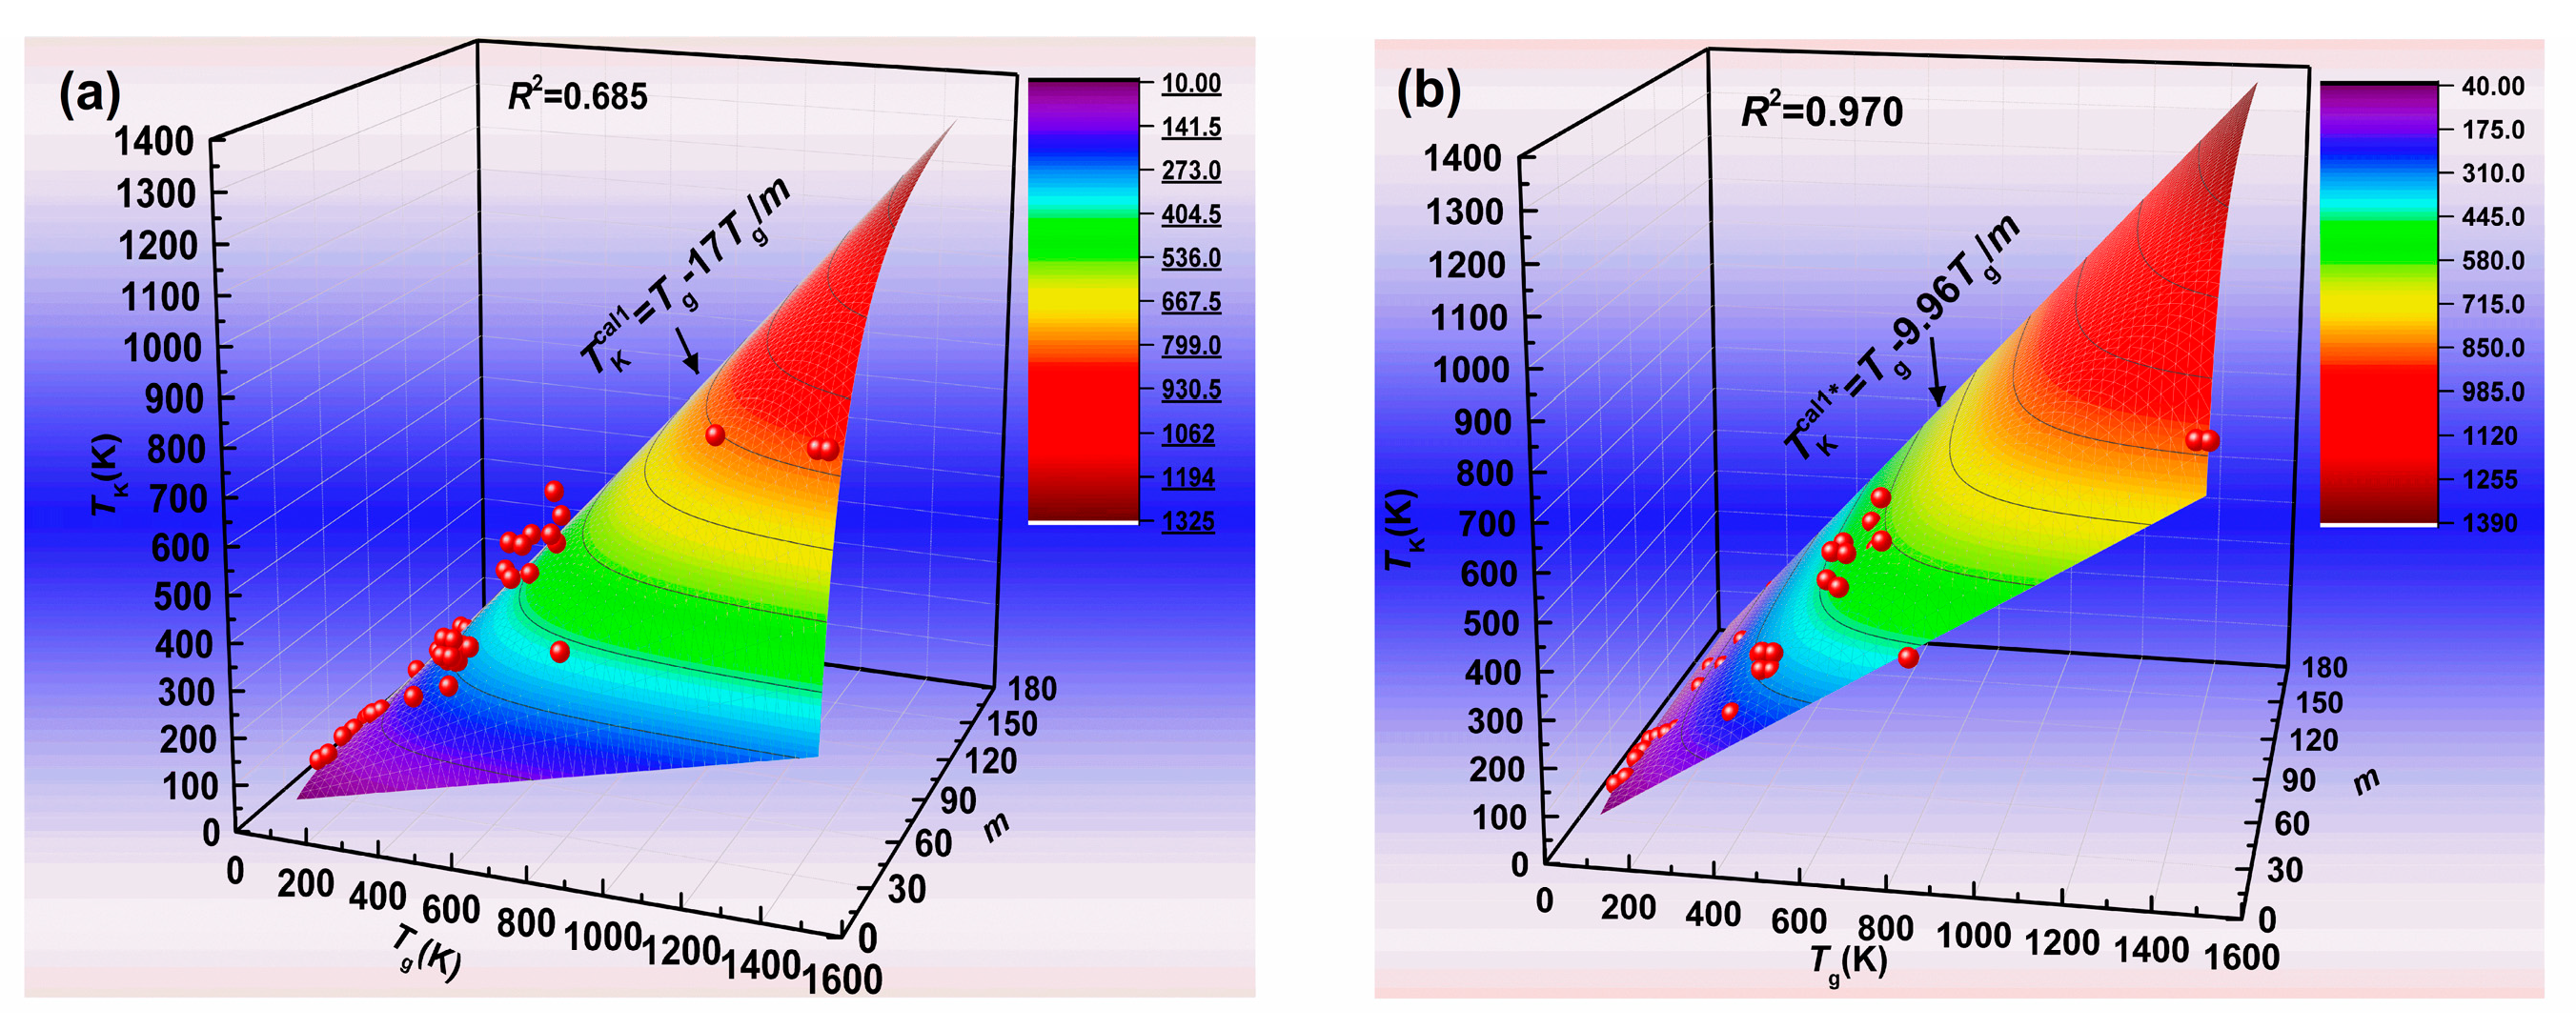
4. Results and Discussion

The values of the glass transition temperature Tg, Angell’s fragility parameter m, and the Kauzmann temperature TK for various glass formers are listed in Table 1. Figure 2a shows the predicted Kauzmann temperature TKcal1, according to Equation (9) at mmin = 17. Many reported TK values for various glass formers do not fall on the curve of the predicted TKcal1. Meanwhile, the R2 value of this correlation equals 0.685, which is relatively low. It indicates that the predicted TKcal1 values by using Equation (9) at mmin = 17 are inaccurate. Although the log10(ηg/η0) (i.e., mmin) value is generally equal to 17, the viscosity change in the glass transition is approximately two orders of magnitude [16,18]. Therefore, the log10(ηg/η0) value is considered to have a range from 15 to 17 [16]. In fact, generally, the η0 value is set as about 10−5 Pa s, but η0 values have differences in some amorphous materials [31]. This will cause a change of the log10(ηg/η0) value as well. In our previous study, the log10(ηg/η0) value is considered to have a range from 14 to 18 [32]. As a result, the mmin value slightly fluctuates. In order to obtain the most accurate predicted Kauzmann temperature by using Equation (9), we regard the mmin value as a fitting parameter, which has no restrictions, and can be an arbitrary value. Therefore, we obtain the best fit and the most accurate predicted Kauzmann temperature TKcal1* by using Equation (9), when mmin equals 9.96. Although there is a difference between this value (mmin = 9.96) and the mmin value obtained by ηg and η0 of the amorphous materials, and this value may not have a physical meaning, the most accurate TKcal1* by using Equation (9) at mmin = 9.96 can be obtained. Our purpose is to make the Kauzmann temperature accurately predictable, so it is feasible that the most accurate predicted Kauzmann temperature TKcal1* values are obtained by using Equation (9) at mmin = 9.96. Figure 2b shows the predicted Kauzmann temperature TKcal1*, according to Equation (9) at mmin = 9.96. From Figure 2, it can be seen that the R2 value greatly increases from 0.685 to 0.970 when the predicted values obtained by using Equation (9) at mmin = 17 are replaced by those obtained by using Equation (9) at mmin = 9.96. It indicates that the accuracy of the predicted values obtained by using Equation (9) at mmin = 9.96 are greatly improved. The predicted values obtained by using Equation (9) at mmin = 17 and 9.96 have also been listed in Table 1 for convenience in comparing the predicted (TKcal1 and TKcal1*) values with the reported TK values.
Figure 3a illustrates the predicted Kauzmann temperature TKcal2 by Equation (11) at mmin = 17. Compared to Figure 2a, the predicted Kauzmann temperature TKcal2 values (R2 = 0.861) obtained by Equation (11) at mmin = 17 are more accurate than those obtained by Equation (9) at mmin = 17. In order to obtain the most accurate predicted Kauzmann temperature by using Equation (11), we also regard the mmin value as the fitting parameter. Therefore, we obtain the best fit and the most accurate predicted Kauzmann temperature TKcal2* by using Equation (11), when mmin equals 11.50. Figure 3b shows the predicted Kauzmann temperature TKcal2*, according to Equation (11) at mmin = 11.50. From Figure 3, it can be seen that the R2 value increases from 0.861 to 0.969 when the predicted values obtained by using Equation (11) at mmin = 17 are replaced by those obtained by using Equation (11) at mmin = 11.50. The predicted values obtained by using Equation (11) at mmin = 17, and 11.50 are also listed in Table 1.
A new formula (Equation (17)) has been deduced in the above introduction, whose expression is also a function of Tg and m. In the literature, Λb equals 43 [27] and Λc (the ratio Tm/Tg) is equal to about 3/2 [27,28,29,30]. We plug these values into Equation (17), and the curve of the predicted TKnew is shown in Figure 4a. The R2 value of this correlation equals 0.801. In order to obtain the most accurate predicted Kauzmann temperature by using Equation (17), we also regard Λb and Λc values as the fitting parameters. The best fit of the experimental data yields Λb = 18.47 and Λc = 1.12. Plugging the fitted values into Equation (17):
T K new * = 1.12 T g 23.17 T g m + 20.69
Figure 4b shows the predicted Kauzmann temperature TKnew*, according to Equation (18). From Figure 4, it can be seen that the R2 value increases from 0.801 to 0.966 when the predicted values obtained by using Equation (17) at Λb = 43 and Λc = 3/2 are replaced by those obtained by using Equation (17) with the best fitting parameters (i.e., Equation (18)). The predicted values obtained by using Equation (17) at Λb = 43 and Λc = 3/2 and using Equation (18) are also listed in Table 1.

5. Conclusions

The Kauzmann temperature TK in 38 kinds of amorphous materials have been predicted. Meanwhile, we regard the mmin value as the fitting parameter to improve the accuracy of predicting TK values. The coefficient of determination R2 values increase from 0.685 and 0.861 to 0.970 and 0.969, respectively, when the coefficients of two reported relations are replaced by the best fitting parameters. In addition, a new formula of predicting TK values with R2 = 0.966 is deduced. Therefore, three equations with the best fitting parameters have relatively high R2 values, which indicates that they can be applied to obtain the accurate predicted TK values.

Author Contributions

Writing—original draft, Q.G.; Writing—review & editing, Z.J.; All authors have read and agreed to the published version of the manuscript.

Funding

This research was funded by the Natural Science Foundation of China (grant numbers: 51971166 and 51671151); the State Key Laboratory of Solidification Processing in NWPU (grant number: SKLSP201812) and Foundation of Shaanxi Provincial Department of Education (grant number: 18JS050).

Conflicts of Interest

The authors declared that they have no known competing financial interests or personal relationships that could have appeared to influence the work reported in this paper.

References

  1. Fiore, G.; Ichim, I.; Battezzati, L. Thermal analysis, fragility and viscosity of Au-based metallic glasses. J. Non-Cryst. Solids 2010, 356, 2218–2222. [Google Scholar] [CrossRef]
  2. Glade, S.C.; Johnson, W.L. Viscous flow of the Cu47Ti34Zr11Ni8 glass forming alloy. J. Appl. Phys. 2000, 87, 7249–7251. [Google Scholar] [CrossRef] [Green Version]
  3. Kawamura, Y.; Inoue, A. Newtonian viscosity of supercooled liquid in a Pd40Ni40P20 metallic glass. Appl. Phys. Lett. 2000, 77, 1114–1116. [Google Scholar] [CrossRef]
  4. Busch, R.; Liu, W.; Johnson, W.L. Thermodynamics and kinetics of the Mg65Cu25Y10 bulk metallic glass forming liquid. J. Appl. Phys. 1998, 83, 4134–4141. [Google Scholar] [CrossRef]
  5. Debenedetti, P.G.; Stillinger, F.H. Supercooled liquids and the glass transition. Nature 2001, 410, 259–267. [Google Scholar] [CrossRef]
  6. Tanaka, H. Relation between thermodynamics and kinetics of glass-forming liquids. Phys. Rev. Lett. 2003, 90, 055701. [Google Scholar] [CrossRef] [PubMed]
  7. Kauzmann, W. The Nature of the Glassy State and the Behavior of Liquids at Low Temperatures. Chem. Rev. 1948, 43, 219–256. [Google Scholar] [CrossRef]
  8. Okamoto, P.R.; Lam, N.Q.; Rehn, L.E. Physics of Crystal-to-Glass Transformations. Solid State Phys. 1998, 52, 1–135. [Google Scholar] [CrossRef]
  9. Wilde, G.; Görler, G.P.; Willnecker, R.; Fecht, H.J. Calorimetric, thermomechanical, and rheological characterizations of bulk glass-forming Pd40Ni40P20. J. Appl. Phys. 2000, 87, 1141–1152. [Google Scholar] [CrossRef]
  10. Lu, Z.P.; Li, Y.; Liu, C.T. Glass-forming tendency of bulk La–Al–Ni–Cu–(Co) metallic glass-forming liquids. J. Appl. Phys. 2003, 93, 286–290. [Google Scholar] [CrossRef]
  11. Fan, G.J.; Löffler, J.F.; Wunderlich, R.K.; Fecht, H.J. Thermodynamics, enthalpy relaxation and fragility of the bulk metallic glass-forming liquid Pd43Ni10Cu27P20. Acta Mater. 2004, 52, 667–674. [Google Scholar] [CrossRef]
  12. Fan, G.J.; Choo, H.; Liaw, P.K. Fragility of metallic glass-forming liquids: A simple thermodynamic connection. J. Non-Cryst. Solids 2005, 351, 3879–3883. [Google Scholar] [CrossRef]
  13. Tanaka, H. Relationship among glass-forming ability, fragility, and short-range bond ordering of liquids. J. Non-Cryst. Solids 2005, 351, 678–690. [Google Scholar] [CrossRef]
  14. Jiang, Q.K.; Wang, X.D.; Nie, X.P.; Zhang, G.Q.; Ma, H.; Fecht, H.J.; Bendnarcik, J.; Franz, H.; Liu, Y.G.; Cao, Q.P.; et al. Zr–(Cu,Ag)–Al bulk metallic glasses. Acta Mater. 2008, 56, 1785–1796. [Google Scholar] [CrossRef] [Green Version]
  15. Gallino, I.; Schroers, J.; Busch, R. Kinetic and thermodynamic studies of the fragility of bulk metallic glass forming liquids. J. Appl. Phys. 2010, 108, 063501. [Google Scholar] [CrossRef]
  16. Fontana, G.D.; Battezzati, L. Thermodynamic and dynamic fragility in metallic glass-formers. Acta Mater. 2013, 61, 2260–2267. [Google Scholar] [CrossRef]
  17. Ruocco, G.; Sciortino, F.; Zamponi, F.; De Michele, C.; Scopigno, T. Landscapes and fragilities. J. Chem. Phys. 2004, 120, 10666–10680. [Google Scholar] [CrossRef] [Green Version]
  18. Battezzati, L.; Castellero, A.; Rizzi, P. On the glass transition in metallic melts. J. Non-Cryst. Solids 2007, 353, 3318–3326. [Google Scholar] [CrossRef]
  19. Li, P.; Wang, G.; Ding, D.; Shen, J. Glass forming ability and thermodynamics of new Ti-Cu-Ni-Zr bulk metallic glasses. J. Non-Cryst. Solids 2012, 358, 3200–3204. [Google Scholar] [CrossRef]
  20. Böhmer, R.; Ngai, K.L.; Angell, C.A.; Plazek, D.J. Nonexponential relaxations in strong and fragile glass formers. J. Chem. Phys. 1993, 99, 4201–4209. [Google Scholar] [CrossRef]
  21. Venkataraman, S.; Biswas, K.; Wei, B.C.; Sordelet, D.J.; Eckert, J. On the fragility of Cu47Ti33Zr11Ni8Si1metallic glass. J. Phys. D Appl. Phys. 2006, 39, 2600–2608. [Google Scholar] [CrossRef] [Green Version]
  22. Meng, Q.G.; Zhang, S.G.; Li, J.G.; Bian, X.F. Strong liquid behavior of Pr55Ni25Al20 bulk metallic glass. J. Alloys Compd. 2007, 431, 191–196. [Google Scholar] [CrossRef]
  23. Zhao, Z.F.; Zhang, Z.; Wen, P.; Pan, M.X.; Zhao, D.Q.; Wang, W.H.; Wang, W.L. A highly glass-forming alloy with low glass transition temperature. Appl. Phys. Lett. 2003, 82, 4699–4701. [Google Scholar] [CrossRef]
  24. Waniuk, T.A.; Busch, R.; Masuhr, A.; Johnson, W.L. Equilibrium viscosity of the Zr41.2Ti13.8Cu12.5Ni10Be22.5 bulk metallic glass-forming liquid and viscous flow during relaxation, phase separation, and primary crystallization. Acta Mater. 1998, 46, 5229–5236. [Google Scholar] [CrossRef]
  25. Fontana, G.D.; Castellero, A.; Battezzati, L. Thermodynamics and fragility of Fe-based glass forming melts. J. Non-Cryst. Solids 2016, 433, 103–108. [Google Scholar] [CrossRef]
  26. Busch, R.; Bakke, E.; Johnson, W.L. Viscosity of the supercooled liquid and relaxation at the glass transition of the Zr46.75Ti8.25Cu7.5Ni10Be27.5 bulk metallic glass forming alloy. Acta Mater. 1998, 46, 4725–4732. [Google Scholar] [CrossRef]
  27. Wang, L.M.; Angell, C.A.; Richert, R. Fragility and thermodynamics in nonpolymeric glass-forming liquids. J. Chem. Phys. 2006, 125, 074505. [Google Scholar] [CrossRef] [Green Version]
  28. Hunt, A. A simple connection between the melting temperature and the glass temperature in a kinetic theory of the glass transition. J. Phys. Condens. Matter 1992, 4, L429–L431. [Google Scholar] [CrossRef]
  29. Hunt, A. An explanation for the correlation between the glass transition temperature and the extrapolated divergence of the viscosity in Vogel-Fulcher phenomenology. Solid State Commun. 1993, 88, 377–379. [Google Scholar] [CrossRef]
  30. Lubchenko, V.; Wolynes, P.G. Barrier softening near the onset of nonactivated transport in supercooled liquids: Implications for establishing detailed connection between thermodynamic and kinetic anomalies in supercooled liquids. J.Chem. Phys. 2003, 119, 9088–9105. [Google Scholar] [CrossRef] [Green Version]
  31. Kato, H.; Wada, T.; Hasegawa, M.; Saida, J.; Inoue, A.; Chen, H.S. Fragility and thermal stability of Pt- and Pd-based bulk glass forming liquids and their correlation with deformability. Scripta Mater. 2006, 54, 2023–2027. [Google Scholar] [CrossRef]
  32. Gao, Q.; Jian, Z.Y. Measured and ideal glass transition temperatures of glass-forming liquids. J. Mol. Liq. 2019, 296. [Google Scholar] [CrossRef]
  33. Huang, D.; McKenna, G.B. New insights into the fragility dilemma in liquids. J. Chem. Phys. 2001, 114, 5621–5630. [Google Scholar] [CrossRef]
  34. Senkov, O.N. Correlation between fragility and glass-forming ability of metallic alloys. Phys. Rev. B 2007, 76. [Google Scholar] [CrossRef]
  35. Fiore, G.; Battezzati, L. Thermodynamic properties of the Pd77.5Cu6Si16.5 undercooled liquid. J. Alloys Compd. 2009, 483, 54–56. [Google Scholar] [CrossRef]
  36. Glade, S.C.; Busch, R.; Lee, D.S.; Johnson, W.L.; Wunderlich, R.K.; Fecht, H.J. Thermodynamics of Cu47Ti34Zr11Ni8, Zr52.5Cu17.9Ni14.6Al10Ti5 and Zr57Cu15.4Ni12.6Al10Nb5 bulk metallic glass forming alloys. J. Appl. Phys. 2000, 87, 7242–7248. [Google Scholar] [CrossRef] [Green Version]
  37. Kim, Y.J.; Busch, R.; Johnson, W.L.; Rulison, A.J.; Rhim, W.K. Metallic glass formation in highly undercooled Zr41.2Ti13.8Cu12.5Ni10.0Be22.5 during containerless electrostatic levitation processing. Appl. Phys. Lett. 1994, 65, 2136–2138. [Google Scholar] [CrossRef] [Green Version]
  38. Sipp, A.; Bottinga, Y.; Richet, P. New high viscosity data for 3D network liquids and new correlations between old parameters. J. Non-Cryst. Solids 2001, 288, 166–174. [Google Scholar] [CrossRef]
  39. Lu, Z.P.; Goh, T.T.; Li, Y.; Ng, S.C. Glass formation in La-based La–Al–Ni–Cu–(Co) alloys by Bridgman solidification and their glass forming ability. Acta Mater. 1999, 47, 2215–2224. [Google Scholar] [CrossRef]
  40. Evenson, Z.; Busch, R. Equilibrium viscosity, enthalpy recovery and free volume relaxation in a Zr44Ti11Ni10Cu10Be25 bulk metallic glass. Acta Mater. 2011, 59, 4404–4415. [Google Scholar] [CrossRef]
  41. Kuno, M.; Shadowspeaker, L.A.; Schroers, J.; Busch, R. Thermodynamics of The Pd43Ni10Cu27P20 Bulk Metallic Glass Forming Alloy. MRS Proc. 2004, 806. [Google Scholar] [CrossRef]
Figure 1. Temperature dependence of the difference in entropy between various supercooled liquids and their crystalline phases. ΔSm and Tm are the melt entropy and the melting temperature, respectively. (Adapted from Ref. [5,7]).
Materials 13 02151 g001
Figure 2. The predicted Kauzmann temperature obtained by Equation (9). (a) mmin = 17; (b) mmin = 9.96.
Materials 13 02151 g002
Figure 3. The predicted Kauzmann temperature obtained by Equation (11). (a) mmin = 17; (b) mmin = 11.50.
Materials 13 02151 g003
Figure 4. The predicted Kauzmann temperature obtained by Equation (17). (a) Λb = 43 and Λc = 1.5; (b) Λb = 18.47 and Λc = 1.12.
Materials 13 02151 g004
Table 1. The values of Tg, TK, and m for various glass-forming liquids. The data (numbers 19–38) were taken from Ref. [17,33].
Glass FormersTg (K)mTK (K)TKcal1 (K)TKcal1* (K)TKcal2 (K)TKcal2* (K)TKnew (K)TKnew* (K)
1Mg65Cu25Y10404 [4]50 [34]320 [4]266.64323.52283.53319.65264.63320.06
2Pd77.5Cu6Si16.5637 [34]73 [34]560 [16,35]488.66550.09502.47543.44507.28555.91
3Cu47Ti34Zr11Ni8673 [34,36]59 [34]537 [36]479.08559.39500.30552.42482.27558.08
4Zr41.2Ti13.8Cu12.5Ni10Be22.5625 [34,37]46 [34]558 [6,13]394.02489.67424.04484.12390.27482.86
5Zr46.75Ti8.25Cu7.5Ni10Be27.5590 [13,34]46 [34]560 [13]371.96462.25400.30457.01368.42455.82
6SiO21480 [38]25 [34]876 [38]473.60890.37645.92900.08620.11907.07
6SiO21452 [34,38]25 [34]876 [38]464.64873.52633.70883.05608.38889.91
7GeO2816 [34,38]21 [34]418 [38]155.43428.98264.75441.17300.63460.41
8Pd40Ni40P20578 [3,13]46 [3,13]500 [9,13]364.39452.85392.15447.72360.92446.55
9La55Al25Ni20491 [13,34,39]42 [34]337 [10,13]292.26374.56319.61370.73290.45368.45
9La55Al25Ni20470.3 [10]42 [34]337 [10,13]279.94358.77306.14355.10278.21352.91
10La55Al25Ni15Cu5472 [13,34,39]37 [34]318 [10,13]255.14344.94287.25342.25258.09339.07
10La55Al25Ni15Cu5449.3 [10]37 [34]318 [10,13]242.86328.35273.44325.79245.68322.76
11La55Al25Ni10Cu10467 [13,34,39]35 [34]332 [10,13]240.17334.11274.76331.99246.41328.74
11La55Al25Ni10Cu10440.6 [10]35 [34]332 [10,13]226.59315.22259.23313.22232.48310.16
12La55Al25Ni5Cu15459 [13,34,39]42 [34]304 [10,13]273.21350.15298.78346.57271.52344.44
12La55Al25Ni5Cu15435 [10]42 [34]304 [10,13]258.93331.84283.16328.44257.32326.43
13La55Al25Ni5Cu10Co5466 [13,16,34,39]37 [16,34]363 [13,16]251.89340.56283.60337.90254.81334.76
13La55Al25Ni5Cu10Co5439.1 [10]37 [16,34]363 [13,16]237.35320.90267.23318.39240.10315.44
14Zr46(Cu4.5/5.5Ag1/5.5)46Al8703 [14]49 [14,16]671 [14,16]459.10560.10489.51553.47455.25553.63
15Zr46Cu46Al8715 [14,16]43 [14,16]596 [14,16]432.33549.39470.67543.58429.00540.69
16Zr44Ti11Ni10Cu10Be25620 [16,40]39 [16]504.5 [16]349.74461.66388.61457.52350.43453.73
17Pd43Ni10Cu27P20582 [15,16]65 [12,16]532 [15,16,41]429.78492.82445.28486.71438.19494.47
17Pd43Ni10Cu27P20576 [11]65 [12,16]447 [11,12]425.35487.74440.69481.69433.67489.37
18Au77Ge13.6Si9.4294 [16]85 [12,16]199 [16]235.20259.55240.05256.58250.74264.83
192-metylpentane80.5585856.9166.6859.5265.8557.1766.46
20Butyronitrile1004781.263.8378.8168.4777.9063.2377.77
21Ethanol92.5557163.9175.7567.2074.8163.8675.28
22n-propanol102.536.57354.7674.5361.8873.9755.5673.27
23Toluene126599689.69104.7393.67103.4290.29104.49
241-2 propan diol17252127115.77139.06122.50137.36115.16137.81
25Glycerol19053135129.06154.29136.26152.40128.55153.06
26Triphenil phospate205160166183.22192.24184.26190.76219.15203.31
27Orthoterphenyl24481200192.79214.00197.18211.50203.75217.68
28m-toluidine18779154146.76163.42150.28161.50154.42165.98
29Propylene carbonate156104127130.50141.06132.28139.61144.43145.73
30Sorbitol26693226217.38237.51221.10234.91235.60243.71
31Selenium30787240247.01271.85251.87268.78264.45277.79
32ZnCl238030250164.67253.84199.85253.71180.95251.90
33As2S345536265240.14329.12272.43326.77244.48323.64
34CaAl2Si2O8111853815759.40907.90801.76896.78756.43900.63
35Propilen glycol16752127112.40135.01118.94133.37111.81133.81
363-Methyl pentane773658.440.6455.7046.1055.3041.3754.77
373-Bromopentane1085382.573.3687.7077.4586.6373.0787.00
382-methyltetrahydrofuran916569.367.2077.0669.6276.1068.5177.31

