Biocomposites from Rice Straw Nanofibers: Morphology, Thermal and Mechanical Properties


Abstract
1. Introduction
2. Materials and Methods
2.1. Materials
2.2. Preparation of Rice Fibers
2.3. Preparation of Rice Nanofibers
2.4. Characterization of Rice Nanofibers
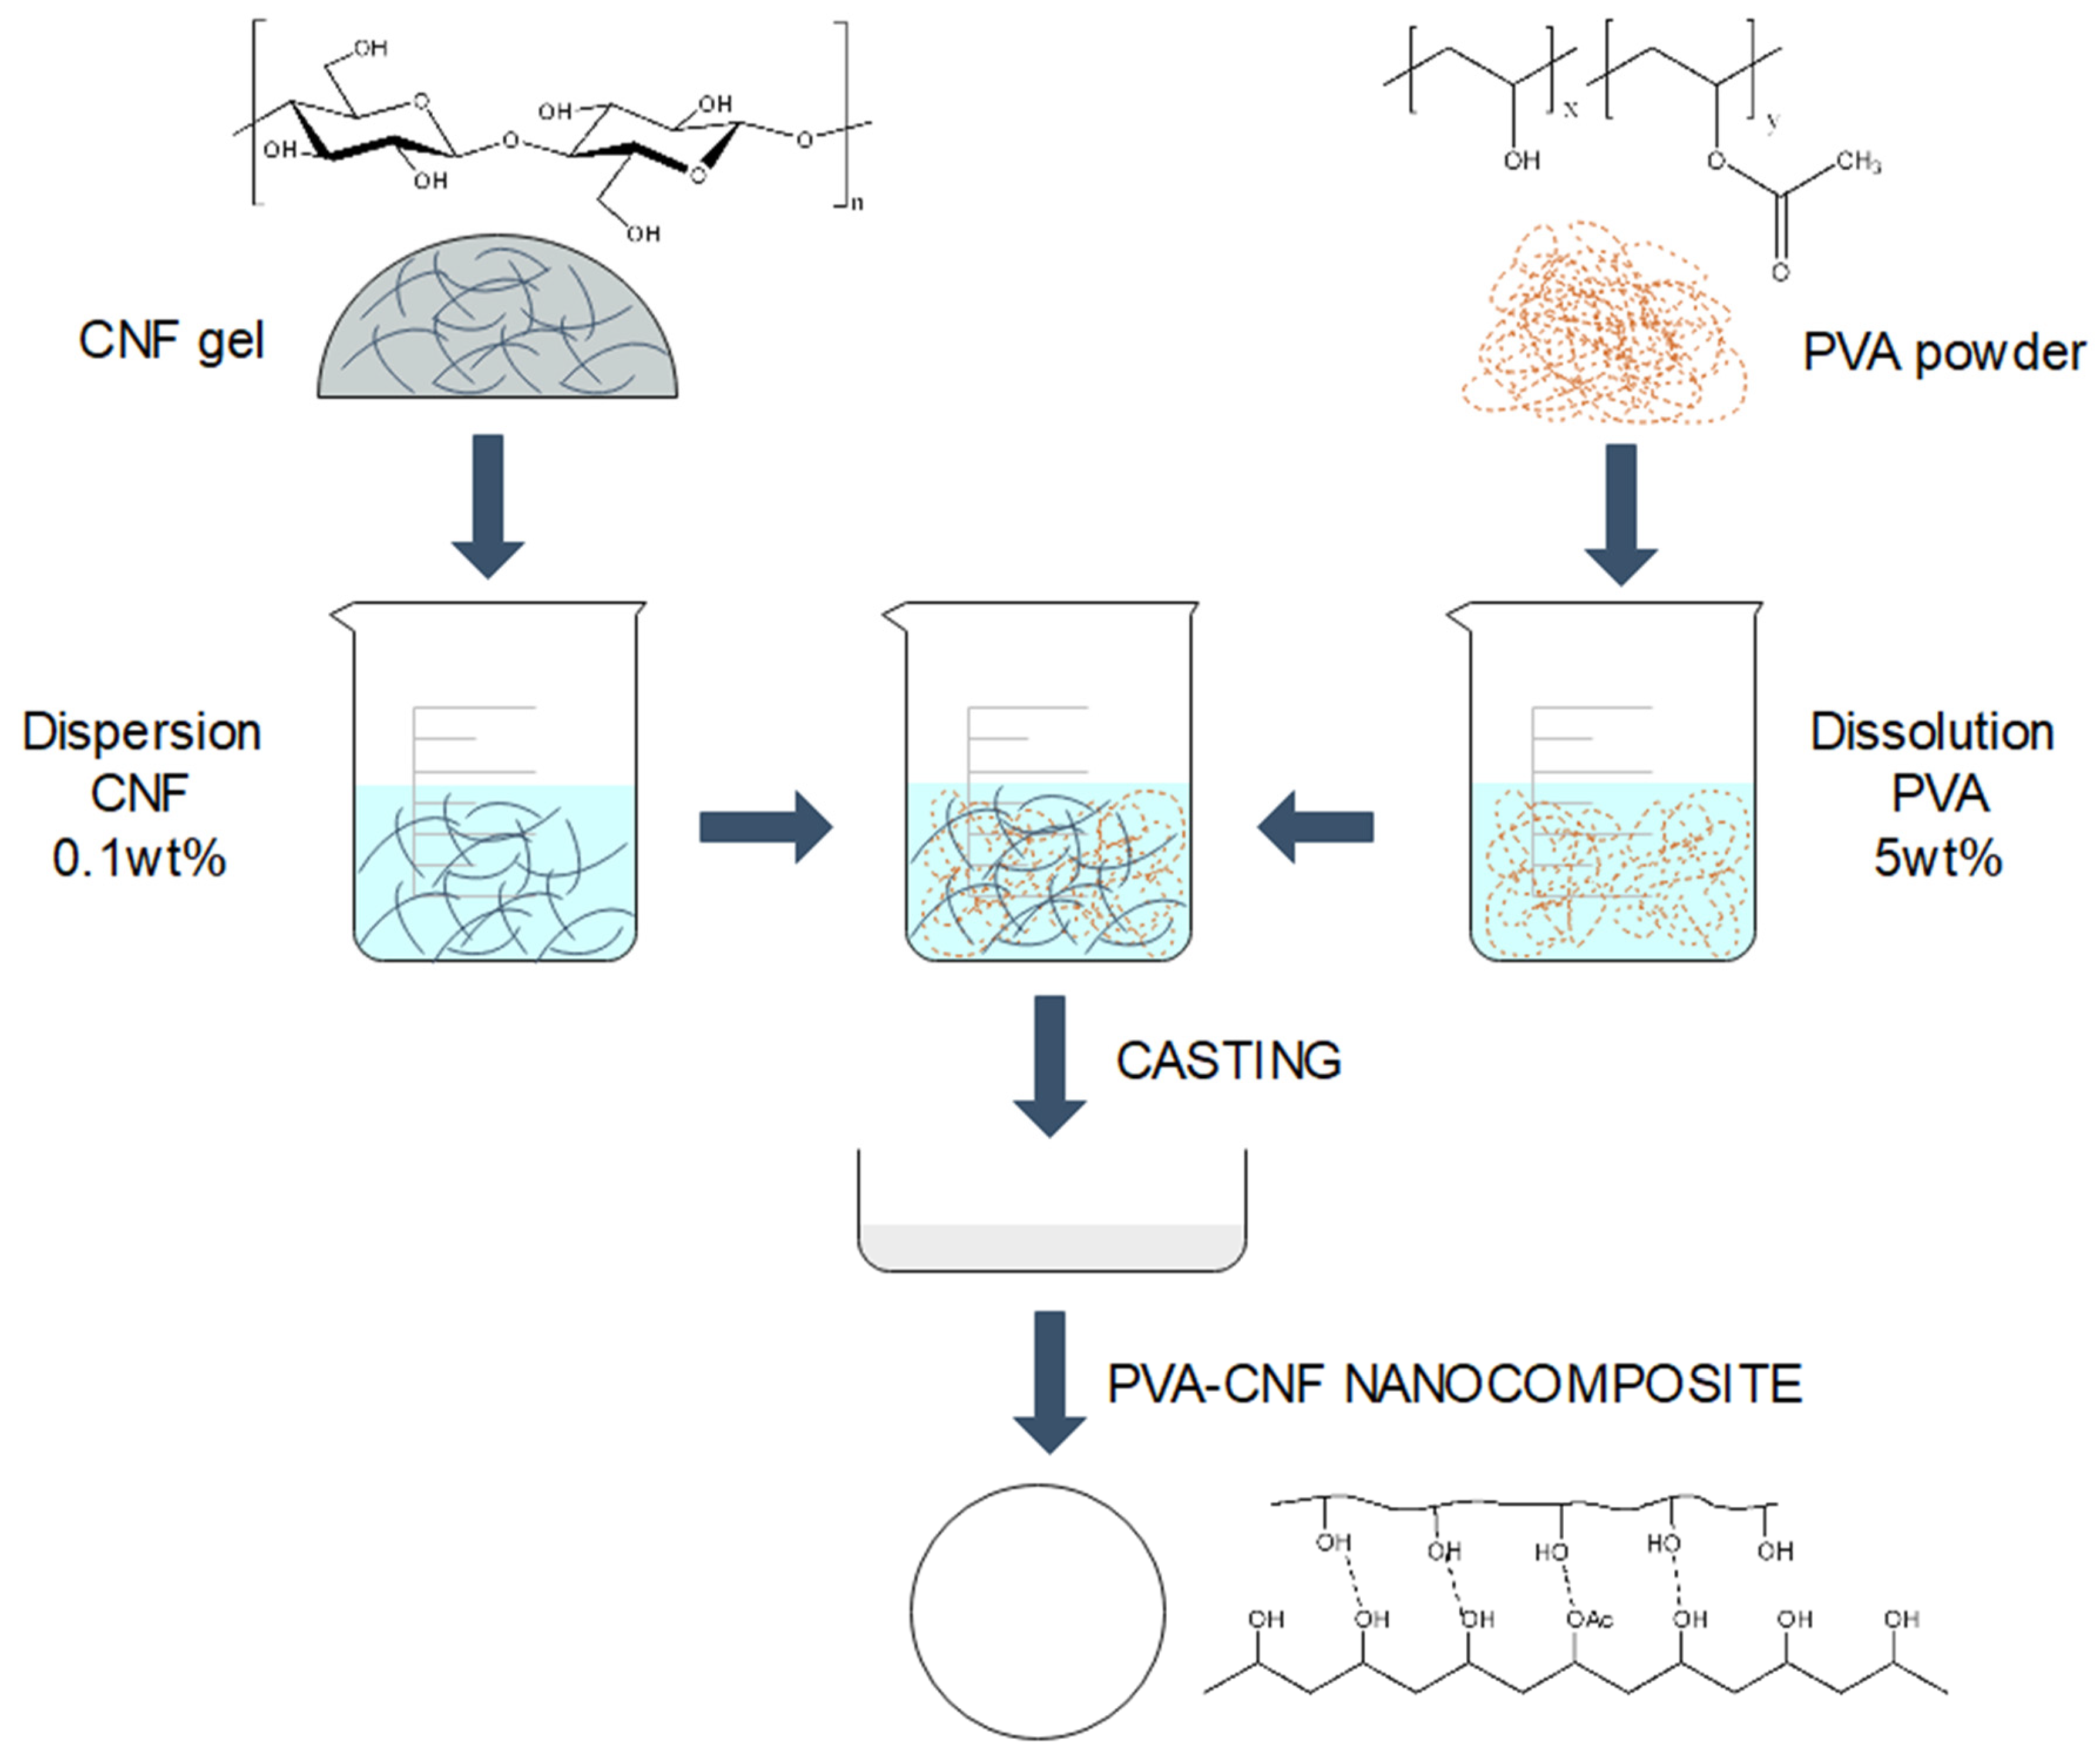
2.5. Preparation of PVA-Rice Nanocomposites
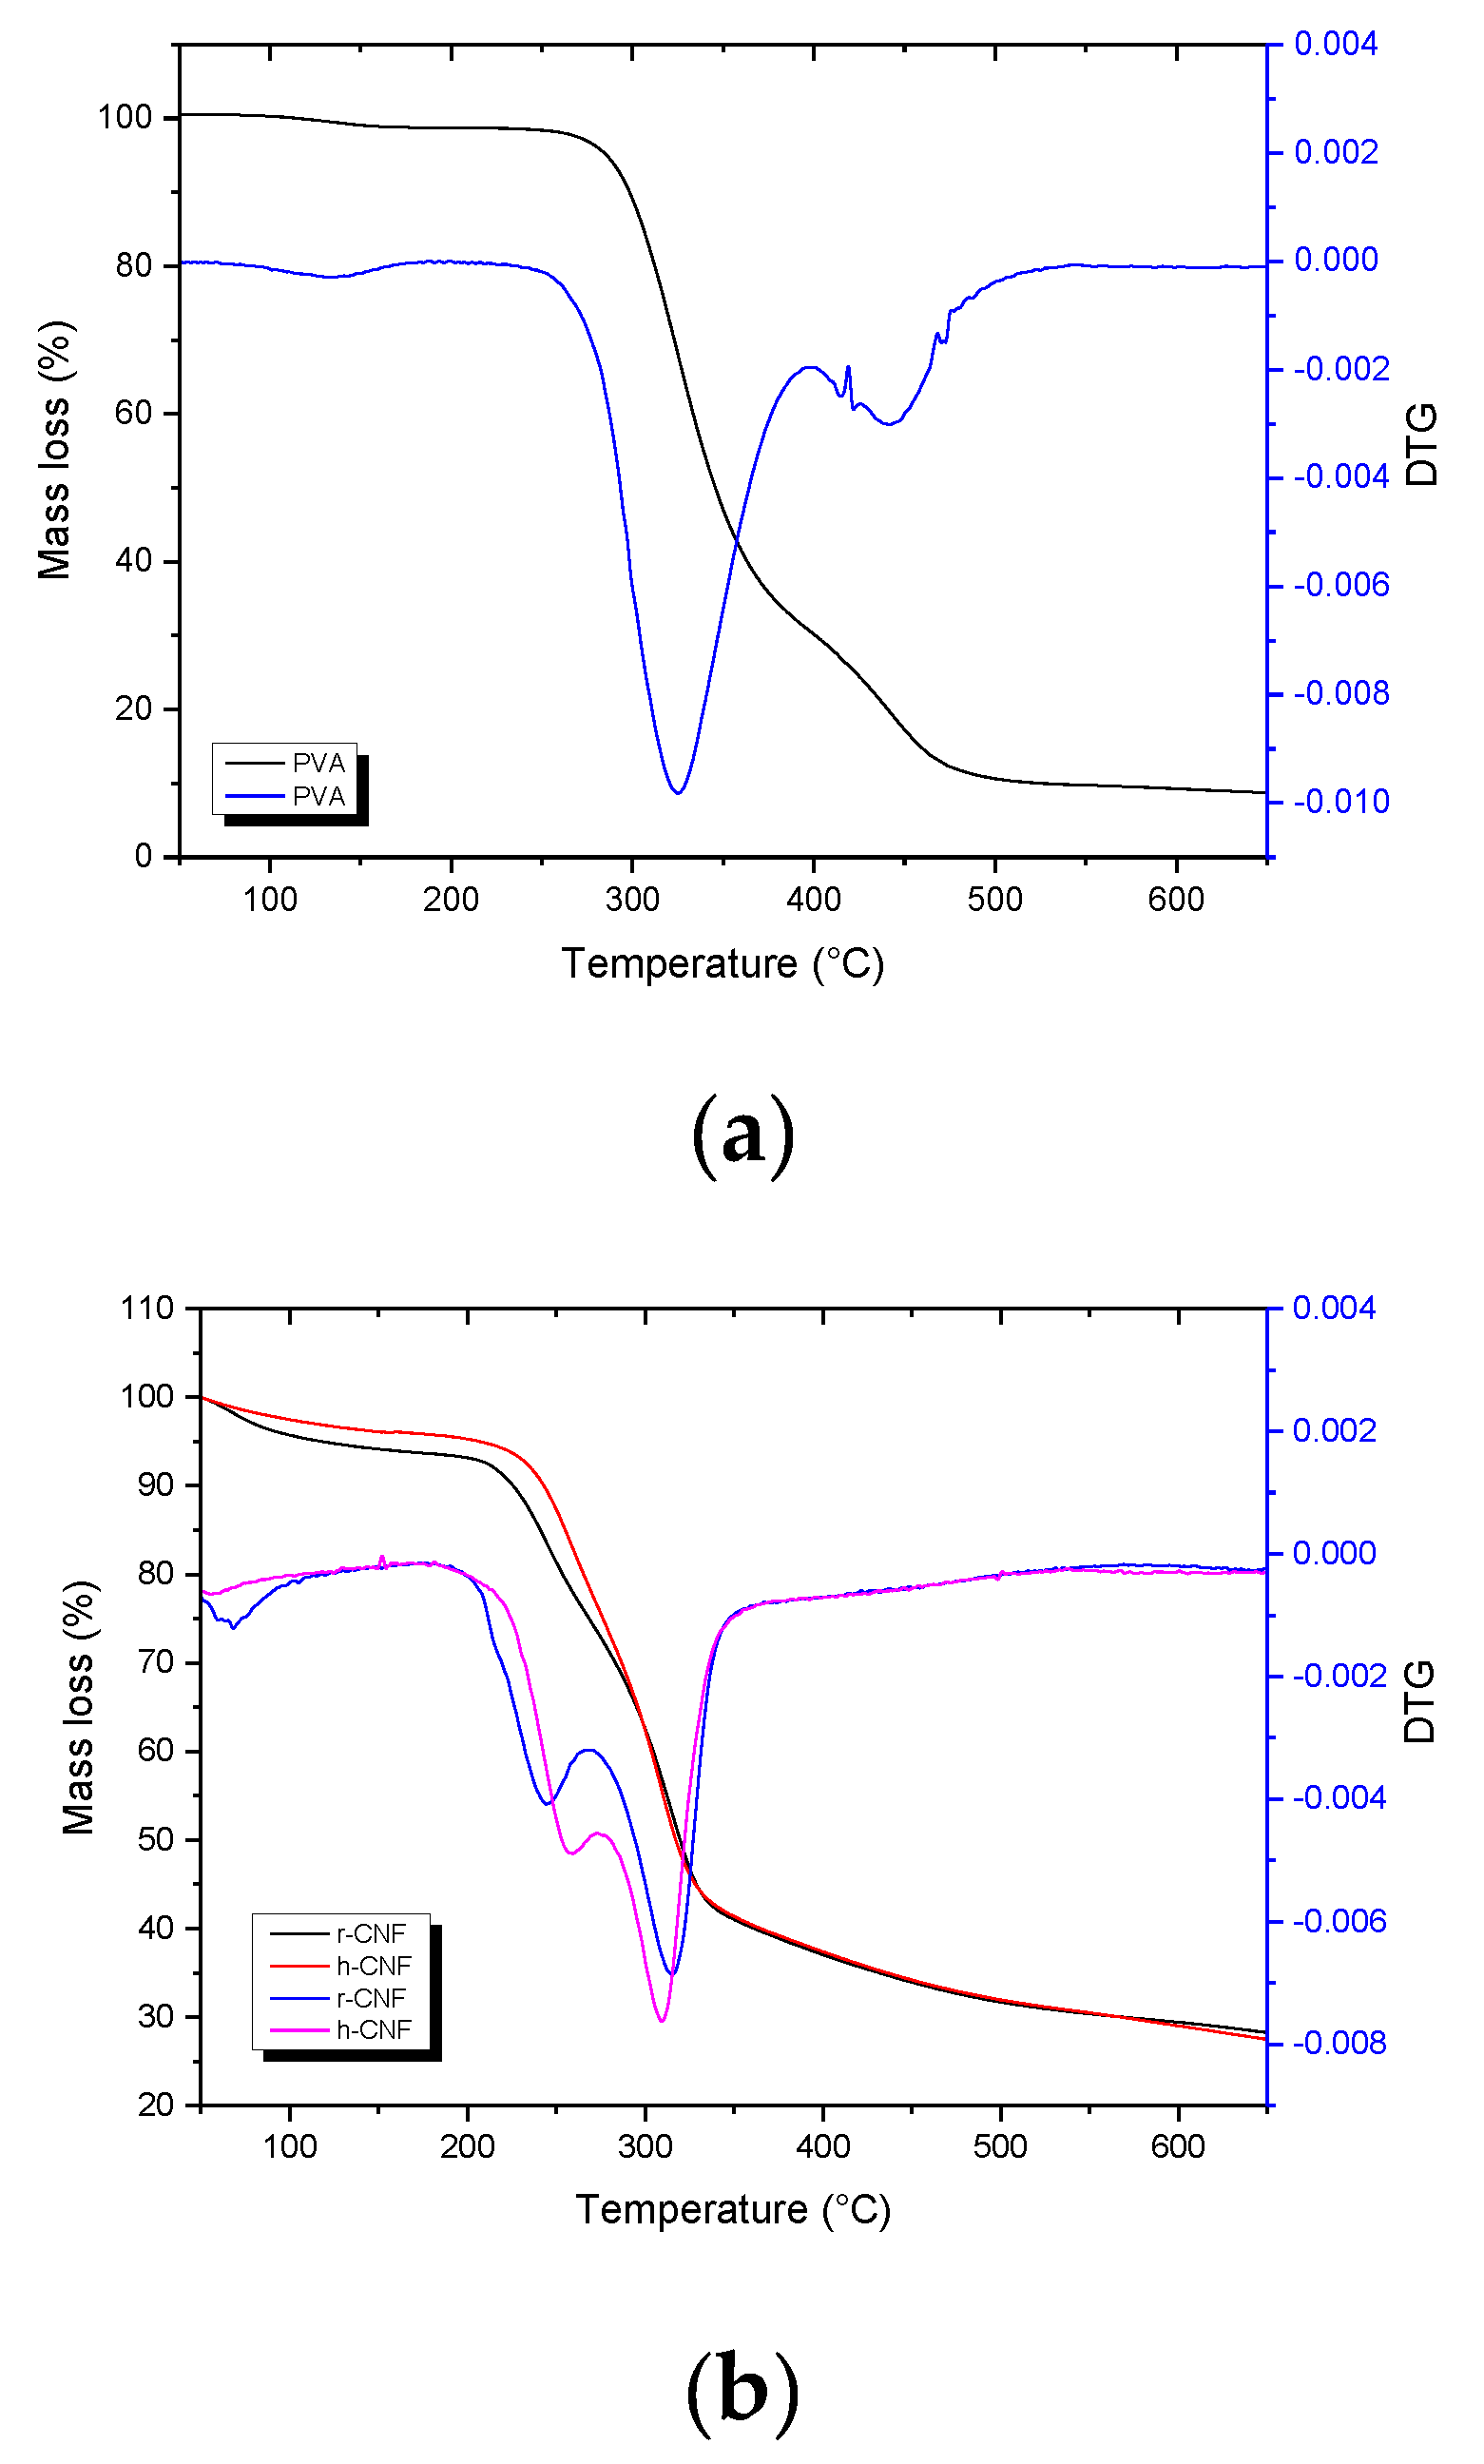
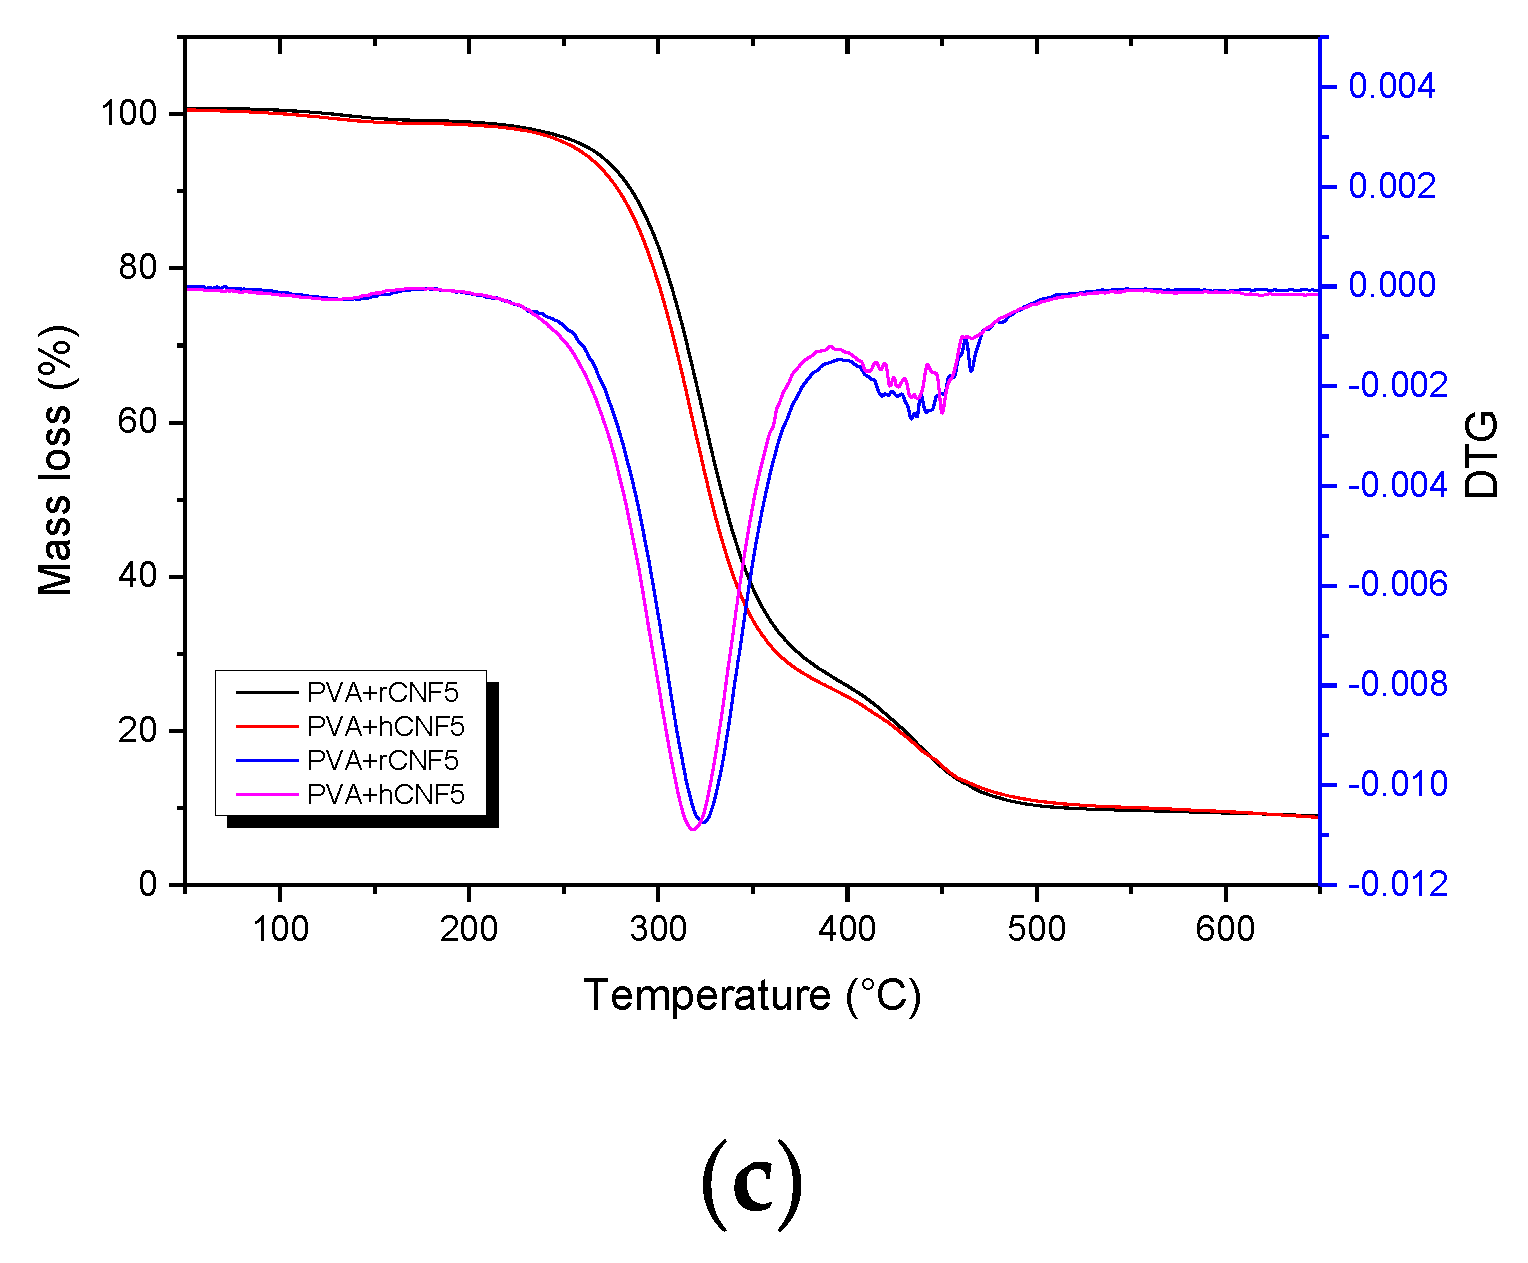
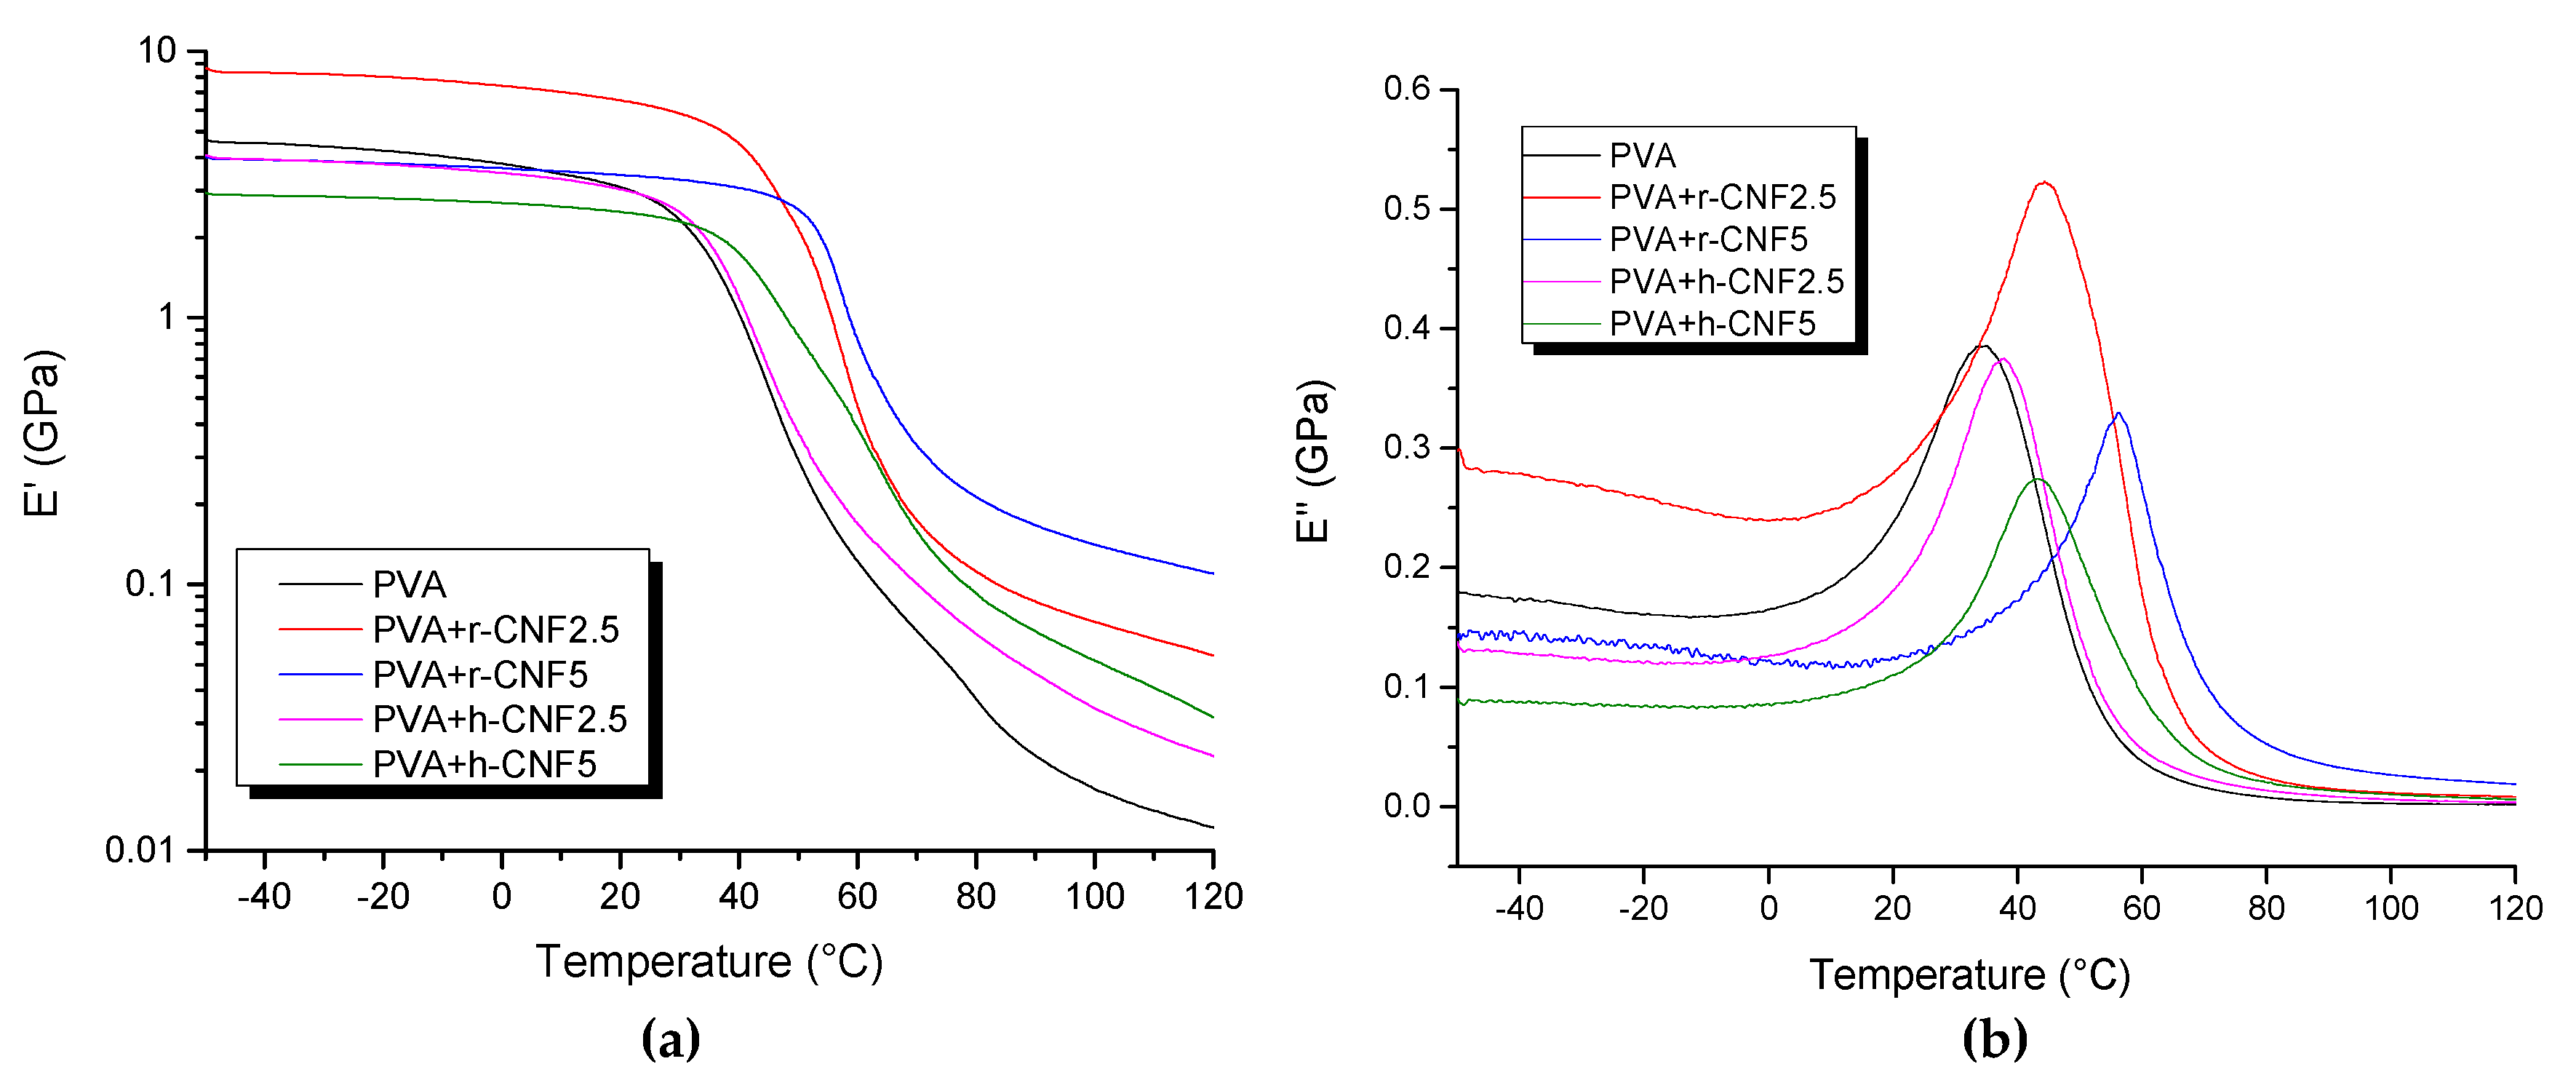
2.6. Characterization of PVA-Rice Nanocomposites
3. Results and Discussion
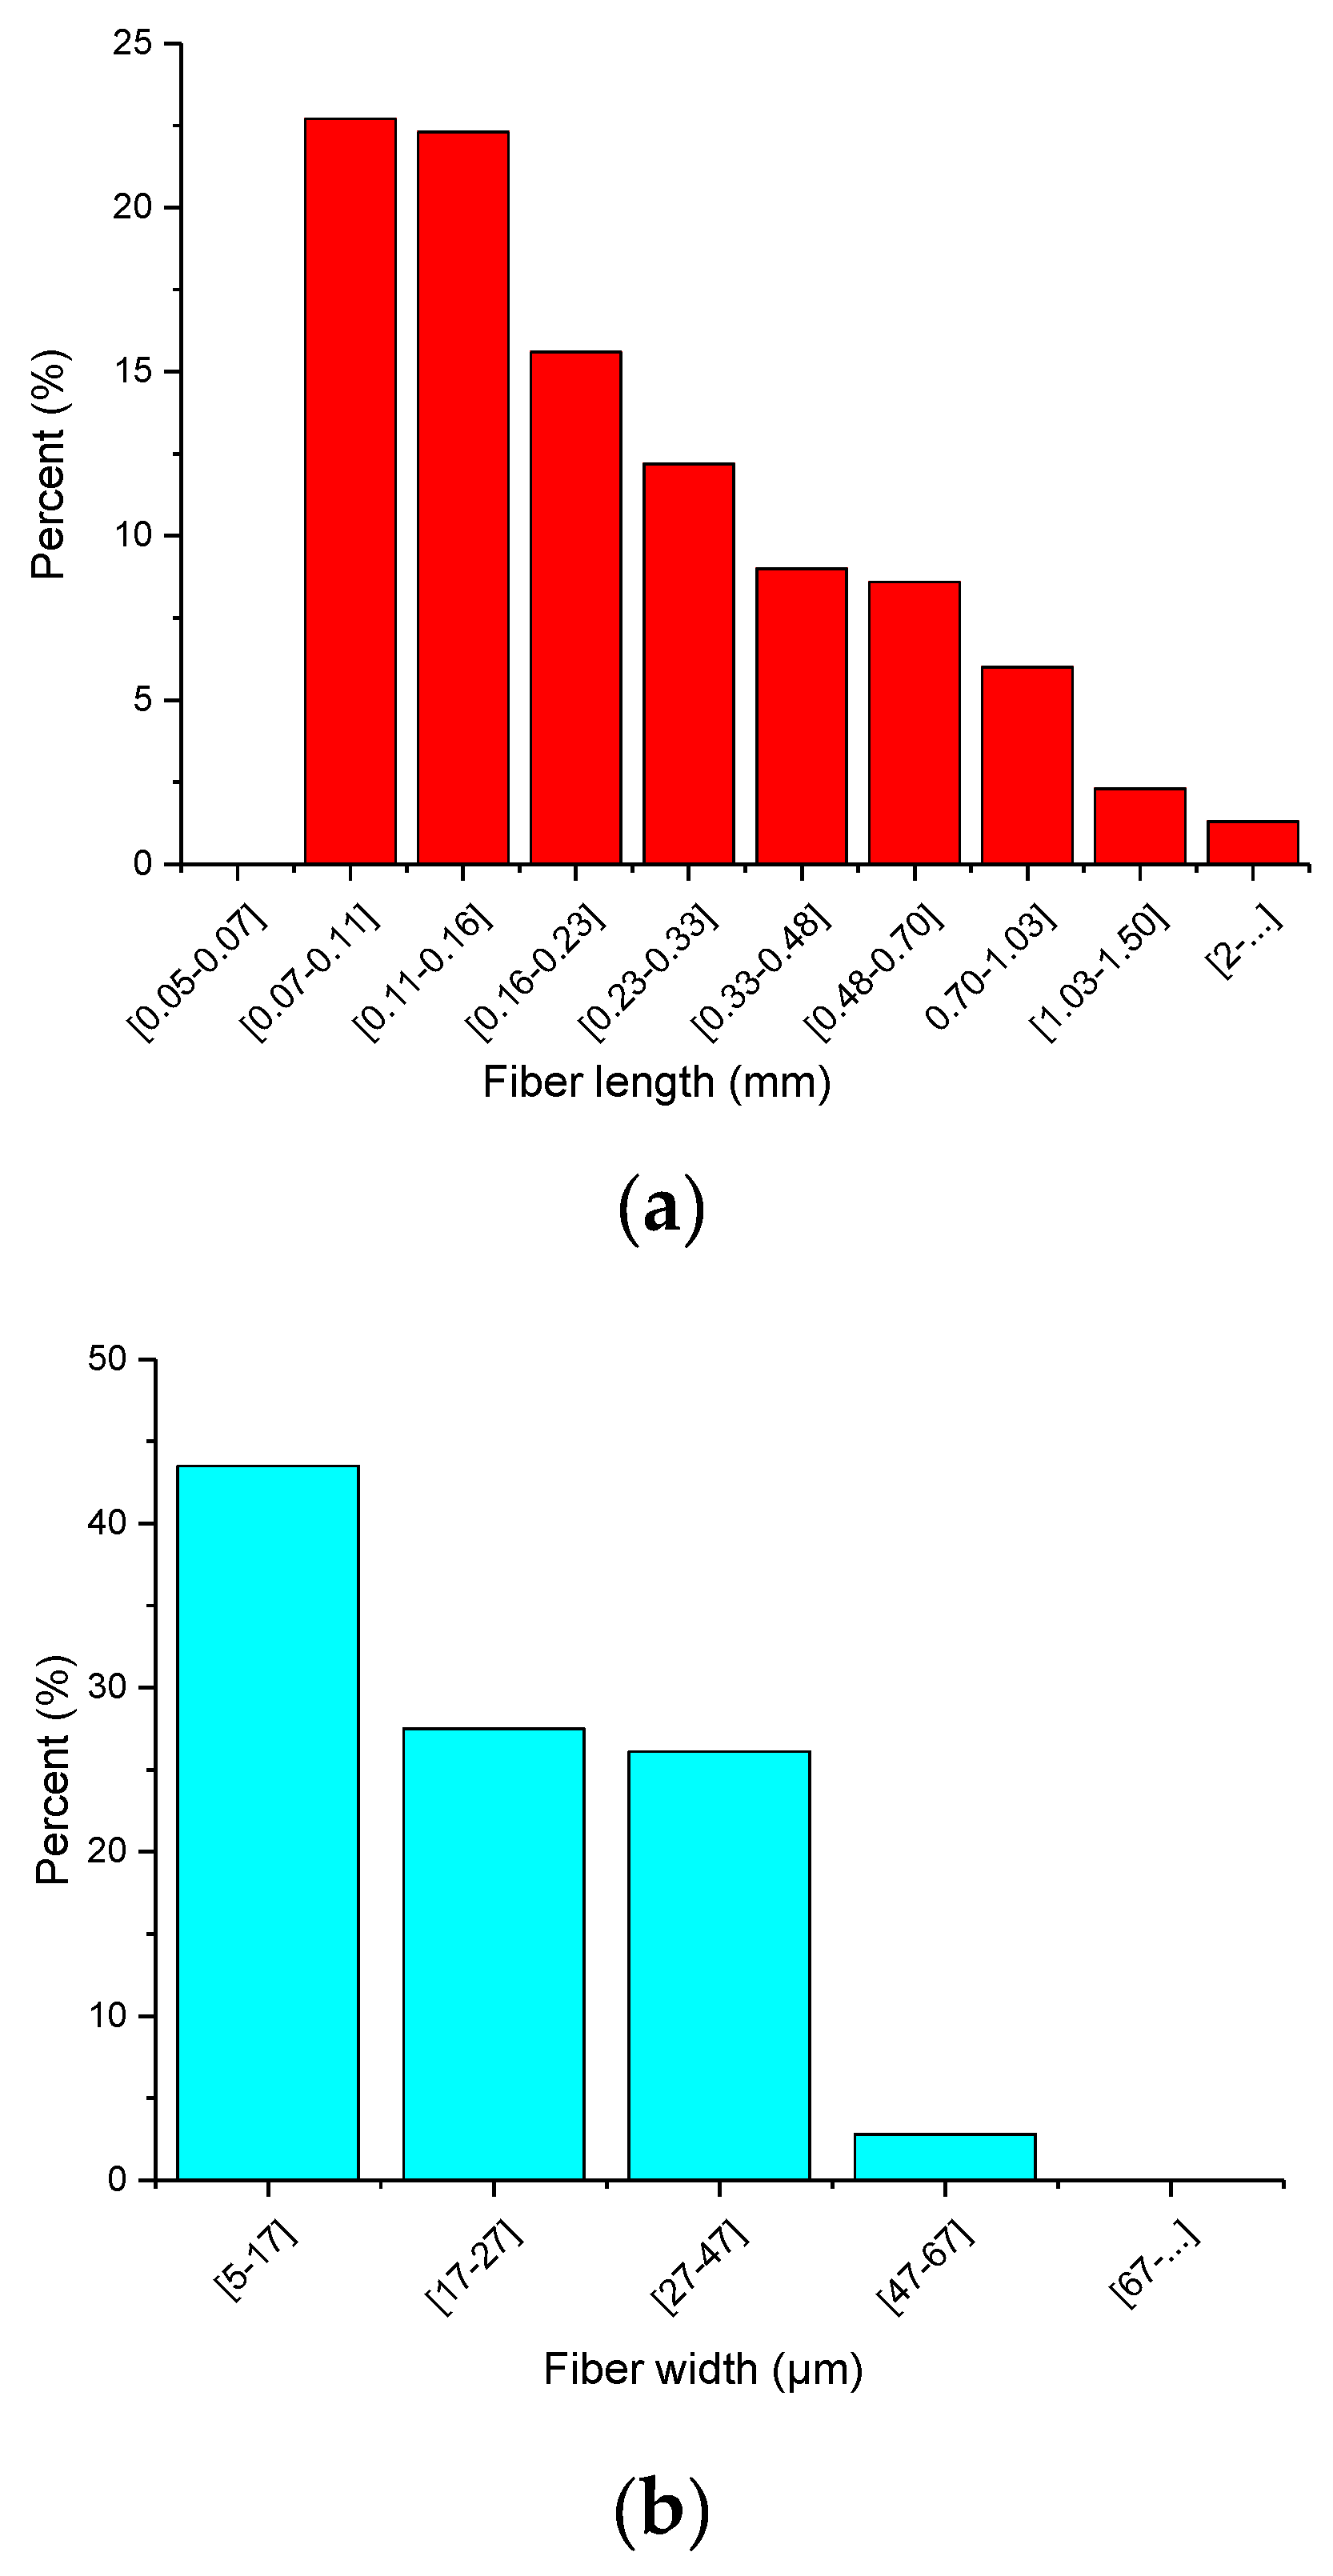
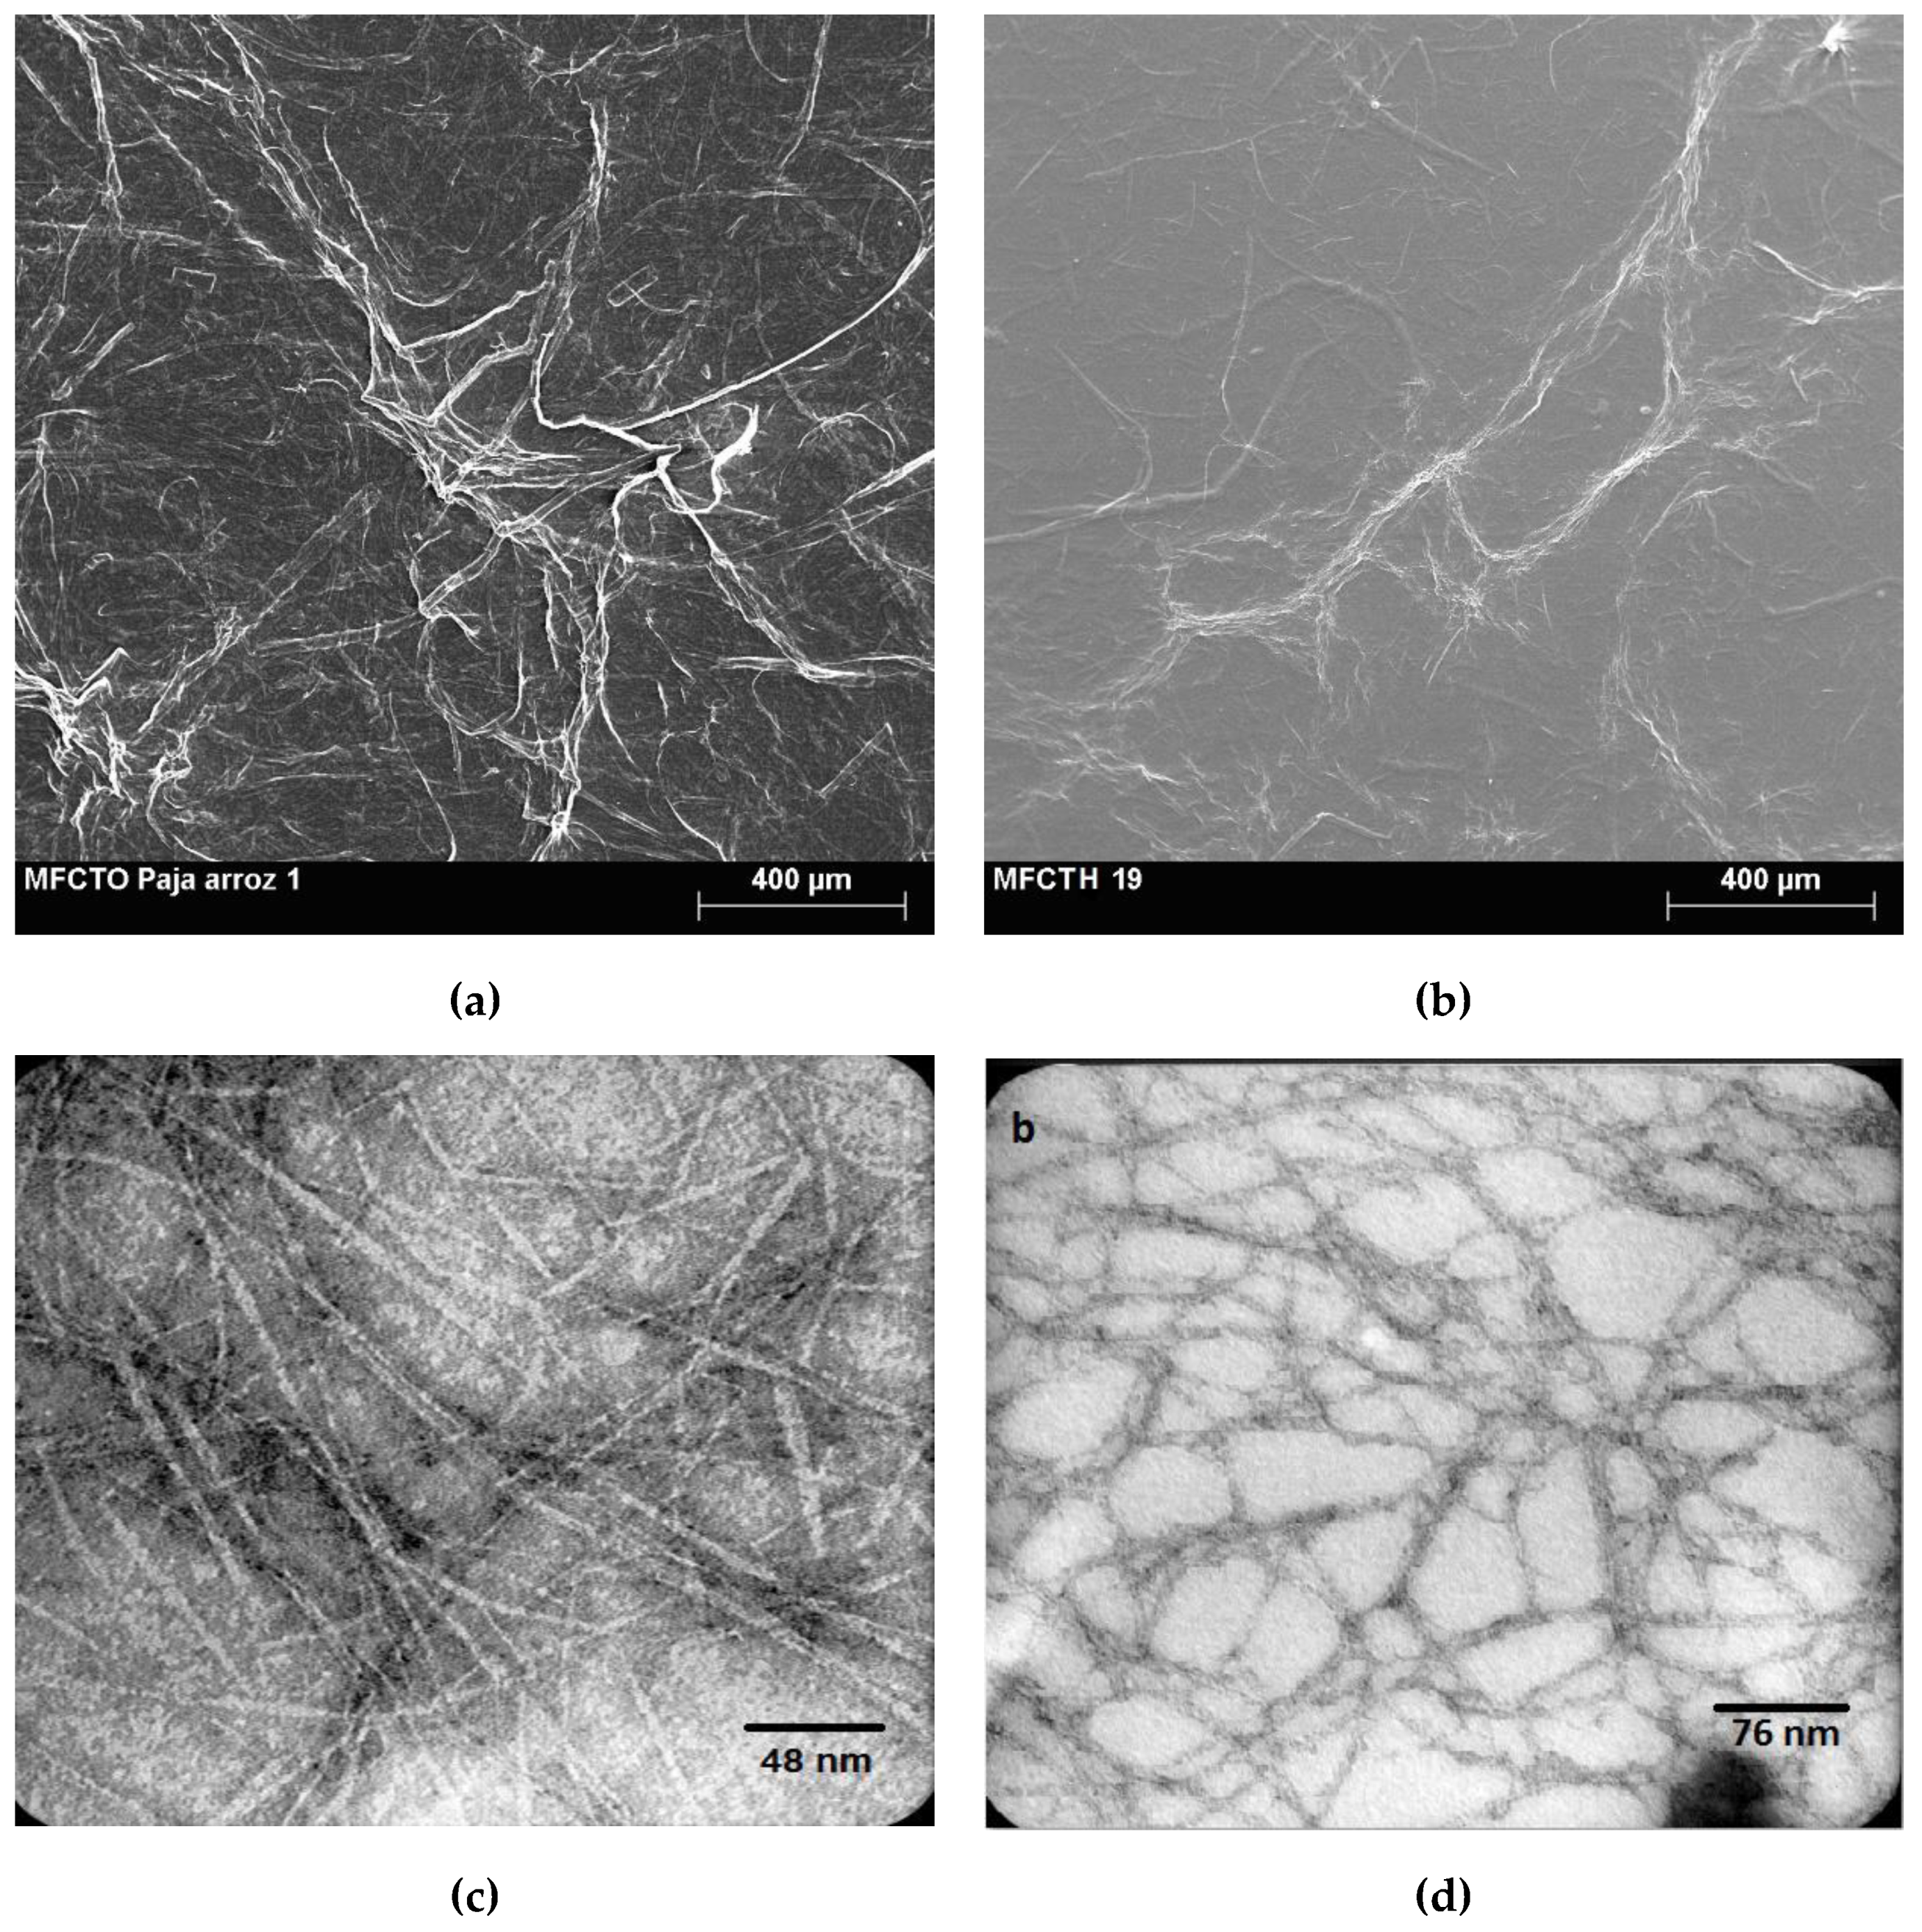
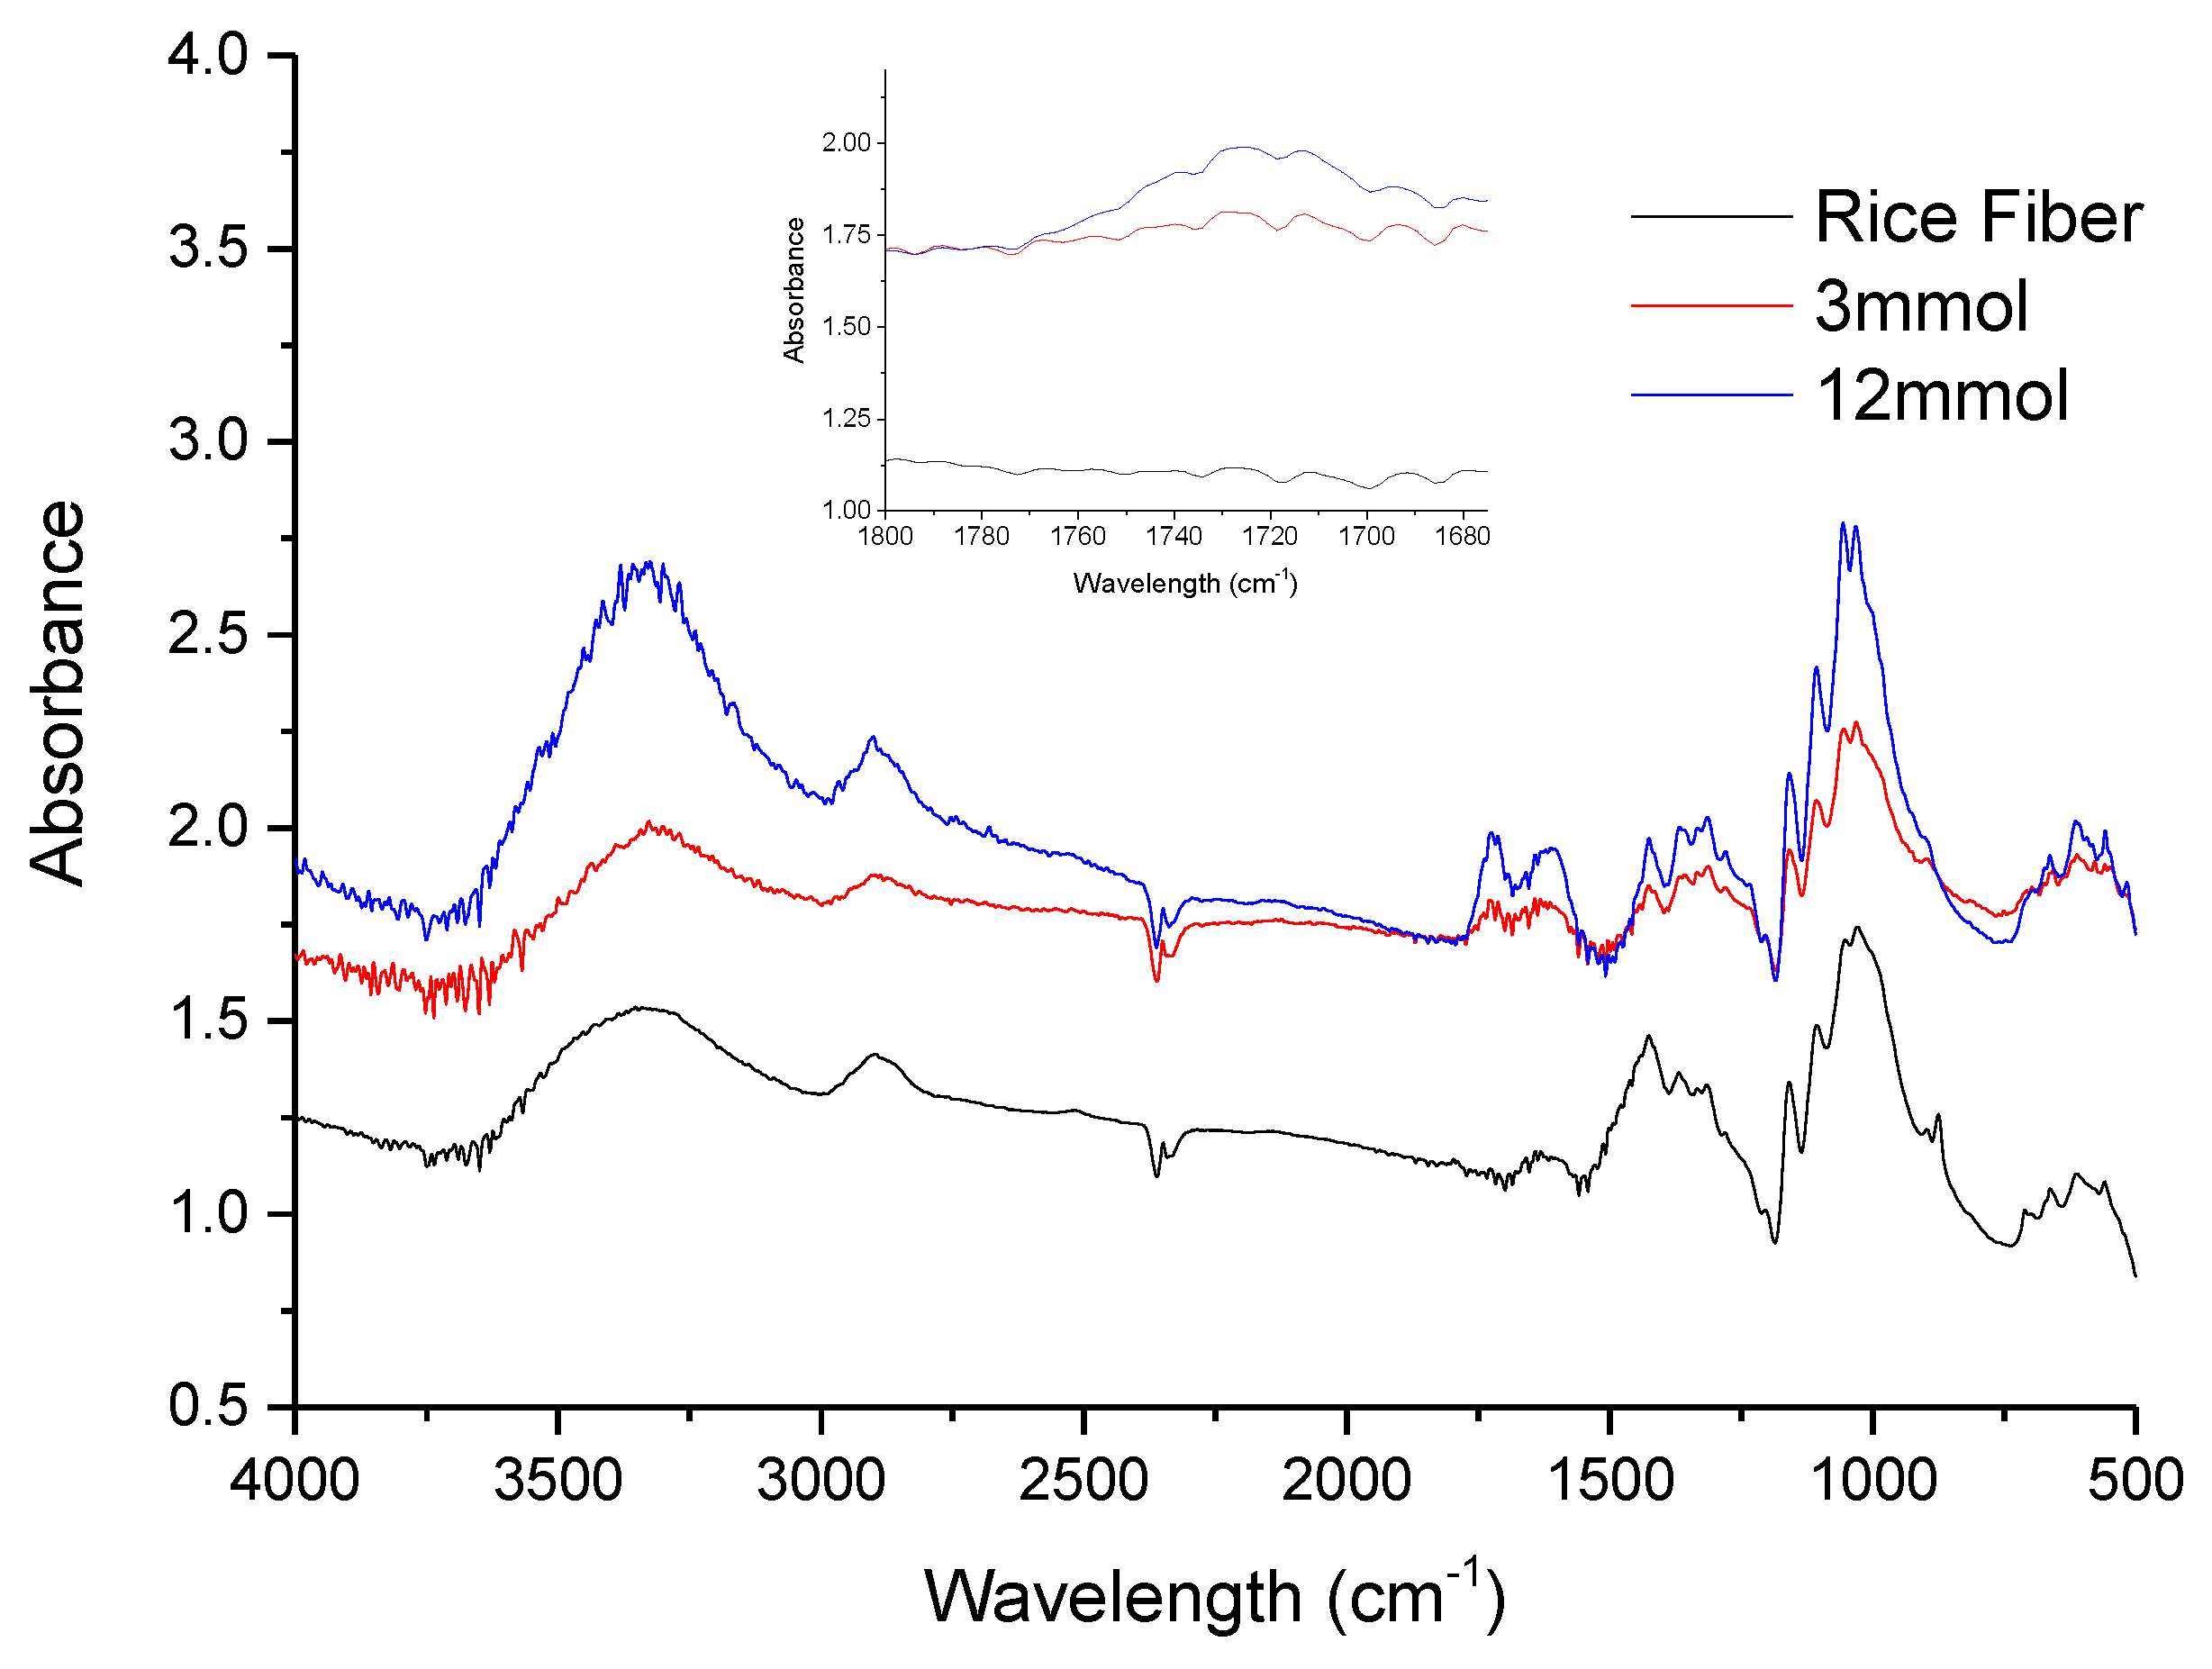
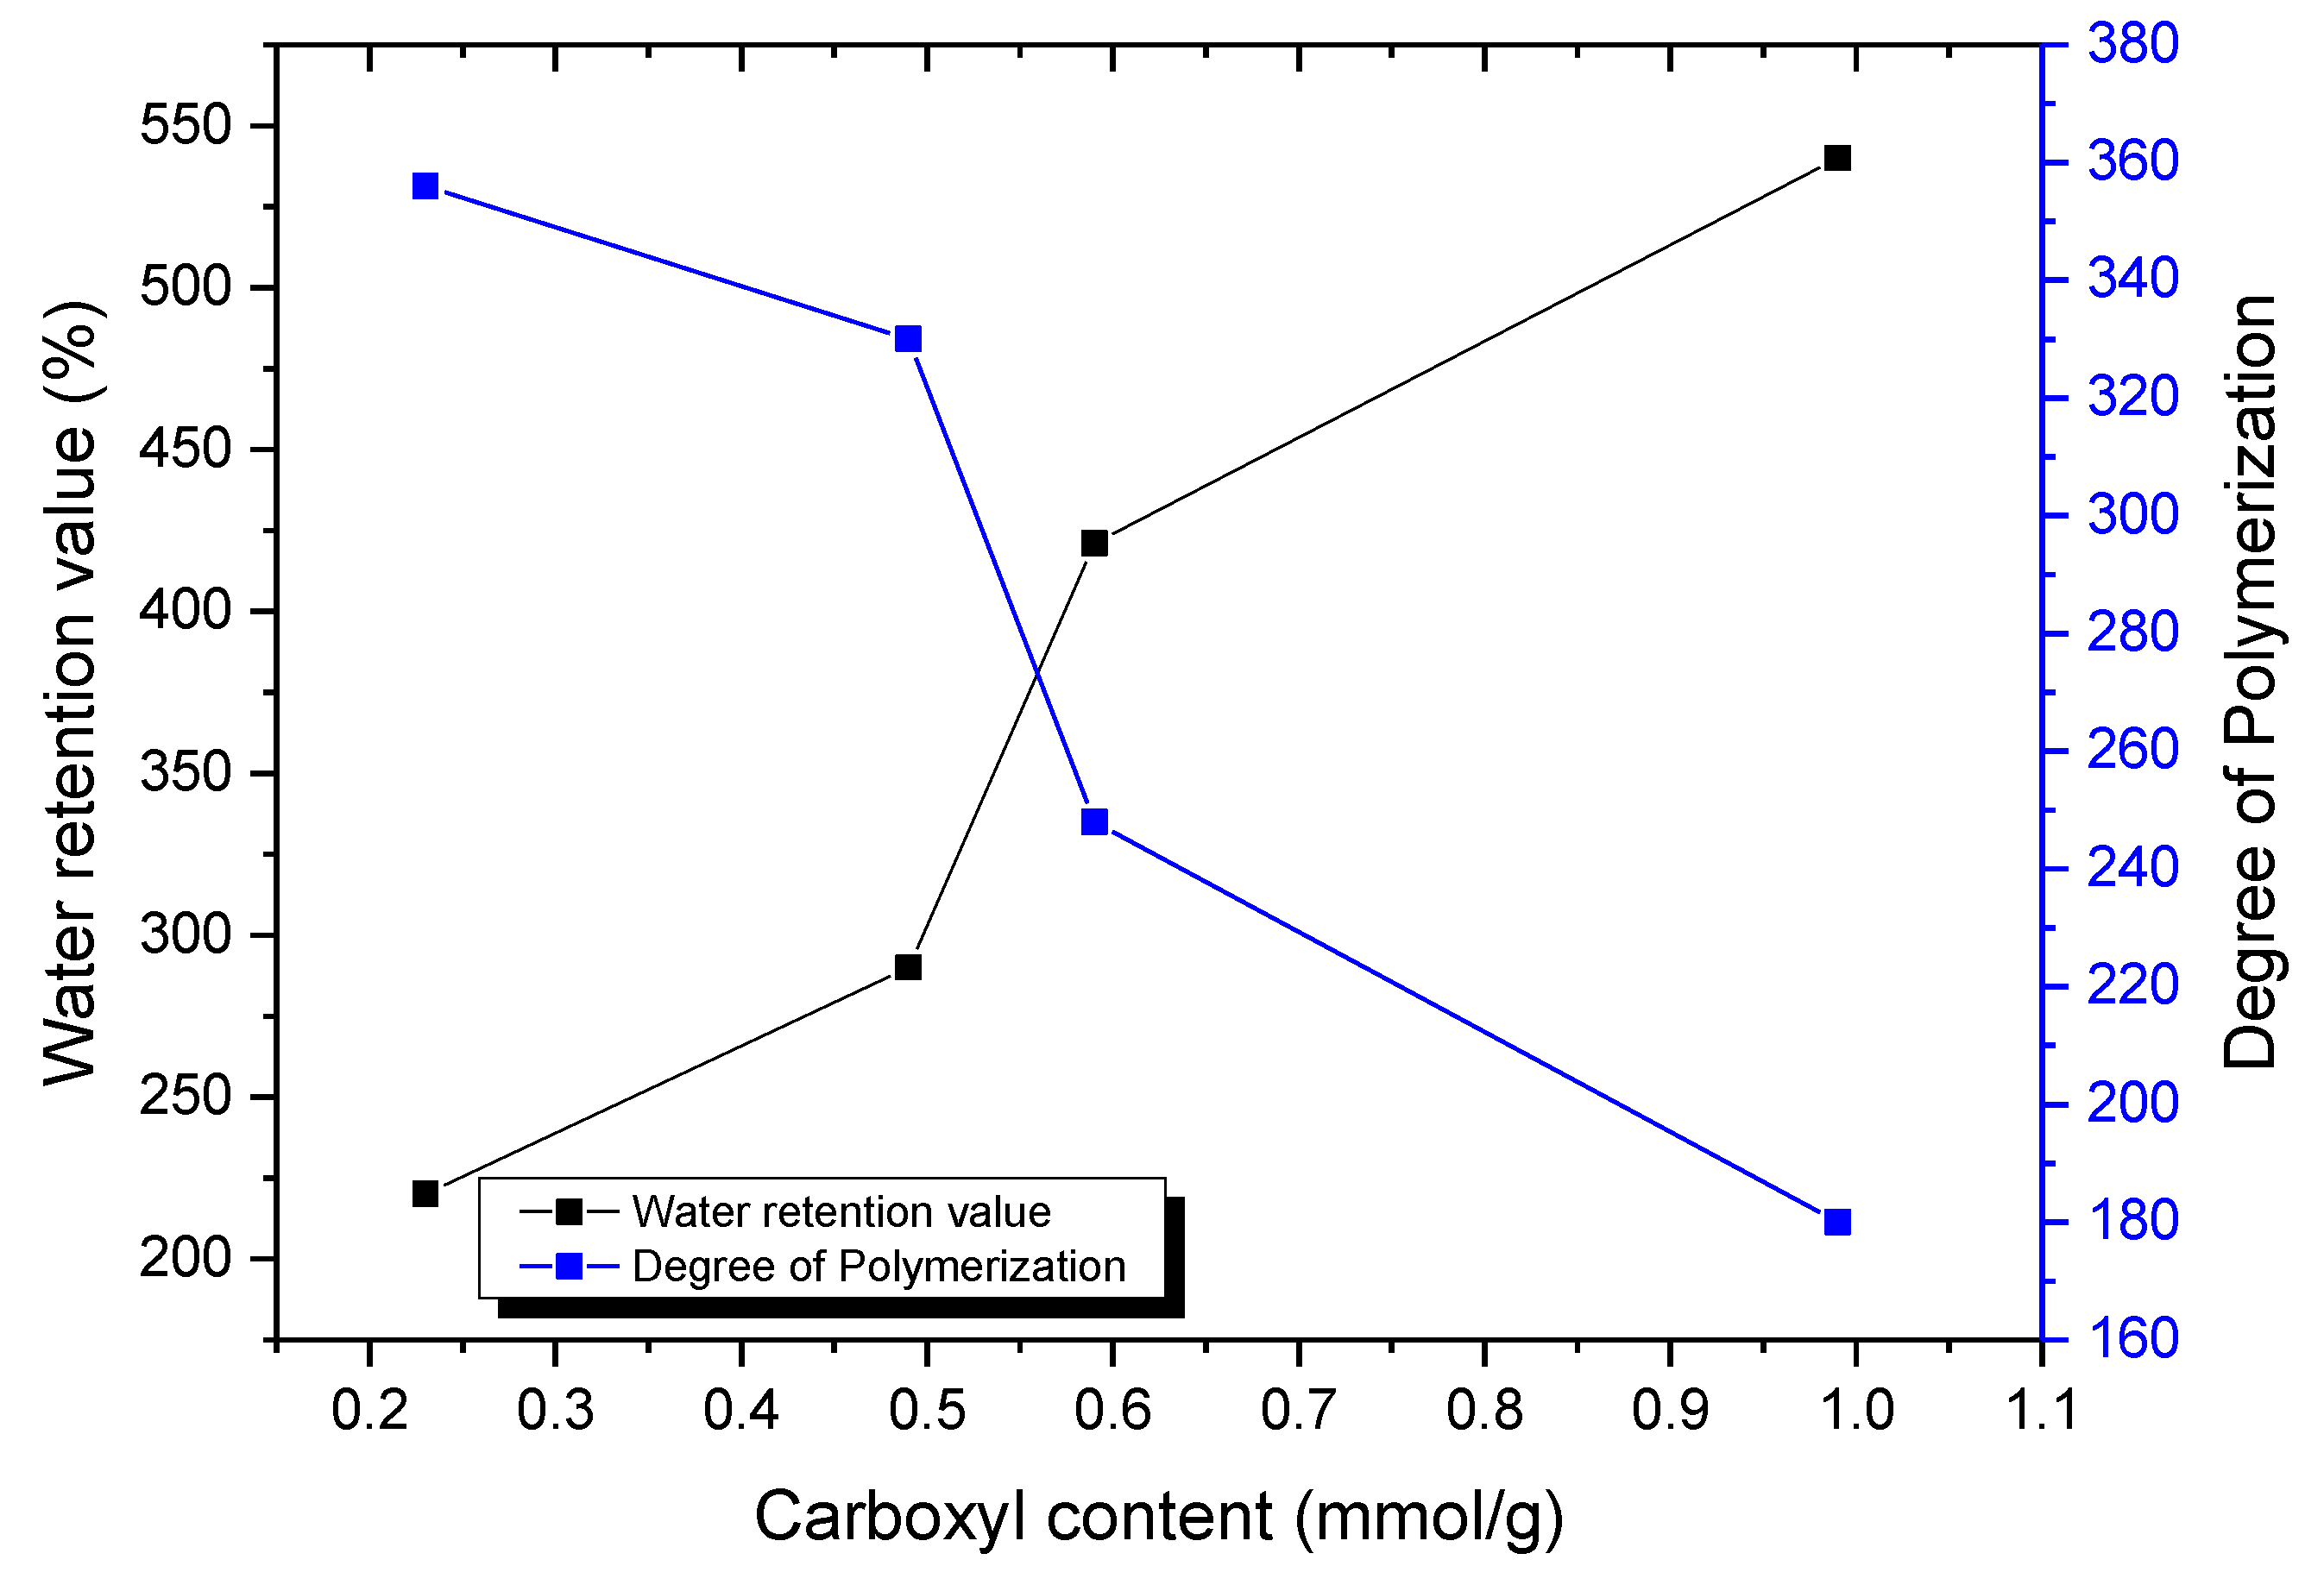
3.1. Rice Straw Fibers and Nanofibers
3.2. PVA–Rice Nanocomposites
4. Conclusions
Author Contributions
Funding
Acknowledgments
Conflicts of Interest
References
- Bentsen, N.S.; Felby, C.; Thorsen, B.J. Agricultural residue production and potentials for energy and materials services. Prog. Energy Combust. Sci. 2014, 40, 59–73. [Google Scholar] [CrossRef]
- Lal, R. World crop residues production and implications of its use as a biofuel. Environ. Int. 2005, 31, 575–584. [Google Scholar] [CrossRef] [PubMed]
- El-Tayeb, T.S.; Abdelhafez, A.A.; Ali, S.H.; Ramadan, E.M. Effect of acid hydrolysis and fungal biotreatment on agro-industrial wastes for obtainment of free sugars for bioethanol production. Braz. J. Microbiol. 2012, 43, 1523–1535. [Google Scholar] [CrossRef] [PubMed]
- Bakker, R.; Elbersen, W.; Poppens, R.; Lesschen, J. Rice Straw and Wheat Straw. Potential Feedstocks for the Biobased Economy; NL Agency Ministry of Economic Affairs (Netherlands): The Hague, The Netherlands, 2013; pp. 6–30. Available online: http://english.rvo.nl/sites/default/files/2013/12/Straw report AgNL June 2013.pdf (accessed on 13 April 2020).
- Guilherme, J.; Martin, P.; Porto, E.; Corrêa, C.B.; De Aquino, L.M. Antimicrobial potential and chemical composition of agro-industrial wastes. J. Nat. Prod. 2012, 5, 27–36. [Google Scholar]
- Nigam, P.S.; Gupta, N.; Anthwal, A. Pre-treatment of Agro-Industrial Residues. In Biotechnology for Agro-Industrial Residues Utilisation; Springer: Dordrecht, The Netherlands, 2009; p. 17. [Google Scholar]
- Motte, J.C.; Trably, E.; Escudié, R.; Hamelin, J.; Steyer, J.P.; Bernet, N.; Delgenes, J.P.; Dumas, C. Total solids content: A key parameter of metabolic pathways in dry anaerobic digestion. Biotechnol. Biofuels 2013, 6, 164. [Google Scholar] [CrossRef]
- Moser, C.; Henriksson, G.; Lindström, M.E. Structural Aspects on the Manufacturing of Cellulose. BioResources 2019, 14, 2269–2276. [Google Scholar]
- Khattab, M.M.; Abdel-Hady, N.A.; Dahman, Y. Cellulose Nanocomposites: Opportunities, Challenges, and Applications; Elsevier Ltd.: Amsterdam, The Netherlands, 2017. [Google Scholar] [CrossRef]
- Ramaraj, B. Crosslinked Poly(vinyl alcohol) and Starch Composite Films. II. Physicomechanical, Thermal Properties and Swelling Studiesitle. J. Appl. Polym. Sci. 2007, 103, 909–916. [Google Scholar] [CrossRef]
- Roohani, M.; Habibi, Y.; Belgacem, N.M.; Ebrahim, G.; Karimi, A.N.; Dufresne, A. Cellulose whiskers reinforced polyvinyl alcohol copolymers nanocomposites. Eur. Polym. J. 2008, 44, 2489–2498. [Google Scholar] [CrossRef]
- Tan, B.K.; Ching, Y.C.; Poh, S.C.; Abdullah, L.C.; Gan, S.N. A Review of Natural Fiber Reinforced Poly(Vinyl Alcohol) Based Composites: Application and Opportunity. Polymers (Basel) 2015, 7, 2205–2222. [Google Scholar] [CrossRef]
- Tan, B.K.; Ching, Y.C.; Gan, S.N.; Ramesh, S.; Rahman, M.R. Water absorption properties of kenaf fibre–poly(vinyl alcohol) composites. Mater. Res. Innov. 2014, 18, S6-144–S6-146. [Google Scholar] [CrossRef]
- Zhang, L.; Zhang, G.; Lu, J.; Liang, H. Preparation and Characterization of Carboxymethyl Cellulose/Polyvinyl Alcohol Blend Film as a Potential Coating Material. Polym.-Plast. Technol. Eng. 2013, 52, 163–167. [Google Scholar] [CrossRef]
- Kvien, I.; Oksman, K. Orientation of cellulose nanowhiskers in polyvinyl alcohol. Appl. Phys. A Mater. Sci. Process. 2007, 87, 641–643. [Google Scholar] [CrossRef]
- Zheng, Q.; Cai, Z.; Gong, S. Green synthesis of polyvinyl alcohol (PVA)–cellulose nanofibril (CNF) hybrid aerogels and their use as superabsorbents. J. Mater. Chem. A 2014, 2, 3110–3118. [Google Scholar] [CrossRef]
- Lu, J.; Wang, T.; Drzal, L.T. Preparation and properties of microfibrillated cellulose polyvinyl alcohol composite materials. Compos. Part A Appl. Sci. Manuf. 2008, 39, 738–746. [Google Scholar] [CrossRef]
- Isogai, A.; Saito, T.; Fukuzumi, H. TEMPO-oxidized cellulose nanofibers. Nanoscale 2011, 3, 71–85. [Google Scholar] [CrossRef]
- Saito, T.; Isogai, A. TEMPO-Mediated Oxidation of Native Cellulose. The Effect of Oxidation Conditions on Chemical and Crystal Structures of the Water-Insoluble Fractions. Biomacromolecules 2004, 5, 1983–1989. [Google Scholar] [CrossRef]
- Besbes, I.; Alila, S.; Boufi, S. Nanofibrillated cellulose from TEMPO-oxidized eucalyptus fibres: Effect of the carboxyl content. Carbohydr. Polym. 2011, 84, 975–983. [Google Scholar] [CrossRef]
- Fras, L.; Stana-Kleinschek, K. Quantitative determination of carboxyl groups in cellulose by complexometric titration. Lenzing. Ber. 2002, 81, 80–88. [Google Scholar]
- Vilaseca, F.; Serra, A.; Kochumalayil, J.J. Xyloglucan coating for enhanced strength and toughness in wood fibre networks. Carbohydr. Polym. 2020, 229, 115540. [Google Scholar] [CrossRef]
- Henriksson, M.; Berglund, L.; Isaksson, P.; Lindström, T.; Nishino, T. Cellulose Nanopaper Structures of High Toughness Cellulose Nanopaper Structures of High Toughness. Biomacromolecules 2008, 9, 1579–1585. [Google Scholar] [CrossRef]
- Marx-Figini, M. The control of molecular weight and molecular-weight distribusion in the biogenesis of cellulose. In Cellulose and Other Natural Polymer Systems; Springer: Boston, MA, USA, 1982; pp. 243–271. [Google Scholar]
- Berglund, L.; Noël, M.; Aitomäki, Y.; Öman, T.; Oksman, K. Production potential of cellulose nanofibers from industrial residues: Efficiency and nanofiber characteristics. Ind. Crop. Prod. 2016, 92, 84–92. [Google Scholar] [CrossRef]
- Feng, Y.H.; Cheng, T.Y.; Yang, W.G.; Ma, P.T.; He, H.Z.; Yin, X.C.; Yu, X.X. Characteristics and environmentally friendly extraction of cellulose nanofibrils from sugarcane bagasse. Ind. Crop. Prod. 2018, 111, 285–291. [Google Scholar] [CrossRef]
- Hassan, M.; Berglund, L.; Hassan, E.; Abou-Zeid, R.; Oksman, K. Effect of xylanase pretreatment of rice straw unbleached soda and neutral sulfite pulps on isolation of nanofibers and their properties. Cellulose 2018, 25, 2939–2953. [Google Scholar] [CrossRef]
- Rodriguez, A.; Moral, A.; Serrano, L.; Labidi, J.; Jiménez, L. Rice straw pulp obtained by using various methods. Bioresour. Technol. 2008, 99, 2881–2886. [Google Scholar] [CrossRef] [PubMed]
- Boufi, S.; Gandini, A. Triticale crop residue: A cheap material for high performance nanofibrillated cellulose. RSC Adv. 2015, 5, 3141–3151. [Google Scholar] [CrossRef]
- Claro, P.I.C.; Corrêa, A.C.; de Campos, A.; Rodrigues, V.B.; Luchesi, B.R.; Silva, L.E.; Mattoso, L.H.C.; Marconcini, J.M. Curaua and eucalyptus nanofibers films by continuous casting: Mechanical and thermal properties. Carbohydr. Polym. 2018, 181, 1093–1101. [Google Scholar] [CrossRef]
- Abe, K.; Yano, H. Comparison of the characteristics of cellulose microfibril aggregates of wood, rice straw and potato tuber. Cellul. 2009, 16, 1017–1023. [Google Scholar] [CrossRef]
- Hospodarova, V.; Singovszka, E.; Števulová, N. Characterization of Cellulosic Fibers by FTIR Spectroscopy for Their Further Implementation to Building Materials. Am. J. Anal. Chem. 2018, 9, 303–310. [Google Scholar] [CrossRef]
- Shinoda, R.; Saito, T.; Okita, Y.; Isogai, A. Relationship between Length and Degree of Polymerization of TEMPO-Oxidized Cellulose Nanofibrils. Biomacromolecules 2012, 13, 842–849. [Google Scholar] [CrossRef]
- Peresin, M.S.; Habibi, Y.; Zoppe, J.O.; Pawlak, J.J.; Rojas, O.J. Nanofiber Composites of Polyvinyl Alcohol and Cellulose Nanocrystals: Manufacture and Characterization. Biomacromolecules 2010, 11, 674–681. [Google Scholar] [CrossRef]
- Qua, E.H.; Hornsby, P.R.; Sharma, H.S.S.; Lyons, G.; McCall, R.D. Preparation and characterization of poly(vinyl alcohol) nanocomposites made from cellulose nanofibers. J. Appl. Polym. Sci. 2009, 113, 2238–2247. [Google Scholar] [CrossRef]
- Lavoratti, A.; Scienza, L.C.; Zattera, A.J. Dynamic Mechanical Analysis of Cellulose Nanofiber/Polyester Resin Composites. In Proceedings of the ICCM International Conference on Composite Materials, Copenhagen, Denmark, 19–24 July 2015. [Google Scholar]


| Agro-Industrial Waste | Chemical Composition (% w/w) | Ref. | |||
|---|---|---|---|---|---|
| Cellulose | Hemicellulose | Lignin | Ash | ||
| Sugarcane bagasse | 30.2 | 56.7 | 13.4 | 1.9 | [3] |
| Rice straw | 36.2 | 23.5 | 15.6 | 12.4 | [4] |
| Corn stalks | 61.2 | 19.3 | 6.9 | 10.8 | [3] |
| Sawdust | 45.1 | 28.1 | 24.2 | 1.2 | [3,5] |
| Sugar beet waste | 26.3 | 18.5 | 2.5 | 4.8 | [3] |
| Barley straw | 33.8 | 21.9 | 13.8 | 11 | [6] |
| Cotton stalks | 58.5 | 14.4 | 21.5 | 10 | [6] |
| Oat straw | 39.4 | 27.1 | 17.5 | 8 | [5] |
| Soya stalks | 34.5 | 24.8 | 19.8 | 10.4 | [7] |
| Sunflower stalks | 42.1 | 29.7 | 13.4 | 11.2 | [7] |
| Wheat straw | 32.9 | 24.0 | 8.9 | 6.7 | [5,6] |
| α-Cellulose | Pentosan | Klason Lignin | Benzene-Ethanol Extractives | Hot-Water Extractives | Ashes |
|---|---|---|---|---|---|
| 41.2 | 19.5 | 21.9 | 0.56 | 7.3 | 9.2 |
| Amount of NaClO (mmol/g) | Oxidation Time (min) | Water Retention Value (%) | Carboxylic Groups (mmol/g) | Degree of Polymerization DP | Viscous Molecular Weight (g/mol) |
|---|---|---|---|---|---|
| 3 | 110 | 220 | 0.23 | 356 | 57,600 |
| 5 | 140 | 290 | 0.49 | 330 | 48,600 |
| 8 | 190 | 421 | 0.59 | 248 | 40,300 |
| 12 | 220 | 540 | 0.99 | 180 | 29,200 |
| Sample | |||||||
|---|---|---|---|---|---|---|---|
| PVA | 67.9 | 193.2 | 167.8 | 54.69 | 30.47 | 39.3 | 21.9 |
| PVA/r-CNF2.5 | 69.0 | 194.8 | 176.9 | 27.73 | 30.84 | 19.9 | 22.2 |
| PVA/r-CNF5 | 69.3 | 194.8 | 178.7 | 28.36 | 35.85 | 20.4 | 25.8 |
| PVA/h-CNF2.5 | 69.7 | 194.9 | 171.1 | 27.22 | 25.66 | 19.6 | 18.5 |
| PVA/h-CNF5 | 70.2 | 194.3 | 175.4 | 26.23 | 25.02 | 18.9 | 18.0 |
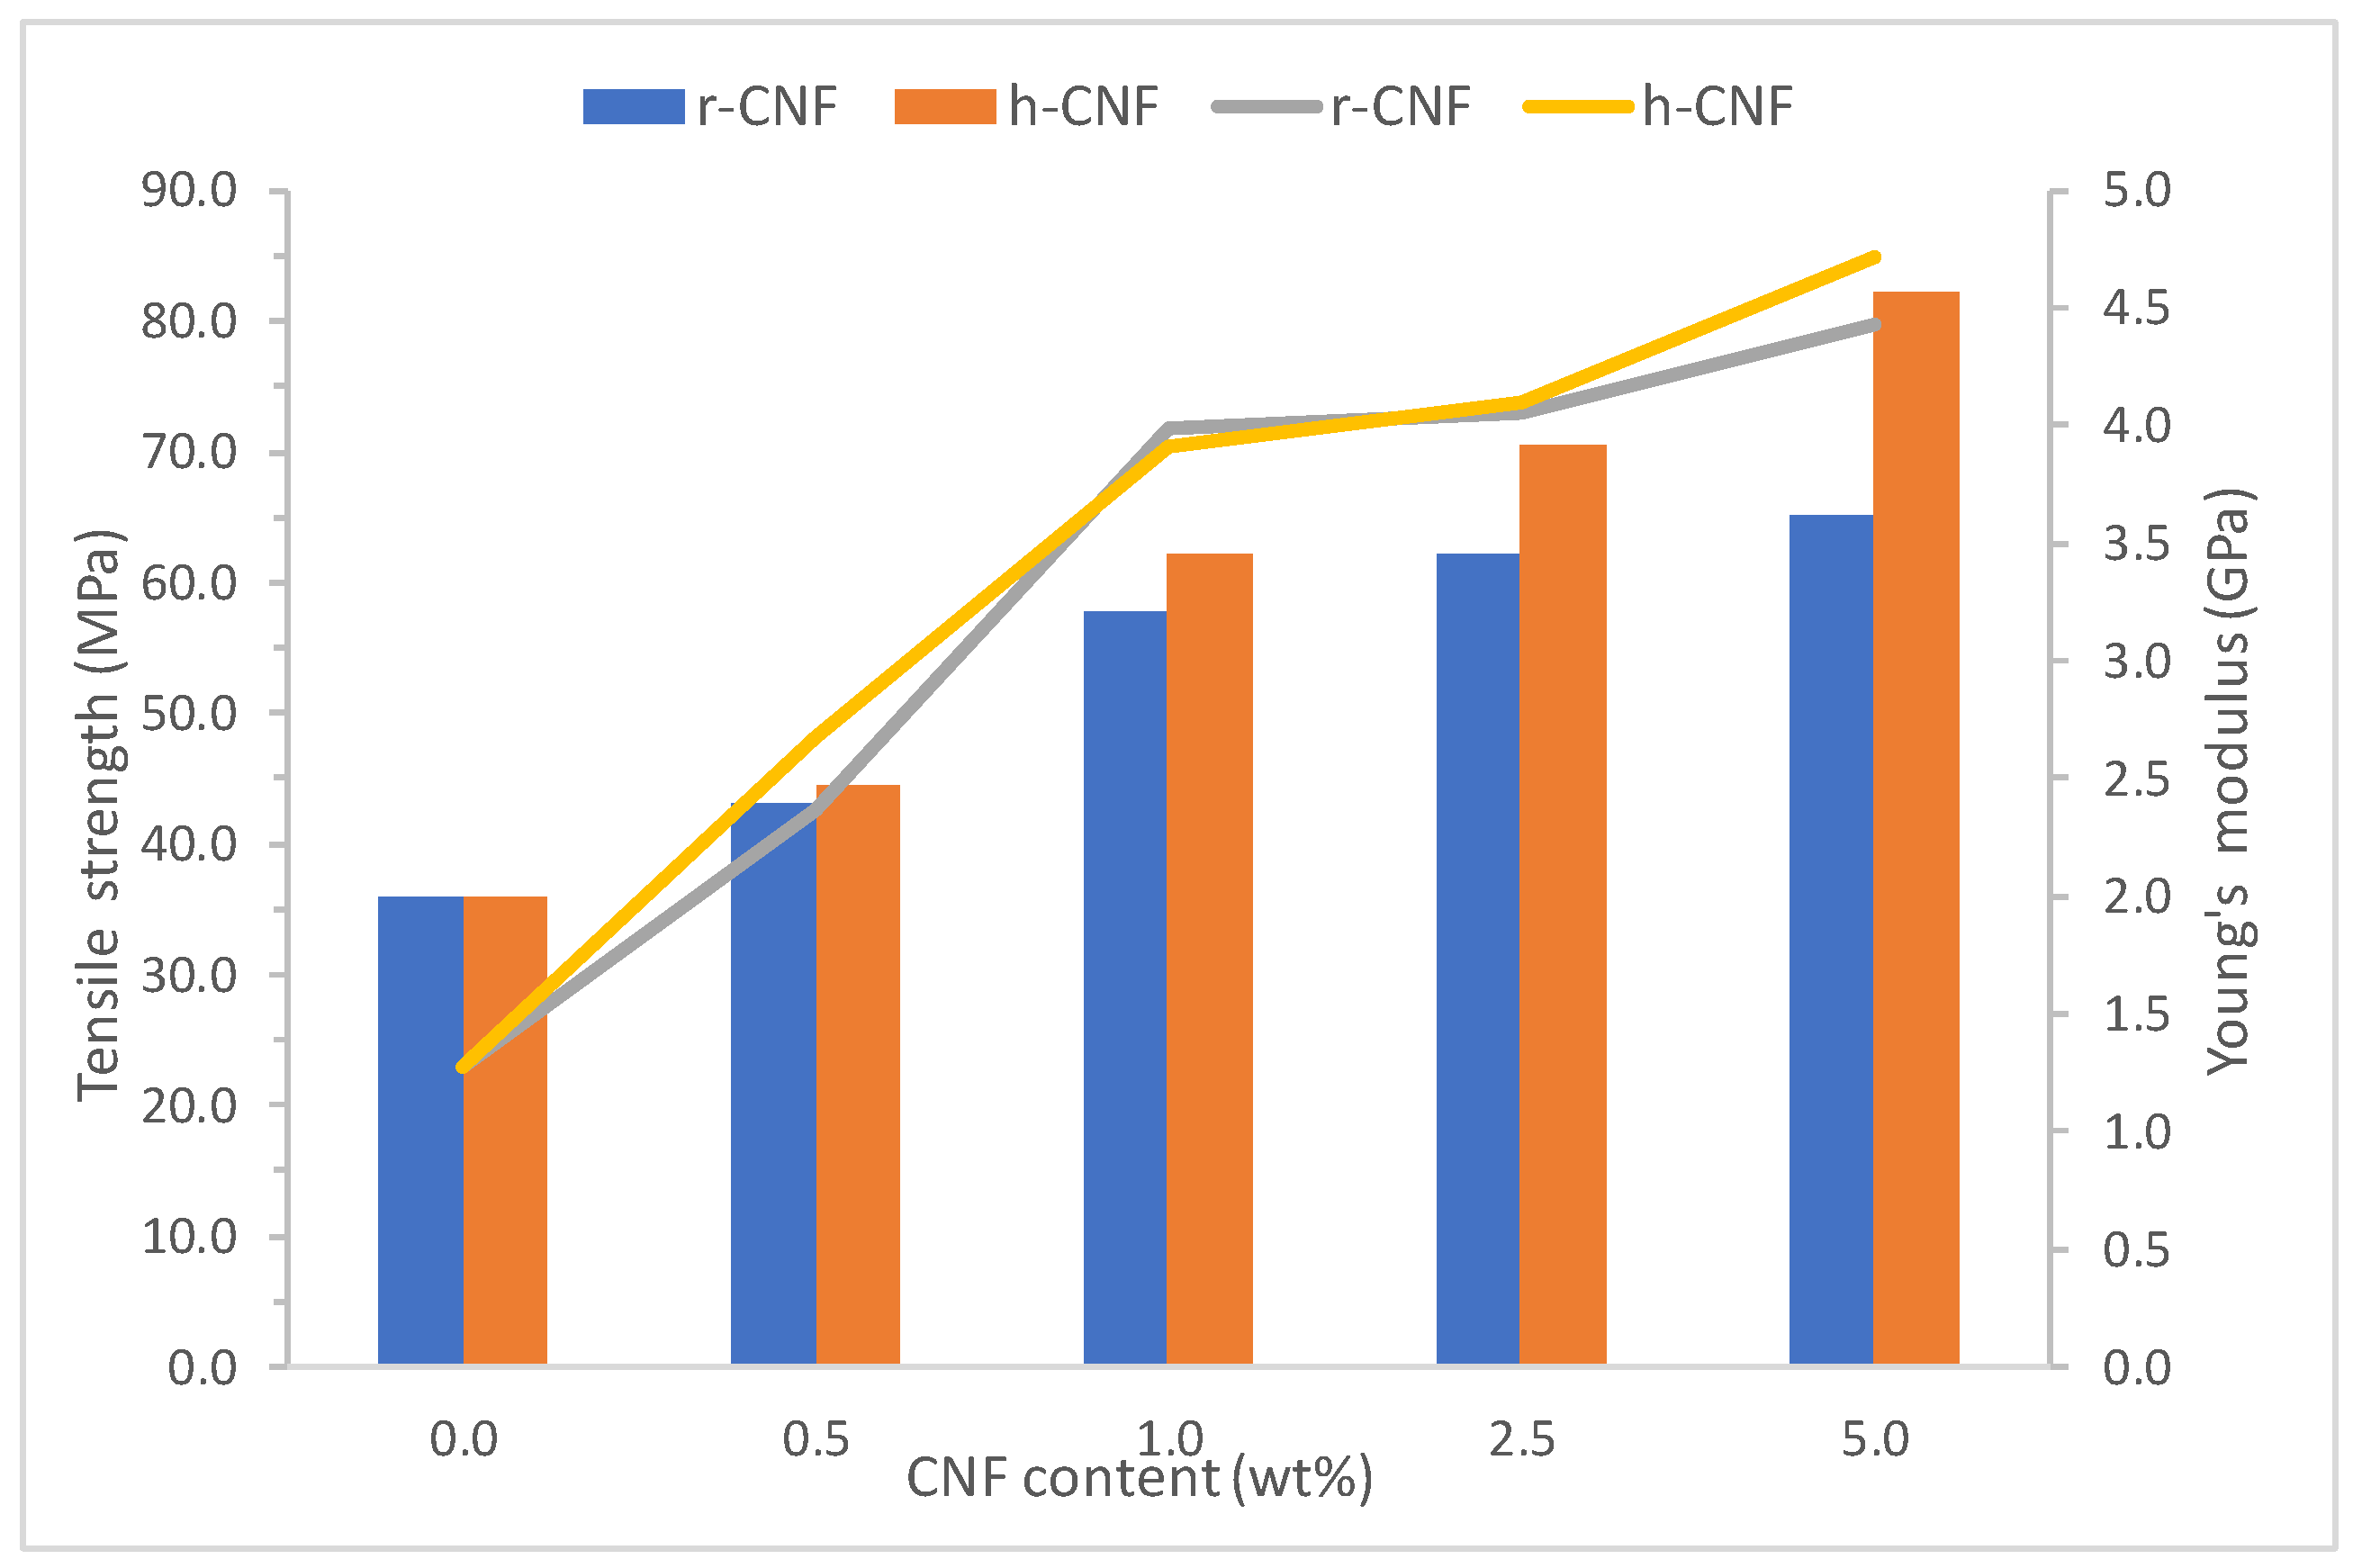
| Sample | σ(MPa) | ||
|---|---|---|---|
| PVA | 1.27 ± 0.1 | 35.9 ± 1.5 | 136.5 ± 10.5 |
| PVA/r-CNF0.5 | 2.37 ± 0.3 | 43,1 ± 2.0 | 105.1 ± 5.2 |
| PVA/r-CNF1 | 3.99 ± 0.1 | 57.8 ± 1.3 | 2.54 ± 1.7 |
| PVA/r-CNF2.5 | 4.05 ± 0.1 | 62.1 ± 2.0 | 1.90 ± 1.2 |
| PVA/r-CNF5 | 4.43 ± 0.2 | 65.1 ± 1.1 | 1.76 ± 0.5 |
| PVA/h-CNF0.5 | 2.67 ± 0.2 | 44.6 ± 2.9 | 128.8 ± 7.7 |
| PVA/h-CNF1 | 3.91 ± 0.1 | 62.1 ± 2.0 | 2.99 ± 2.5 |
| PVA/h-CNF2.5 | 4.10 ± 0.1 | 70.6 ± 2.1 | 3.42 ± 1.3 |
| PVA/h-CNF5 | 4.72 ± 0.2 | 82.2 ± 1.4 | 3.66 ± 0.8 |
© 2020 by the authors. Licensee MDPI, Basel, Switzerland. This article is an open access article distributed under the terms and conditions of the Creative Commons Attribution (CC BY) license (http://creativecommons.org/licenses/by/4.0/).
Share and Cite
Alcántara, J.C.; González, I.; Pareta, M.M.; Vilaseca, F. Biocomposites from Rice Straw Nanofibers: Morphology, Thermal and Mechanical Properties. Materials 2020, 13, 2138. https://doi.org/10.3390/ma13092138
Alcántara JC, González I, Pareta MM, Vilaseca F. Biocomposites from Rice Straw Nanofibers: Morphology, Thermal and Mechanical Properties. Materials. 2020; 13(9):2138. https://doi.org/10.3390/ma13092138
Chicago/Turabian StyleAlcántara, José Carlos, Israel González, M. Mercè Pareta, and Fabiola Vilaseca. 2020. "Biocomposites from Rice Straw Nanofibers: Morphology, Thermal and Mechanical Properties" Materials 13, no. 9: 2138. https://doi.org/10.3390/ma13092138
APA StyleAlcántara, J. C., González, I., Pareta, M. M., & Vilaseca, F. (2020). Biocomposites from Rice Straw Nanofibers: Morphology, Thermal and Mechanical Properties. Materials, 13(9), 2138. https://doi.org/10.3390/ma13092138