Highly Defective Dark Nano Titanium Dioxide: Preparation via Pulsed Laser Ablation and Application


Abstract
1. Introduction
2. Materials and Methods
2.1. Synthesis of the Materials
2.2. Characterization of the Materials
2.3. Photocatalytic and Antibacterial Activity Studies
3. Results and Discussion
3.1. Structural Studies
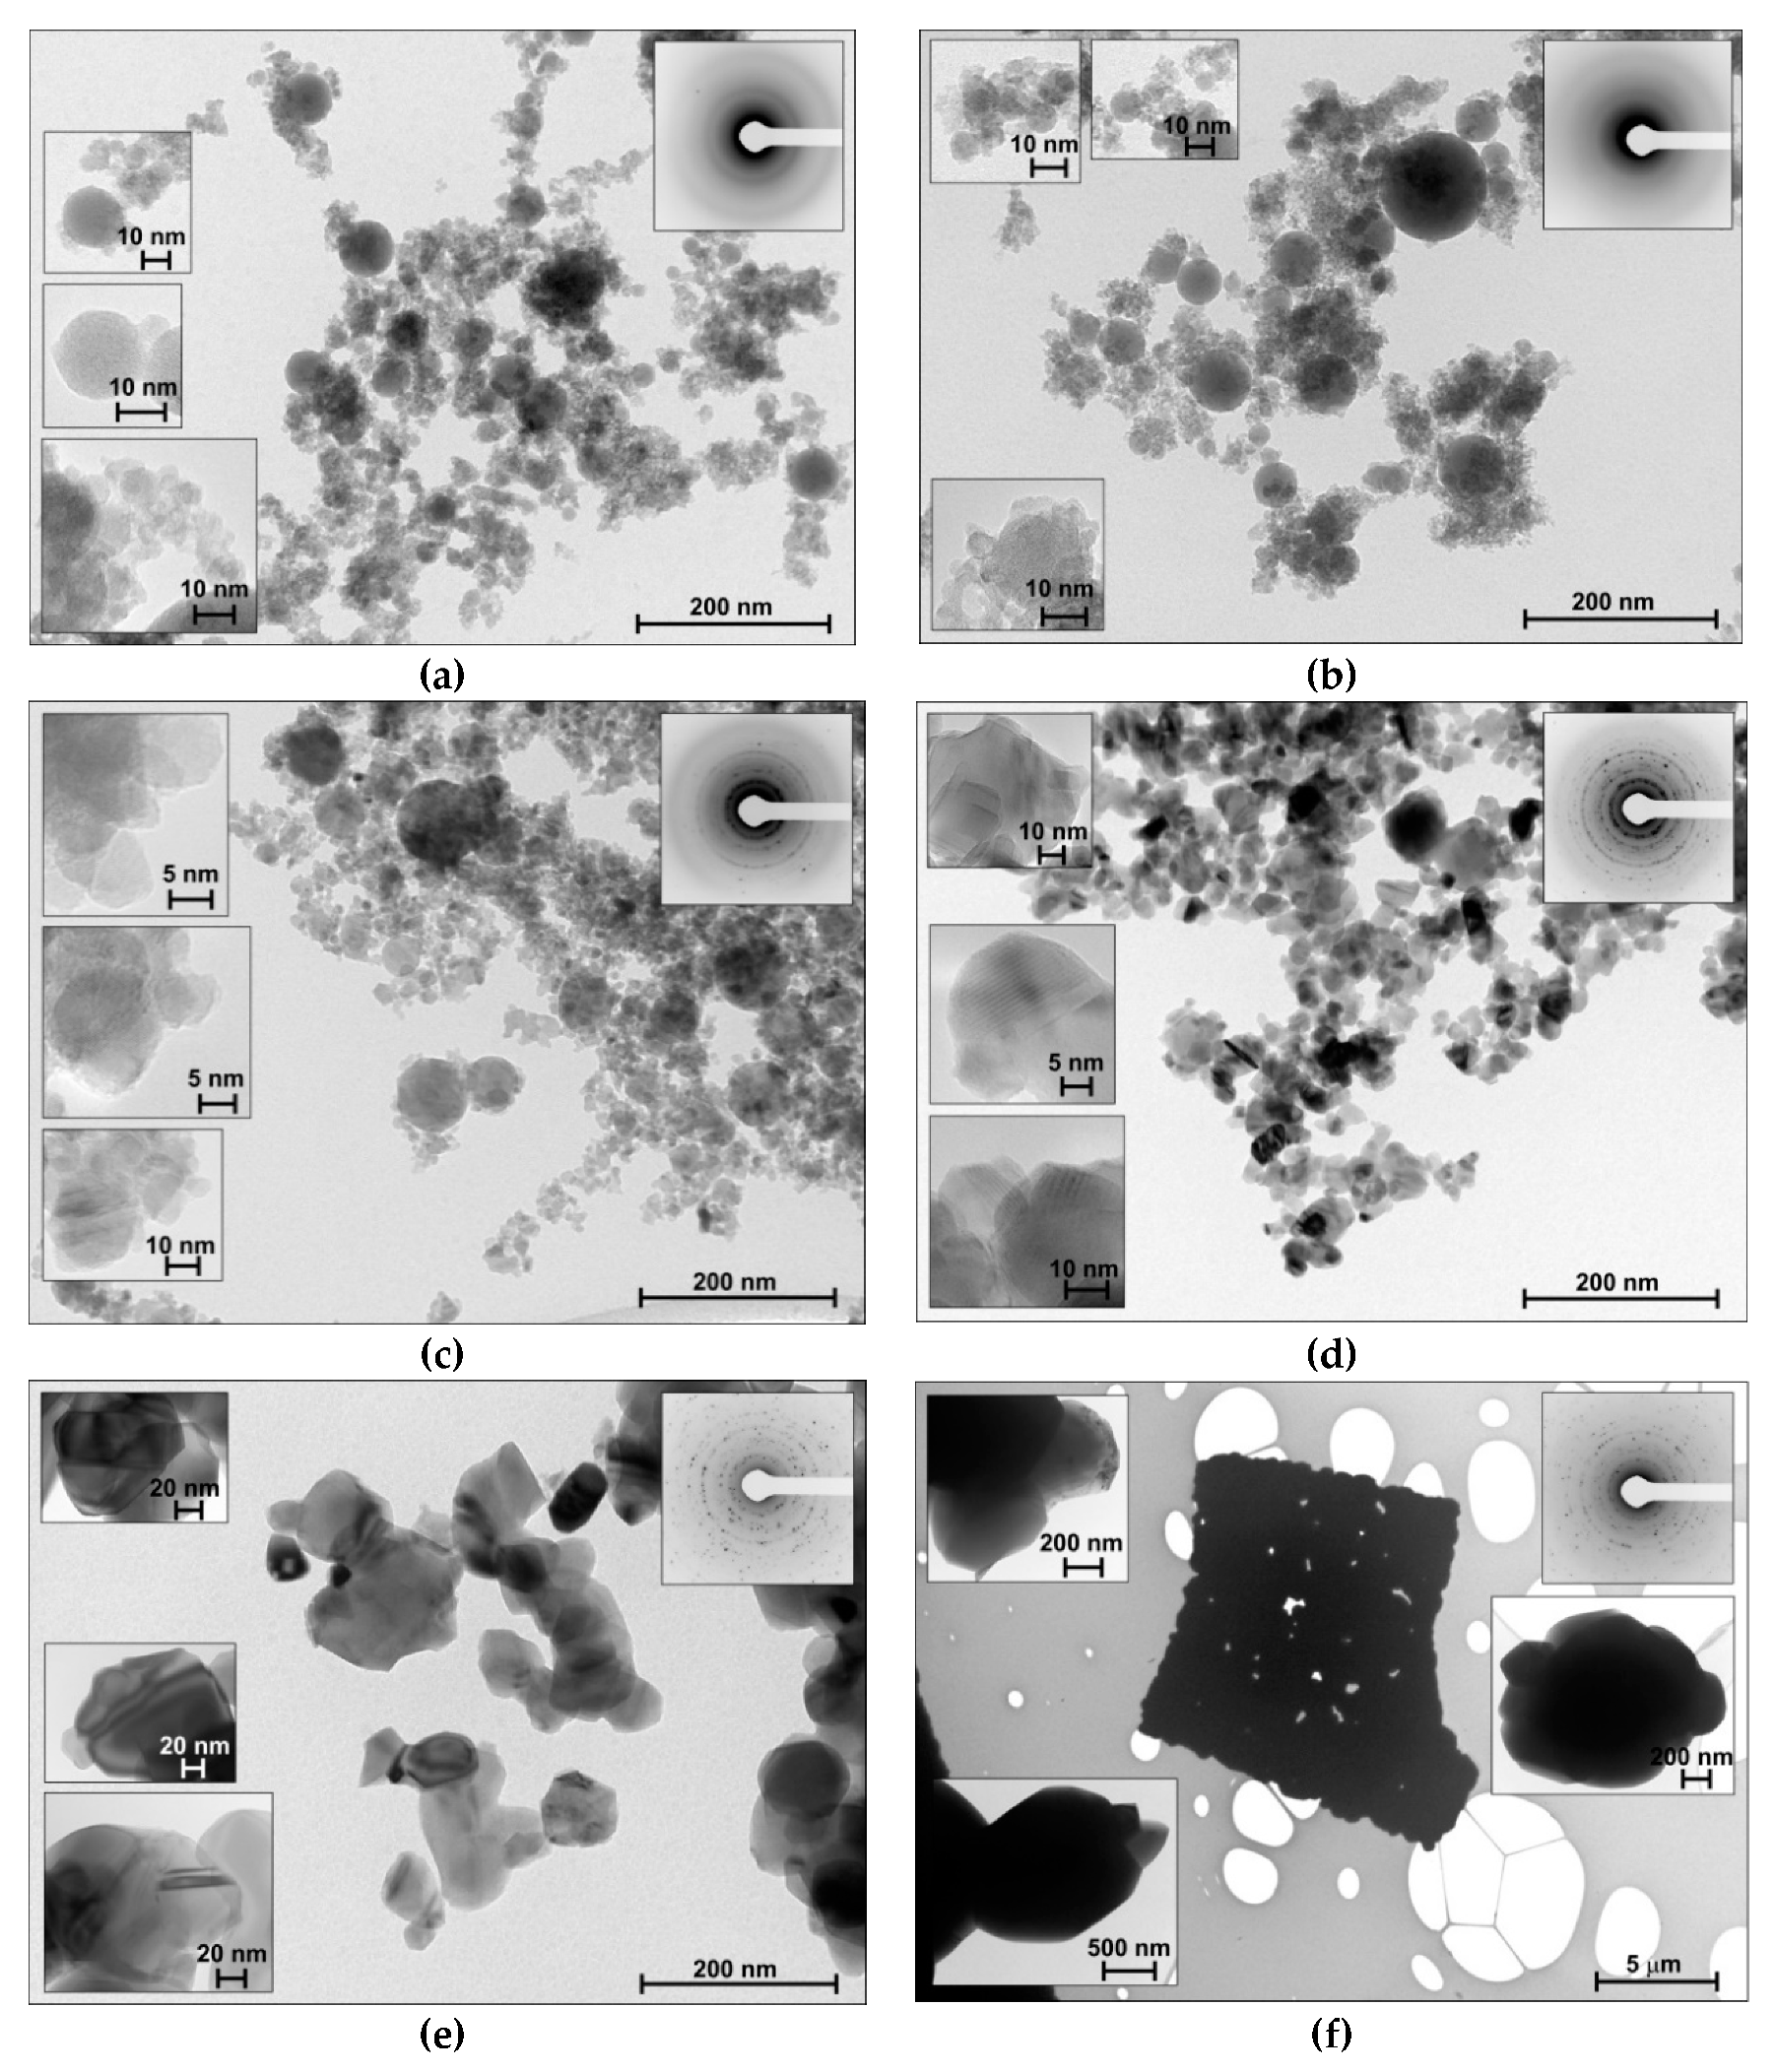
3.1.1. Microscopic Data
3.1.2. Textural Characteristics
3.2. Composition Study
3.2.1. XRD Data
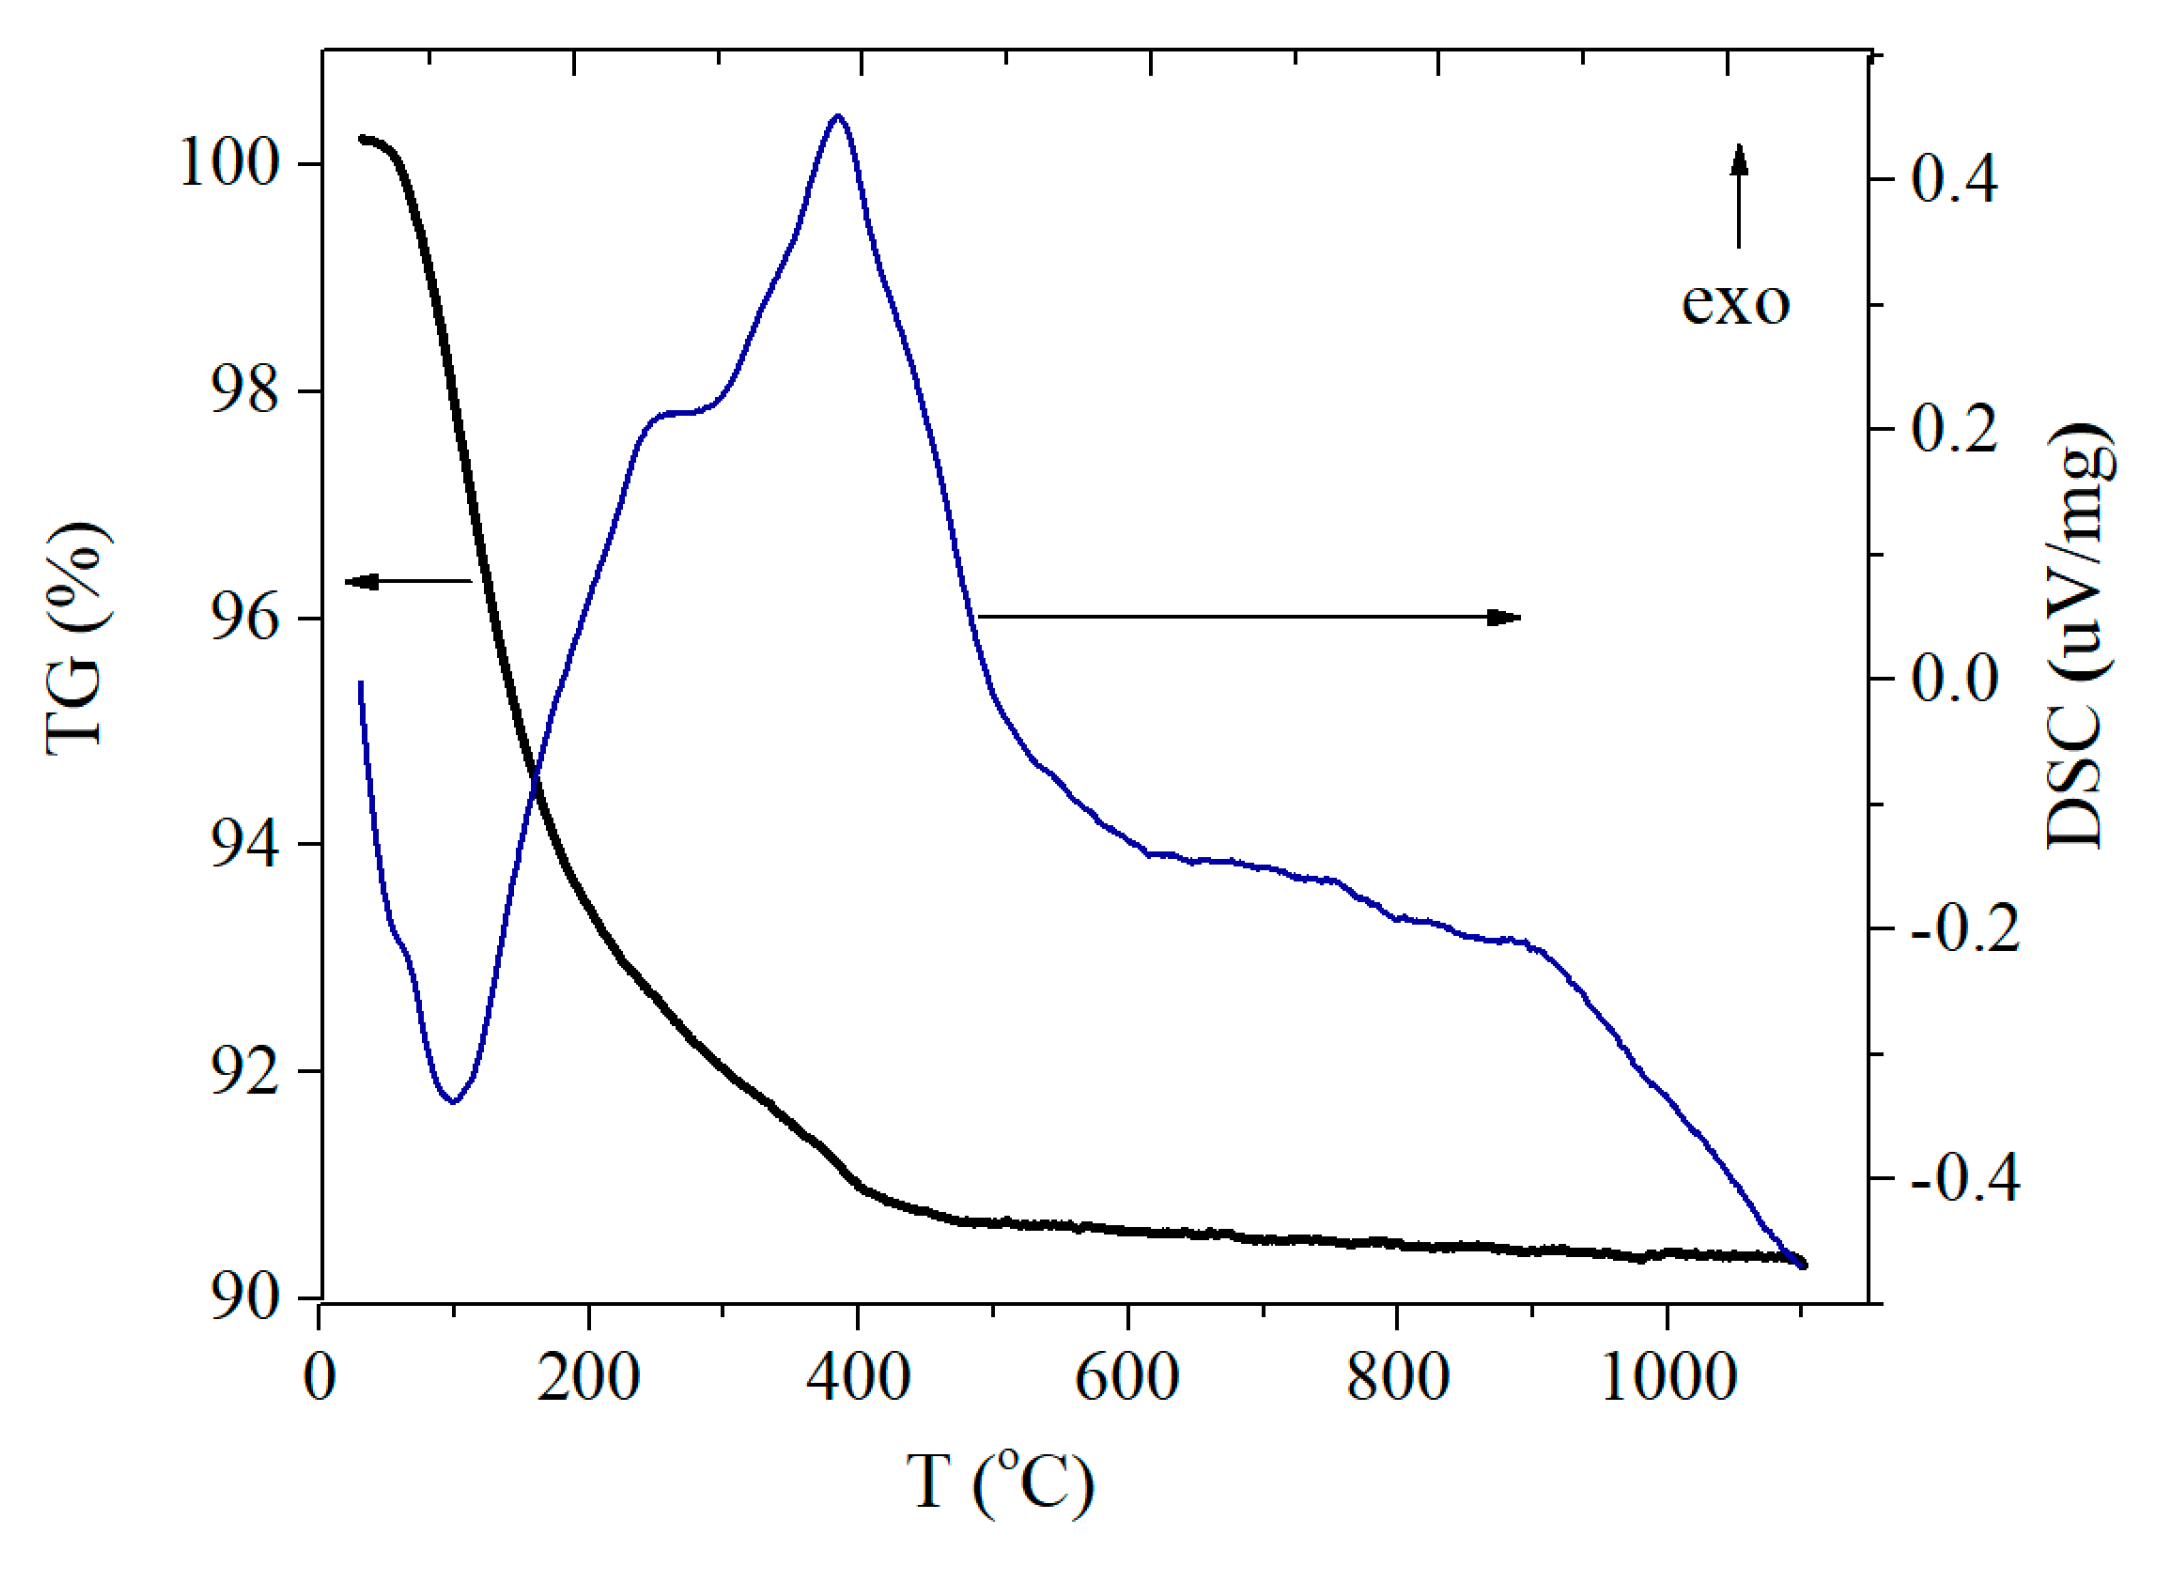
3.2.2. TG/DSC Study
3.2.3. Raman Spectroscopy Studies
3.3. Surface States and Functional Properties Studies
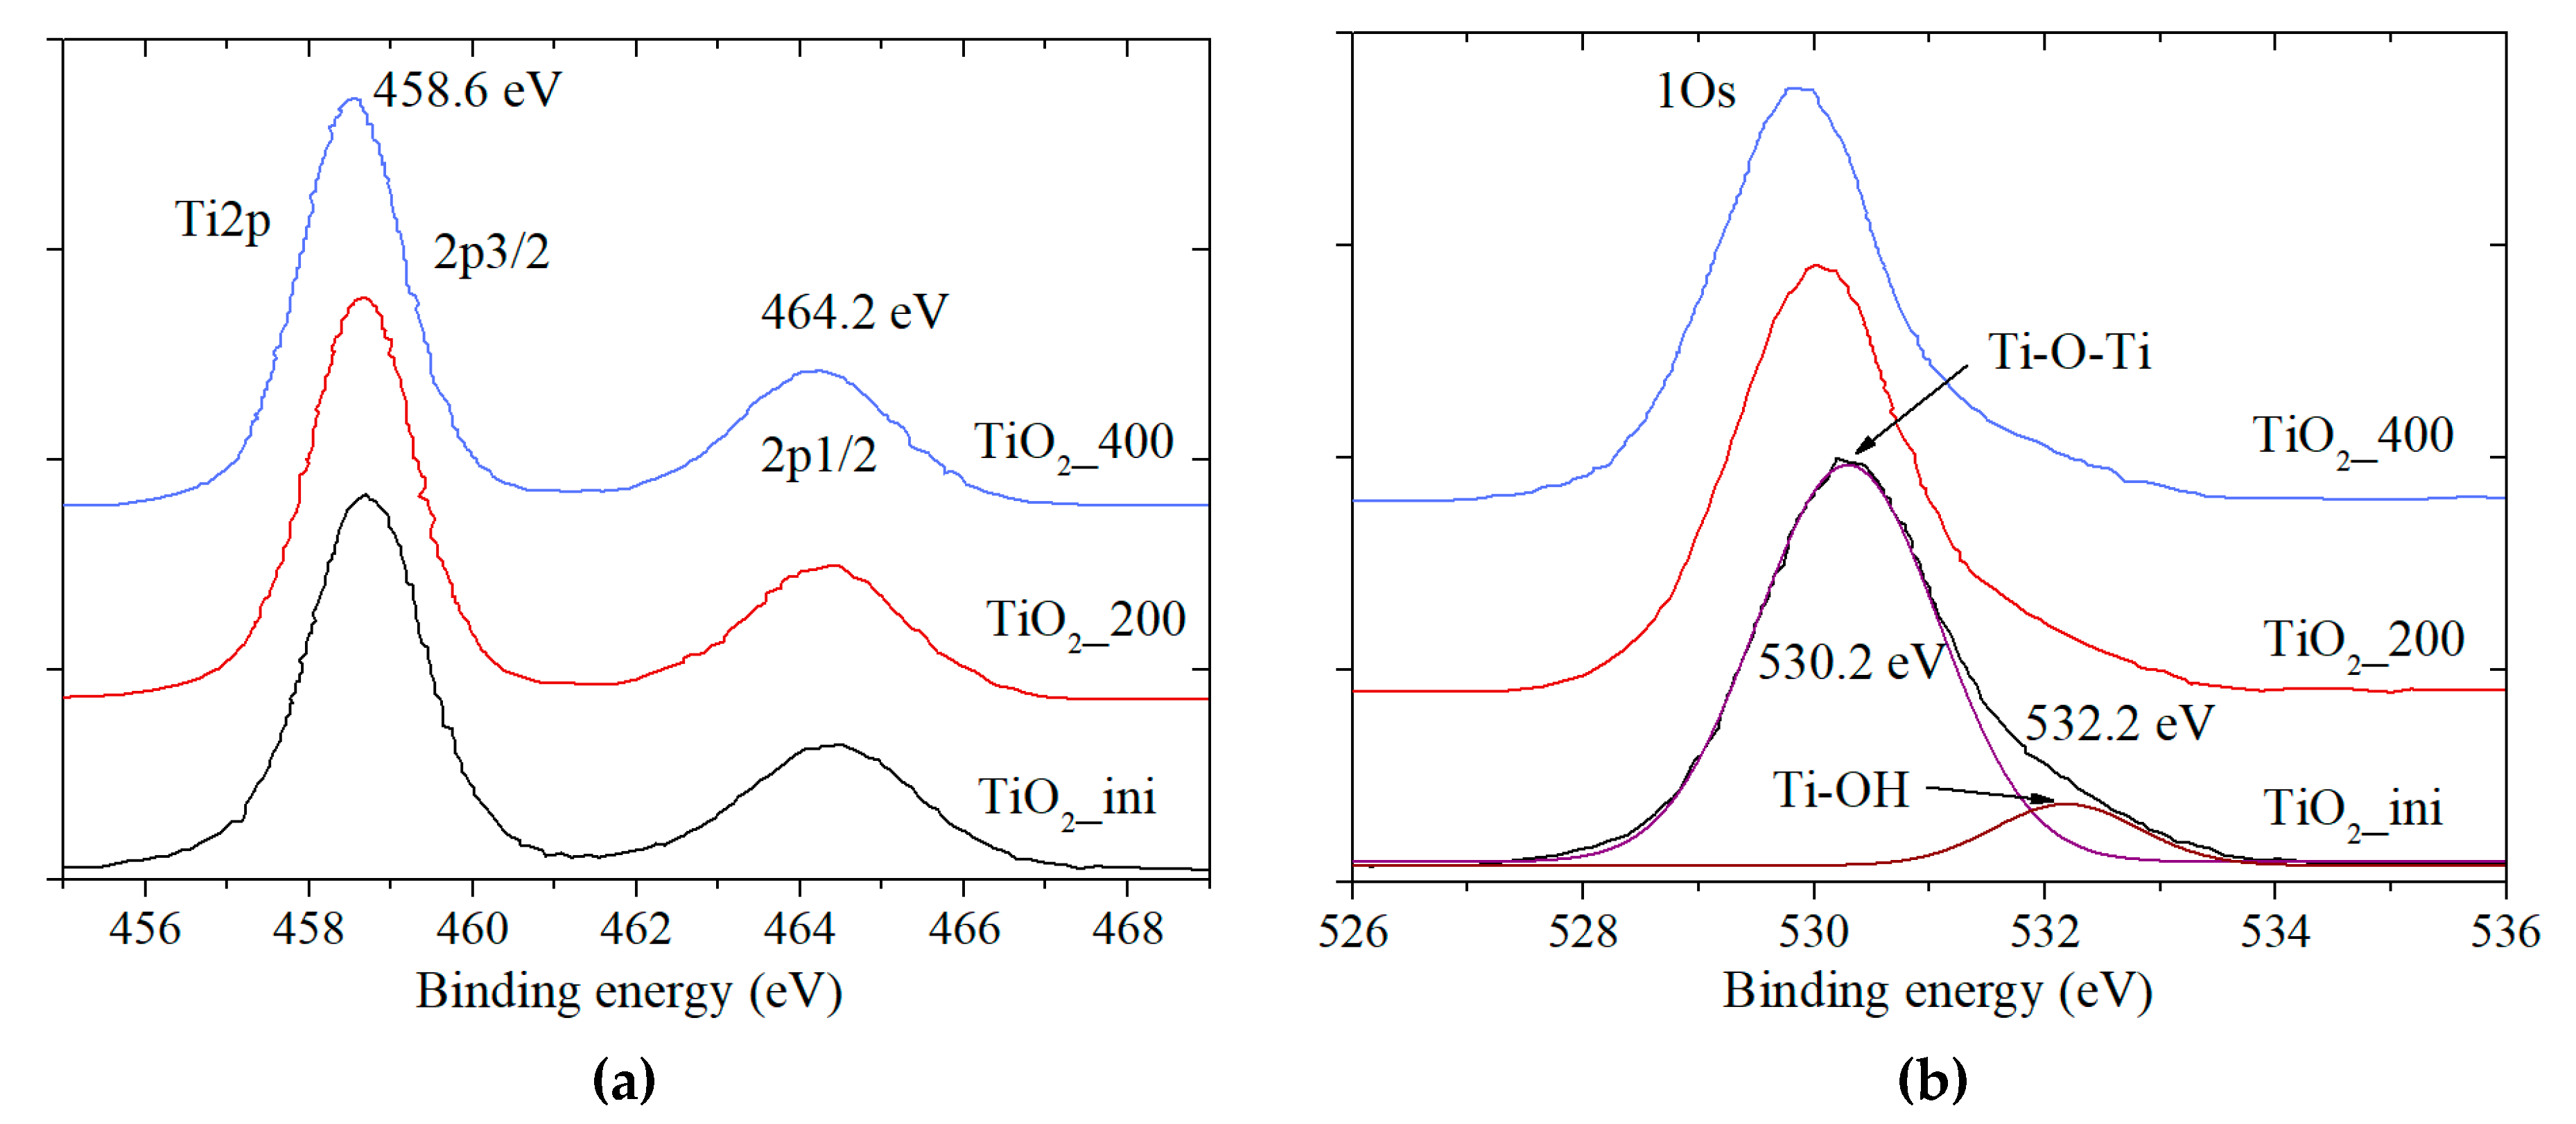
3.3.1. X-Ray Photoelectron Spectroscopy Data
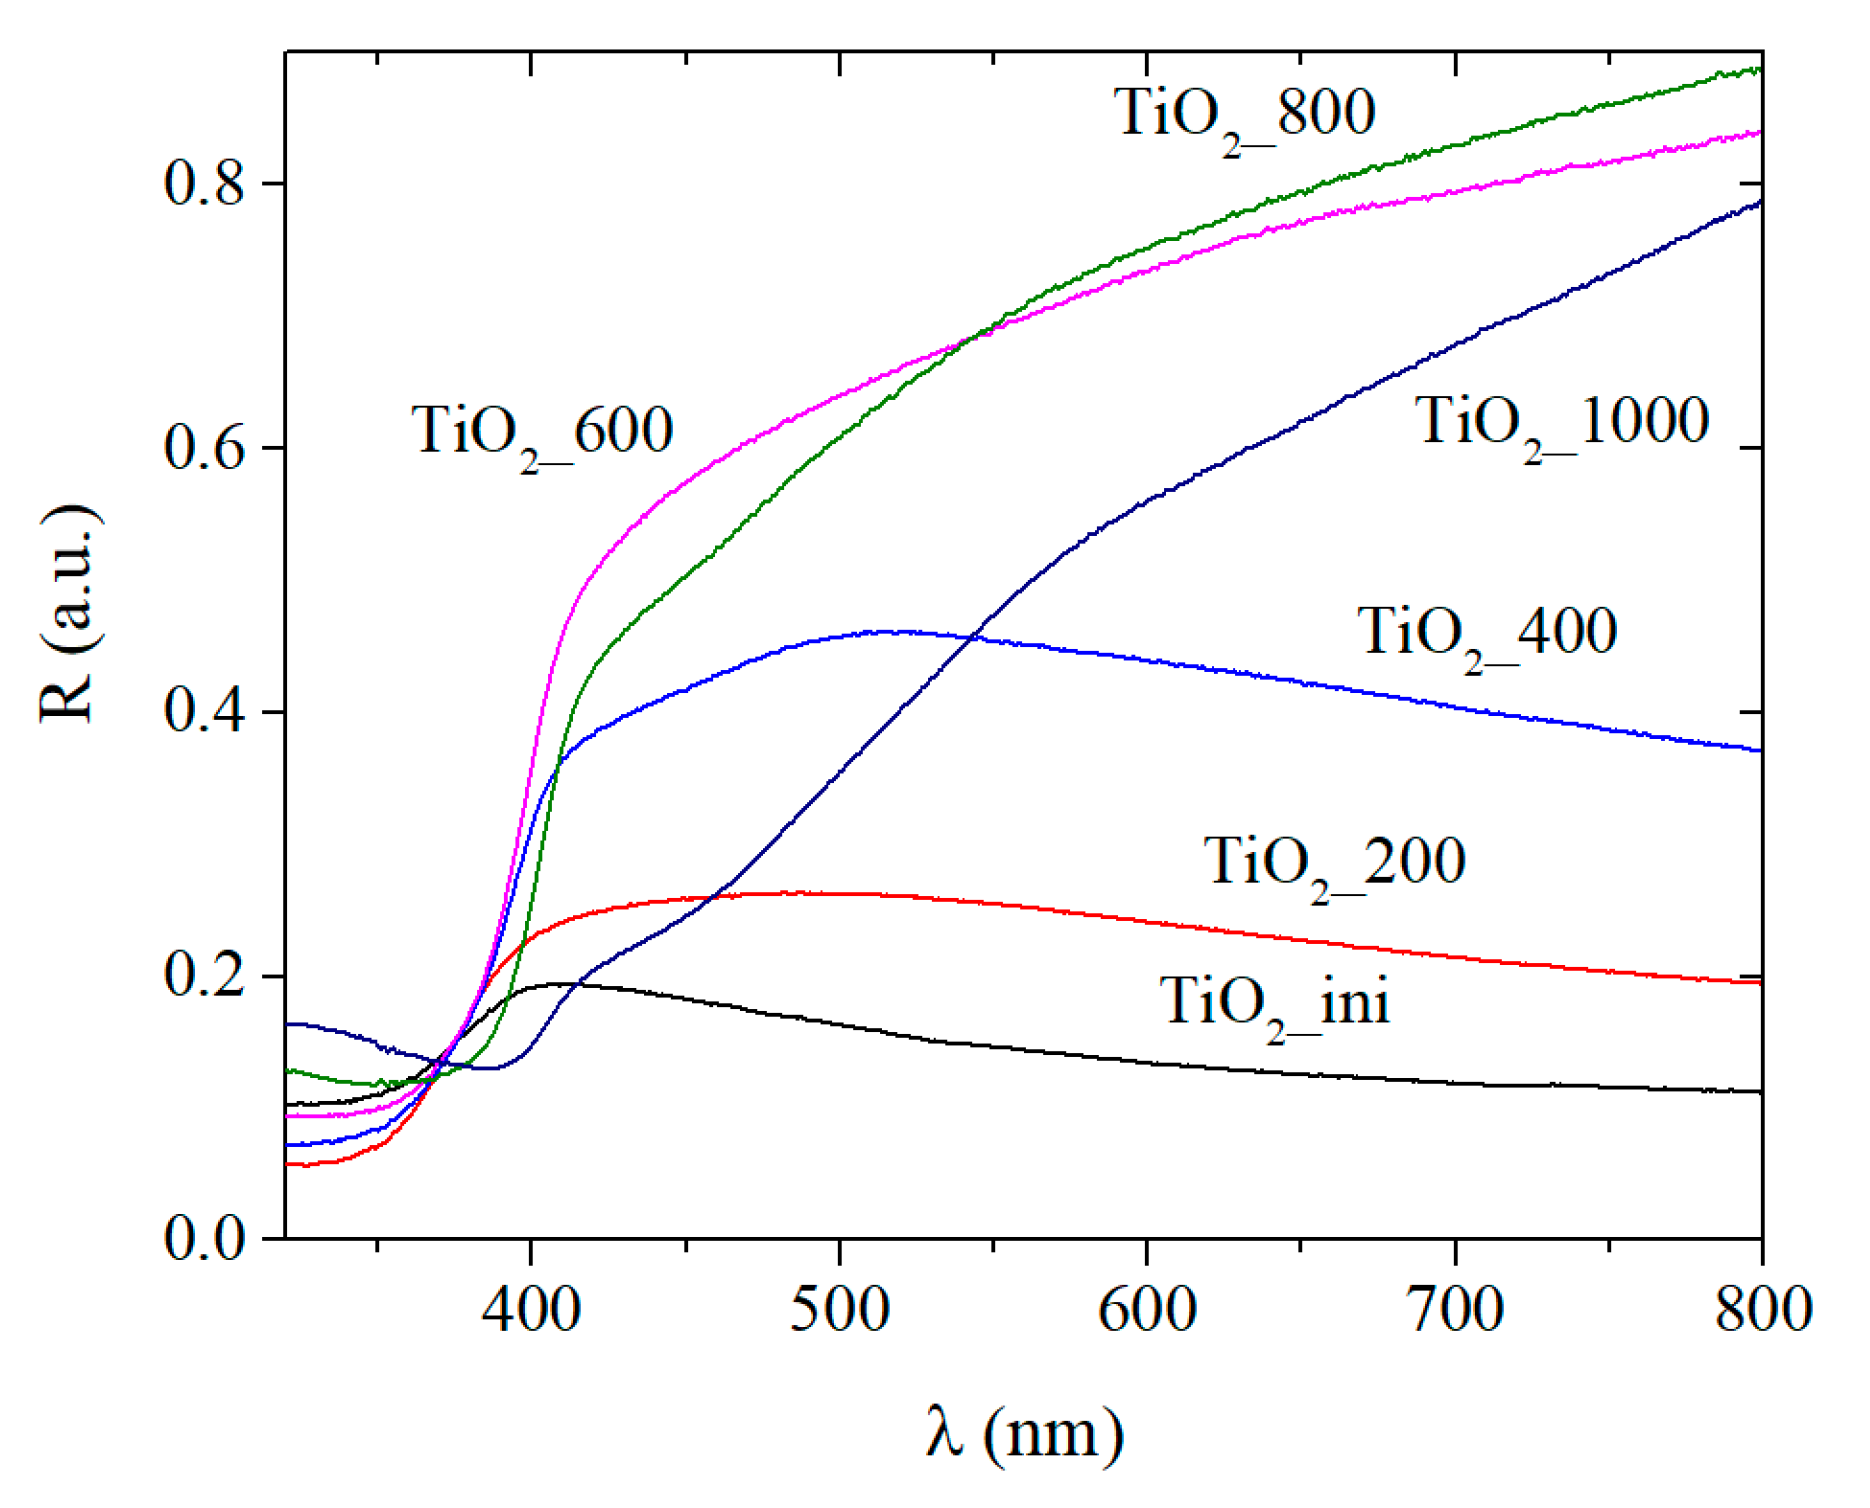
3.3.2. UV-Visible Absorption Spectra
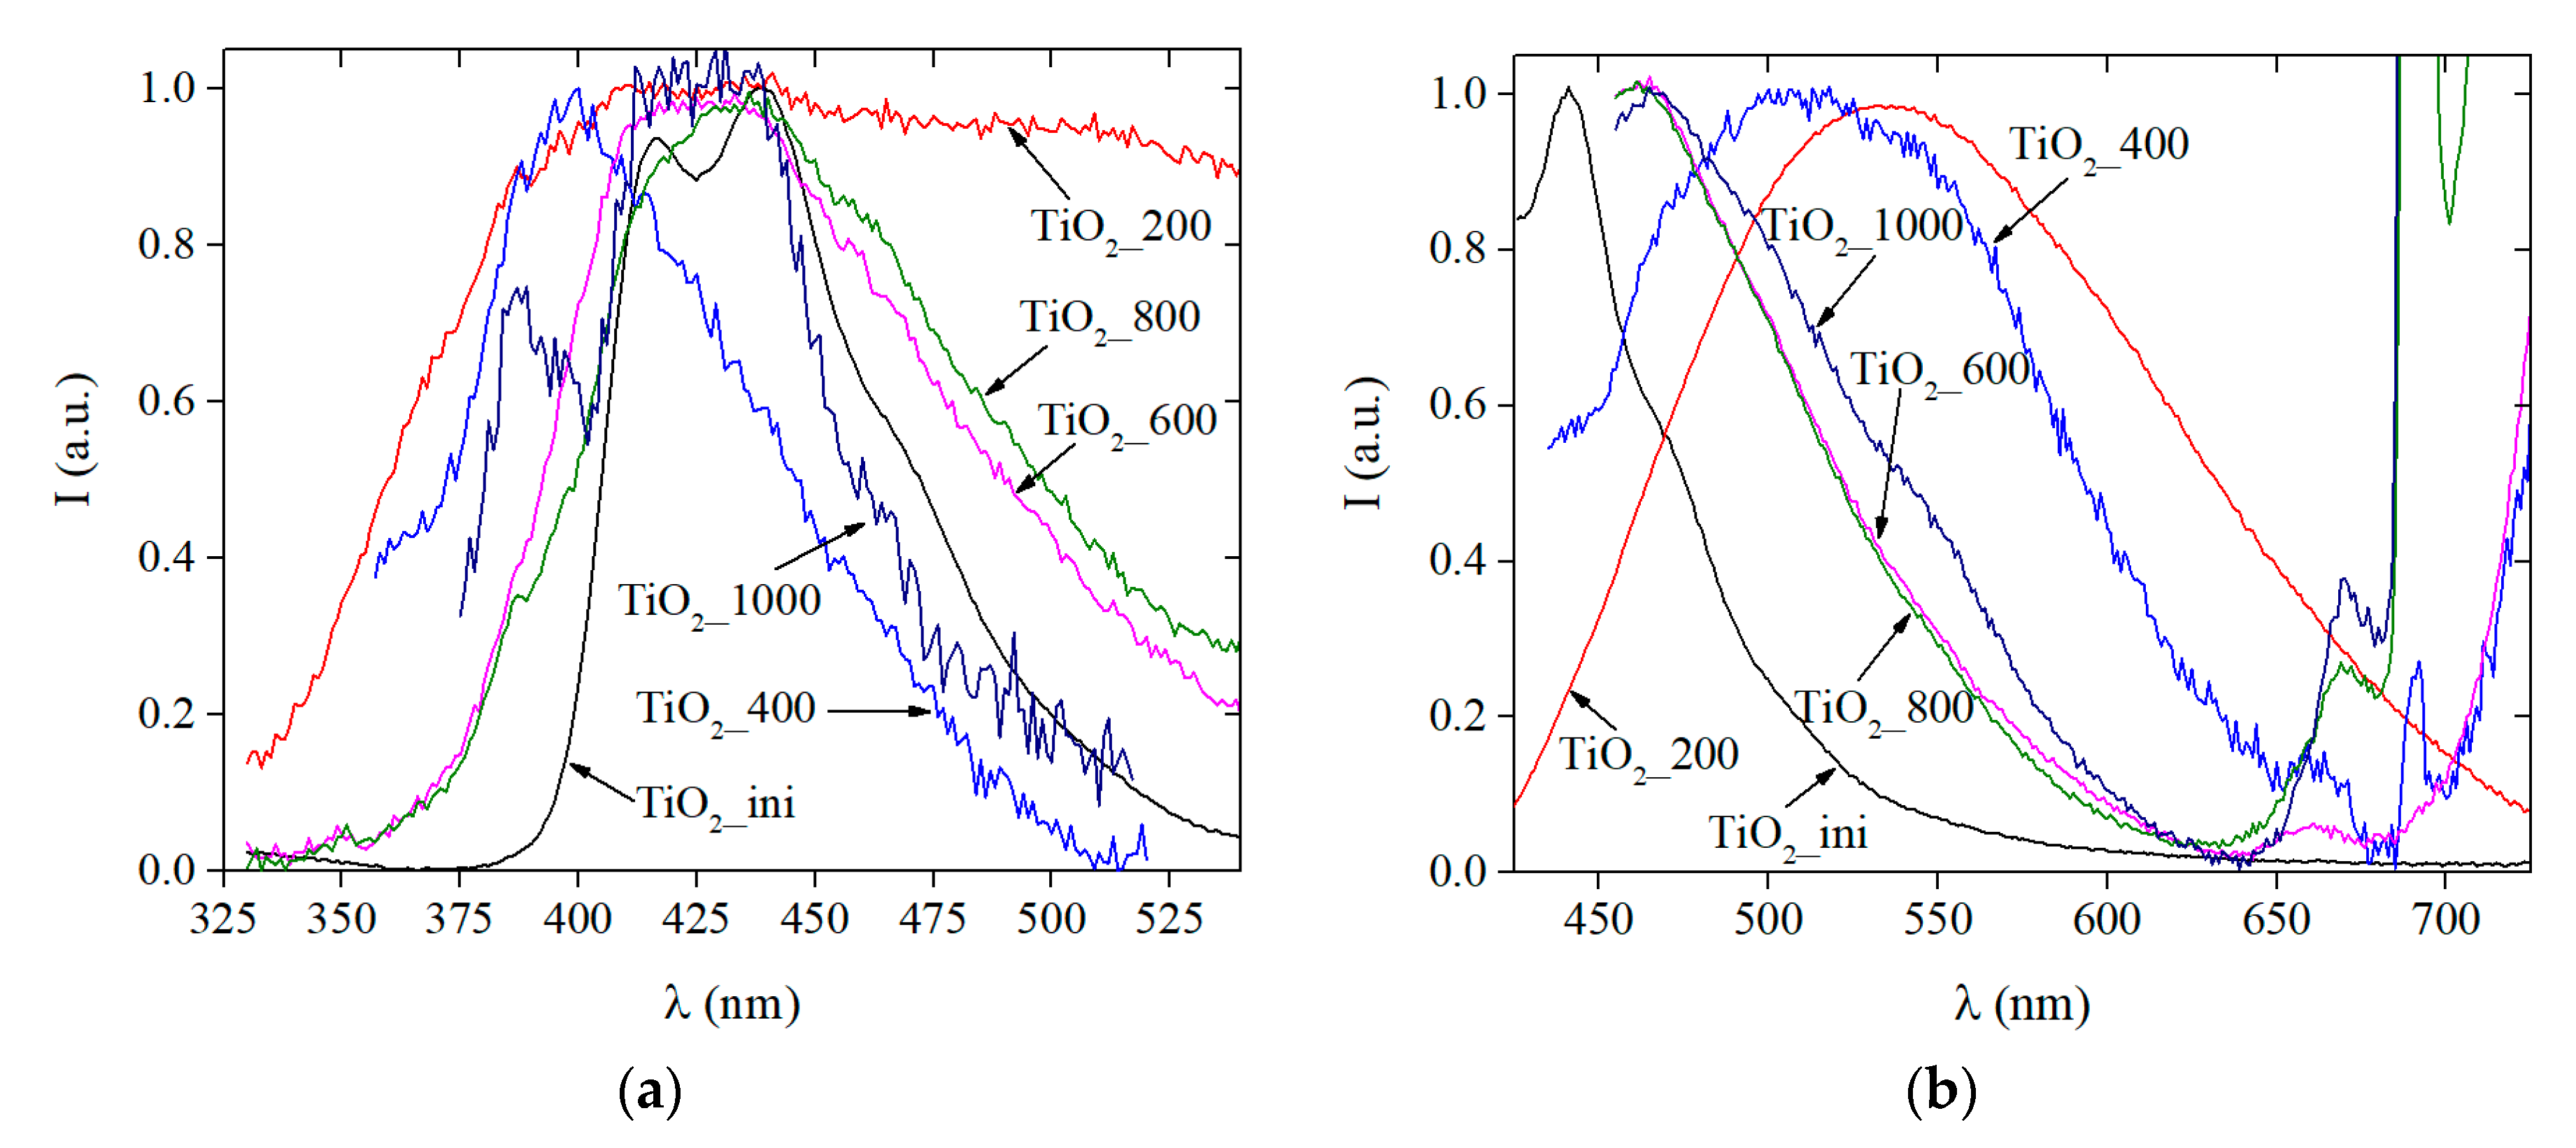
3.3.3. Photoluminescence Data
3.4. Potential Practical Applications
3.4.1. Photocatalytic Activity Data
3.4.2. Antimicrobal Activity Studies
4. Conclusions
Supplementary Materials
Author Contributions
Funding
Acknowledgments
Conflicts of Interest
References
- Ong, C.B.; Ng, L.Y.; Mohammad, A.W. A review of ZnO nanoparticles as solar photocatalysts: Synthesis, mechanisms and applications. Renew. Sustain. Energy Rev. 2018, 81, 536–551. [Google Scholar] [CrossRef]
- Chen, X.; Mao, S.S. Titanium dioxide nanomaterials: Synthesis, properties, modifications and applications. Chem. Rev. 2007, 107, 2891–2959. [Google Scholar] [CrossRef] [PubMed]
- Hanaor, D.A.H.; Sorrell, C.C. Review of the anatase to rutile phase transformation. J. Mater. Sci. 2011, 46, 855–874. [Google Scholar] [CrossRef]
- Xu, B.; Sohn, H.Y.; Mohassab, Y.; Lan, Y. Structures, preparation and applications of titanium suboxides. RSC Adv. 2016, 6, 79706–79722. [Google Scholar] [CrossRef]
- Weir, A.; Westerhoff, P.; Fabricius, L.; Hristovski, K.; von Goetz, N. Titanium dioxide nanoparticles in food and personal care products. Environ. Sci. Technol. 2012, 46, 2242–2250. [Google Scholar] [CrossRef] [PubMed]
- Fujishima, A.; Rao, T.N.; Tryk, D.A. Titanium dioxide photocatalysis. J. Photochem. Photobiol. C 2000, 1, 1–21. [Google Scholar] [CrossRef]
- Zhang, B.; Cao, S.; Du, M.; Ye, X.; Wang, Y.; Ye, J. Titanium Dioxide (TiO2) Mesocrystals: Synthesis, Growth Mechanisms and Photocatalytic Properties. Catalysts 2019, 9, 91. [Google Scholar] [CrossRef]
- Schneider, S.L.; Lim, H.W. A review of inorganic UV filters zinc oxide and titanium dioxide. Photodermatol. Photoimmunol. Photomed. 2019, 35, 442–446. [Google Scholar] [CrossRef]
- Ziental, D.; Czarczynska-Goslinska, B.; Mlynarczyk, D.T.; Glowacka-Sobotta, A.; Stanisz, B.; Goslinski, T.; Sobotta, L. Titanium Dioxide Nanoparticles: Prospects and Applications in Medicine. Nanomaterials 2020, 10, 387. [Google Scholar] [CrossRef]
- Shabalina, A.; Fakhrutdinova, E.; Chen, Y.-W.; Lapin, I. Preparation of gold-modified F,N-TiO2 visible light photocatalysts and their structural features comparative analysis. J. Sol-Gel Sci. Technol. 2015, 75, 617–624. [Google Scholar] [CrossRef]
- Liao, С.; Li, Y.; Tjong, S.C. Visible-Light Active Titanium Dioxide Nanomaterials with Bactericidal Properties. Nanomaterials 2020, 10, 124. [Google Scholar] [CrossRef] [PubMed]
- Kumaravel, V.; Mathew, S.; Bartlett, J.; Pillai, S.C. Photocatalytic hydrogen production using metal doped TiO2: A review of recent advances. Appl. Catal. B 2019, 244, 1021–1064. [Google Scholar] [CrossRef]
- Chen, T.-M.; Xu, G.-Y.; Ren, H.; Zhang, H.; Tian, Z.-Q.; Li, J.-F. Synthesis of Au@TiO2 core–shell nanoparticles with tunable structures for plasmon-enhanced photocatalysis. Nanoscale Adv. 2019, 1, 4522–4528. [Google Scholar] [CrossRef]
- Mintcheva, N.; Srinivasan, P.; Rayappan, J.B.B.; Kuchmizhak, A.A.; Gurbatov, S.; Kulinich, S.A. Room-temperature gas sensing of laser-modified anatase TiO2 decorated with Au nanoparticles. Appl. Surf. Sci. 2020, 507, 145169. [Google Scholar] [CrossRef]
- Mintcheva, N.; Yamaguchi, S.; Kulinich, S.A. Hybrid TiO2-ZnO Nanomaterials Prepared Using Laser Ablation in Liquid. Materials 2020, 13, 719. [Google Scholar] [CrossRef] [PubMed]
- Yan, Y.; Yu, Y.; Wu, D.; Yang, Y.; Cao, Y. TiO2/vanadate (Sr10V6O25, Ni3V2O8, Zn2V2O7) heterostructured photocatalysts with enhanced photocatalytic activity for photoreduction of CO2 into CH4. Nanoscale 2016, 8, 949–958. [Google Scholar] [CrossRef] [PubMed]
- Wang, M.; Nie, B.; Yee, K.-K.; Bian, H.; Lee, C.; Lee, H.K.; Zheng, B.; Lu, J.; Luo, L.; Li, Y.Y. Low-temperature fabrication of brown TiO2 with enhanced photocatalytic activities under visible light. Chem. Commun. 2016, 52, 2988–2991. [Google Scholar] [CrossRef] [PubMed]
- Jiang, X.; Zhang, Y.; Jiang, J.; Rong, Y.; Wang, Y.; Wu, Y.; Pan, C. Characterization of Oxygen Vacancy Associates within Hydrogenated TiO2: A Positron Annihilation Study. J. Phys. Chem. C 2012, 116, 22619–22624. [Google Scholar] [CrossRef]
- Chen, X.; Liu, L.; Yu, P.Y.; Mao, S.S. Increasing Solar Absorption for Photocatalysis with Black Hydrogenated Titanium Dioxide Nanocrystals. Science 2011, 331, 746–750. [Google Scholar] [CrossRef]
- Ullattil, S.G.; Narendranath, S.B.; Pillai, S.C.; Periyat, P. Black TiO2 Nanomaterials: A Review of Recent Advances. Chem. Eng. J. 2018, 343, 708–736. [Google Scholar] [CrossRef]
- Naldoni, A.; Allieta, M.; Santangelo, S.; Marelli, M.; Fabbri, F.; Cappelli, S.; Bianchi, C.L.; Psaro, R.; Dal Santo, V. Effect of Nature and Location of Defects on Bandgap Narrowing in Black TiO2 Nanoparticles. J. Am. Chem. Soc. 2012, 134, 7600–7603. [Google Scholar] [CrossRef] [PubMed]
- Han, L.; Ma, Z.; Luo, Z.; Liu, G.; Mac, J.; An, X. Enhanced visible light and photocatalytic performance of TiO2 nanotubes by hydrogenation at lower temperature. RSC Adv. 2016, 6, 6643–6650. [Google Scholar] [CrossRef]
- Kang, Q.; Cao, J.; Zhang, Y.; Liu, L.; Xu, H.; Ye, J. Reduced TiO2 nanotube arrays for photoelectrochemical water splitting. J. Mater. Chem. A 2013, 1, 5766–5774. [Google Scholar] [CrossRef]
- Zhou, H.; Zhang, Y. Electrochemically Self-Doped TiO2 Nanotube Arrays for Supercapacitors. J. Phys. Chem. C 2014, 118, 5626–5636. [Google Scholar] [CrossRef]
- Chen, X.; Zhao, D.; Liu, K.; Wang, C.; Liu, L.; Li, B.; Zhang, Z.; Shen, D. Laser-Modified Black Titanium Oxide Nanospheres and Their Photocatalytic Activities under Visible Light. ACS Appl. Mater. Interfaces 2015, 7, 16070–16077. [Google Scholar] [CrossRef]
- Goncharova, D.A.; Kharlamova, T.S.; Lapin, I.N.; Svetlichnyi, V.A. Chemical and Morphological Evolution of Copper NPs Obtained by Pulsed Laser Ablation in Liquid. J. Phys. Chem. C 2019, 123, 21731–21742. [Google Scholar] [CrossRef]
- Zhang, D.; Zhang, C.; Liu, J.; Chen, Q.; Zhu, X.; Liang, C. Carbon-Encapsulated Metal/Metal Carbide/Metal Oxide Core–Shell Nanostructures Generated by Laser Ablation of Metals in Organic Solvents. ACS Appl. Nano Mater. 2019, 2, 28–39. [Google Scholar] [CrossRef]
- Kanitz, A.; Kalus, M.-R.; Gurevich, E.L.; Ostendorf, A.; Barcikowski, S.; Amans, D. Review on experimental and theoretical investigations of the early stage, femtoseconds to microseconds processes during laser ablation in liquid-phase for the synthesis of colloidal nanoparticles. Plasma Sources Sci. Technol. 2019, 28, 103001. [Google Scholar] [CrossRef]
- Reichenberger, S.; Marzun, G.; Muhler, M.; Barcikowski, S. Perspective of Surfactant-free Colloidal Nanoparticles in Heterogeneous Catalysis. ChemCatChem 2019, 11, 1–31. [Google Scholar] [CrossRef]
- Kabashin, A.V.; Delaporte, P.; Pereira, A.; Grojo, D.; Torres, R.; Sarnet, T.; Sentis, M. Nanofabrication with Pulsed Lasers. Nanoscale Res. Lett. 2010, 5, 454–463. [Google Scholar] [CrossRef]
- Ali, N.; Bashir, S.; Chaudhry, U.-i.-K.; Begum, N.; Rafique, M.S.; Husinsky, W. Effect of liquid environment on the titanium surface modification by laser ablation. Appl. Surf. Sci. 2017, 405, 298–307. [Google Scholar] [CrossRef]
- Tian, F.; Sun, J.; Yang, J.; Wu, P.; Wang, H.-L.; Du, X.-W. Preparation and photocatalytic properties of mixed-phase titania nanospheres by laser ablation. Mater. Lett. 2009, 63, 2384–2386. [Google Scholar] [CrossRef]
- Zimbone, M.; Buccheri, M.A.; Cacciato, G.; Sanz, R.; Rappazzo, G.; Boninelli, S.; Reitano, R.; Romano, L.; Privitera, V.; Grimaldi, M.G. Photocatalytical and antibacterial activity of TiO2 nanoparticles obtained by laser ablation in water. Appl. Catal. B 2015, 165, 487–494. [Google Scholar] [CrossRef]
- Sasaki, K.; Nakano, T.; Soliman, W.; Takada, N. Effect of Pressurization on the Dynamics of a Cavitation Bubble Induced by Liquid-Phase Laser Ablation. Appl. Phys. Express 2009, 2, 046501. [Google Scholar] [CrossRef]
- Jasbi, N.E.; Dorranian, D. Effect of aging on the properties of TiO2 nanoparticle. J. Theor. Appl. Phys. 2016, 10, 157–161. [Google Scholar] [CrossRef]
- Huang, C.N.; Bow, J.S.; Zheng, Y.; Chen, S.Y.; Ho, N.J.; Shen, P. Nonstoichiometric Titanium Oxides via Pulsed Laser Ablation in Water. Nanoscale Res. Lett. 2010, 5, 972–985. [Google Scholar] [CrossRef]
- Semaltianos, N.G.; Logothetidis, S.; Frangis, N.; Tsiaoussis, I.; Perrie, W.; Dearden, G.; Watkins, K.G. Laser ablation in water: A route to synthesize nanoparticles of titanium monoxide. Chem. Phys. Lett. 2010, 496, 113–116. [Google Scholar] [CrossRef]
- De Bonis, A.; Galasso, A.; Ibris, N.; Laurita, A.; Santagata, A.; Teghil, R. Rutile microtubes assembly from nanostructures obtained by ultra-short laser ablation of titanium in liquid. Appl. Surf. Sci. 2013, 268, 571–578. [Google Scholar] [CrossRef]
- Amin, M.; Tomko, J.; Naddeo, J.J.; Jimenez, R.; Bubb, D.M.; Steiner, M.; Fitz-Gerald, J.; O’Malley, S.M. Laser-assisted synthesis of ultra-small anatase TiO2 nanoparticles. Appl. Surf. Sci. 2015, 348, 30–37. [Google Scholar] [CrossRef]
- Guillén, G.G.; Shaji, S.; Palma, M.I.M.; Avellaneda, D.; Castillo, G.A.; Roy, T.K.D.; Gutiérrez, D.I.G.; Krishnan, B. Effects of ablation energy and post-irradiation on the structure and properties of titanium dioxide nanomaterials. Appl. Surf. Sci. 2017, 405, 183–194. [Google Scholar] [CrossRef]
- Jafarkhani, P.; Dadras, S.; Torkamany, M.J.; Sabbaghzadeh, J. Synthesis of nanocrystalline titania in pure water by pulsed Nd:YAG laser. Appl. Surf. Sci. 2010, 256, 3817–3821. [Google Scholar] [CrossRef]
- Serkov, A.A.; Barmina, E.V.; Shafeev, G.A.; Voronov, V.V. Laser ablation of titanium in liquid in external electric field. Appl. Surf. Sci. 2015, 348, 16–21. [Google Scholar] [CrossRef]
- Hong, S.M.; Lee, S.; Jung, H.J.; Yu, Y.; Shin, J.H.; Kwon, K.Y.; Choi, M.Y. Simple Preparation of Anatase TiO2 Nanoparticles via Pulsed Laser Ablation in Liquid. Bull. Korean Chem. Soc. 2013, 34, 279–282. [Google Scholar] [CrossRef]
- Chaturvedi, A.; Joshi, M.P.; Mondal, P.; Sinha, A.K.; Srivastava, A.K. Growth of anatase and rutile phase TiO2 nanoparticles using pulsed laser ablation in liquid: Influence of surfactant addition and ablation time variation. Appl. Surf. Sci. 2017, 396, 303–309. [Google Scholar] [CrossRef]
- Nath, A.; Laha, S.S.; Khare, A. Effect of focusing conditions on synthesis of titanium oxide nanoparticles via laser ablation in titanium–water interface. Appl. Surf. Sci. 2011, 257, 3118–3122. [Google Scholar] [CrossRef]
- Gavrilenko, E.A.; Goncharova, D.A.; Lapin, I.N.; Nemoykina, A.L.; Svetlichnyi, V.A.; Aljulaih, A.A.; Mintcheva, N.; Kulinich, S.A. Comparative study of physicochemical and antibacterial properties of ZnO nanoparticles prepared by laser ablation of Zn target in water and air. Materials 2019, 12, 186. [Google Scholar] [CrossRef]
- Tauc, J.; Grigorovici, R.; Vancu, A. Optical Properties and Electronic Structure of Amorphous Germanium. Phys. Status Solidi 1966, 15, 627–637. [Google Scholar] [CrossRef]
- ISO 20743:2013. Textiles—Determination of Antibacterial Activity of Textile Products, 2nd ed.; ISO: Geneva, Swizerland, 2013. [Google Scholar]
- Li, W.; Ni, C.; Lin, H.; Huang, C.P.; Shah, S.I. Size dependence of thermal stability of TiO2 nanoparticles. J. Appl. Phys. 2004, 96, 6662–6668. [Google Scholar] [CrossRef]
- Ichinose, H.; Terasaki, M.; Katsuki, H. Synthesis of peroxo-modified anatase sol from peroxo titanic acid solution. J. Ceram. Soc. Jpn. 1996, 104, 715–718. [Google Scholar] [CrossRef]
- Ichinose, H.; Terasaki, M.; Katsuki, H. Properties of peroxotitanium acid solution and peroxo-modified anatase sol derived from peroxotitanium hydrate. J. Sol-Gel Sci. Technol. 2001, 22, 33–40. [Google Scholar] [CrossRef]
- Gotic, M.; Ivanda, M.; Popovic, S.; Music, S.; Sekulic, A.; Turkovic, A.; Furic, K. Raman investigation of nanosized TiO2. J. Raman Spectrosc. 1997, 28, 555–558. [Google Scholar] [CrossRef]
- Golubovic, A.; Scepanovic, M.; Kremenovic, A.; Askrabic, S.; Berec, V.; Dohcevic-Mitrovic, Z.; Popovic, Z.V. Raman study of the variation in anatase structure of TiO2 nanopowders due to the changes of sol–gel synthesis conditions. J. Sol-Gel Sci. Technol. 2009, 49, 311–319. [Google Scholar] [CrossRef]
- Gupta, S.K.; Desai, R.; Jha, P.K.; Sahoo, S.; Kirin, D. Titanium dioxide synthesized using titanium chloride: Size effect study using Raman spectroscopy and photoluminescence. J. Raman Spectrosc. 2010, 41, 350–355. [Google Scholar] [CrossRef]
- Mazza, T.; Barborini, E.; Piseri, P.; Milani, P. Raman spectroscopy characterization of TiO2 rutile nanocrystals. Phys. Rev. B 2007, 75, 045416. [Google Scholar] [CrossRef]
- Lukacevic, I.; Gupta, S.K.; Jha, P.K.; Kirin, D. Lattice dynamics and Raman spectrum of rutile TiO2: The role of soft phonon modes in pressure induced phase transition. Mater. Chem. Phys. 2012, 137, 282–289. [Google Scholar] [CrossRef]
- Slavinskaya, E.M.; Stadnichenko, A.I.; Muravyov, V.V.; Kardash, T.Y.; Derevyannikova, E.A.; Zaikovskii, V.I.; Stonkus, O.A.; Lapin, I.N.; Svetlichnyi, V.A.; Boronin, A.I. Transformation of Pt-CeO2 mechanical mixture of pulsed laser-ablated nanoparticles to highly active catalyst for CO oxidation. ChemCatChem 2018, 10, 2232–2247. [Google Scholar] [CrossRef]
- Lei, Y.; Zhang, L.D.; Meng, G.W.; Li, G.H.; Zhang, X.Y.; Liang, C.H.; Chen, W.; Wang, S.X. Preparation and photoluminescence of highly ordered TiO2 nanowire arrays. Appl. Phys. Lett. 2001, 78, 1125–1127. [Google Scholar] [CrossRef]
- Choudhury, B.; Dey, M.; Choudhury, A. Shallow and deep trap emission and luminescence quenching of TiO2 nanoparticles on Cu doping. Appl. Nanosci. 2014, 4, 499–506. [Google Scholar] [CrossRef]
- Choudhury, B.; Choudhury, A. Tailoring luminescence properties of TiO2 nanoparticles by Mn doping. J. Lumin. 2013, 136, 339–346. [Google Scholar] [CrossRef]
- Saini, C.P.; Barman, A.; Banerjee, D.; Grynko, O.; Prucnal, S.; Gupta, M.; Phase, D.M.; Sinha, A.K.; Kanjilal, D.; Skorupa, W.; et al. Impact of Self-Trapped Excitons on Blue Photoluminescence in TiO2 Nanorods on Chemically Etched Si Pyramids. J. Phys. Chem. C 2017, 121, 11448–11454. [Google Scholar] [CrossRef]
- Dozzi, M.V.; D’Andrea, C.; Ohtani, B.; Valentini, G.; Selli, E. Fluorine-Doped TiO2 Materials: Photocatalytic Activity vs Time-Resolved Photoluminescence. J. Phys. Chem. C 2013, 117, 25586–25595. [Google Scholar] [CrossRef]
- Wu, W.-Y.; Chang, Y.-M.; Ting, J.-M. Room-Temperature Synthesis of Single-Crystalline Anatase TiO2 Nanowires. Cryst. Growth Des. 2010, 10, 1646–1651. [Google Scholar] [CrossRef]
- Paul, S.; Choudhury, A. Investigation of the optical property and photocatalytic activity of mixed phase nanocrystalline titania. Appl. Nanosci. 2014, 4, 839–847. [Google Scholar] [CrossRef]
- Kuznetsov, V.N.; Serpone, N. On the Origin of the Spectral Bands in the Visible Absorption Spectra of Visible-Light-Active TiO2 Specimens Analysis and Assignments. J. Phys. Chem. C 2009, 113, 15110–15123. [Google Scholar] [CrossRef]
- Zhang, H.; Zhou, M.; Fu, Q.; Lei, B.; Lin, W.; Guo, H.; Wu, M.; Lei, Y. Observation of defect state in highly ordered titanium dioxide nanotube arrays. Nanotechnology 2014, 25, 275603. [Google Scholar] [CrossRef]
- Liu, J.; Li, J.; Sedhain, A.; Lin, J.; Jiang, H. Structure and Photoluminescence Study of TiO2 Nanoneedle Texture along Vertically Aligned Carbon Nanofiber Arrays. J. Phys. Chem. C 2008, 112, 17127–17132. [Google Scholar] [CrossRef]
- Khomenko, V.M.; Langer, K.; Rager, H.; Fett, A. Electronic absorption by Ti3+ ions and electron delocalization in synthetic blue rutile. Phys. Chem. Miner. 1998, 25, 338–346. [Google Scholar] [CrossRef]
- Wang, X.; Wang, F.; Chen, B.; Cheng, K.; Wang, J.; Zhang, J.; Song, H. Promotion of phenol photodecomposition and the corresponding decomposition mechanism over g-C3N4/TiO2 nanocomposites. Appl. Surf. Sci. 2018, 453, 320–329. [Google Scholar] [CrossRef]
- Varnagiris, S.; Urbonavicius, M.; Sakalauskaite, S.; Daugelavicius, R.; Pranevicius, L.; Lelis, M.; Milcius, D. Floating TiO2 photocatalyst for efficient inactivation of E. coli and decomposition of methylene blue solution. Sci. Total Environ. 2020, 720, 137600. [Google Scholar] [CrossRef]
- Romaniuk, J.A.H.; Cegelski, L. Bacterial cell wall composition and the influence of antibiotics by cell-wall and whole-cell NMR. Philos. Trans. R. Soc. B 2015, 370, 20150024. [Google Scholar] [CrossRef]
- Priyadarshini, S.; Mainal, A.; Sonsudin, F.; Yahya, R.; Alyousef, A.A.; Mohammed, A. Biosynthesis of TiO2 nanoparticles and their superior antibacterial effect against human nosocomial bacterial pathogens. Res. Chem. Intermed. 2020, 46, 1077–1089. [Google Scholar] [CrossRef]
- Joost, U.; Juganson, K.; Visnapuu, M.; Mortimer, M.; Kahru, A.; Nõmmiste, E.; Joost, U.; Kisand, V.; Ivask, A. Photocatalytic antibacterial activity of nano-TiO2 (anatase)-based thin films: Effects on Escherichia coli cells and fatty acids. J. Photochem. Photobiol. B 2015, 142, 178–185. [Google Scholar] [CrossRef] [PubMed]
- Xu, J.; Sun, Y.; Huang, J.; Chen, C.; Liu, G.; Jiang, Y.; Zhao, Y.; Jiang, Z. Photokilling cancer cells using highly cell-specific antibody–TiO2 bioconjugates and electroporation. Bioelectrochemistry 2007, 71, 217–222. [Google Scholar] [CrossRef] [PubMed]


| Sample | Average Size (nm) from TEM Data | SBET (m2/g) | Vpore (cm3/g) | Phase Composition (%) | Δd/d × 10−3 | |
|---|---|---|---|---|---|---|
| Anatase | Rutile | |||||
| TiO2_ini | 10 | 227 ± 23 | 0.41 ± 0.02 | – | – | – |
| TiO2_200 | 14 | 124 ± 12 | 0.37 ± 0.02 | – | – | – |
| TiO2_400 | 16 | 86 ± 9 | 0.37 ± 0.02 | 67 | 33 | 1.5 |
| TiO2_600 | 34 | 50 ± 5 | 0.28 ± 0.02 | 62 | 38 | 1.1 |
| TiO2_800 | 77 | 7 ± 1 | 0.06 ± 0.01 | 3 | 97 | 0.2 |
| TiO2_1000 | 400 | >1 | – | – | 100 | – |
| Sample | Carbon Content (%) | O 1s/Ti 2p Ratio |
|---|---|---|
| TiO2_ini | 17.4 | 2.67 |
| TiO2_200 | 17.2 | 2.58 |
| TiO2_400 | 14.4 | 2.44 |
| Sample | Eg, eV (Tauc) |
|---|---|
| TiO2-ini | 3.12 |
| TiO2-200 | 3.15 |
| TiO2-400 | 3.00 |
| TiO2-600 | 3.05 |
| TiO2-800 | 2.96 |
| TiO2-1000 | 2.80 |
| PL Band | Spectral Range (nm) |
|---|---|
| STE | 400–450 (3.09–2.75 eV) Y. Lei 2001 [58]; 537 (2.3 eV) 431 (2.88 eV) B. Choudhury 2014 [59]; 429 (2.89 eV) B. Choudhury 2013 [60]; 430 (2.88 eV) C. P. Saini 2017 [61]; 400–450 (3.09–2.75 eV) M. V. Dozzi 2017 [62]; 416 (2.97 eV) W-Yu. Wu 2009 [63]; 425 (2.9 eV) S. Paul 2014 [64]. |
| F or F2+-center | 420–450 (2.95–2.55 eV) V.N. Kuznetsov 2009 [65]; 468 (2.65 eV) B. Choudhury 2014 [59]; 485 (2.71 eV) B. Choudhury 2013 [60]; 465 (2.67 eV) Y. Lei 2001 [58]; 440–456 (2.81–2.71); 471 (2.63 eV) H. Zhang 2014 [66]; 457 (2.71 eV) S. Paul 2014 [64]. |
| F+-center | 540–619 (2.30–2.00 eV) V.N. Kuznetsov 2009 [64]; 525 (2.36 eV); 500 (2.48 eV) B. Choudhury 2014 [59]; 525 (2.36 eV) Y. Lei 2001 [58]; 531 (2.33 eV) H. Zhang 2014 [66]; 537 (2.31 eV) S. Paul 2014 [64]. |
| Ti3+ | 485 (2.55 eV) C. P. Saini 2017 [61]; 490 (2.53 eV) S. Paul 2014 [64]; 480 (2.58 eV) J. Liu 2008 [67]; 491 (2.52 eV) B. Choudhury 2013 [60]. |
| C on Tissue (mg/cm2) | The Level of Growth | Antibacterial Activity A | |
|---|---|---|---|
| Control F | Sample G | ||
| S.aureus (+) | |||
| 0.1 | +2.8 | +2.8 | 0 |
| 0.25 | +2.8 | +2.6 | +0.2 |
| 1 | +2.9 | –2.9 | +5.8 |
| E.coli (−) | |||
| 1 | +2.1 | +1.0 | +1.1 |
© 2020 by the authors. Licensee MDPI, Basel, Switzerland. This article is an open access article distributed under the terms and conditions of the Creative Commons Attribution (CC BY) license (http://creativecommons.org/licenses/by/4.0/).
Share and Cite
D. Fakhrutdinova, E.; V. Shabalina, A.; A. Gerasimova, M.; L. Nemoykina, A.; V. Vodyankina, O.; A. Svetlichnyi, V. Highly Defective Dark Nano Titanium Dioxide: Preparation via Pulsed Laser Ablation and Application. Materials 2020, 13, 2054. https://doi.org/10.3390/ma13092054
D. Fakhrutdinova E, V. Shabalina A, A. Gerasimova M, L. Nemoykina A, V. Vodyankina O, A. Svetlichnyi V. Highly Defective Dark Nano Titanium Dioxide: Preparation via Pulsed Laser Ablation and Application. Materials. 2020; 13(9):2054. https://doi.org/10.3390/ma13092054
Chicago/Turabian StyleD. Fakhrutdinova, Elena, Anastasiia V. Shabalina, Marina A. Gerasimova, Anna L. Nemoykina, Olga V. Vodyankina, and Valery A. Svetlichnyi. 2020. "Highly Defective Dark Nano Titanium Dioxide: Preparation via Pulsed Laser Ablation and Application" Materials 13, no. 9: 2054. https://doi.org/10.3390/ma13092054
APA StyleD. Fakhrutdinova, E., V. Shabalina, A., A. Gerasimova, M., L. Nemoykina, A., V. Vodyankina, O., & A. Svetlichnyi, V. (2020). Highly Defective Dark Nano Titanium Dioxide: Preparation via Pulsed Laser Ablation and Application. Materials, 13(9), 2054. https://doi.org/10.3390/ma13092054