Effects of Mn, Zn Additions and Cooling Rate on Mechanical and Corrosion Properties of Al-4.6Mg Casting Alloys

Abstract
1. Introduction
2. Experimental Procedure
2.1. Material Preparation
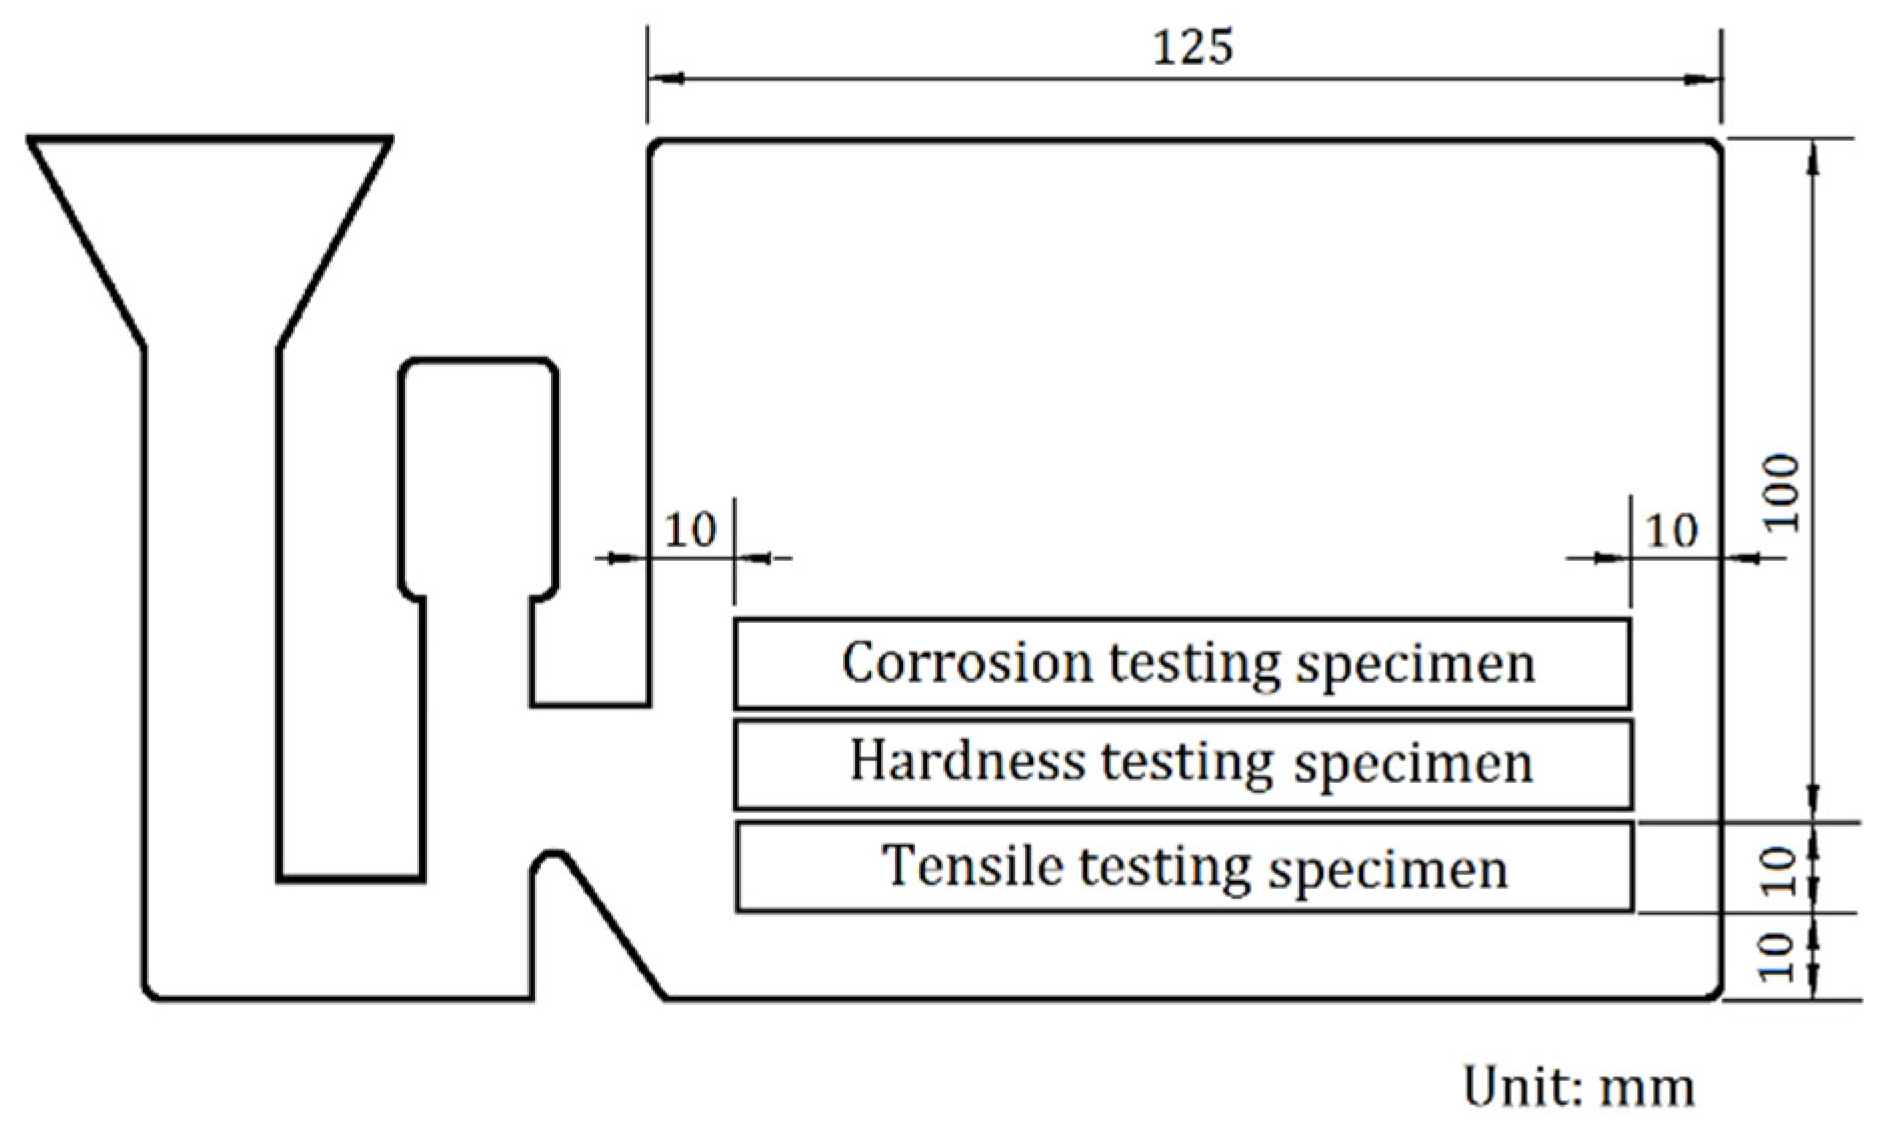
2.2. Specimen Preparation
2.3. Equipment
2.4. Heat Treatment
2.5. Nitric Acid Mass Loss Testing
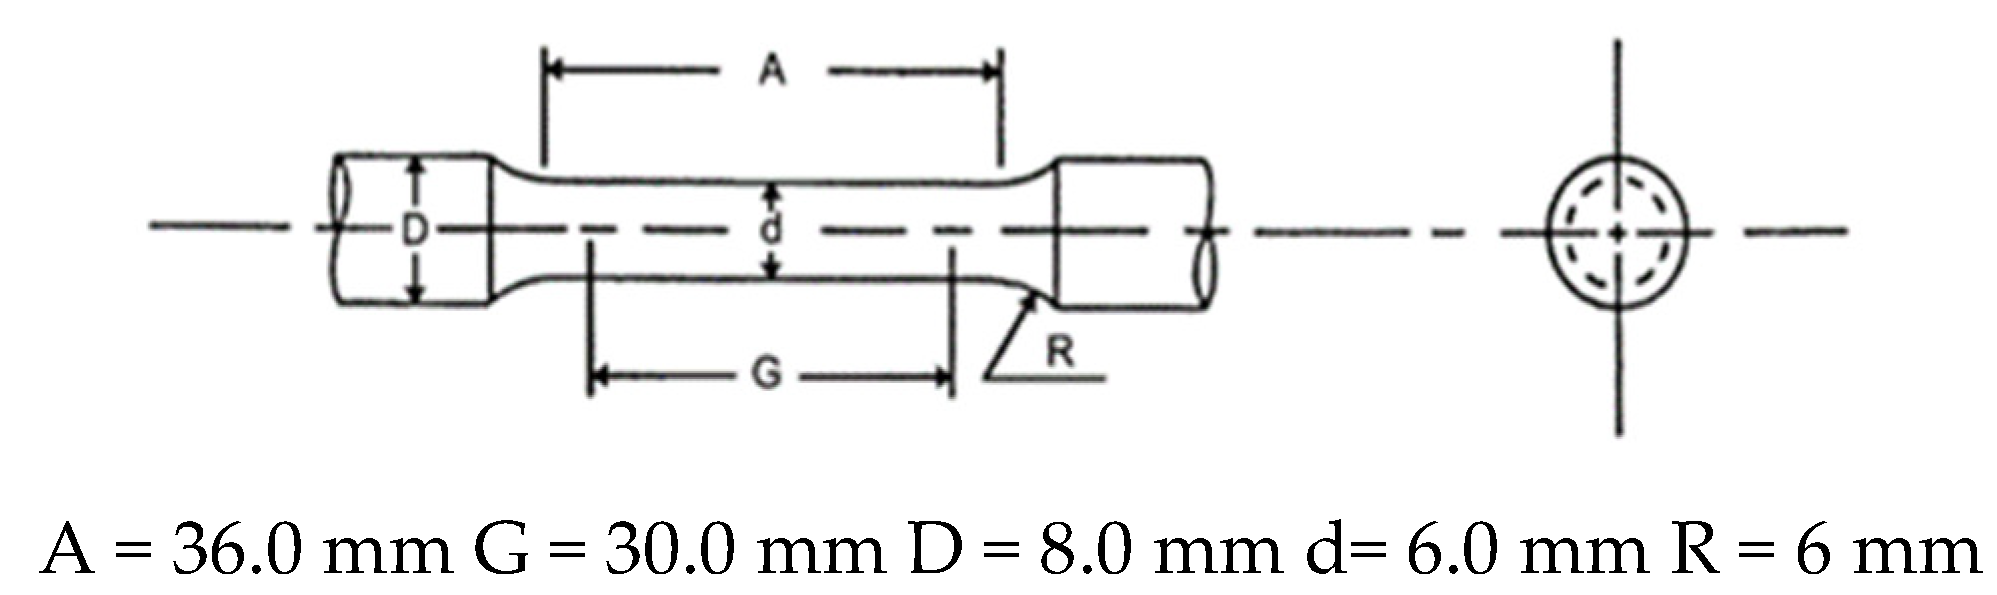
2.6. Tensile Testing
2.7. Hardness Testing
3. Results
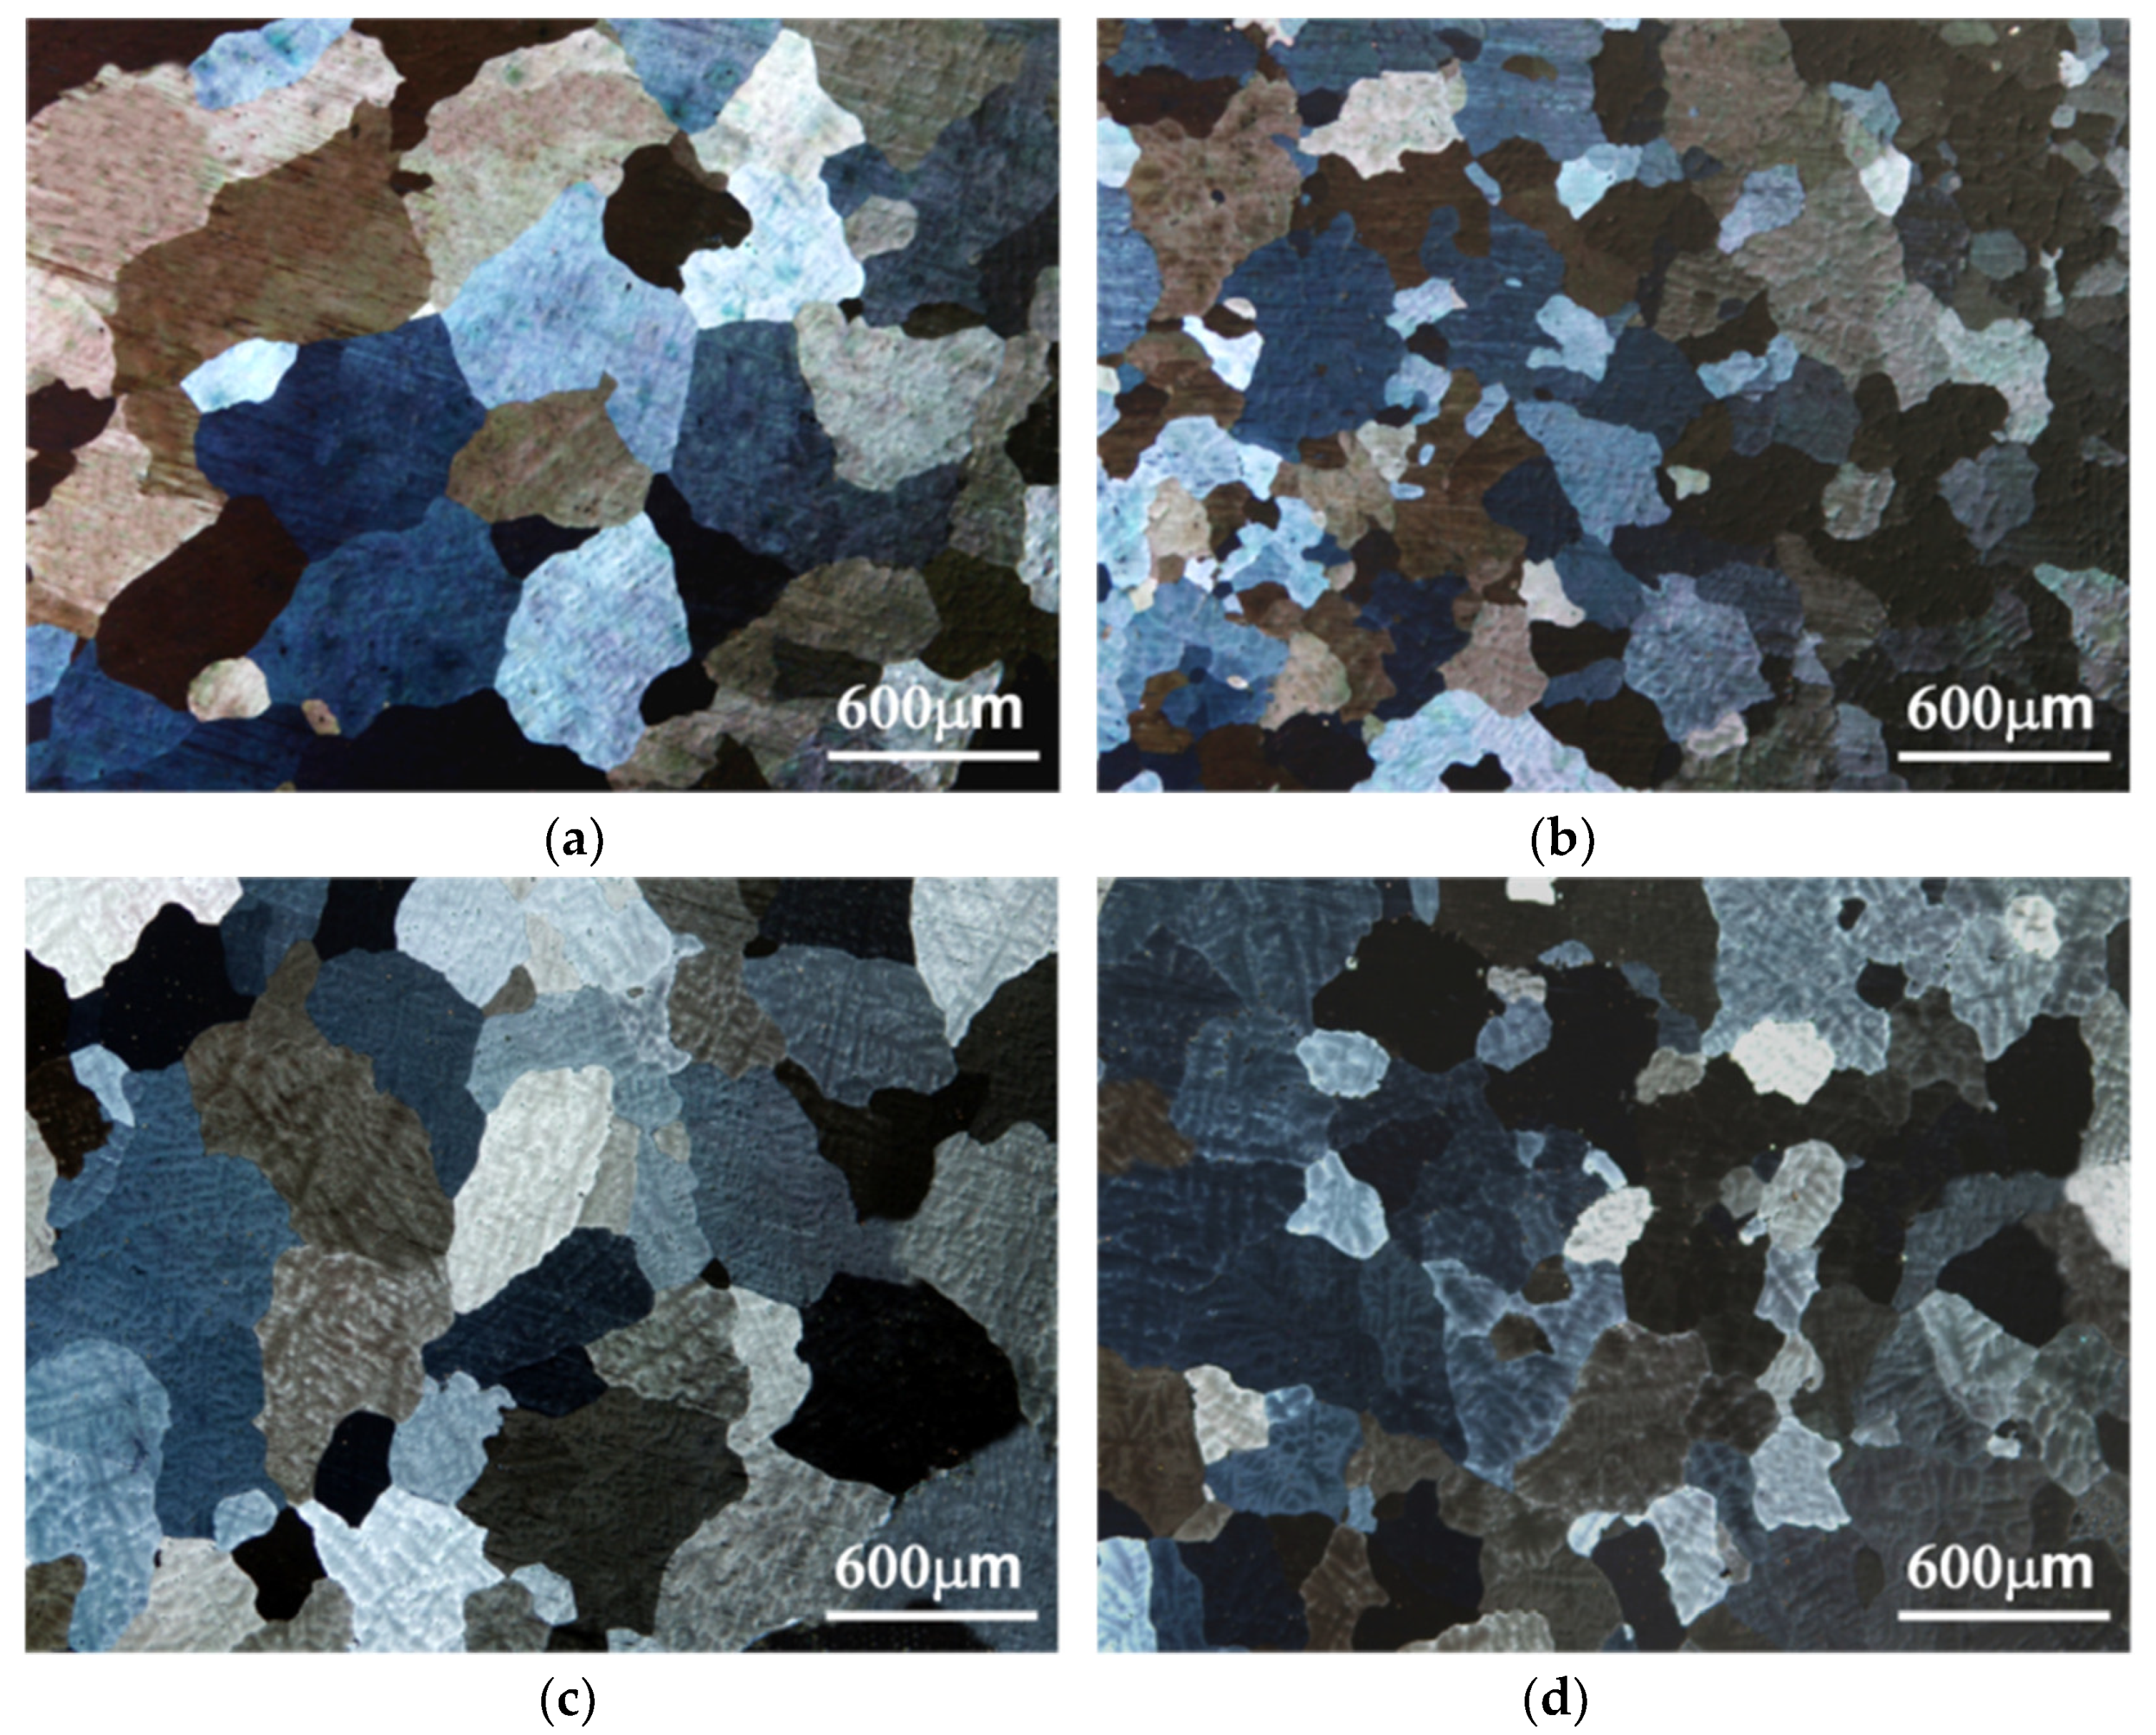
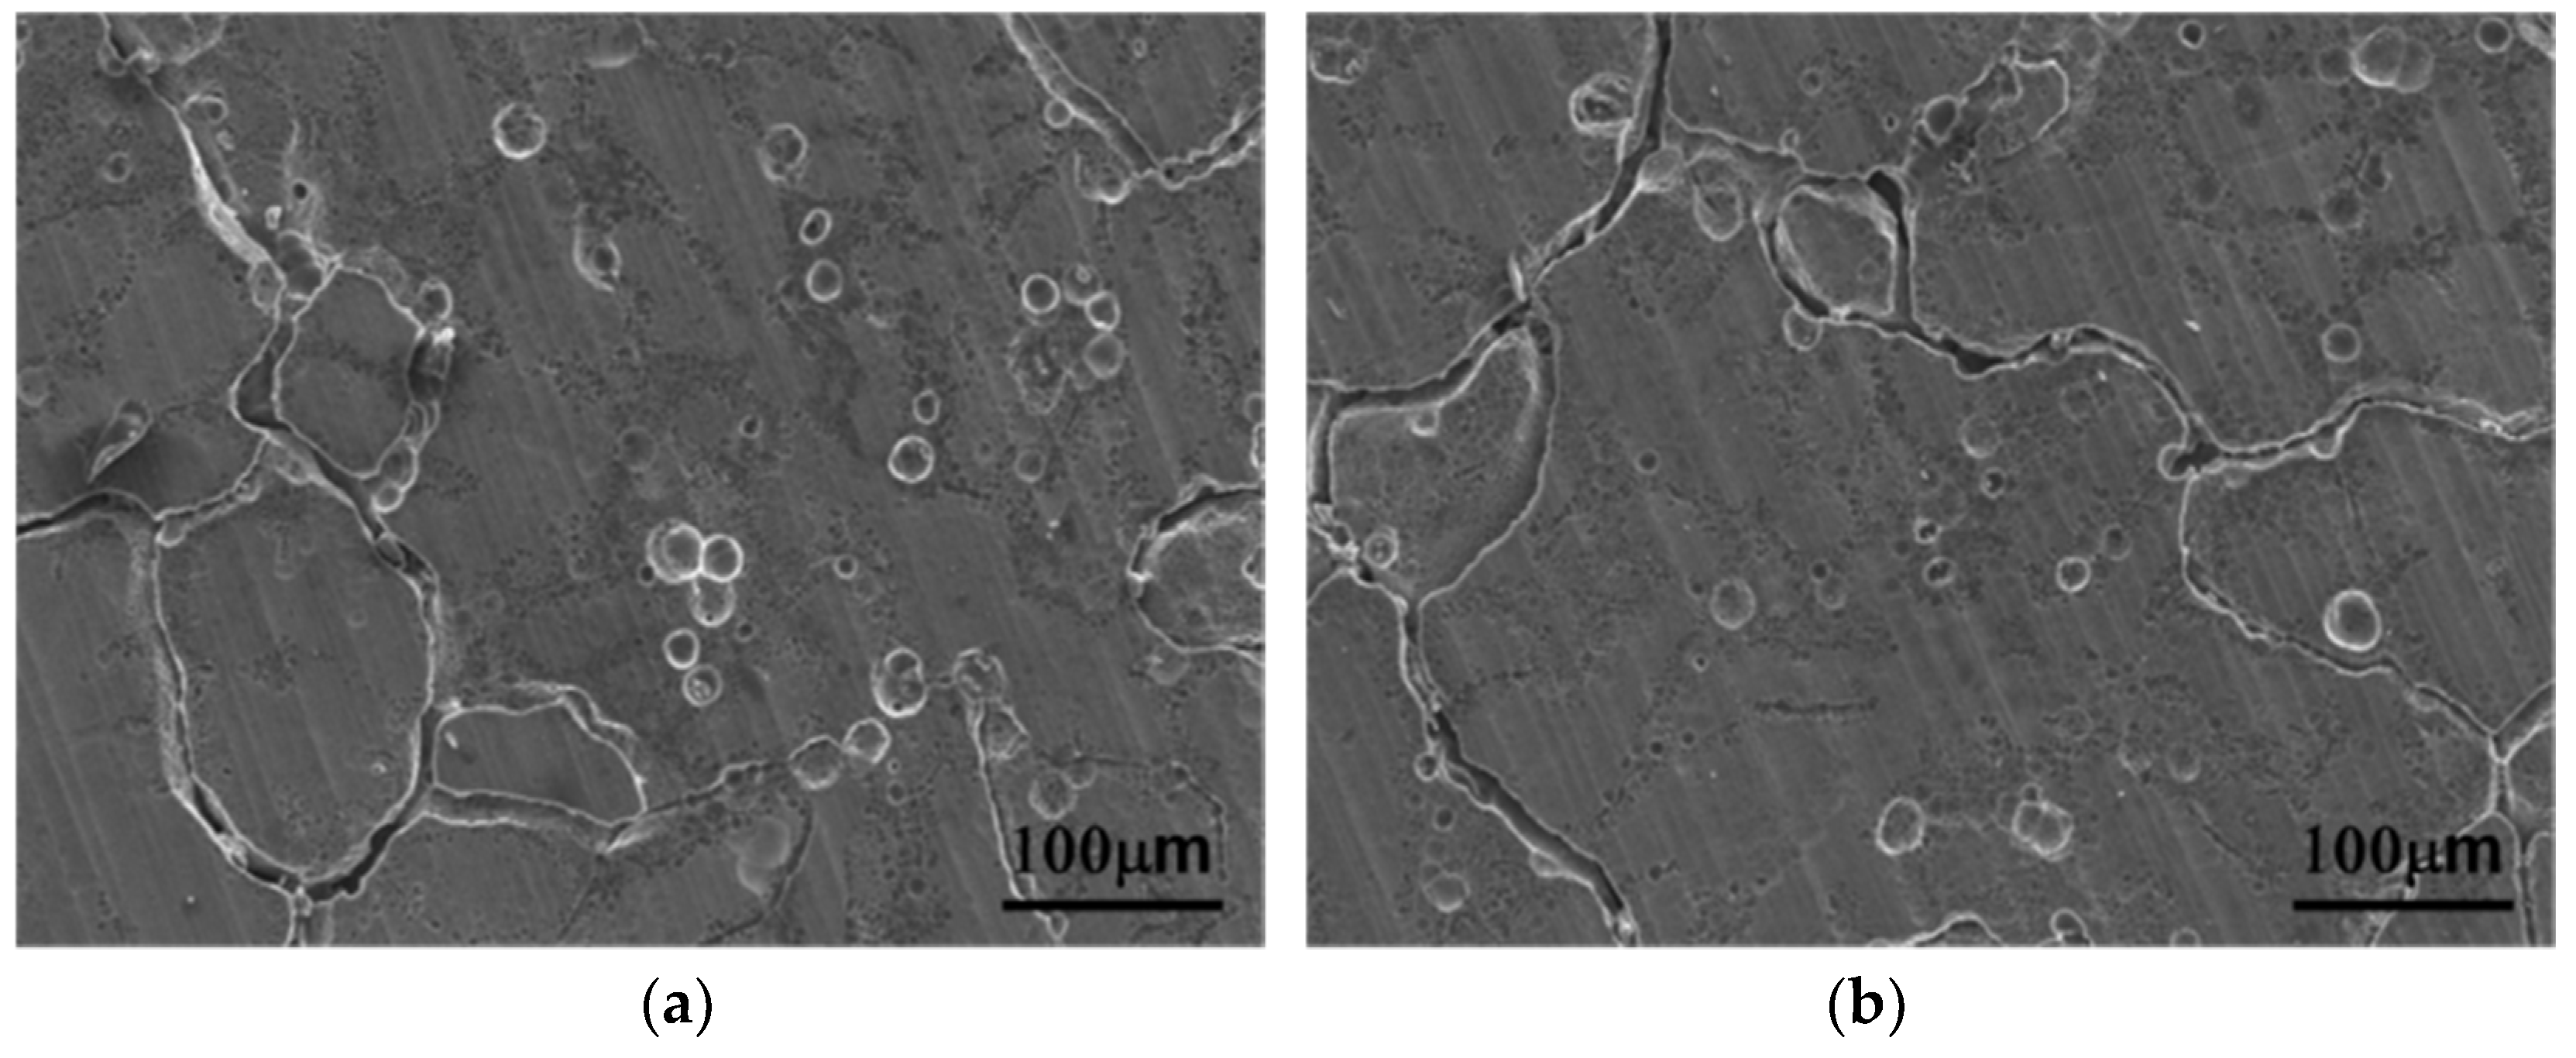
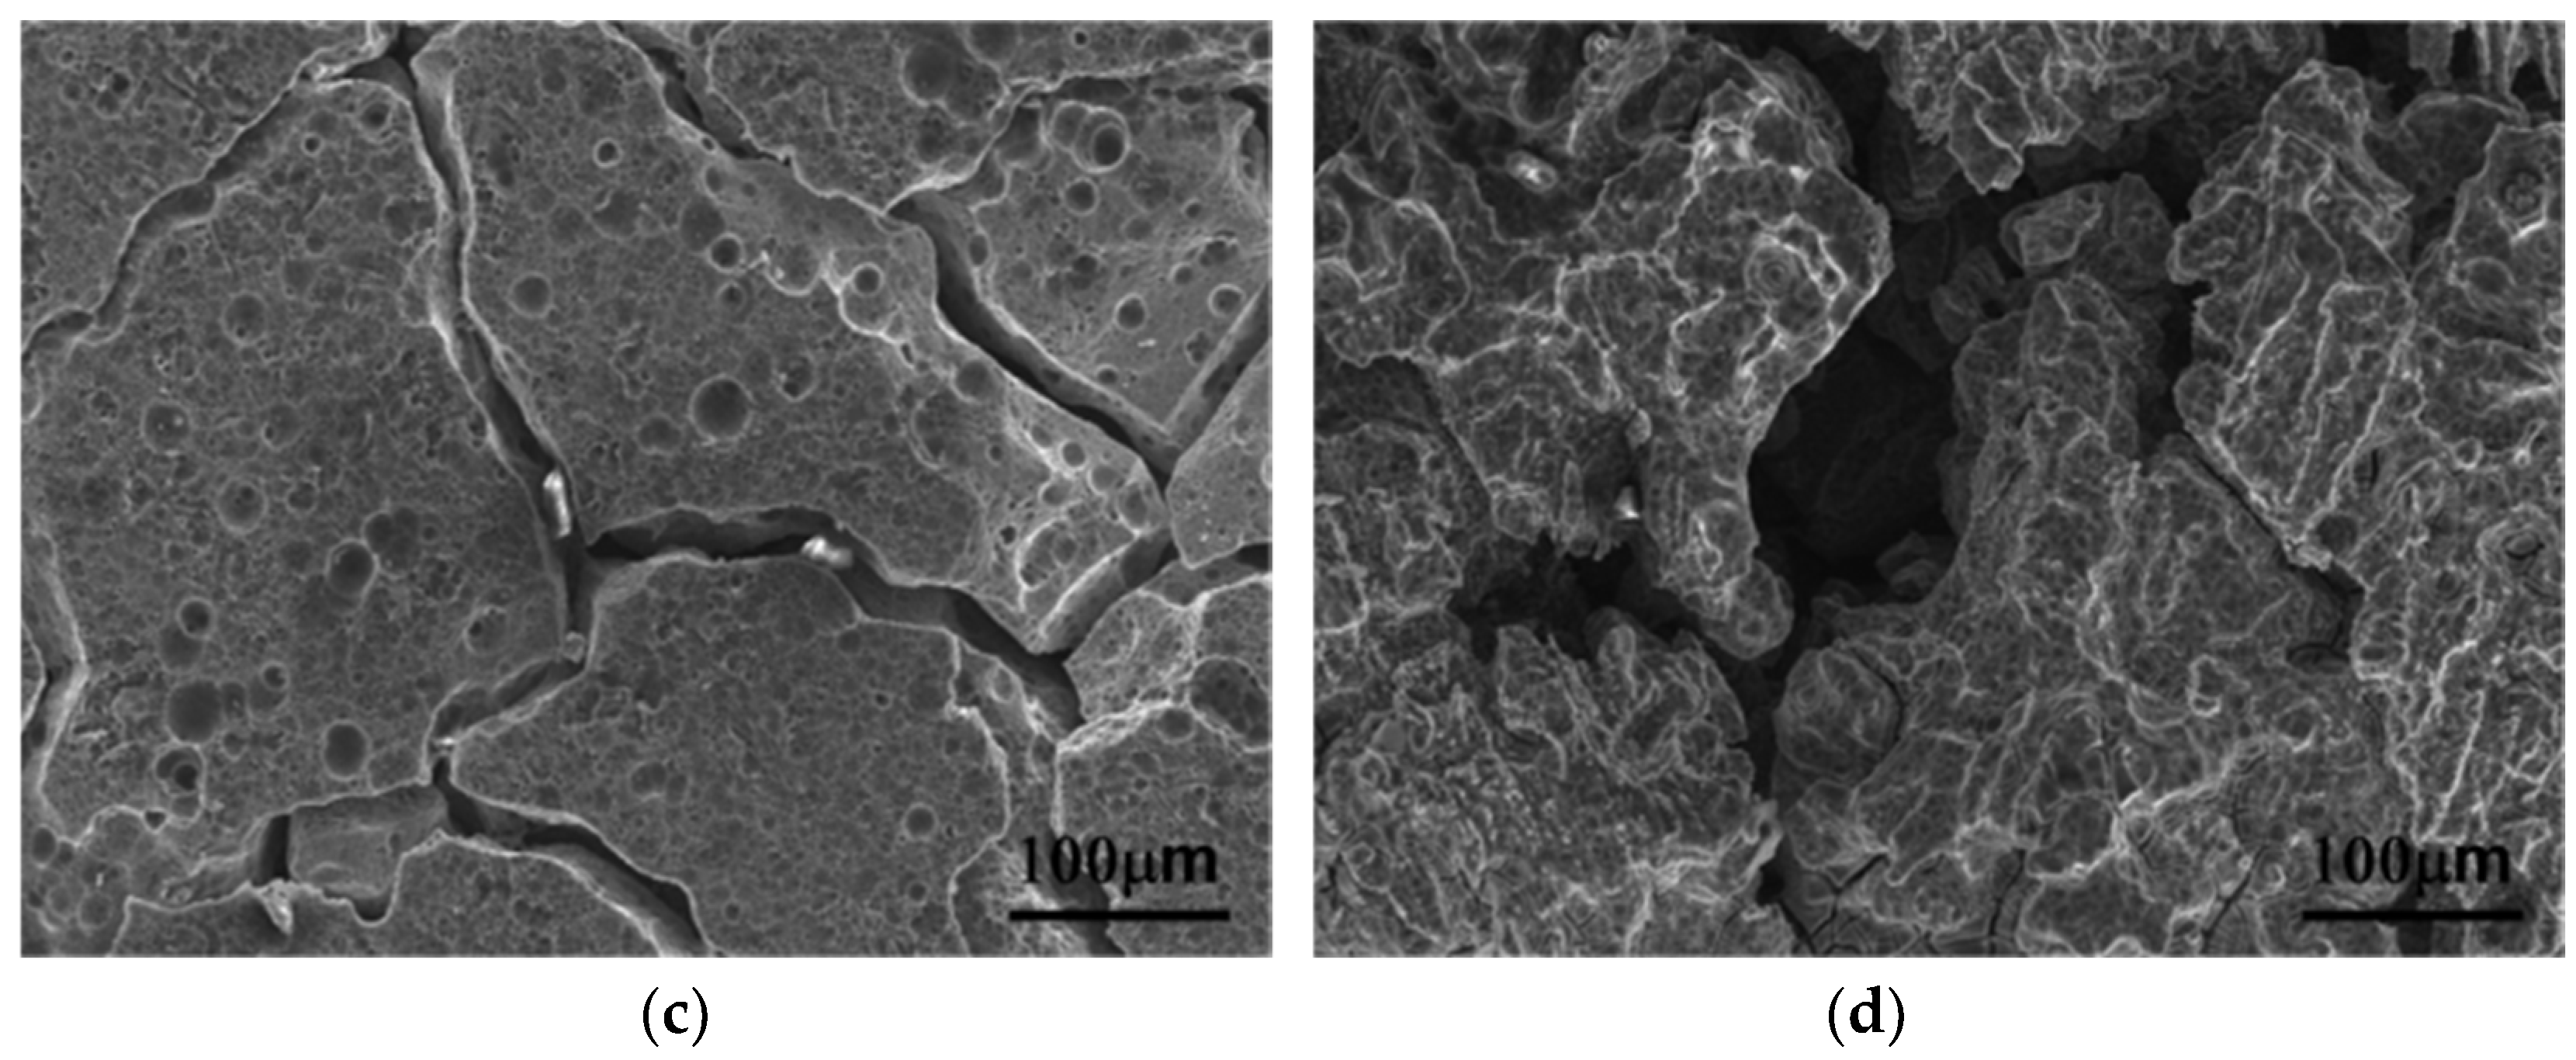
3.1. Microstructure
3.2. Electrical Conductivity Measurements
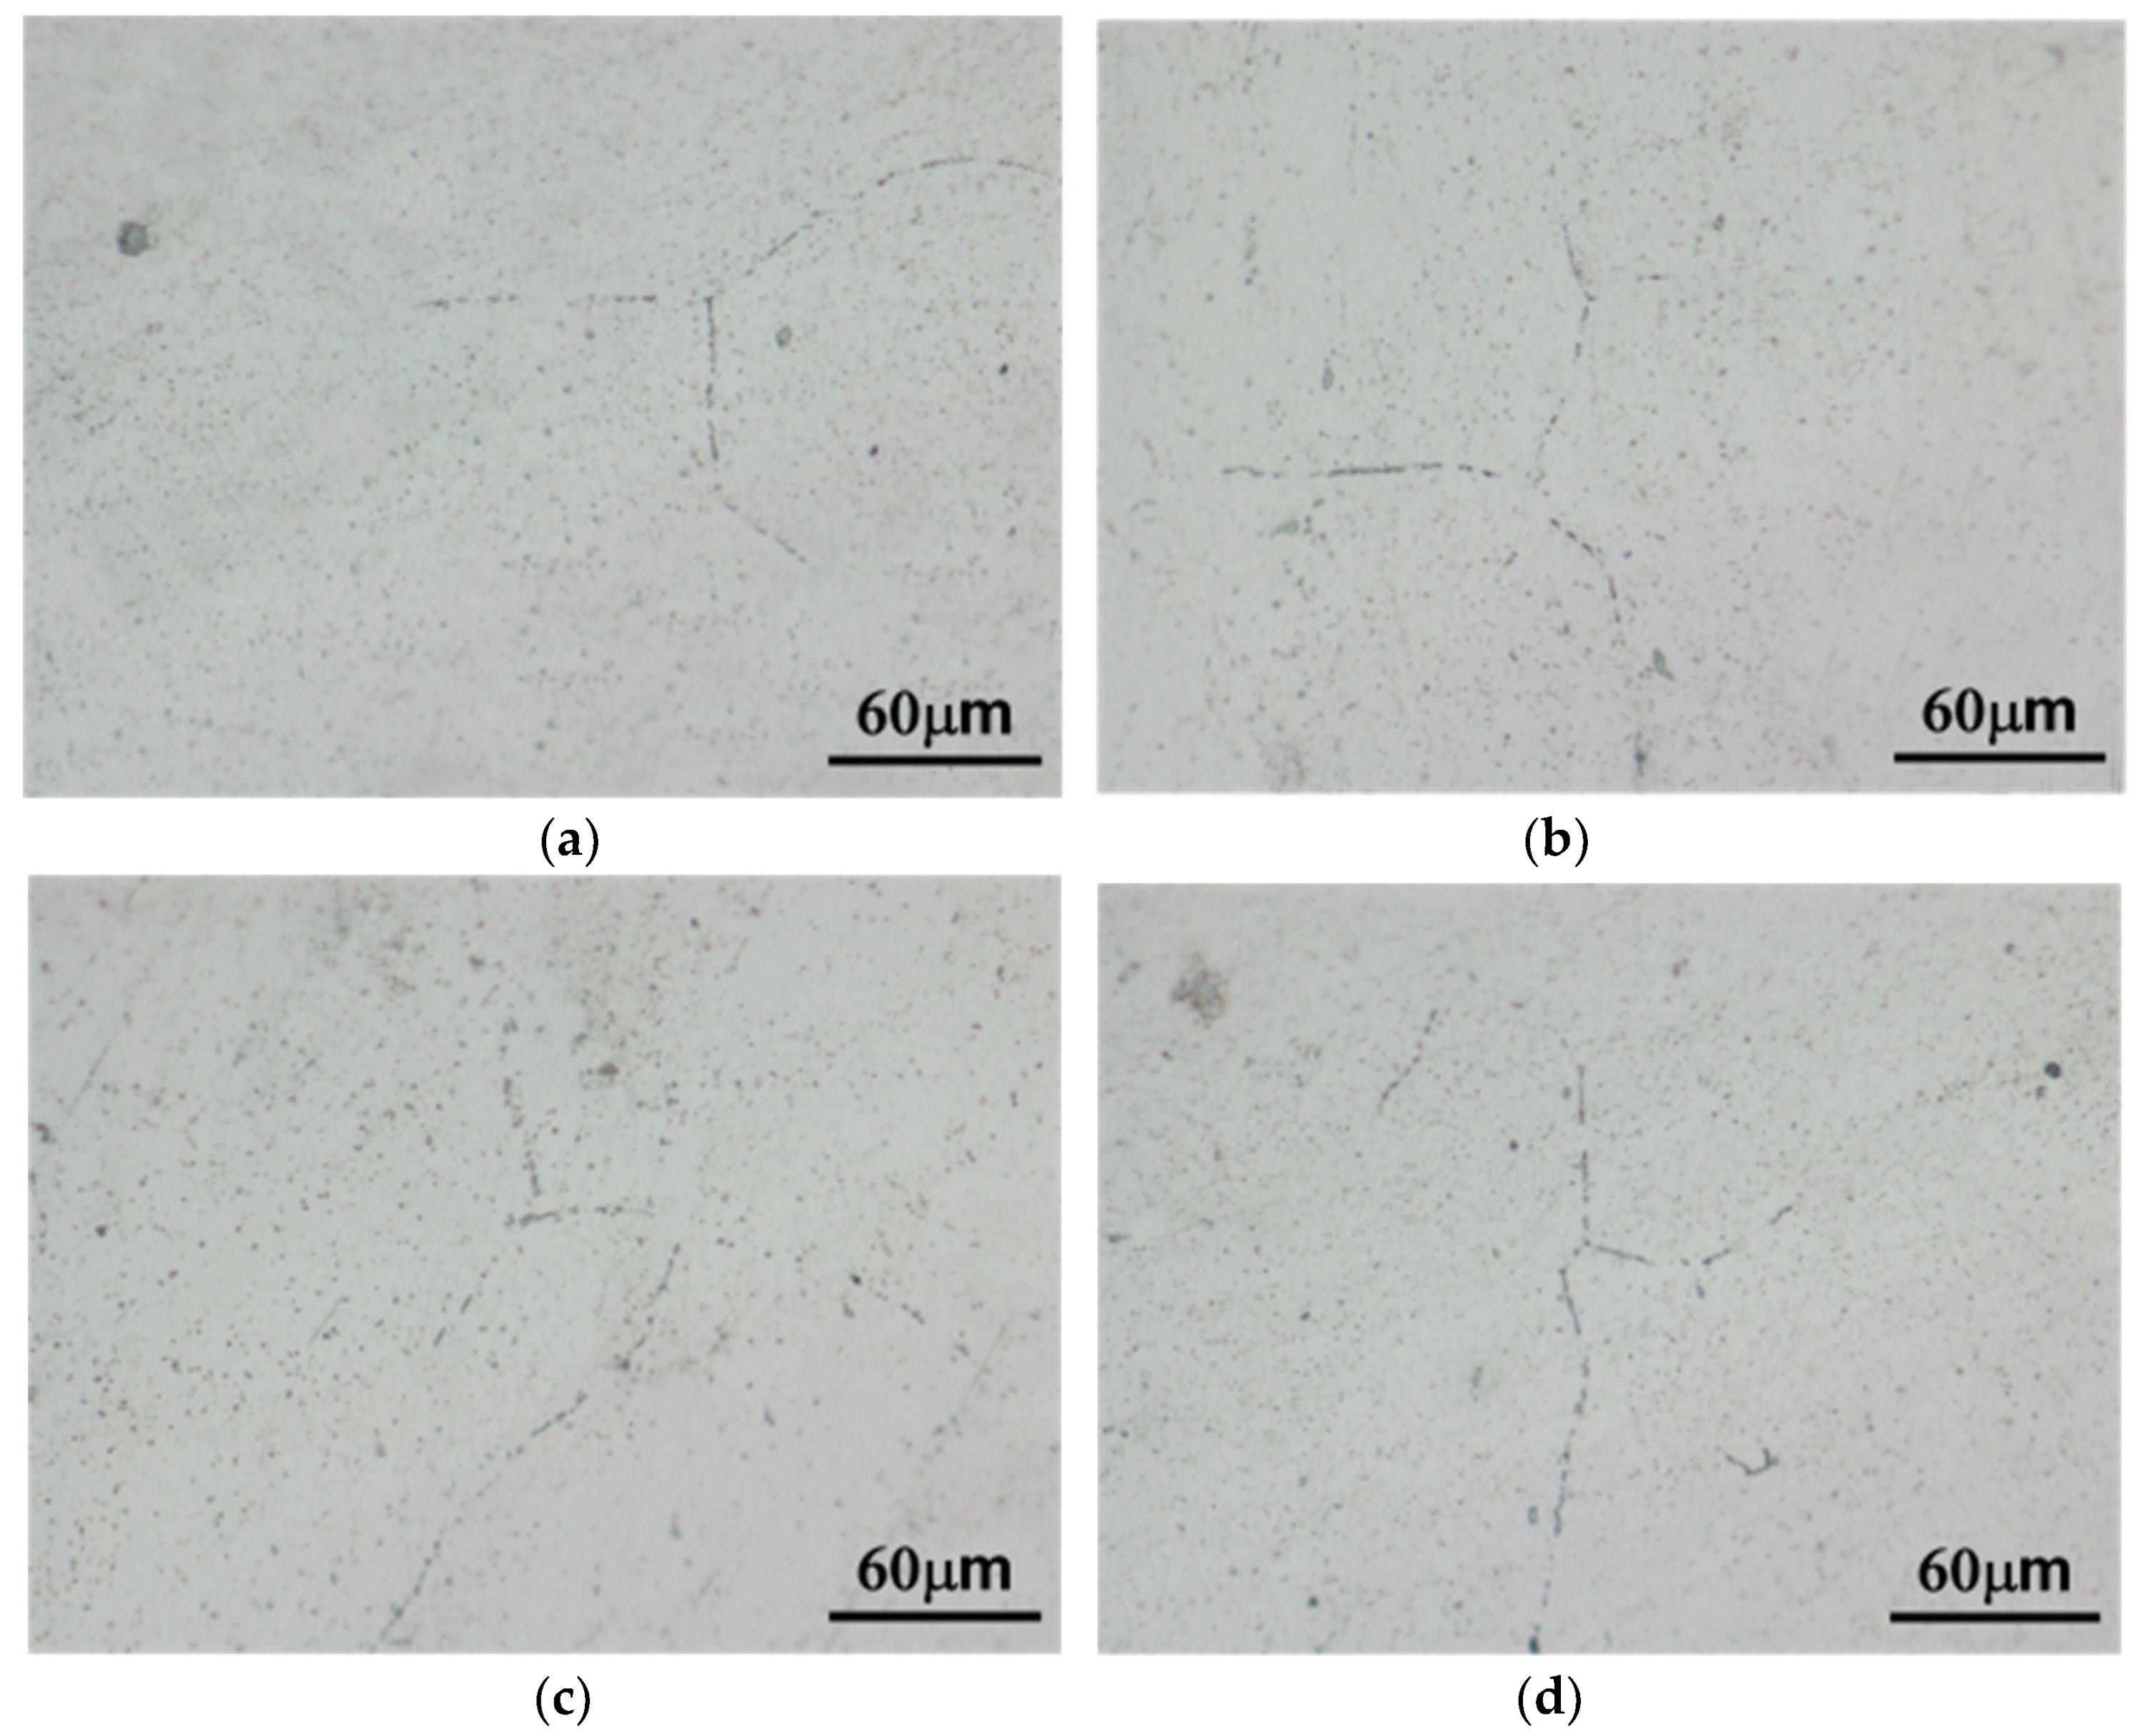
3.3. Corrosion Properties
3.4. Mechanical Characteristics
4. Discussion
4.1. Microstructure
4.2. Electrical Conductivity Measurements
4.3. Corrosion Properties
4.4. Mechanical Characteristics
5. Conclusions
- Adding Mn to Al-4.6Mg alloys can produce grain refinement and dispersion strengthening, increasing their tensile strength (329.8 MPa) and hardness (71.3 HRB). The addition of Mn still retains a high resistance to corrosion of the alloy (15.9 mg cm−2).
- The addition of Zn to Al-4.6Mg alloy slightly promotes tensile strength (281.7 MPa) and hardness (57.1 HRB) but noticeably decreases corrosion resistance (35.1 mg cm−2).
- Combined Mn and Zn addition to Al-4.6Mg alloy exhibits the highest tensile strength (336.2 MPa) and hardness (73.4 HRB) but seriously impairs corrosion resistance (61.3 mg cm−2).
- Furnace cooling substituted for water quenching after homogenization treatment can markedly improve corrosion resistance (24.6 mg cm−2) and only slightly decreases the tensile strength and hardness of Al-4.6Mg-Mn-Zn alloy by 7.0% and 6.8%, respectively.
Author Contributions
Funding
Conflicts of Interest
References
- Liu, Y.; Huang, G.; Sun, Y.; Zhang, L.; Huang, Z.; Wang, J.; Liu, C. Effect of Mn and Fe on the formation of Fe- and Mn-Rich intermetallics in Al–5Mg–Mn alloys solidified under near-papid cooling. Materials 2016, 9, 88. [Google Scholar] [CrossRef] [PubMed]
- Krol, M.; Tanski, T.; Snopinski, P.; Tomiczek, B. Structure and properties of aluminium-magnesium casting alloys after heat treatment. J. Therm. Anal. Calorim. 2017, 127, 299–308. [Google Scholar] [CrossRef]
- Snopinski, P.; Tanski, T.; Sroka, M. The effect of heat treatment conditions on the structure evolution and mechanical properties of two binary Al-Mg aluminium alloys. Metalurgija 2017, 56, 329–332. [Google Scholar]
- Tanski, T.; Snopinski, P.; Borek, W. Strength and structure of AlMg3 alloy after ECAP and post-ECAP processing. Mater. Manuf. Process. 2017, 32, 1368–1374. [Google Scholar] [CrossRef]
- Tanski, T.; Snopinski, P.; Prusik, K.; Sroka, M. The effects of room temperature ECAP and subsequent aging on the structure and properties of the Al-3%Mg aluminium alloy. Mater. Charact. 2017, 133, 185–195. [Google Scholar] [CrossRef]
- Tanski, T.; Snopinski, P.; Hilser, O. Microstructure and mechanical properties of two binary al-mg alloys deformed using equal channel angular pressing. Mater. Wis. Werkstofftech. 2017, 48, 439–446. [Google Scholar] [CrossRef]
- Valdes-Tabernero, M.A.; Sancho-Cadenas, R.; Sabirov, I.; Murashkin, M.Y.; Ovid–ko, I.A.; Galvez, F. Effect of SPD processing on mechanical behavior and dynamic strain aging of an al-mg alloy in various deformation modes and wide strain rate range. Mater. Sci. Eng. A 2017, 696, 348–359. [Google Scholar] [CrossRef]
- Daisuke, K.; Yohei, H.; Shinji, K. Surface quality and microstructure of Al-Mg alloy strips fabricated by vertical-type high-speed twin-roll casting. J. Manuf. Process. 2019, 37, 332–338. [Google Scholar]
- Zhang, C.; Li, Y.; Gao, M.; Zeng, X. Wire arc additive manufacturing of Al-6Mg alloy using variable polarity cold metal transfer arc as power source. Mat. Sci. Eng. A 2018, 711, 415–423. [Google Scholar] [CrossRef]
- Davis, J.R. ASM Specialty Handbook: Aluminum and Aluminum Alloys; ASM International Materials Park: Geauga County, OH, USA, 1994; p. 579. [Google Scholar]
- Bovard, F.S. Sensitization and environmental cracking of 5xxx aluminum marine sheet and plate alloys. Electrochem. Soc. Proc. 2004, 14, 232–243. [Google Scholar]
- Searles, J.L.; Gouma, P.I.; Buchheit, R.G. Stress corrosion cracking of sensitized AA5083 (Al-4.5Mg-1.0 Mn). Metall. Mater. Trans. A 2001, 32, 2859–2867. [Google Scholar] [CrossRef]
- Vlach, M.; Stulíkova, I.; Smola, B.; Zaludova, N. Characterization of phase development in non-isothermally annealed mould-cast and heat-treated Al–Mn–Sc–Zr alloys. Mater. Charact. 2010, 61, 1400–1405. [Google Scholar] [CrossRef]
- Zhao, Z.; Meng, Y.; Cui, J. Effect of Mn on microstructures and mechanical properties of Al-Mg-Si- Cu-Cr-V alloy. China Foundry 2012, 9, 349–355. [Google Scholar]
- Liu, Y.; Ou, L.; Han, C.; Zhang, L.; Zhao, Y. The influence of Mn on the microstructure and mechanical properties of the Al–5Mg–Mn alloy solidified under near-rapid cooling. J. Mater. Res. 2016, 31, 1153–1162. [Google Scholar] [CrossRef]
- Lee, S.-L.; Wu, S.-T. Influence of soaking treatment on hot ductility of Al-4.85 pct Mg alloys containing Mn. Metall. Trans. A 1986, 17A, 833–841. [Google Scholar] [CrossRef]
- Lia, Y.; Hung, Y.; Du, Z.; Xiao, Z.; Jia, G. The effect of homogenization on the corrosion behavior of Al–Mg alloy. Phys. Met. Metallogr. 2018, 119, 339–346. [Google Scholar] [CrossRef]
- Sanders, R.E.; Hollinshead, P.A.; Simielli, E.A. Industrial development of non-heat treatable aluminum alloys. Mater. Forum. 2004, 28, 53–64. [Google Scholar]
- Lim, M.L.C.; Scully, J.R.; Kelly, R.G. Intergranular corrosion penetration in an Al-Mg Alloy as a function of electrochemical and metallurgical conditions. Corros. Sci. 2013, 69, 35–47. [Google Scholar] [CrossRef]
- Vuelvas, S.; Valdez, S.; Gonzalez-Rodriguez, J.G. Effect of Mg and Sn addition on the corrosion behavior of an Al-Mn alloy in 0.5M H2SO4. Int. J. Electrochem. Sci. 2012, 7, 4171–4181. [Google Scholar]
- Carroll, M.C.; Gouma, P.I.; Mills, M.J.; Daehn, G.S.; Dunbar, B.R. Effects of Zn additions on the grain boundary precipitation and corrosion of Al 5083. Scripta Mater. 2002, 42, 335–340. [Google Scholar] [CrossRef]
- Unocic, K.A.; Kobe, P.; Mills, M.J.; Daehn, G.S. Grain boundary precipitate modification for improved intergranular corrosion resistance. Mater. Sci. Forum. 2006, 519, 327–332. [Google Scholar]
- Chi, S.; Deng, Y.; Xu, X.; Guo, X. Influence of minor Zn addition on precipitation behavior and intergranular corrosion properties of Al-Mg-Si alloy. Materials 2020, 13, 650. [Google Scholar] [CrossRef] [PubMed]
- American Society for Testing and Materials. Standard Test Method for Determining the Susceptibility to Intergranular Corrosion of 5xxx Series Aluminum Alloys by Mass Loss after Exposure to Nitric Acid; ASTM G67; ASTM International: West Conshohocken, PA, USA, 2018. [Google Scholar]
- American Society for Testing and Materials. Standard Test Methods for Tension Testing Wrought and Cast Aluminum- and Magnesium-Alloy Products; ASTM B557M-10; ASTM International: West Conshohocken, PA, USA, 2010. [Google Scholar]
- Easton, M.; StJohn, D. Grain refinement of aluminum alloys: Part II. Confirmation of, and a mechanism for, the solute paradigm. Metall. Mater. Trans. A 1999, 30, 1625–1633. [Google Scholar] [CrossRef]
- Kashyap, K.T.; Chandrashekar, T. Effects and mechanisms of grain refinement in aluminium alloys. Bull. Mater. Sci. 2001, 24, 345–353. [Google Scholar] [CrossRef]
- Massalski, T.B.; Murray, J.L.; Bennett, L.H.; Baker, H. Binary Alloy Phase Diagrams; ASM International: Geauga County, OH, USA, 1990; p. 130. [Google Scholar]
- Schoenitz, M.; Dreizen, E.L. Structure and properties of Al–Mg mechanical alloys. J. Mater. Res. 2003, 18, 1827–1836. [Google Scholar] [CrossRef]
- Wang, S.; Luo, B.; Bai, Z.; He, C.; Tan, S.; Jiang, G. Effect of Zn/Mg ratios on microstructure and stress corrosion cracking of 7005 alloy. Materials 2019, 12, 285. [Google Scholar] [CrossRef]
- Hatch, J.E. Aluminum: Properties and Physical Metallurgy; ASM International Metals Park: Geauga County, OH, USA, 1984; p. 333. [Google Scholar]
- Fang, S.F.; Wang, M.P.; Song, M. An approach for the aging process optimization of Al-Zn-Mg-Cu series alloys. Mater. Des. 2009, 30, 2460–2467. [Google Scholar] [CrossRef]
- Liu, Q.; Zhu, R.H.; Liu, D.Y.; Xu, Y.; Li, J.F.; Chen, Y.L.; Zhang, X.H.; Zheng, Z.Q. Correlation between artificial aging and intergranular corrosion sensitivity of a new Al-Cu-Li alloy sheet. Mater. Corros. 2017, 68, 65–76. [Google Scholar] [CrossRef]
- Wang, H.; Jiang, B.; Yi, D.; Wang, B.; Liu, H.; Wu, C.; Shen, F. Microstructure, corrosion behavior and mechanical properties of a non-isothermal ageing treated cast Al–4.5Cu–3.5Zn–0.5Mg alloy. Mater. Res. Express 2020, 7, 1–11. [Google Scholar] [CrossRef]


| Alloy | Mg | Al-75Mn | Zn | Al |
|---|---|---|---|---|
| A | 0.56 | - | - | 11.44 |
| B | 0.56 | 0.12 | - | 11.32 |
| C | 0.56 | - | 0.08 | 11.36 |
| D | 0.56 | 0.12 | 0.08 | 11.24 |
| Alloy | Mg | Mn | Zn | Al |
|---|---|---|---|---|
| A | 4.58 | - | - | Rem. |
| B | 4.62 | 0.78 | - | Rem. |
| C | 4.58 | - | 0.68 | Rem. |
| D | 4.61 | 0.76 | 0.69 | Rem. |
| Alloy | As-Cast CC | Homogenization CW | Sensitization CS | (CW − CC)/CC × 100% | (CS − CW)/CW × 100% |
|---|---|---|---|---|---|
| A | 33.77 (0.14) | 33.61 (0.11) | 34.20 (0.12) | −0.47% | 1.76% |
| B | 23.78 (0.11) | 26.07 (0.09) | 26.64 (0.10) | 9.63% | 2.19% |
| C | 33.43 (0.08) | 33.23 (0.10) | 34.10 (0.08) | −0.60% | 2.92% |
| D | 23.34 (0.08) | 26.01 (0.11) | 27.12 (0.10) | 11.44% | 4.27% |
| Alloy | Homogenization | Sensitization |
|---|---|---|
| A | 3.1 (0.2) | 15.4 (0.4) |
| B | 2.9 (0.3) | 15.9 (0.7) |
| C | 2.7 (0.4) | 35.1 (1.2) |
| D | 3.1 (0.5) 2.9 (0.3)* | 61.3 (2.3) 24.6 (1.1) * |
| Alloy | As-Cast Hardness UTS (HRB) (MPa) | Homogenization Hardness UTS (HRB) (MPa) | Sensitization Hardness UTS (HRB) (MPa) |
|---|---|---|---|
| A | 51.6 252.6 (1.1) (4.2) | 55.2 263.3 (1.1) (4.5) | 50.4 247.6 (0.9) (3.9) |
| B | 65.1 298.7 (1.1) (3.2) | 71.3 329.8 (1.3) (4.2) | 66.9 302.7 (1.2) (3.2) |
| C | 53.9 263.2 (1.0) (4.4) | 57.1 281.7 (1.0) (2.1) | 55.4 266.5 (1.3) (4.2) |
| D | 66.8 309.7 (1.2) (2.5) | 73.4 336.2 (1.1) (4.0) 68.4 * 312.7* (1.3) (3.1) | 71.6 330.2 (1.2) (3.6) 67.2 * 305.6 * (1.4) (1.1) |
© 2020 by the authors. Licensee MDPI, Basel, Switzerland. This article is an open access article distributed under the terms and conditions of the Creative Commons Attribution (CC BY) license (http://creativecommons.org/licenses/by/4.0/).
Share and Cite
Wu, C.-T.; Lee, S.-L.; Chen, Y.-F.; Bor, H.-Y.; Liu, K.-H. Effects of Mn, Zn Additions and Cooling Rate on Mechanical and Corrosion Properties of Al-4.6Mg Casting Alloys. Materials 2020, 13, 1983. https://doi.org/10.3390/ma13081983
Wu C-T, Lee S-L, Chen Y-F, Bor H-Y, Liu K-H. Effects of Mn, Zn Additions and Cooling Rate on Mechanical and Corrosion Properties of Al-4.6Mg Casting Alloys. Materials. 2020; 13(8):1983. https://doi.org/10.3390/ma13081983
Chicago/Turabian StyleWu, Chih-Ting, Sheng-Long Lee, Ye-Feng Chen, Hui-Yun Bor, and Kung-Hui Liu. 2020. "Effects of Mn, Zn Additions and Cooling Rate on Mechanical and Corrosion Properties of Al-4.6Mg Casting Alloys" Materials 13, no. 8: 1983. https://doi.org/10.3390/ma13081983
APA StyleWu, C.-T., Lee, S.-L., Chen, Y.-F., Bor, H.-Y., & Liu, K.-H. (2020). Effects of Mn, Zn Additions and Cooling Rate on Mechanical and Corrosion Properties of Al-4.6Mg Casting Alloys. Materials, 13(8), 1983. https://doi.org/10.3390/ma13081983