The Influences of Cement Hydration and Temperature on the Thixotropy of Cement Paste

 ,
,  ,
,  ,
,  ,
,
Abstract
1. Introduction
2. Materials and Methods
2.1. Raw Materials and Sample Preparation
2.2. Methods
2.2.1. Calorimetry
2.2.2. XRD and SEM
2.2.3. Ion-Concentration
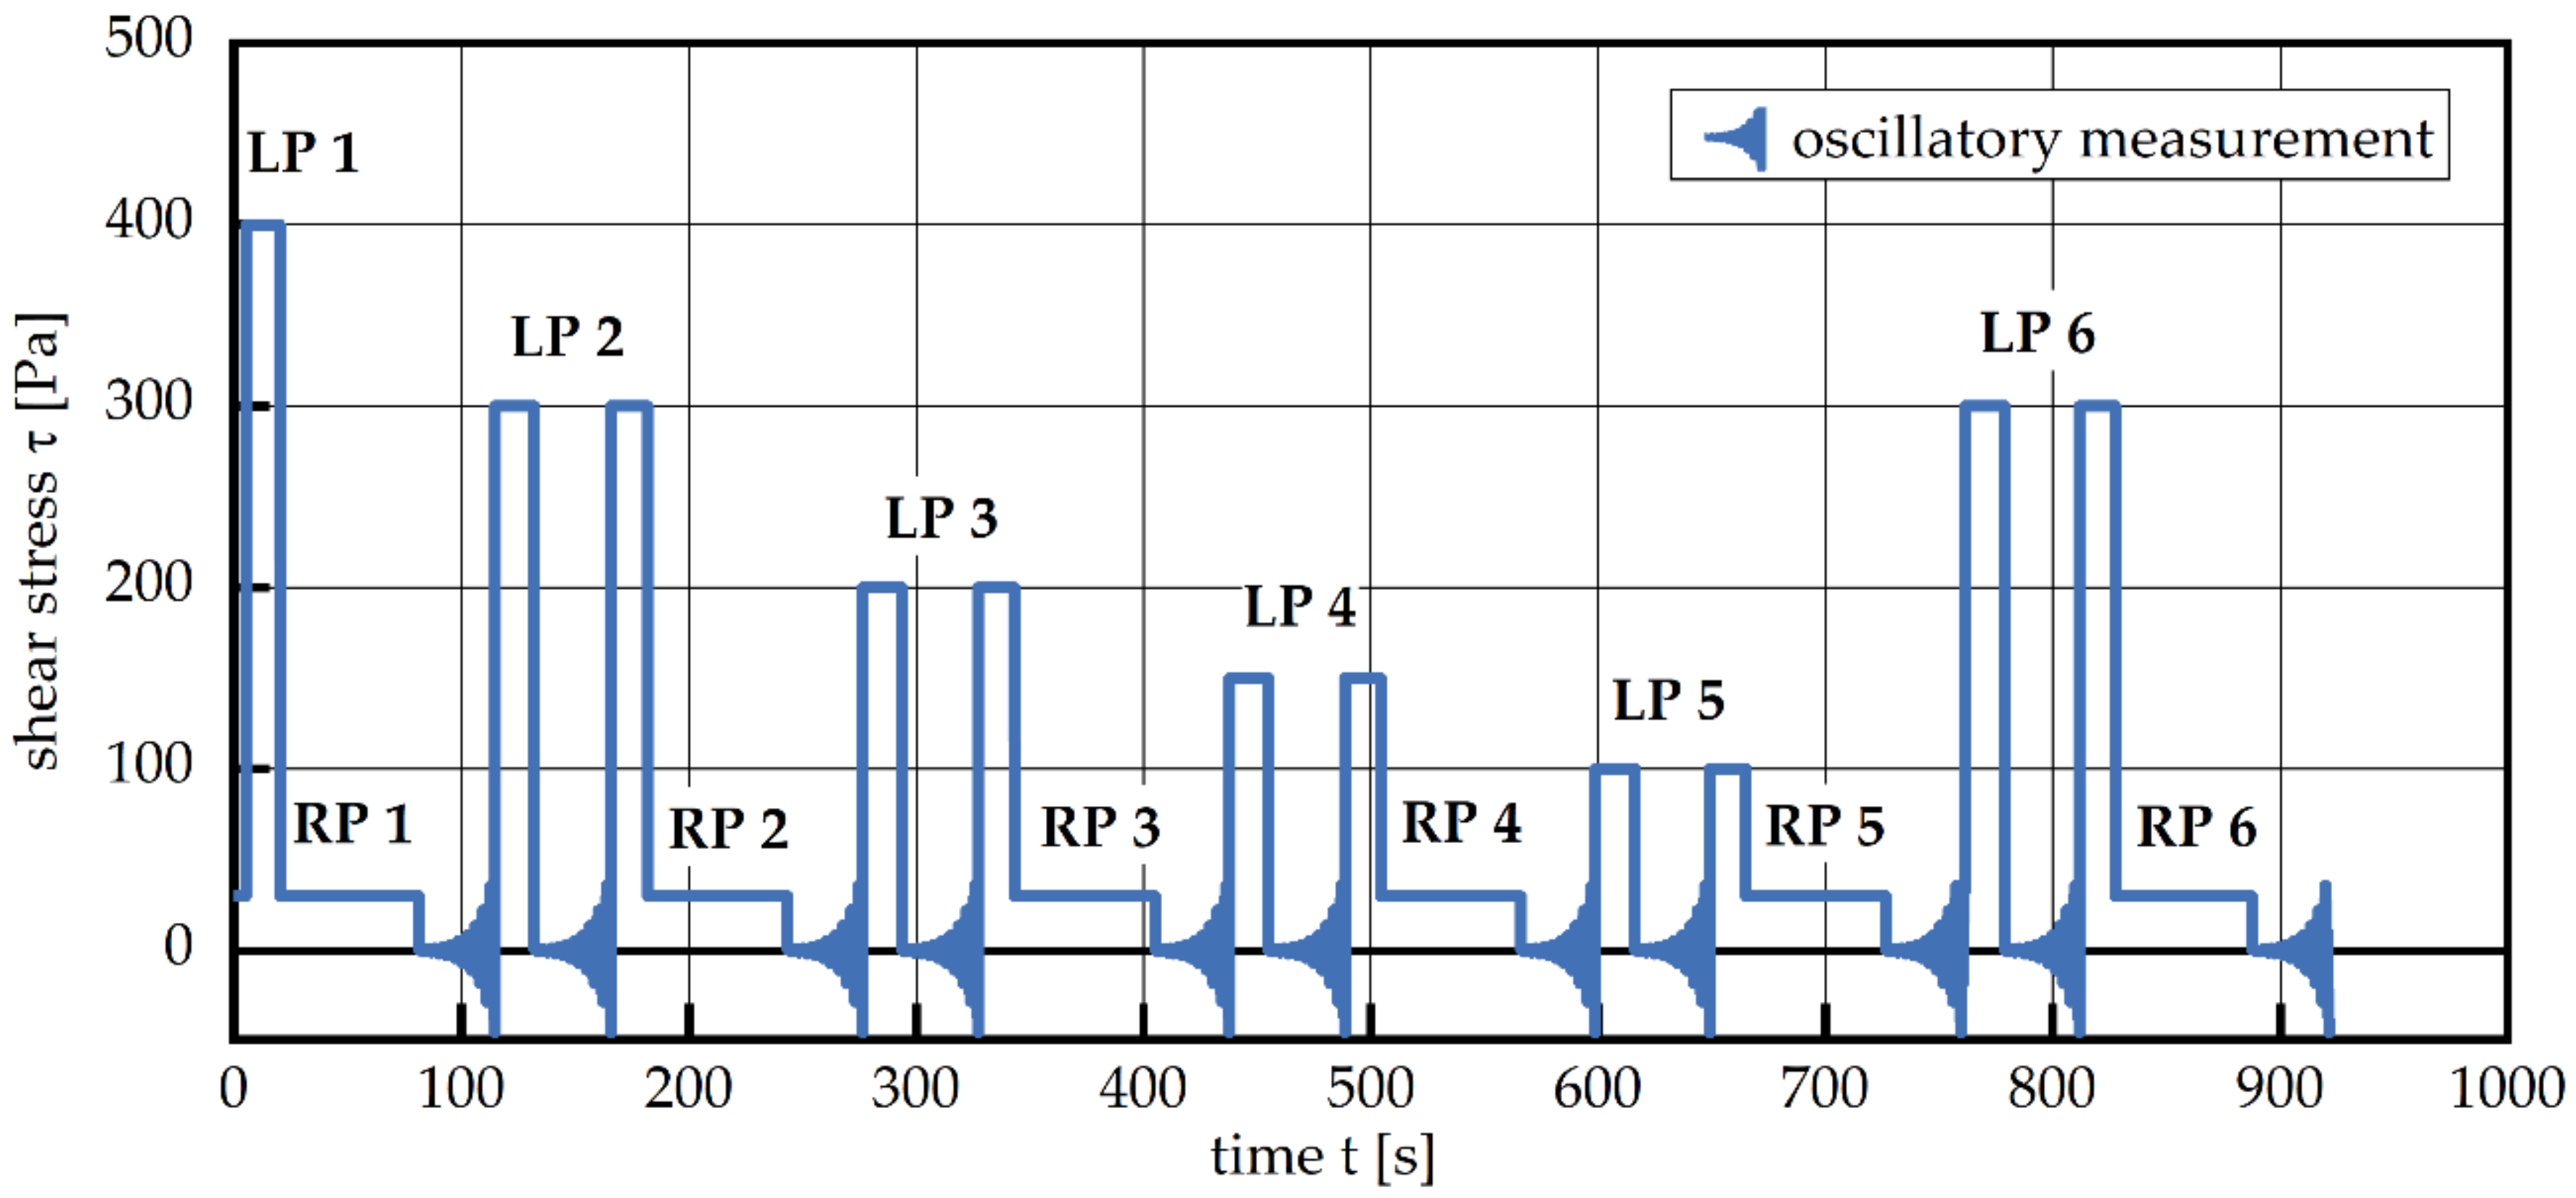
2.2.4. Rheological Measurements
3. Results
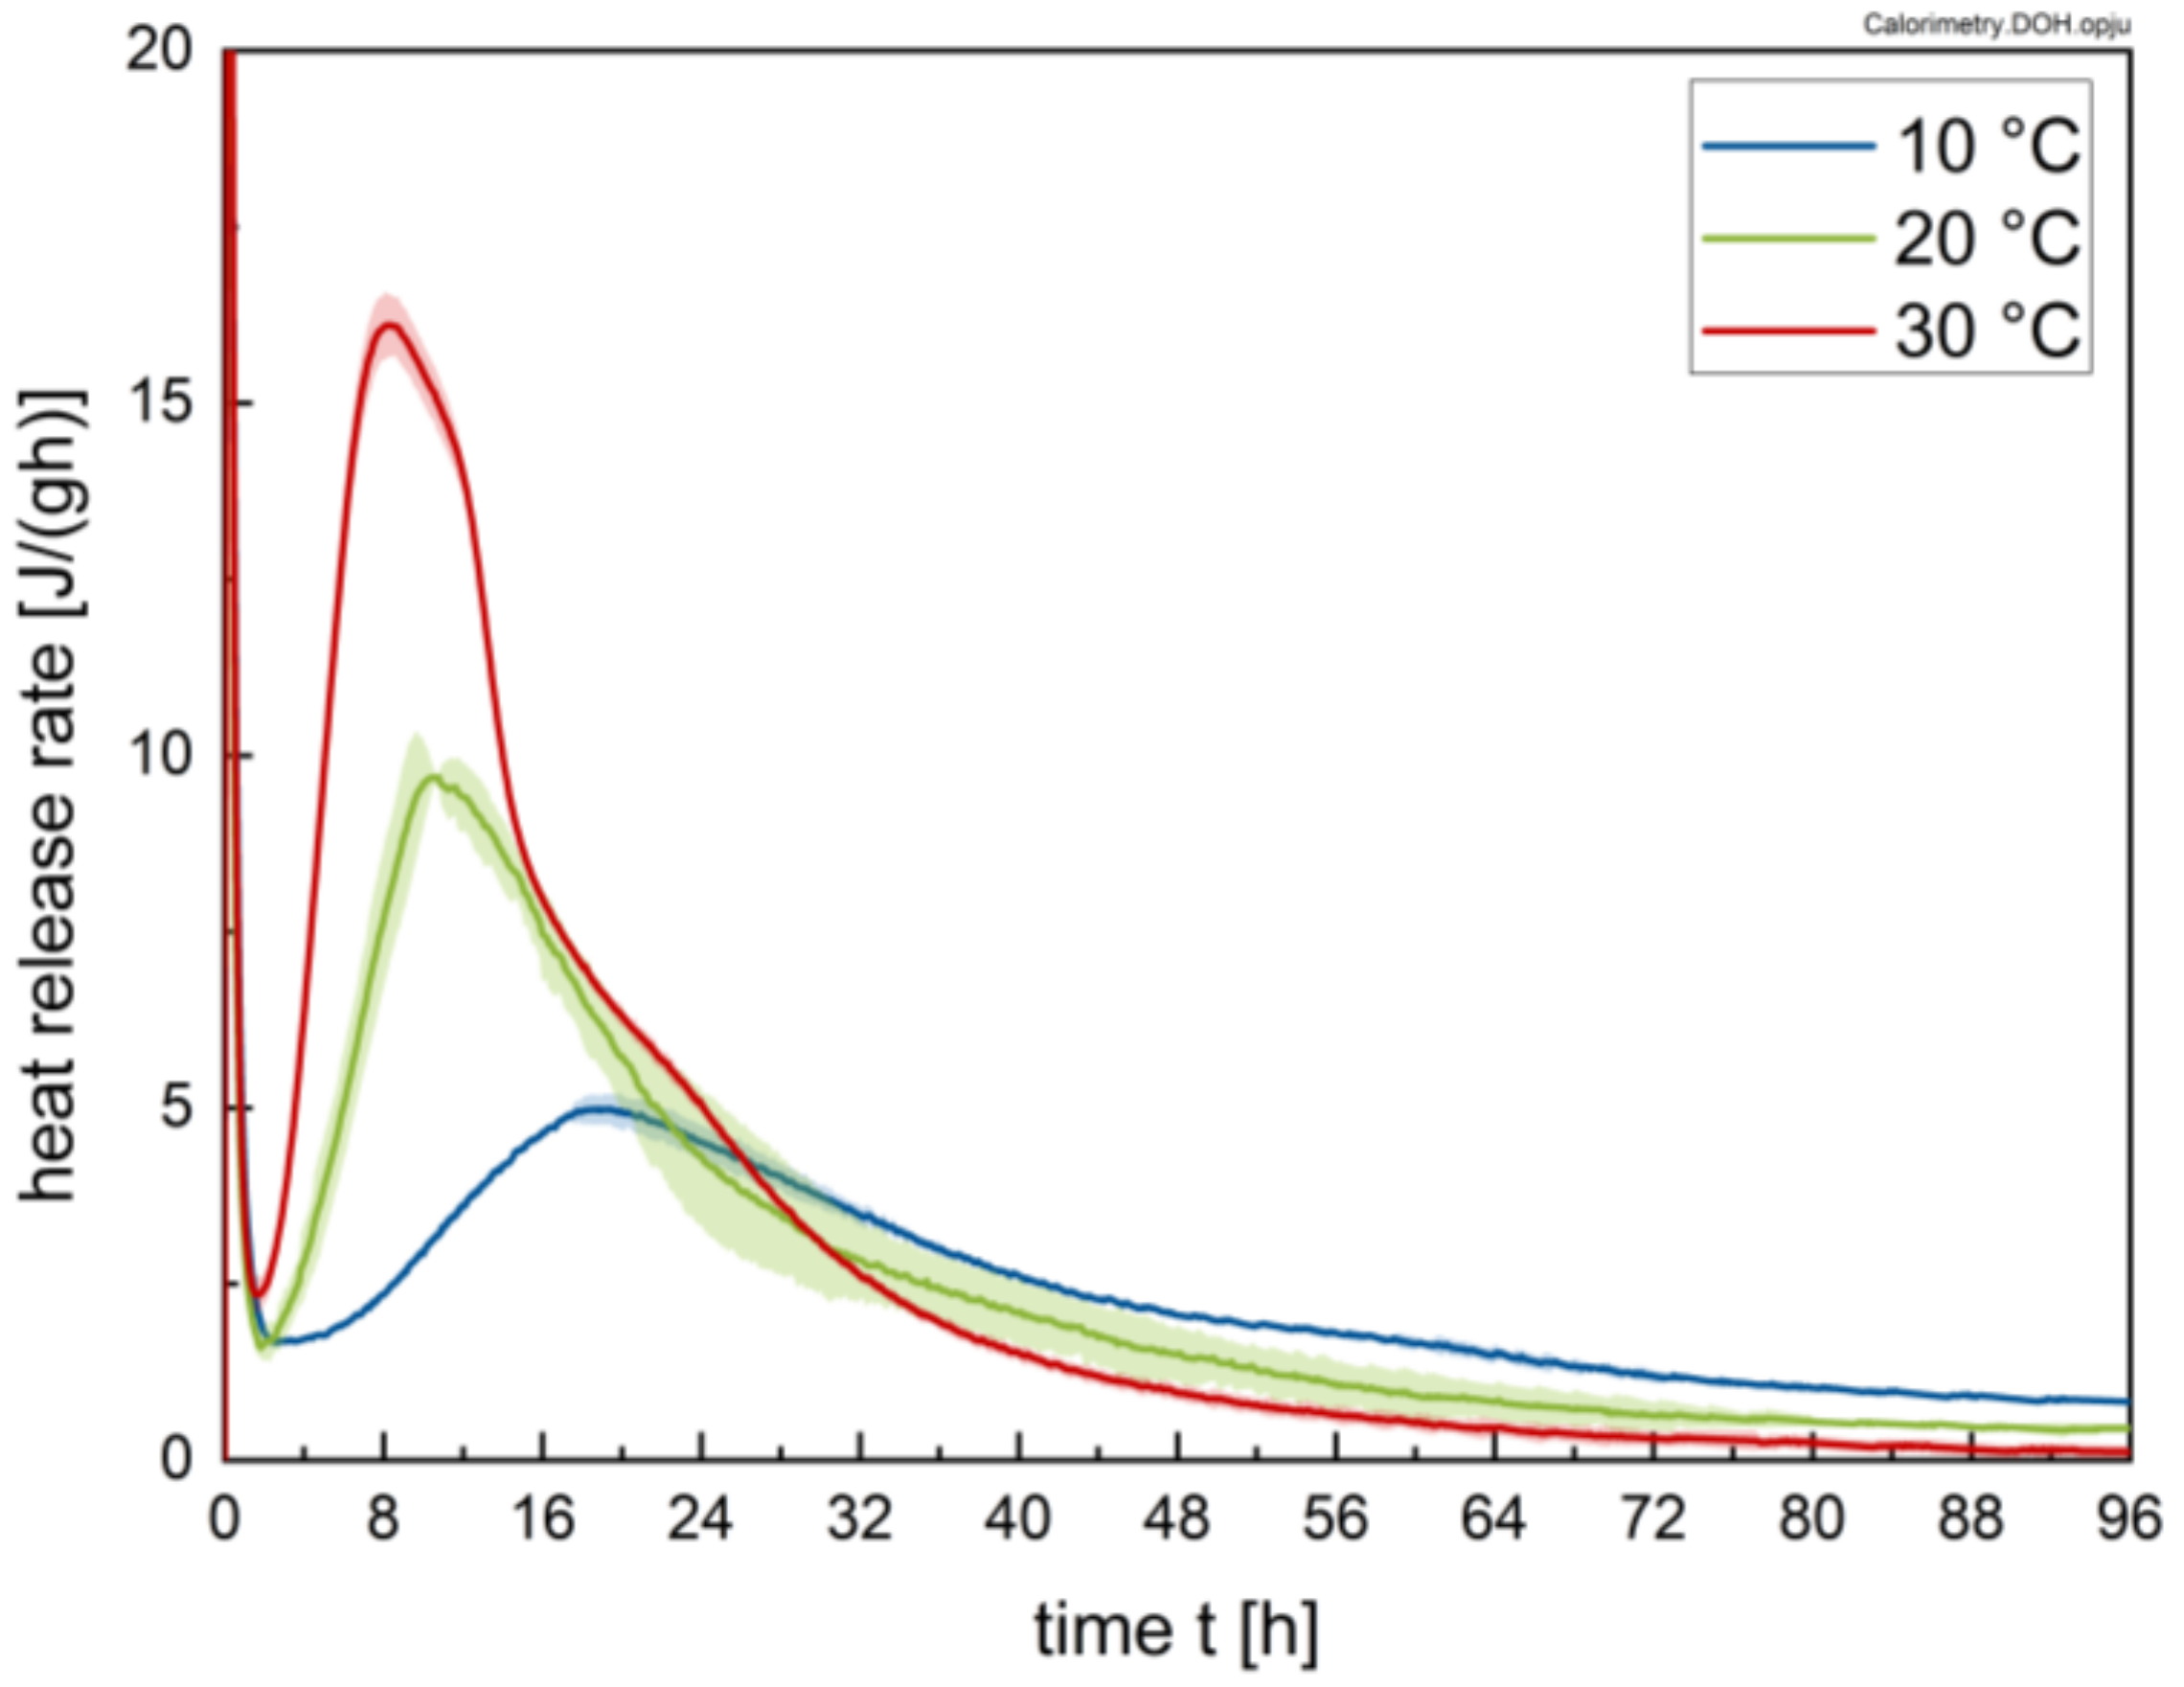
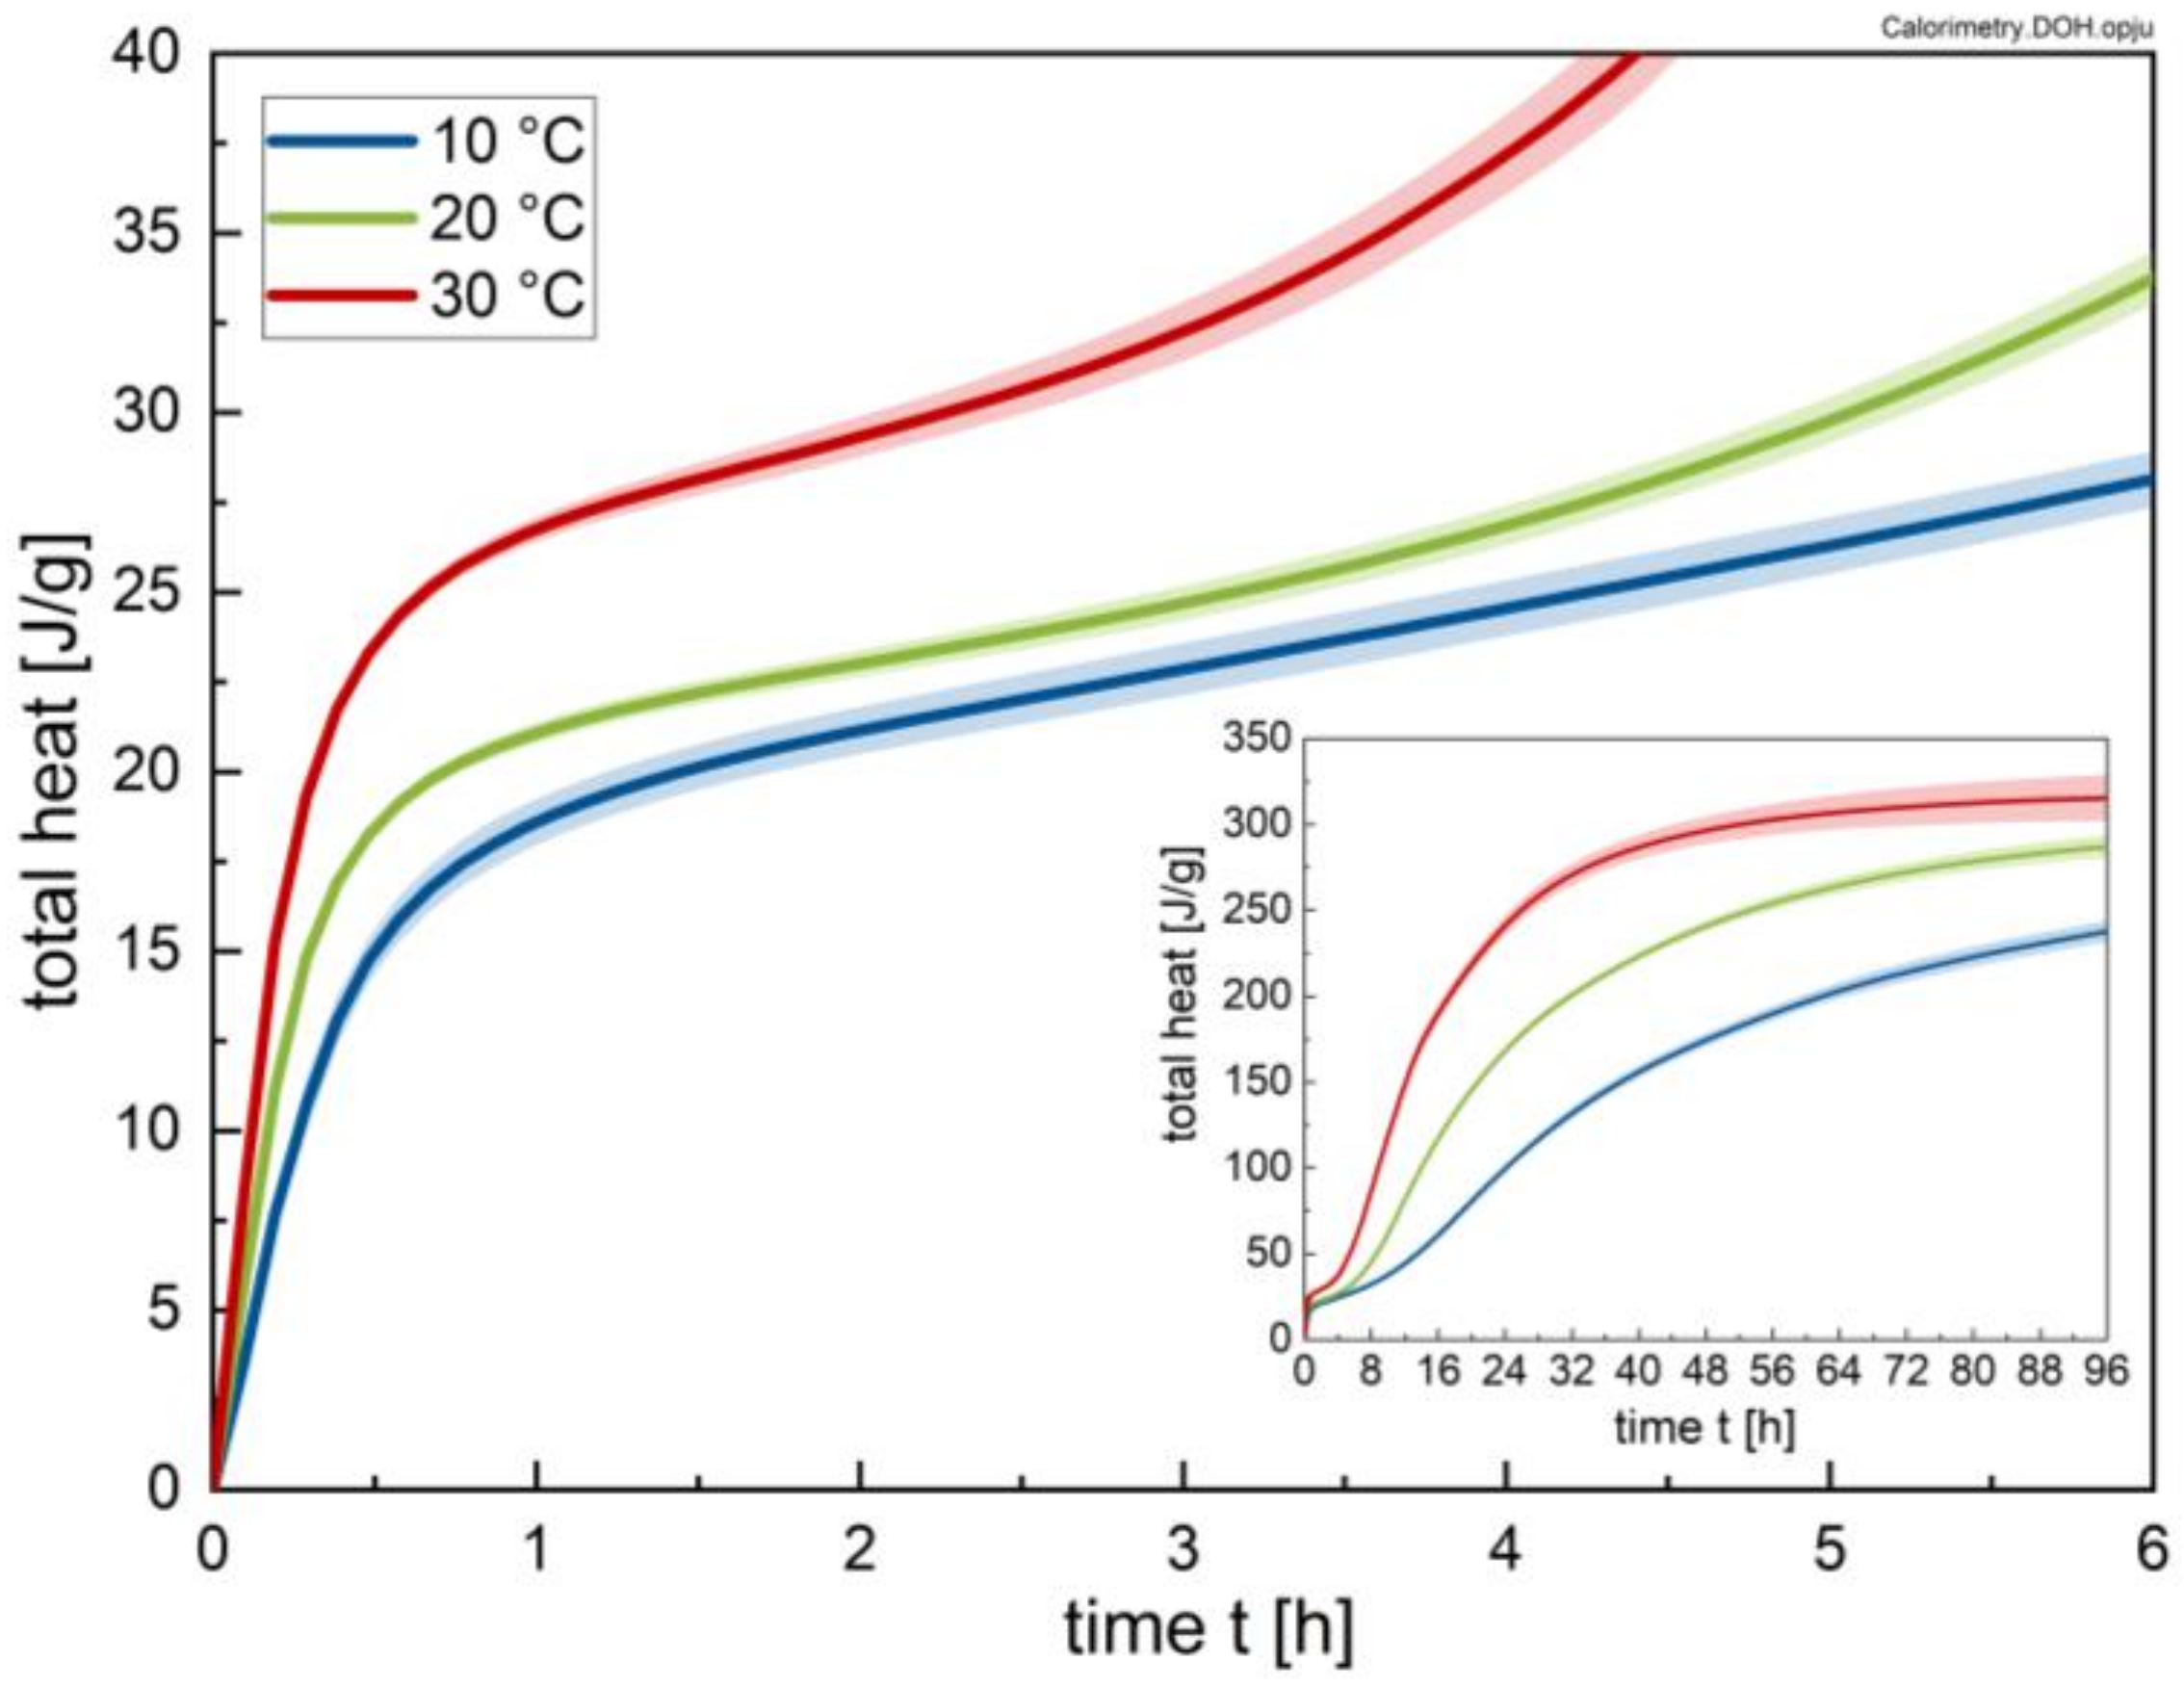
3.1. Calorimetry
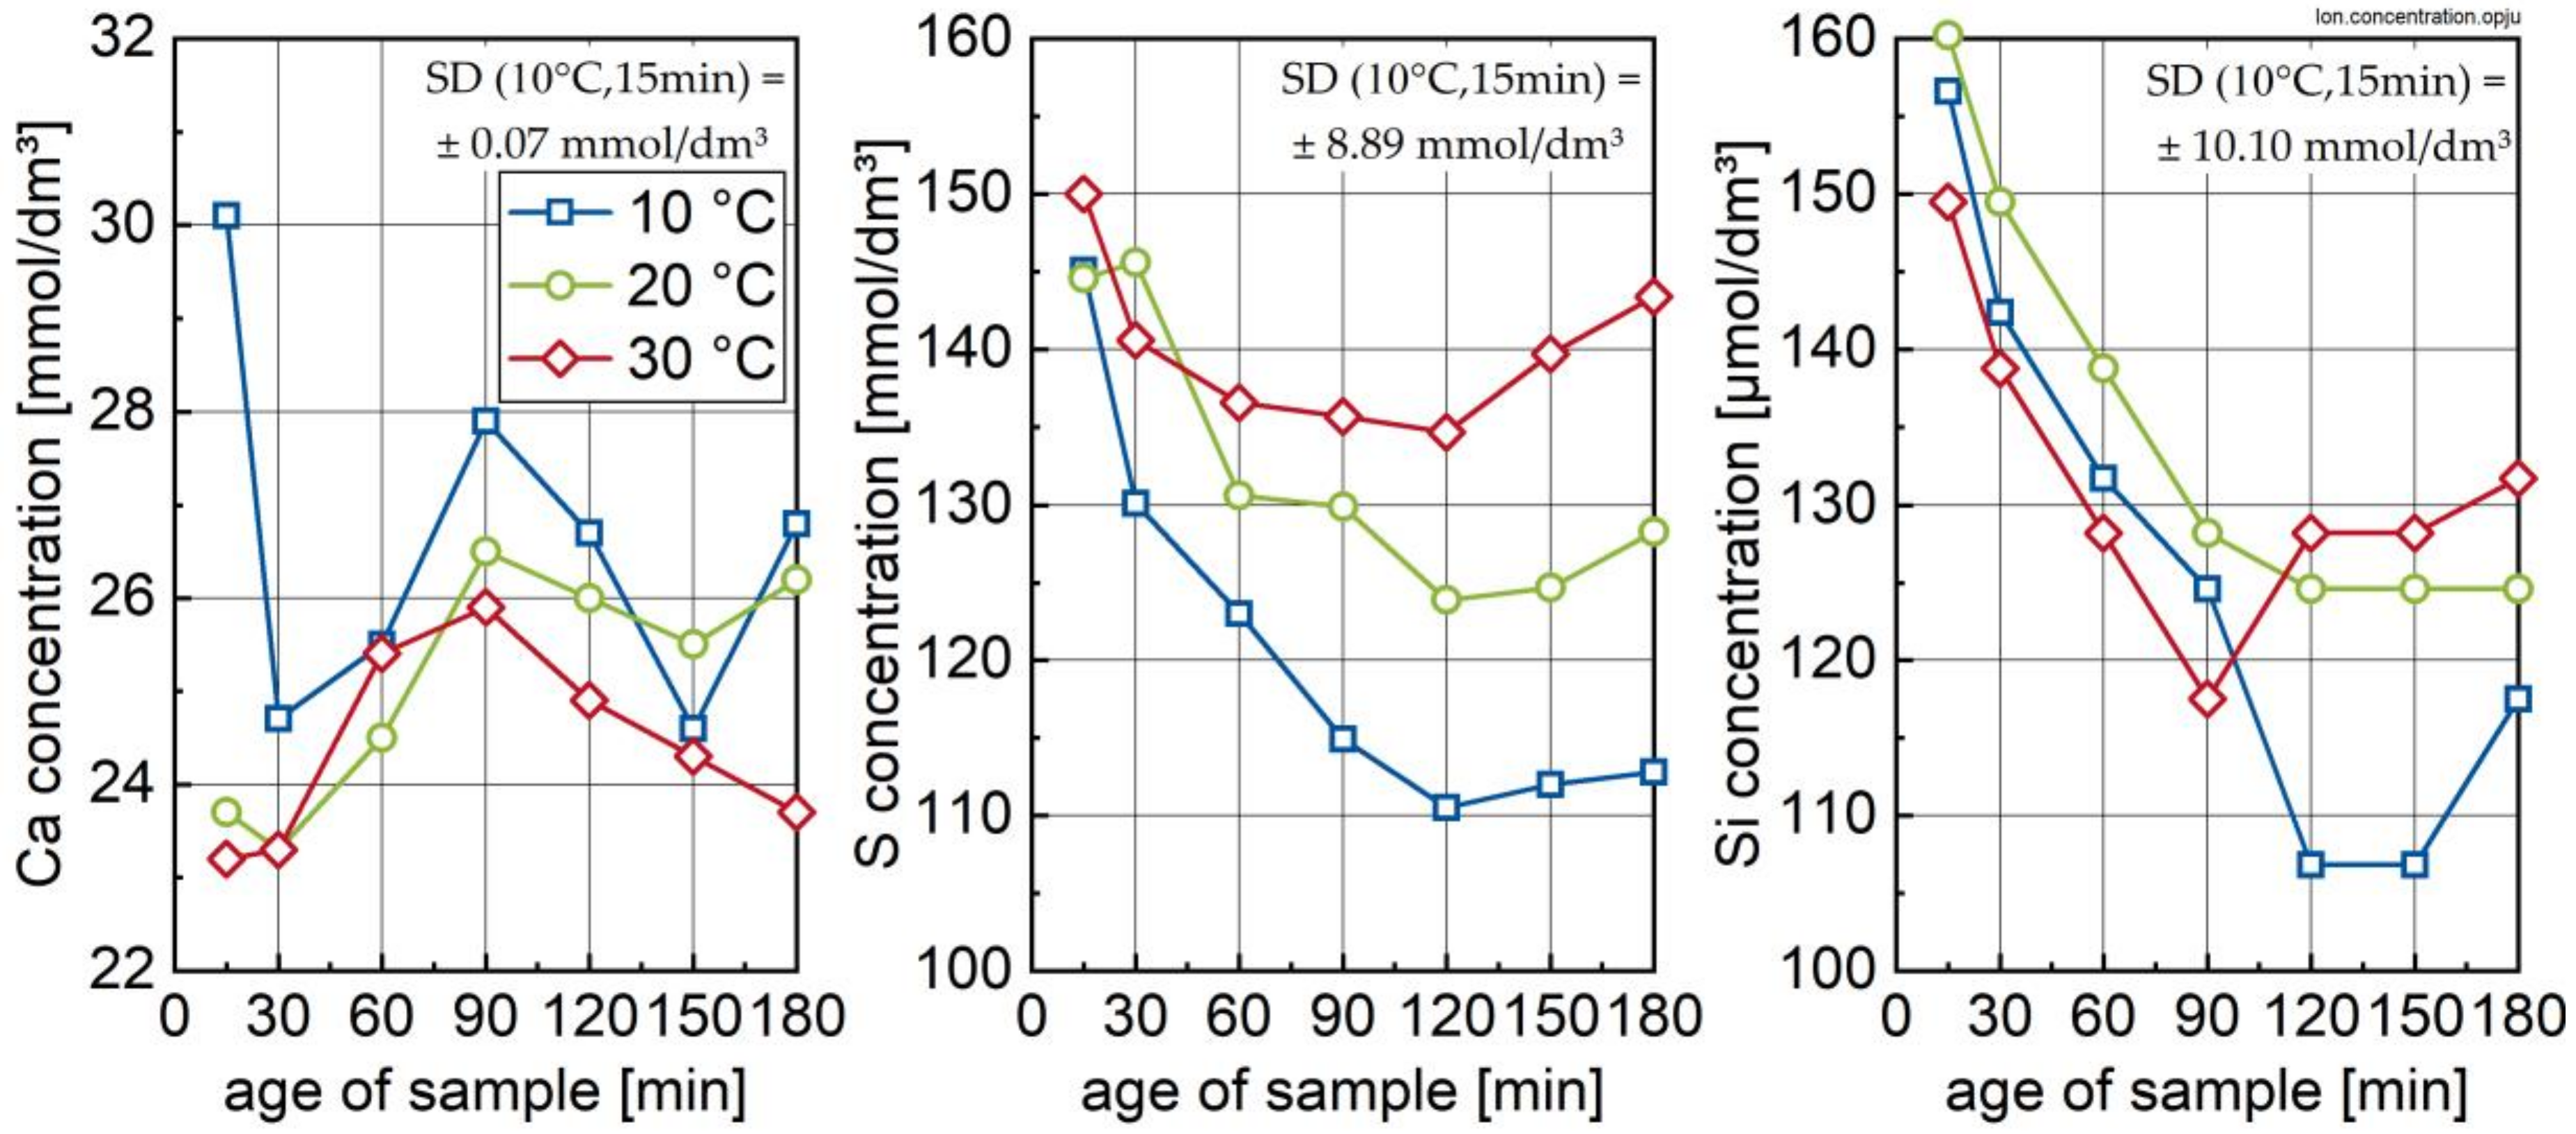
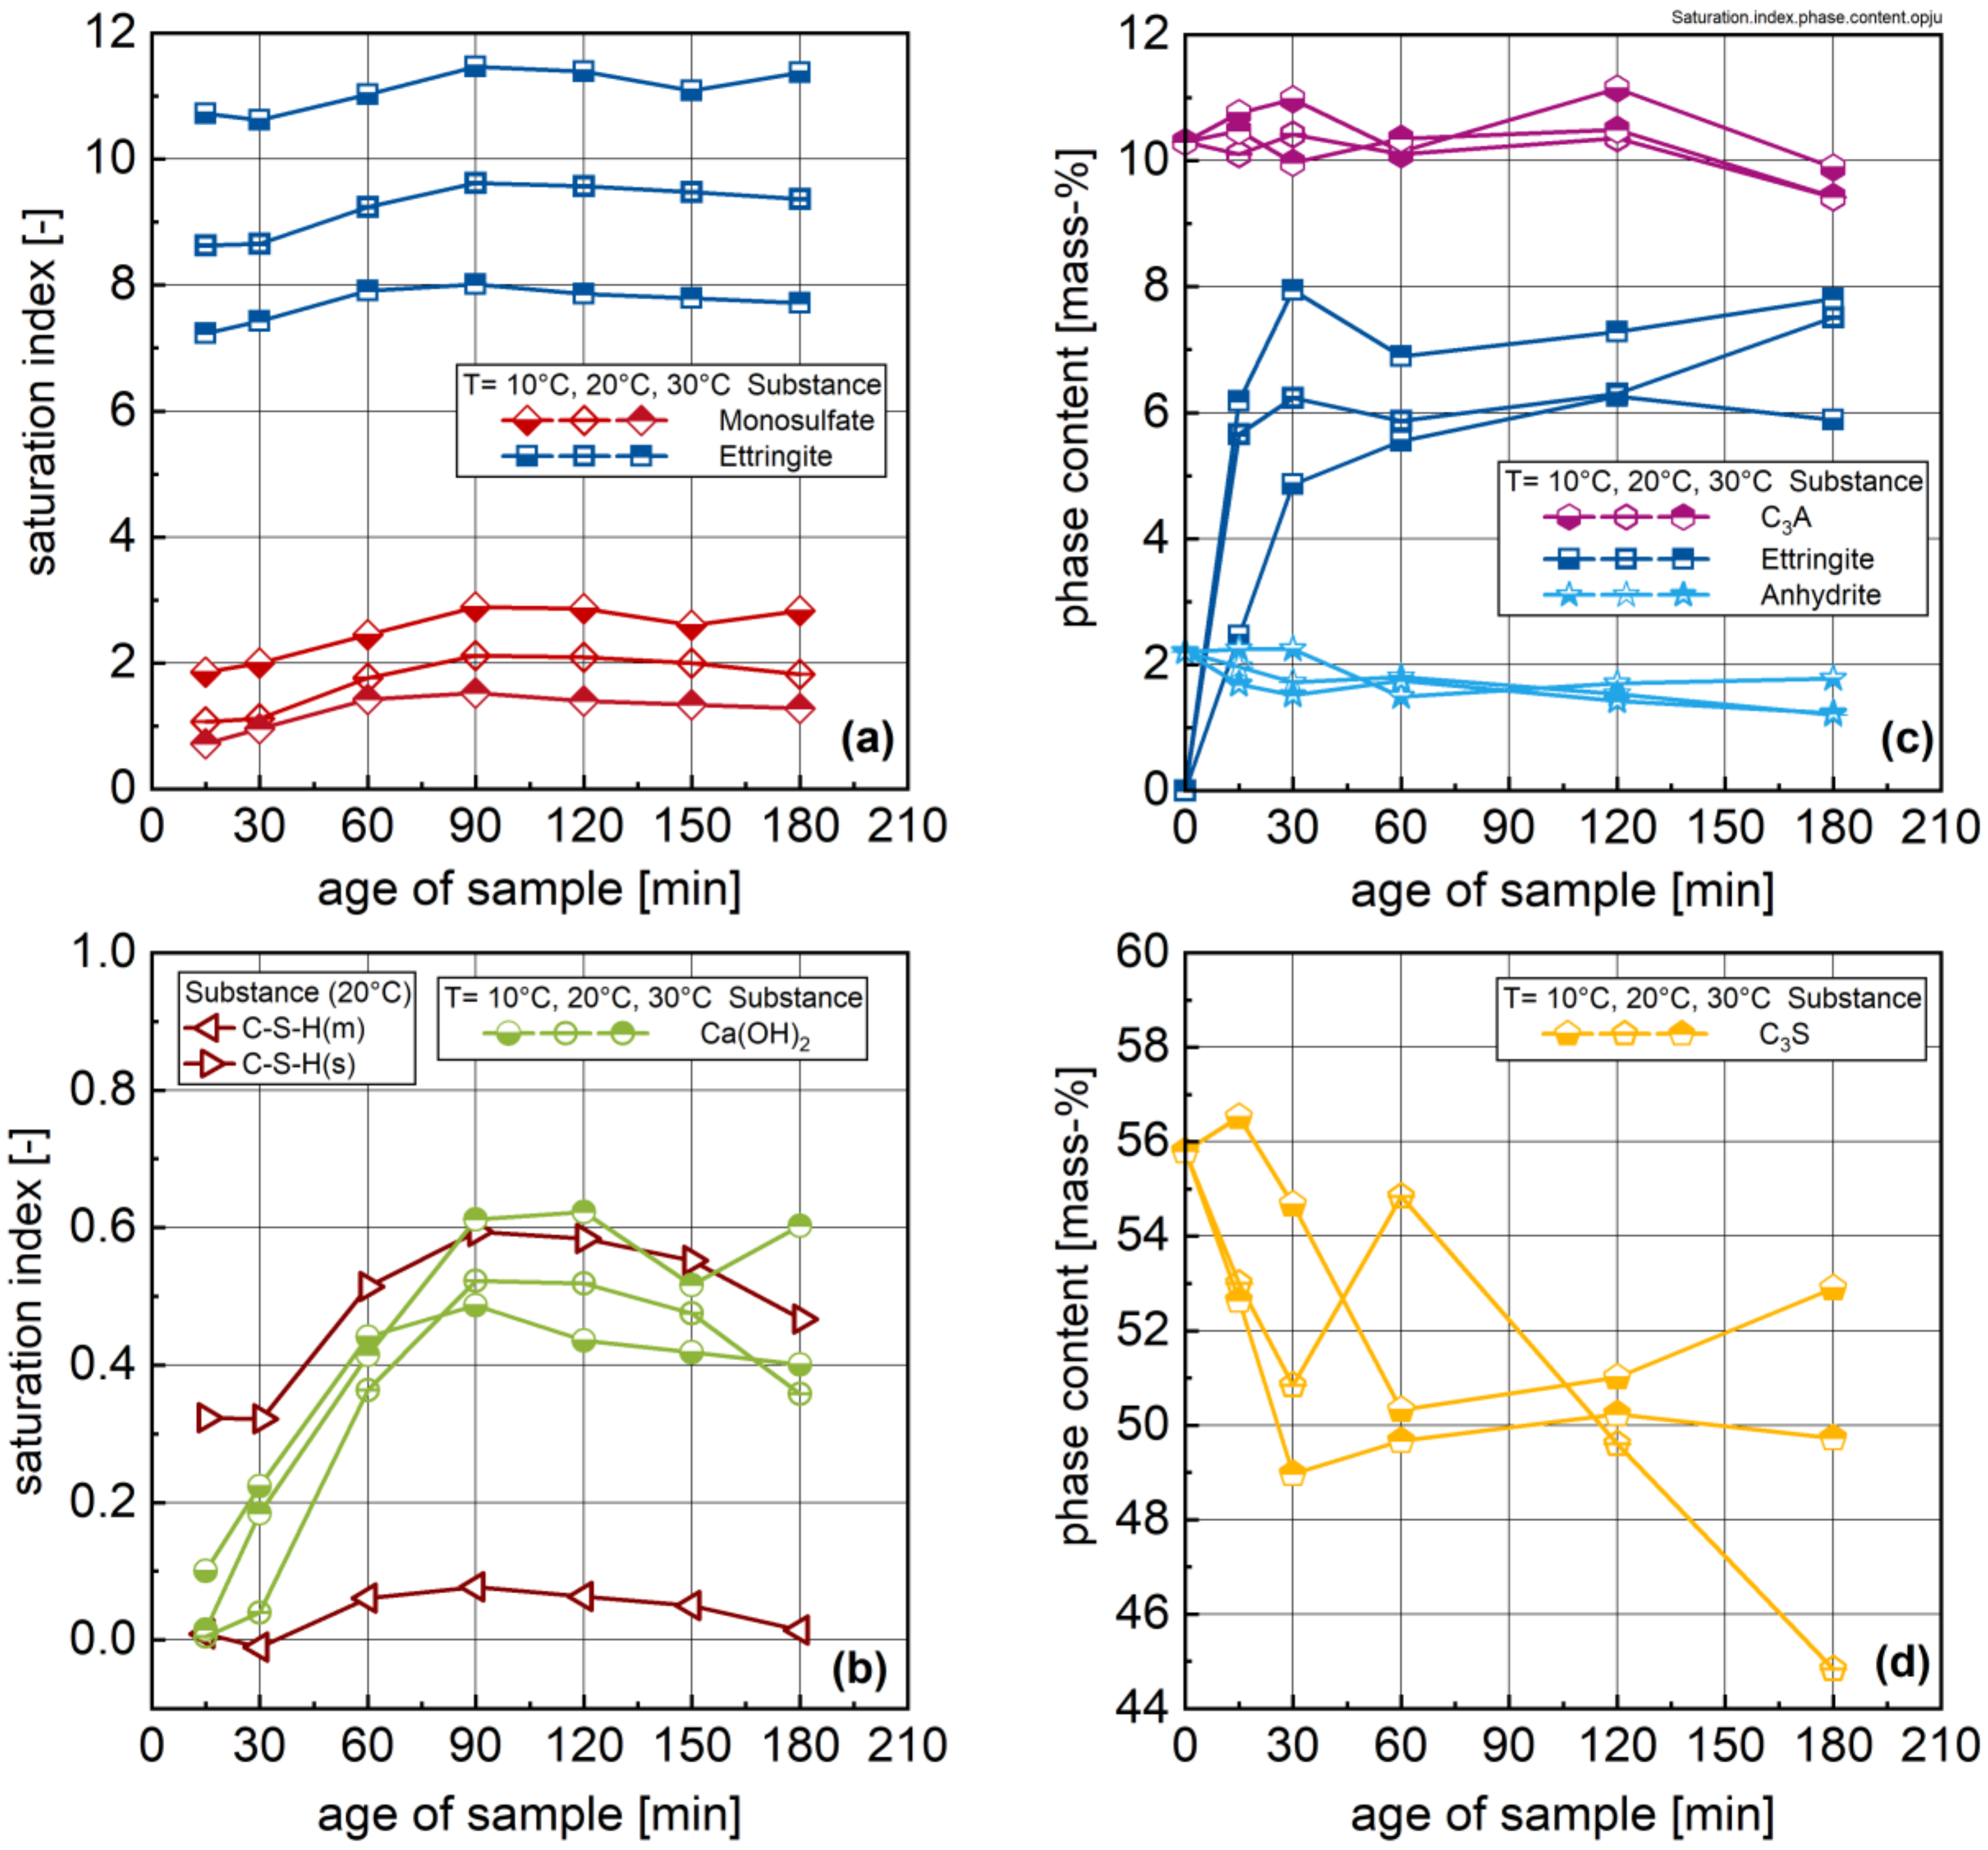
3.2. Ion Species in Carrier Liquid and Change in Solid Phase Inventory
3.3. Change in Rheological Properties
4. Discussion
5. Conclusions
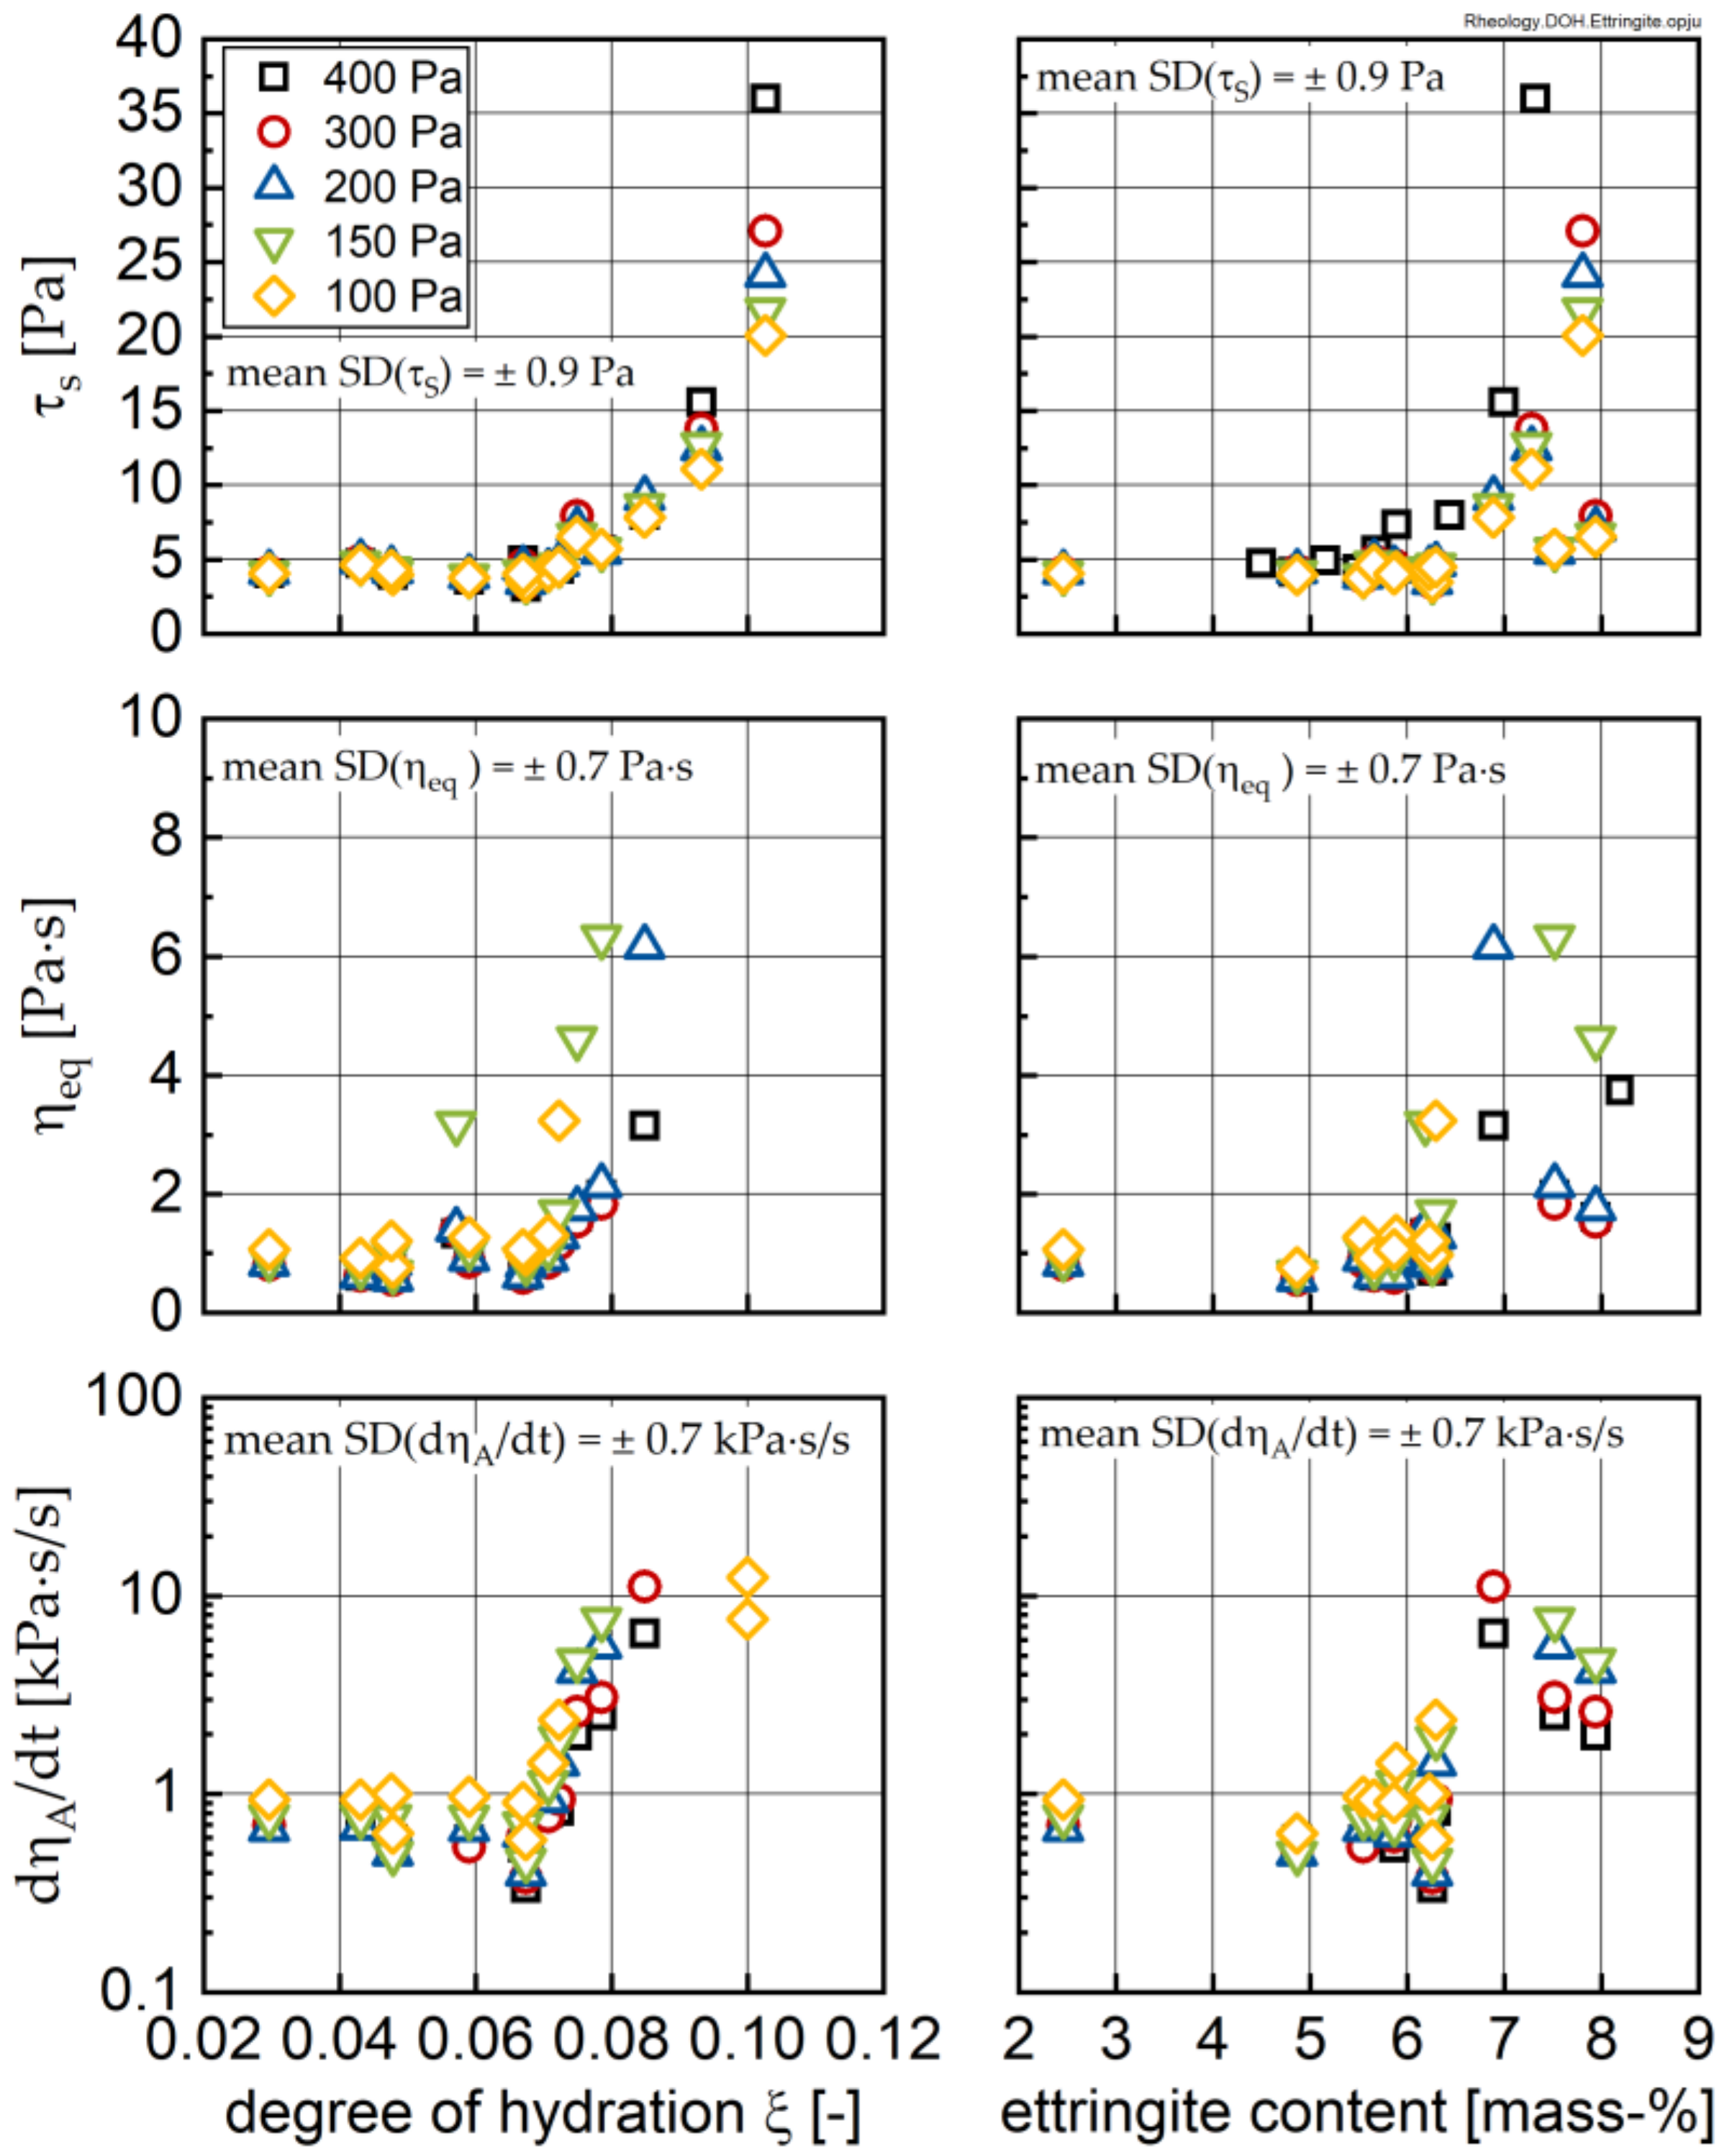
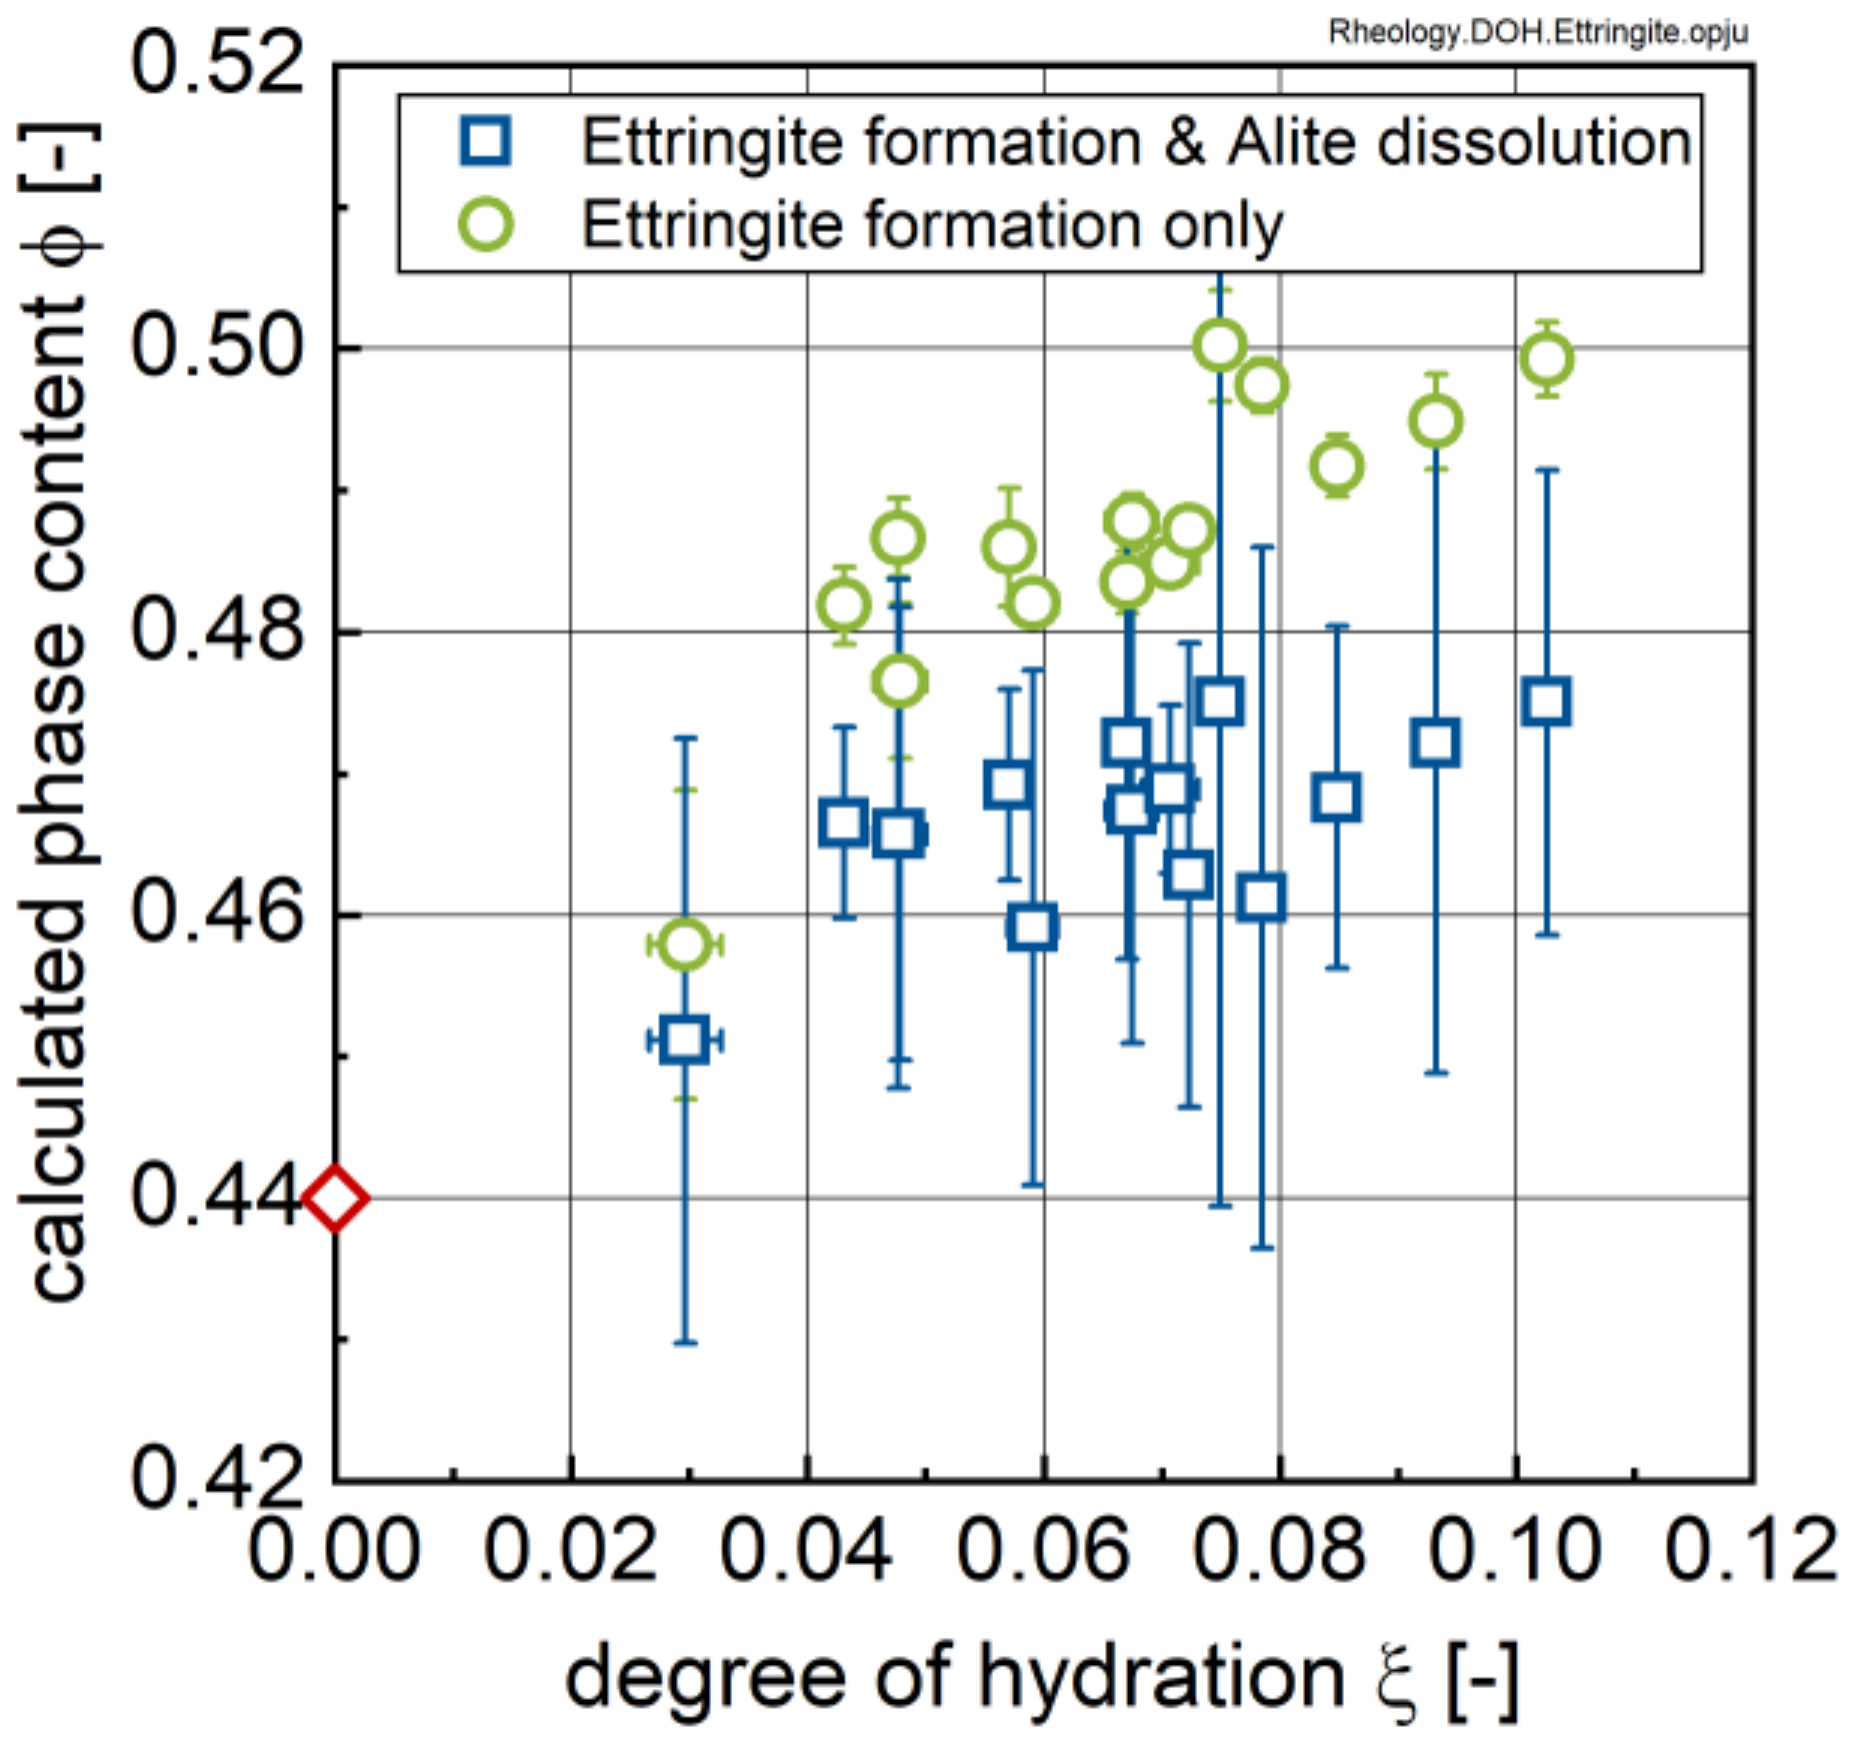
- All investigated rheological parameters do not show a continuous change—i.e., increase—with time and degree of hydration, but rather exhibit a steady period or even a minor decline in the first hours of hydration before a pronounced increase is observed. This steadiness or decline cannot be explained by increasing the formation of ettringite. The results, rather, imply that water consumption due to ettringite formation is compensated by the dissolution of alite and other cement compounds, eventually leading to even lower phase contents and thus lower rheological values with time compared to the time of the first measurement; i.e., 15 min.
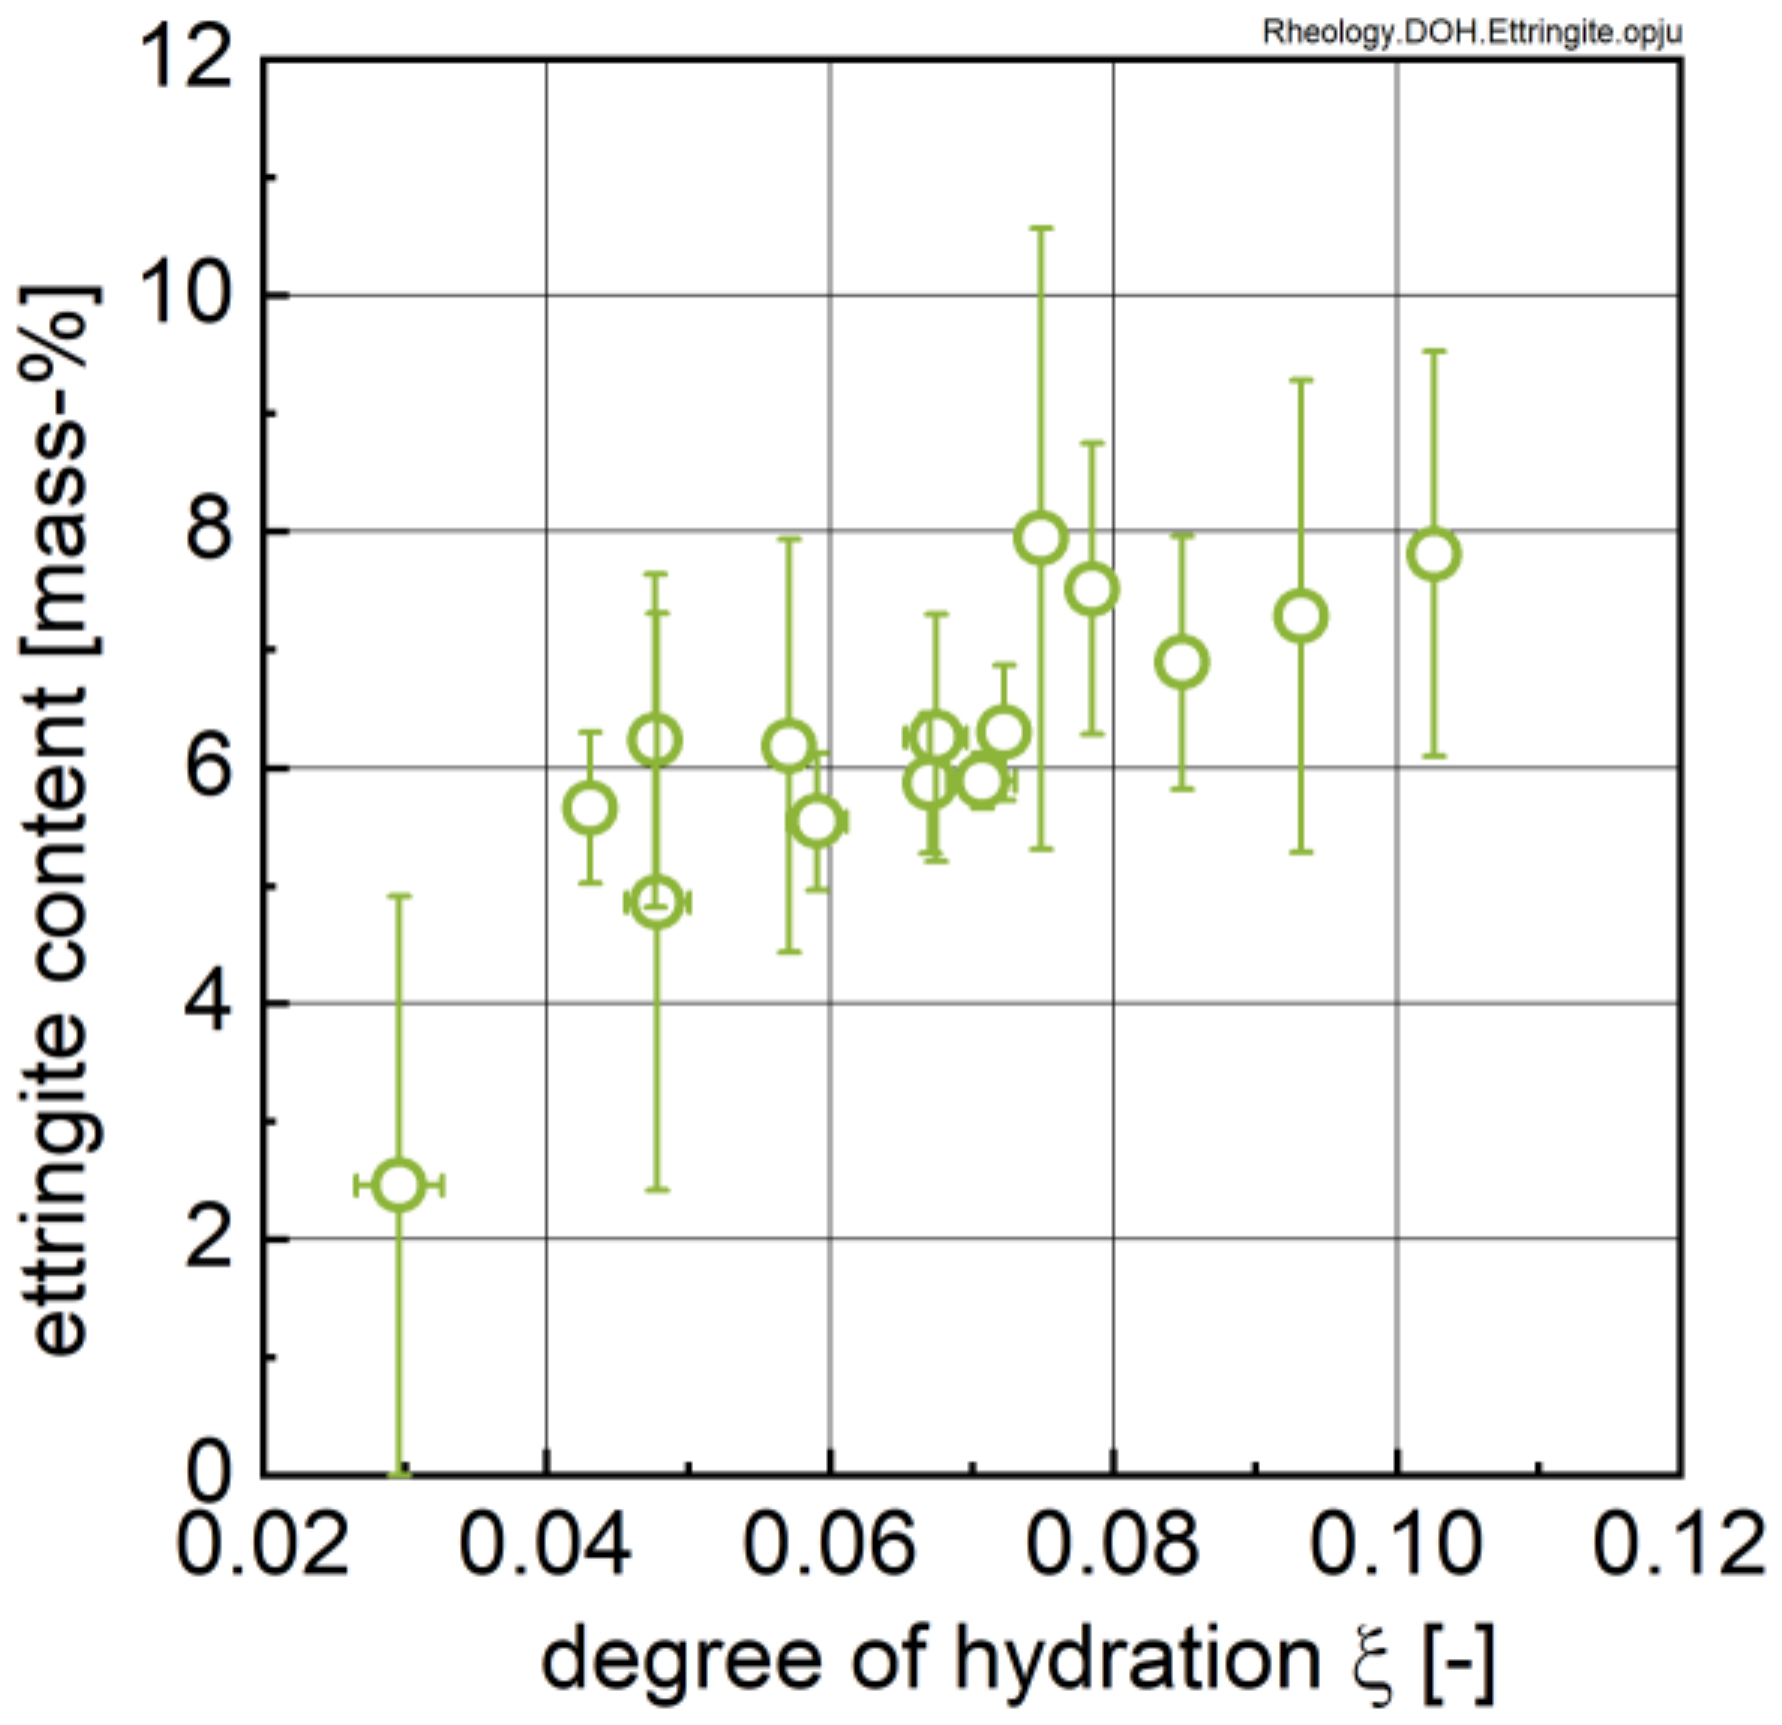
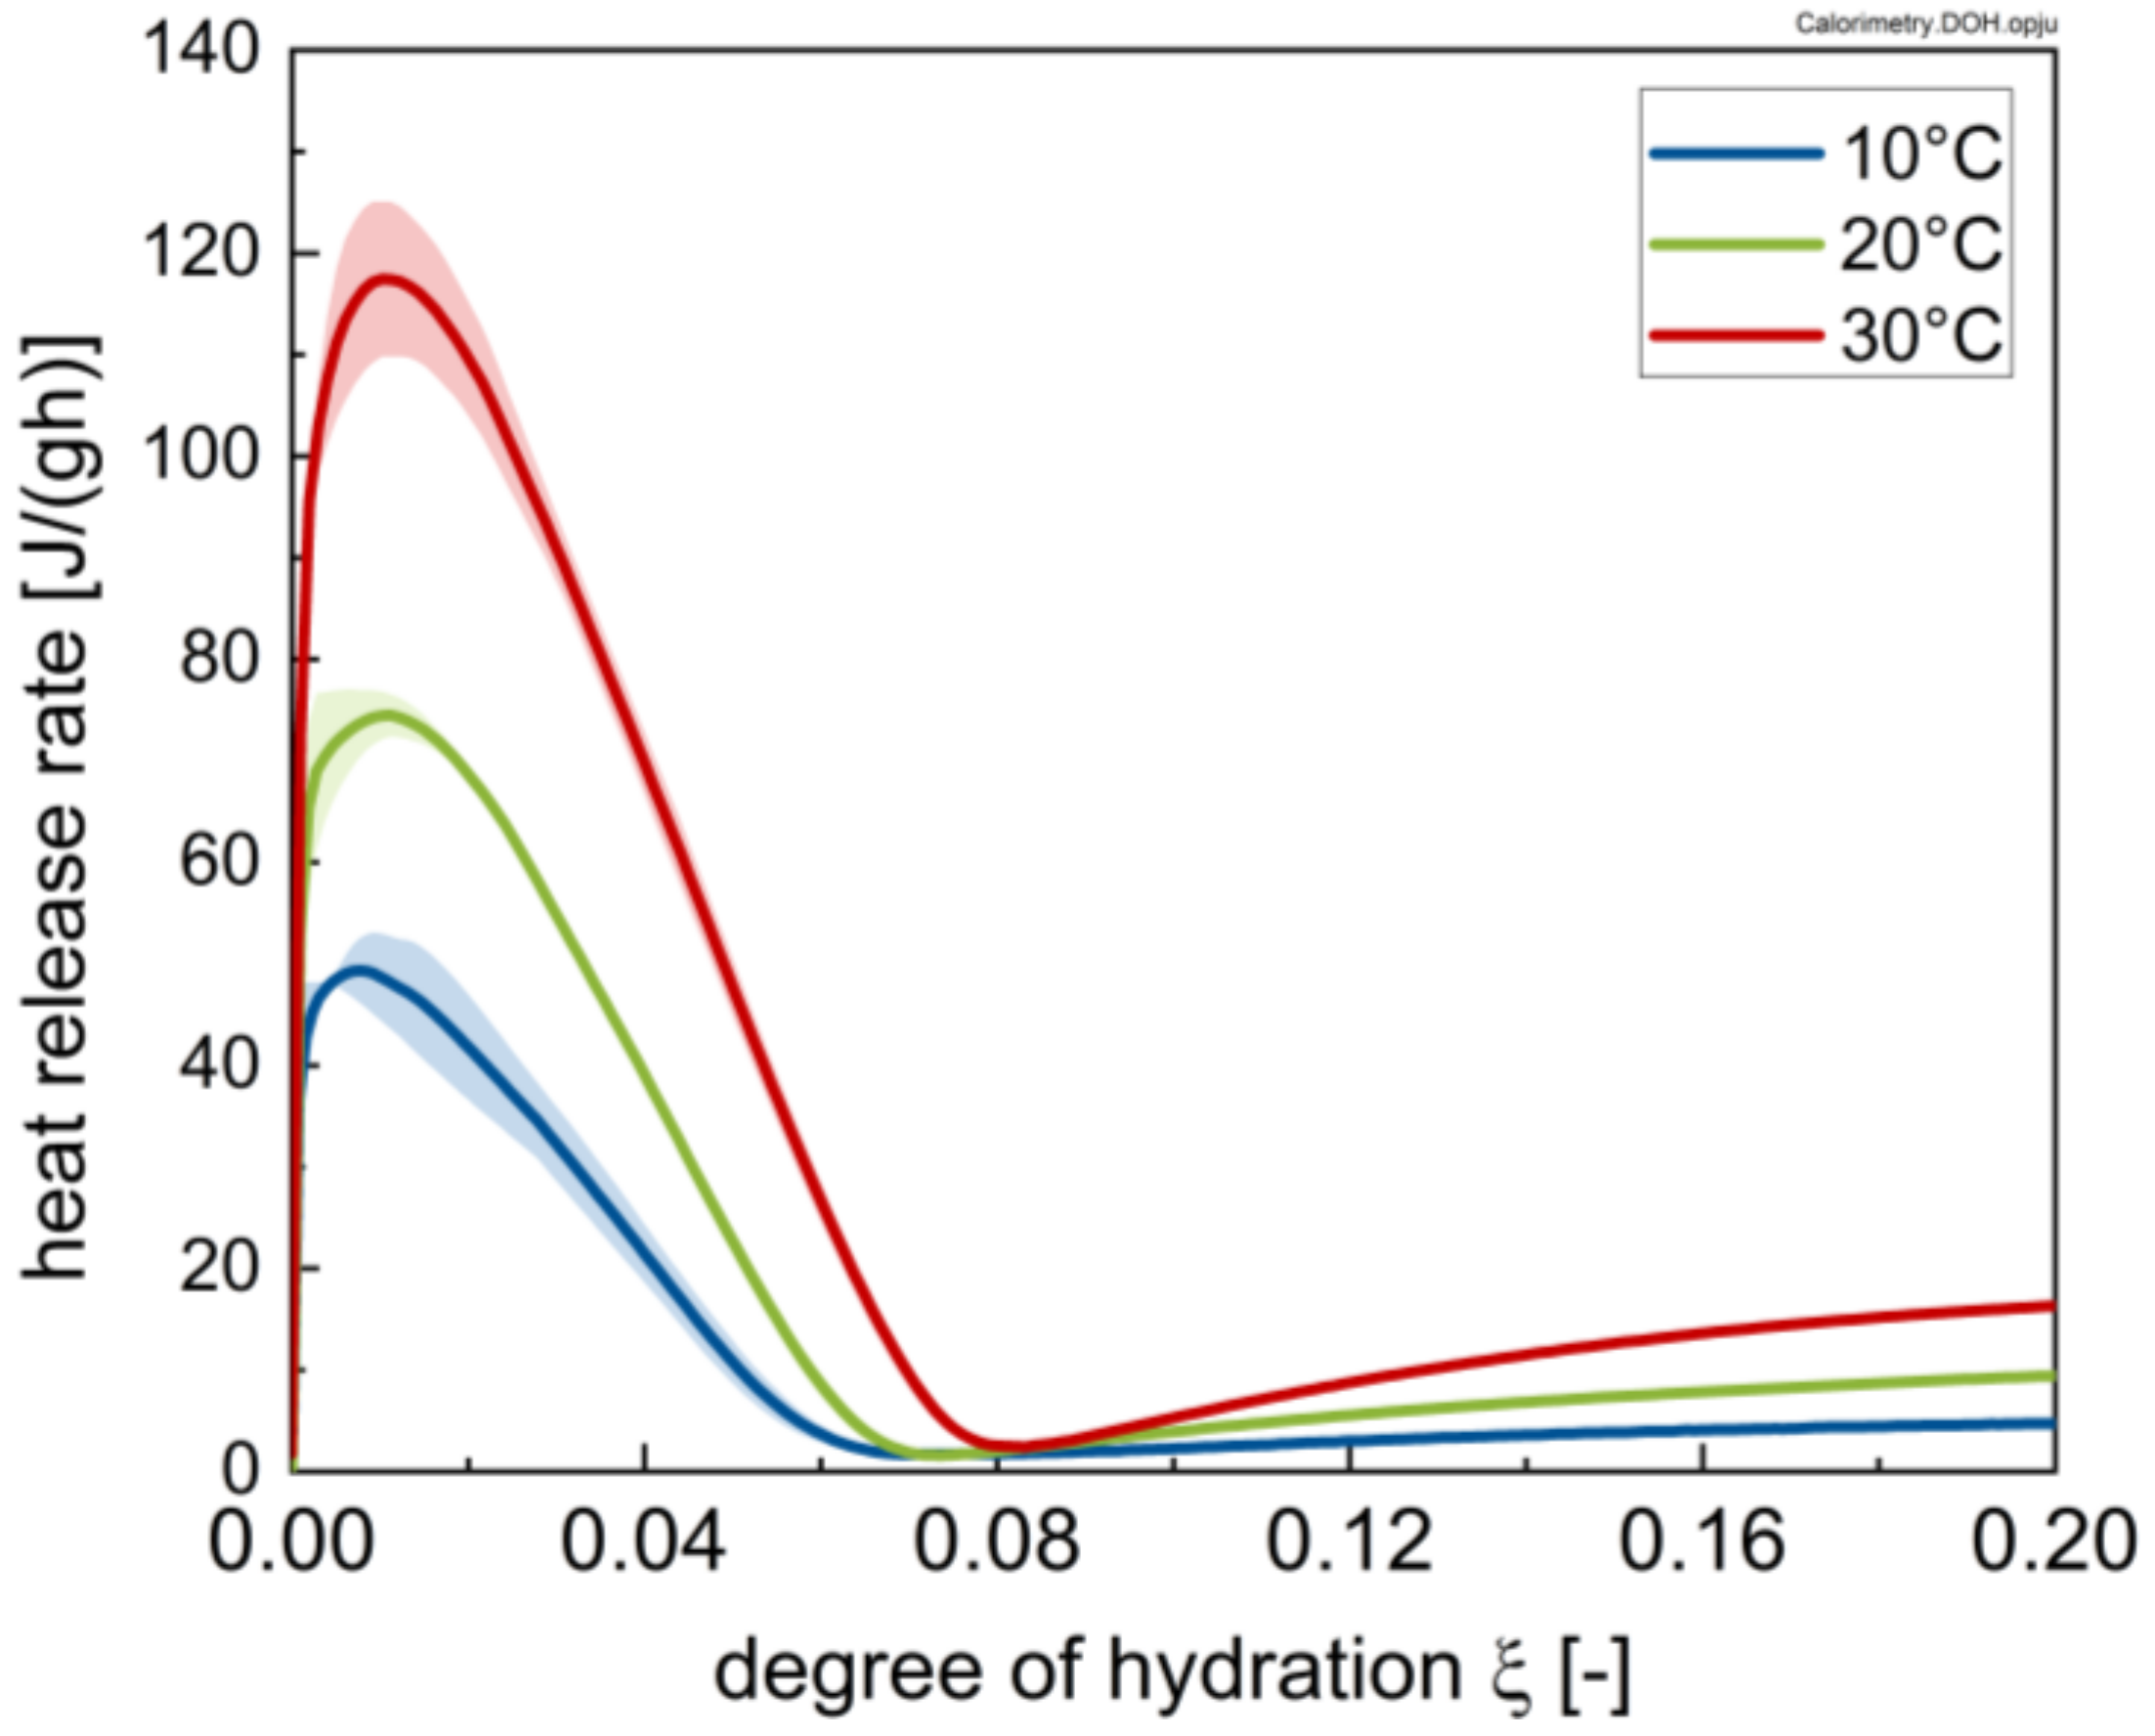
- The rheological properties show an approximated bi-linear dependency on the degree of hydration. For all measured samples and temperatures, the rheological parameters remain constant or show the previously described minimum up to apparent degrees of hydration of approximately 0.07. Beyond this value, a pronounced increase in the rheological parameters can be observed. From a comparison with the calorimetric data, this increase can be clearly linked to the beginning of the main period of alite hydration with the precipitation of CH and C-S-H. A contribution from ettringite to the change in rheology is likely, but cannot be considered as a major driving force for the stiffening of the paste.
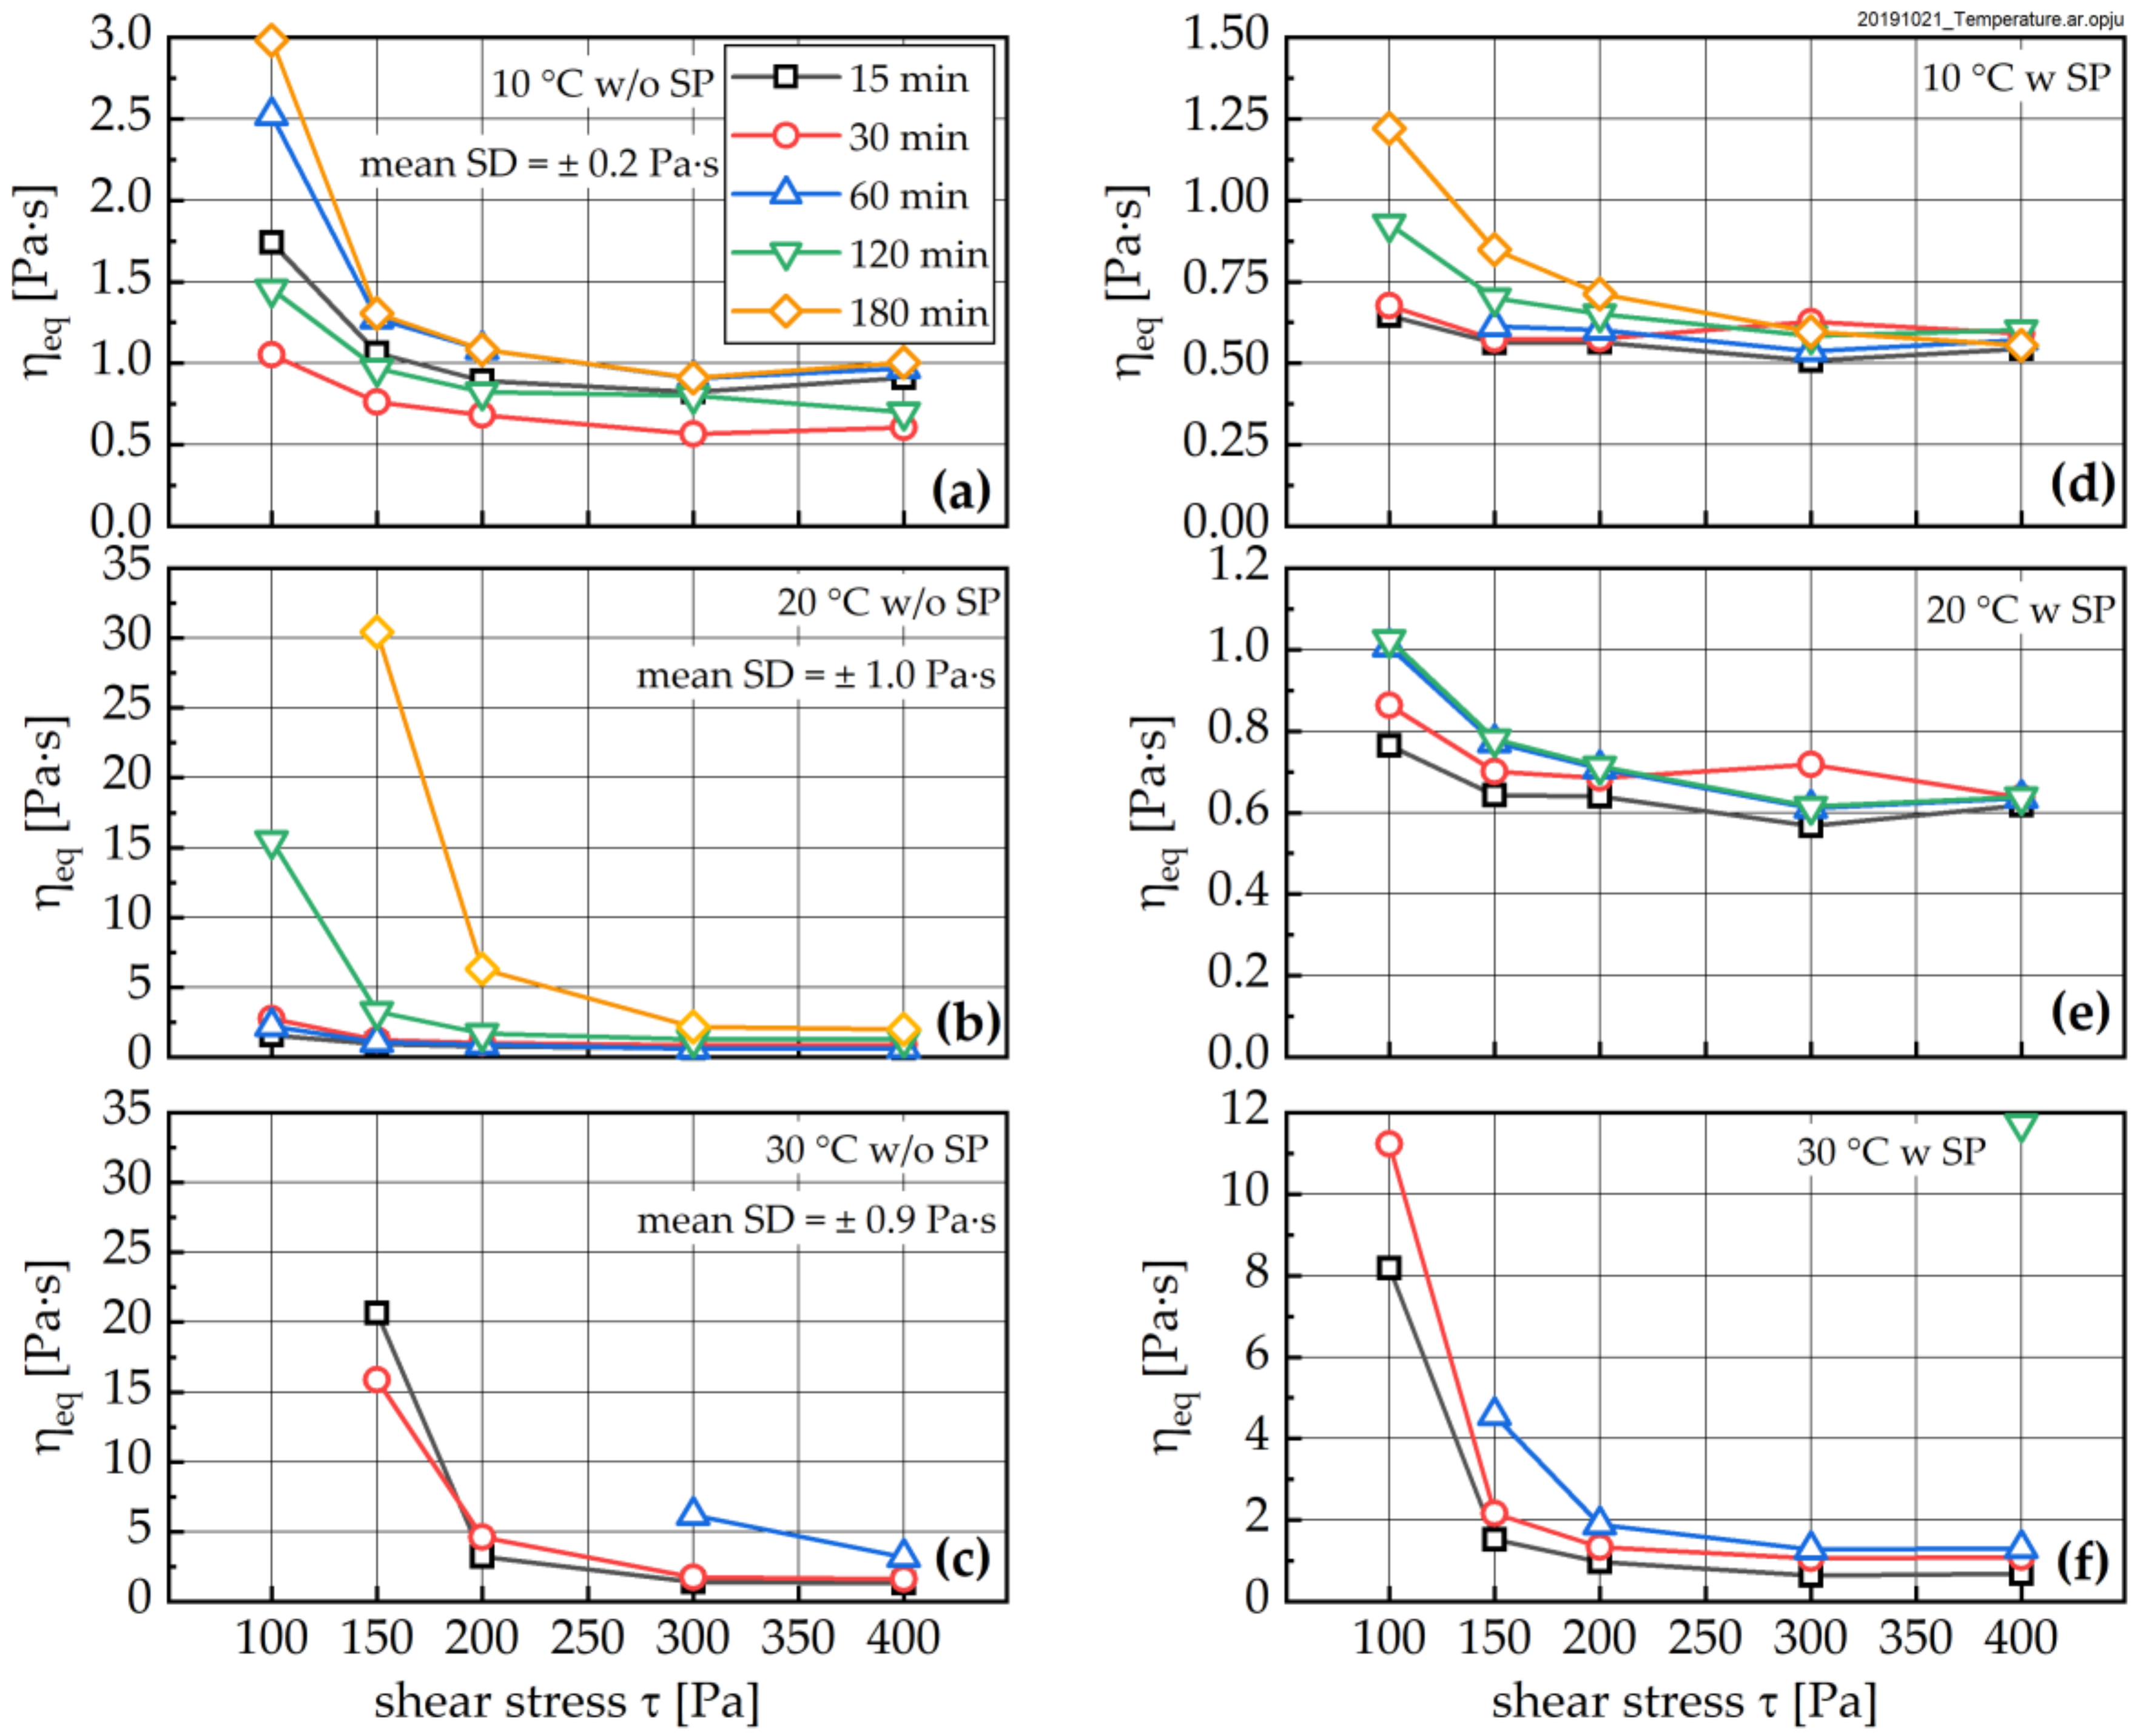
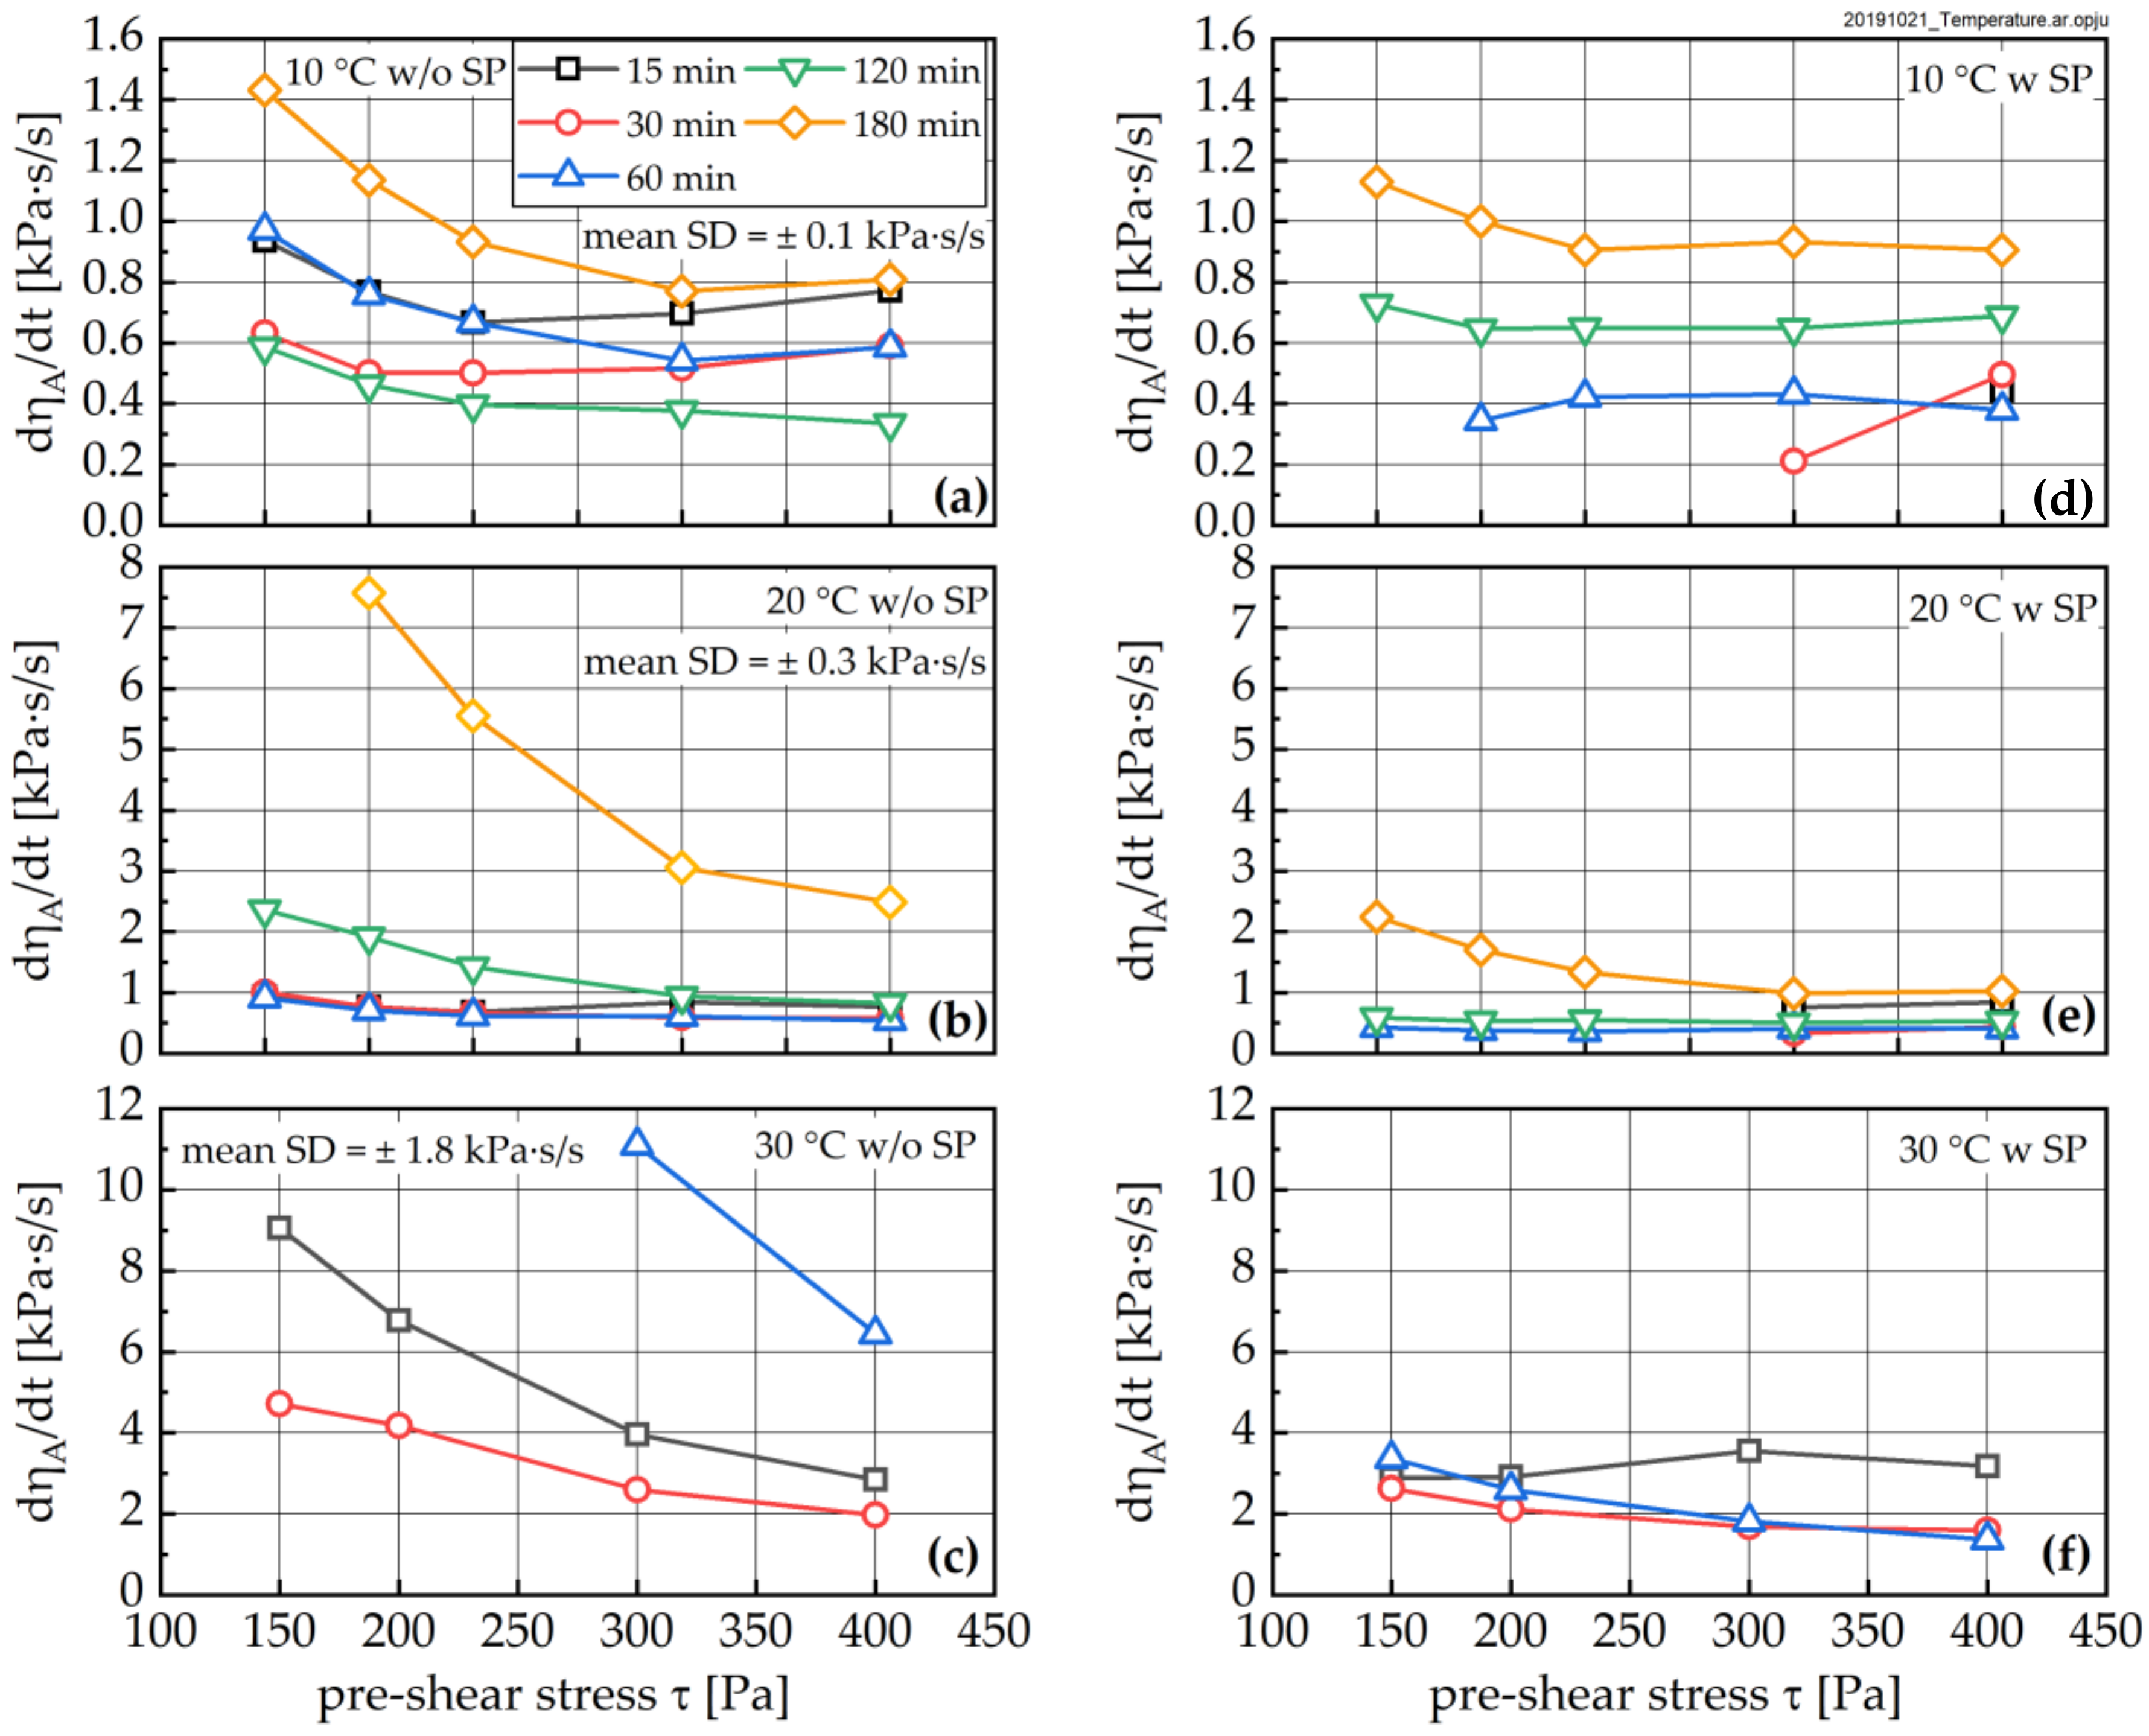
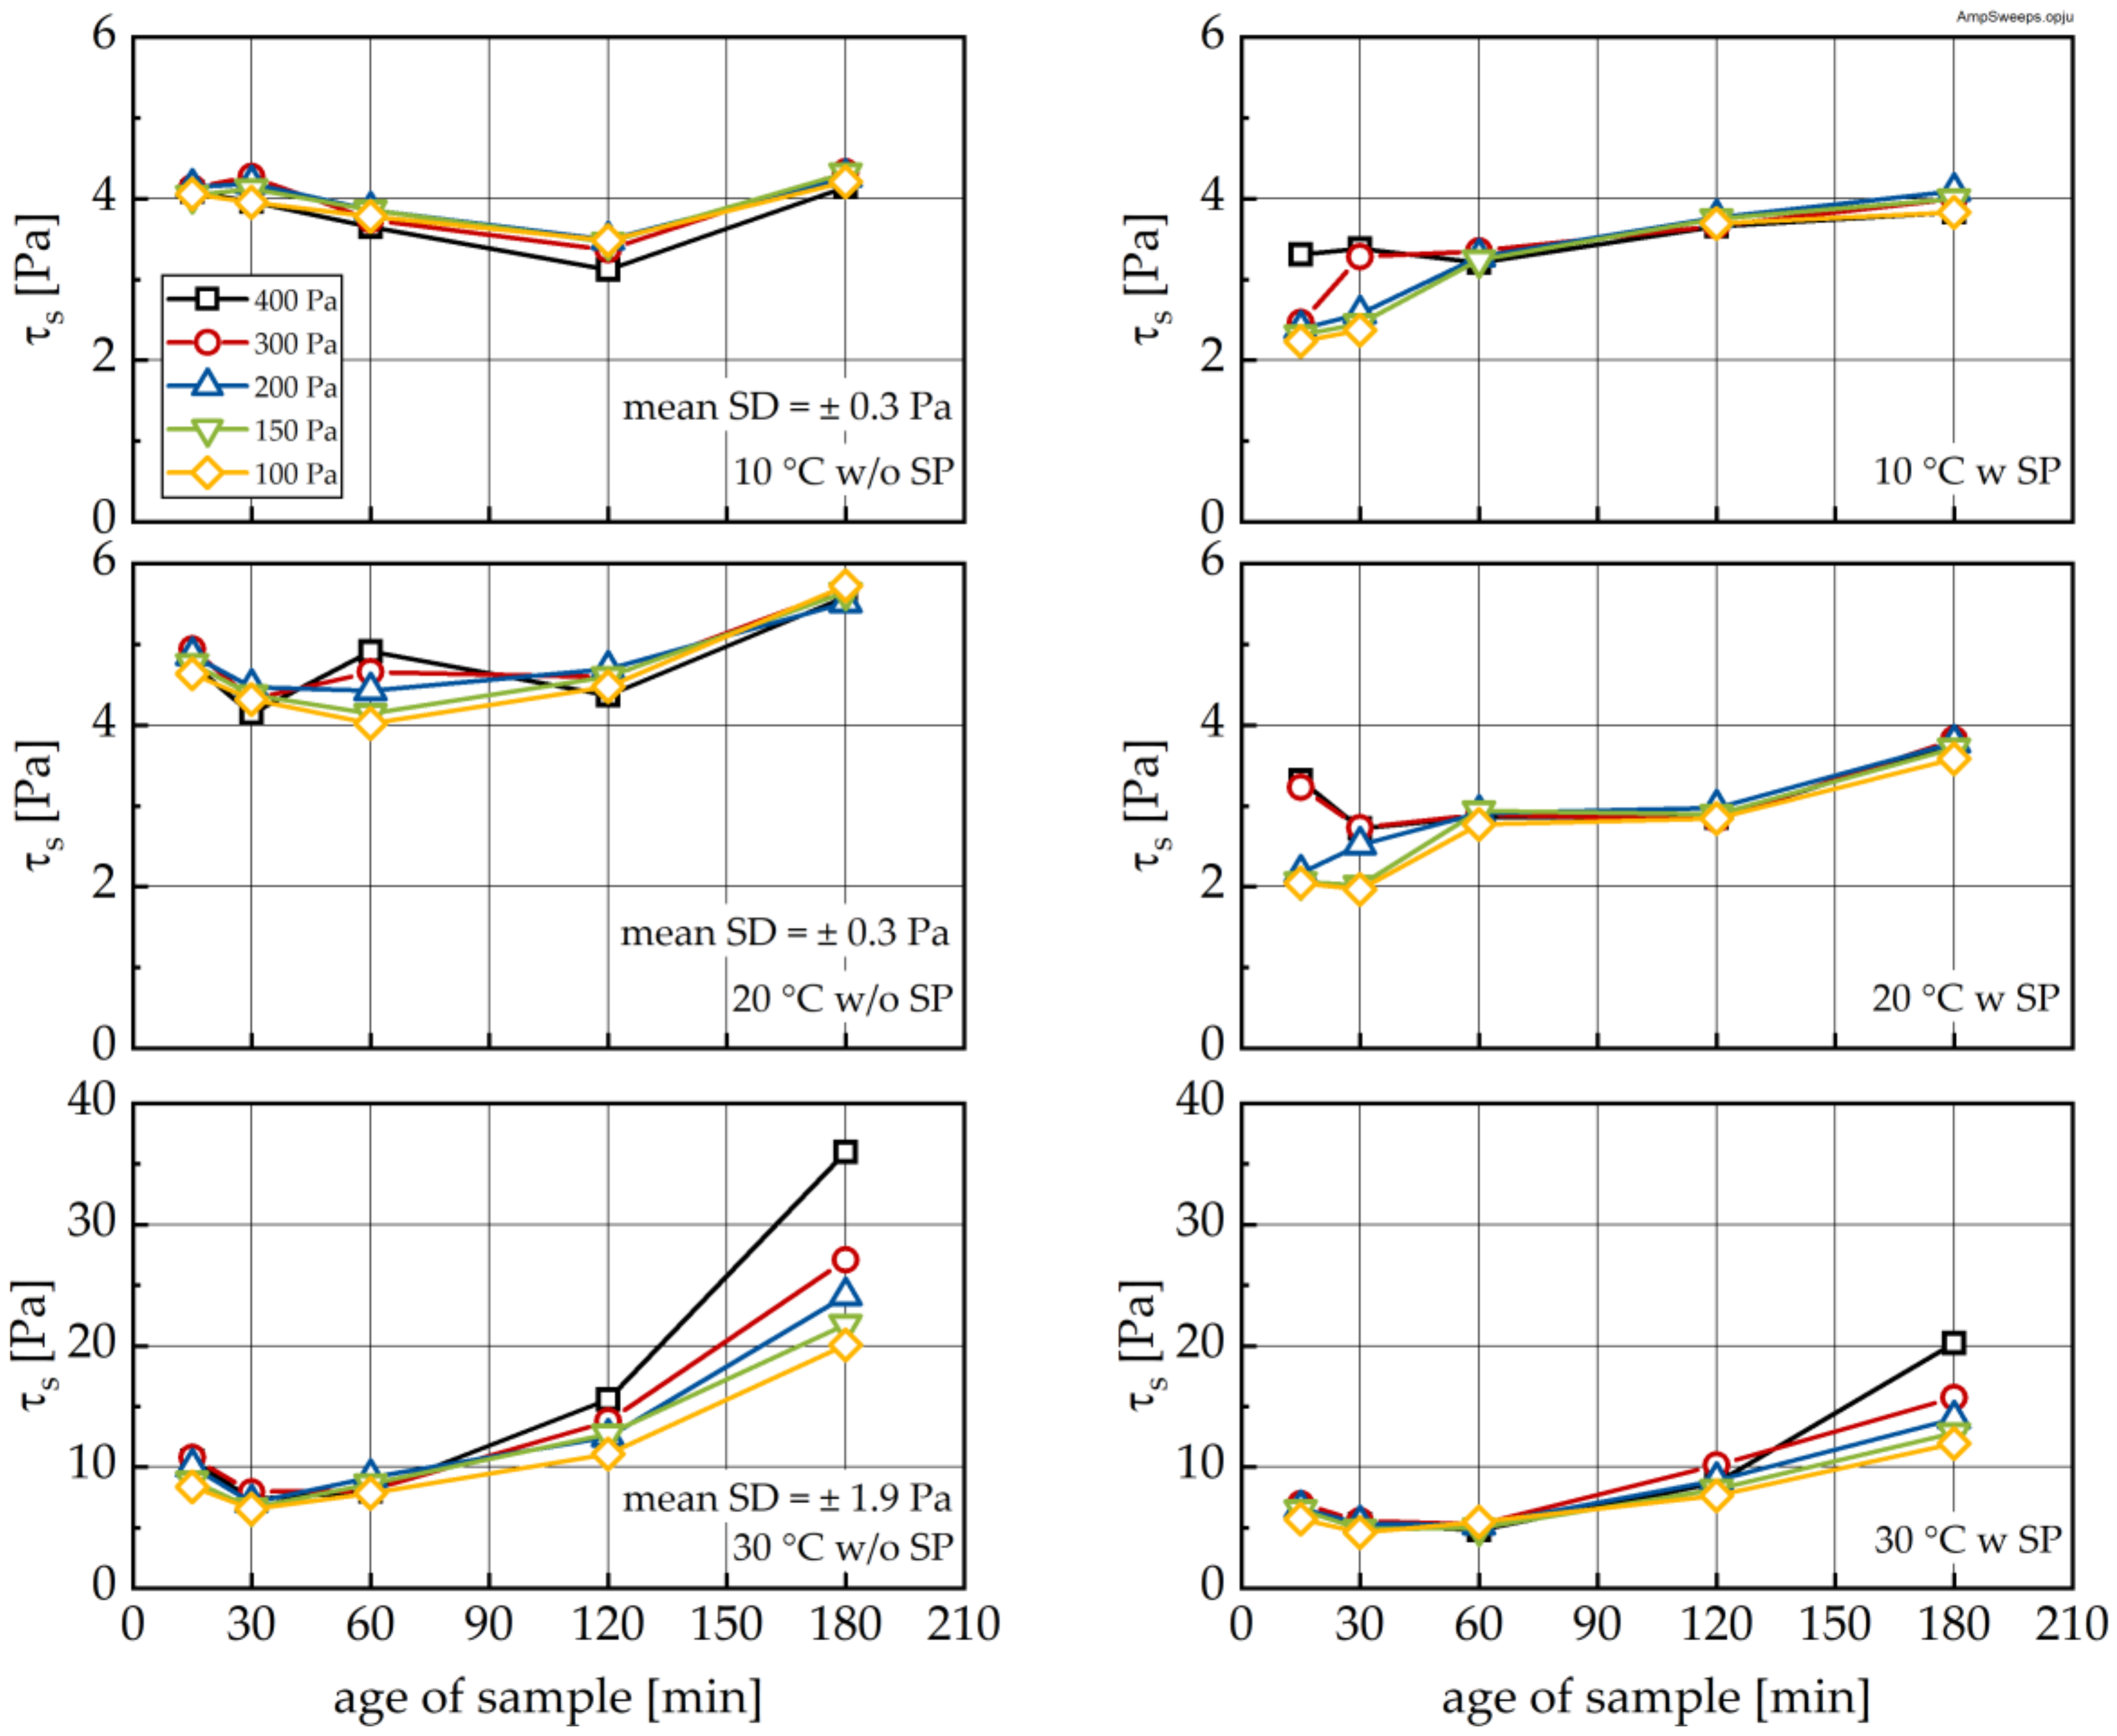
- Fresh cement paste is highly sensitive to the shear history of a given sample. The higher the shear stress the sample was previously exposed to, the lower the structural recovery rate. It should be noted that this relation becomes extremely important for apparent degrees of hydration beyond 0.07, but it is also visible for younger samples. The applied shear stress even has a pronounced influence on the equilibrium dynamic viscosity, which—as expected—decreased with increasing stress. In contrast, the structural limit stress seems to be unaffected by the shear history of the sample for early ages, and only for the 30 °C sample was an effect observed.
Author Contributions
Funding
Acknowledgments
Conflicts of Interest
References
- Banfill, P.F.G. Rheology of fresh cement and concrete. In Rheology Reviews 2006; The British Society of Rheology: Aberystwyth, UK, 2006; pp. 61–130. [Google Scholar]
- Verwey, E.J.W.; Overbeek, J.T.H.G. Theory of the Stability of Lyophobic Colloids; Elsevier: Amsterdam, The Netherlands, 1948. [Google Scholar]
- Haist, M. Zur Rheologie und den physikalischen Wechselwirkungen bei Zementsuspensionen; KIT Scientific Publishing: Karlsruhe, Germany, 2010. [Google Scholar]
- Lowke, D. Sedimentationsverhalten und Robustheit Selbstverdichtender Betone—Optimierung auf Basis der Modellierung der interpartikulären Wechselwirkungen in zementbasierten Suspensionen. Ph.D. Thesis, TU Munich, Munich, Germany, 2013. [Google Scholar]
- Wallevik, J.E. Rheology of particle suspensions: Fresh concrete, mortar and cement paste with various types of lignosulfonates. Ph.D. Thesis, Trondheim University, Trondheim, Norway, 2003. [Google Scholar]
- Powers, T.C. The Properties of Fresh Concrete; J. Wiley & Sons: New York, NY, USA, 1969. [Google Scholar]
- Lura, P.; Friedemann, K.; Stallmach, F.; Mönnig, S.; Wyrzykowski, M.; Sarmento Esteves, L.P. Kinetics of Water Migration in Cement-Based Systems Containing Superabsobent Polymers. In Application of Superabsorbent Polymers (SAP) in Concrete Construction: RILEM State of the Art Reports; Mechtcherine, V., Reinhardt, H.M., Eds.; Springer: Dordrecht, The Netherlands, 2012; pp. 21–37. [Google Scholar]
- Yang, M.; Neubauer, C.M.; Jennings, H.M. Interparticle potential and sedimentation behavior of cement suspensions: Review and results from paste. Adv. Cem. Based Mater. 1997, 5, 1–7. [Google Scholar] [CrossRef]
- Flatt, R.J. Dispersion forces in cement suspensions. Cem. Concr. Res. 2004, 34, 399–408. [Google Scholar] [CrossRef]
- Flatt, R.J.; Bowen, P.; Siebold, A.; Houst, Y.F. Cement Model Powder for Superplasticizer Properties Studies. In Proceedings of the 11th International Conference on the Chemistry of Cement, Durban, South Africa, 11–16 May 2003; pp. 676–685. [Google Scholar]
- Roussel, N. A thixotropy model for fresh fluid concretes: Theory, validation and applications. Cem. Concr. Res. 2006, 33, 1797–1806. [Google Scholar] [CrossRef]
- Roussel, N.; Ovarlez, G.; Garrault, S.; Brumaud, C. The origins of thixotropy of fresh cement pastes. Cem. Concr. Res. 2012, 42, 148–157. [Google Scholar] [CrossRef]
- Bogner, A.; Link, J.; Baum, M.; Mahlbacher, M.; Gil-Diaz, T.; Lützenkirchen, J.; Sowoidnich, T.; Heberling, F.; Schäfer, T.; Ludwig, H.M.; et al. Early hydration and microstructure formation of Portland cement paste studied by oscillation rheology, isothermal calorimetry, 1H NMR relaxometry, conductance and SAXS. Cem. Concr. Res. 2020, 130. [Google Scholar] [CrossRef]
- Gebauer, J. Technological possibilities of avoiding the early setting of cement. Zement-Kalk-Gips 1978, 31, 302–304. [Google Scholar]
- Nonat, A.; Mutin, J.C.; Lecoq, X.; Jiang, S.P. Physico-chemical parameters determining hydration and particle interactions during the setting of silicate cements. Solid State Ionics 1997, 101–103, 923–930. [Google Scholar] [CrossRef]
- Barnes, P.; Bensted, J. Structure and Performance of Cements, 2nd ed.; Taylor & Francis Group: London, UK, 2002. [Google Scholar]
- Jakob, C.; Jansen, D.; Ukrainczyk, N.; Koenders, E.; Pott, U.; Stephan, D.; Neubauer, J. Relating ettringite formation and rheological changes during the initial cement hydration: A comparative study applying XRD analysis, rheological measurements and modelling. Materials 2019, 12, 2957. [Google Scholar] [CrossRef] [PubMed]
- Uchikawa, H.; Ogawa, K.; Uchida, S. Influence of character of clinker on the early hydration process and rheological property of cement paste. Cem. Concr. Res. 1985, 15, 561–572. [Google Scholar] [CrossRef]
- Rößler, C.; Eberhardt, A.; Kučerová, H.; Möser, B. Influence of hydration on the fluidity of normal Portland cement pastes. Cem. Concr. Res. 2008, 38, 897–906. [Google Scholar] [CrossRef]
- German Institute for Standardization. DIN EN 197-1: Cement, Part 1, Composition, Specifications and Conformity Criteria for Common Cement; German Institute for Standardization: Berlin, Germany, 2011. [Google Scholar]
- Lu, Z.C.; Haist, M.; Ivanov, D.; Jakob, C.; Jansen, D.; Leinitz, S.; Link, J.; Mechtcherine, V.; Neubauer, J.; Plank, J.; et al. Characterization data of reference cement CEM I 42.5 R used for priority program DFG SPP 2005 “Opus Fluidum Futurum—Rheology of reactive, multiscale, multiphase construction materials”. Data Brief 2019, 27, 104699. [Google Scholar] [CrossRef] [PubMed]
- DIN German Institute for Standardization. DIN EN ISO 2811-1: Paints and Varnishes—Determination of Density—Part 1: Pycnometer Method; Beuth: Berlin, Germany, 2016. [Google Scholar]
- DIN German Institute for Standardization. DIN EN 196-1: Methods of Testing Cement—Part 1: Determination of Strength; Beuth: Berlin, Germany, 2016. [Google Scholar]
- Haist, M.; Link, J.; Nicia, D.; Leinitz, S.; Baumert, C.; von Bronk, T.; Cotardo, D.; Pirharati, M.E.; Fataei, S.; Garrecht, H.; et al. Interlaboratory study on rheological properties of cement pastes and reference substances—Comparability of measurements performed with different rheometers and measurement geometries. Mater. Struct. 2020. [Google Scholar]
- DIN German Institute for Standardization. DIN EN 1015-3: Methods for Test for Mortar for Masonry—Part 3: Determination of Consistance of Fresh Mortar (by Flow Table); Beuth: Berlin, Germany, 1999. [Google Scholar]
- Lothenbach, B.; Kulik, D.A.; Matschei, T.; Balonis, M.; Baquerizo, L.; Dilnesa, B.; Miron, G.D.; Myers, R.J. Cemdata18: A chemical thermodynamic database for hydrated Portland cements and alkali-activated materials. Cem. Concr. Res. 2019, 115, 472–506. [Google Scholar] [CrossRef]
- Lothenbach, B.; Matschei, T.; Möschner, G.; Glasser, F.P. Thermodynamic modelling of the effect of temperature on the hydration and porosity of Portland cement. Cem. Concr. Res. 2008, 38, 1–18. [Google Scholar] [CrossRef]
- Bullard, J.W.; Scherer, G.W. An Ideal Solid Solution Model for C–S–H. J. Am. Ceram. Soc. 2016, 99, 4137–4145. [Google Scholar] [CrossRef] [PubMed]
- Sowoidnich, T.; Bellmann, F.; Damidot, D.; Ludwig, H.-M. New insights into tricalcium silicate hydration in paste. J. Am. Ceram. Soc. 2019, 102, 2965–2976. [Google Scholar] [CrossRef]
- Taylor, H.F.W. Cement Chemistry; Thomas Telford: London, UK, 1997. [Google Scholar]
- Lerch, W. The influence of gypsum on the hydration and properties of Portland cement pastes. Am. Soc. Test. Mater. 1946, 46. [Google Scholar]
- Rodger, S.A.; Groves, G.W.; Clayden, N.J.; Dobson, C.M. Hydration of Tricalcium Silicate Followed by 29Si NMR with Cross-Polarization. J. Am. Ceram. Soc. 2005, 71, 91–96. [Google Scholar] [CrossRef]
- Bellmann, F.; Damidot, D.; Möser, B.; Skibsted, J. Improved evidence for the existence of an intermediate phase during hydration of tricalcium silicate. Cem. Concr. Res. 2010, 40, 875–884. [Google Scholar] [CrossRef]


| Procedure | Mixing Intensity | Duration (s) |
|---|---|---|
| Homogenization of dry mixture | Level 1 | 60 |
| Addition of water and mixing process | Level 1 | 60 |
| Rest phase and manual return of caking material | – | 90 |
| Addition of SP and mixing process | Level 2 | 60 |
| Rest phase and manual return of caking material | – | 30 |
| Mixing process | Level 2 | 120 |
© 2020 by the authors. Licensee MDPI, Basel, Switzerland. This article is an open access article distributed under the terms and conditions of the Creative Commons Attribution (CC BY) license (http://creativecommons.org/licenses/by/4.0/).
Share and Cite
Link, J.; Sowoidnich, T.; Pfitzner, C.; Gil-Diaz, T.; Heberling, F.; Lützenkirchen, J.; Schäfer, T.; Ludwig, H.-M.; Haist, M. The Influences of Cement Hydration and Temperature on the Thixotropy of Cement Paste. Materials 2020, 13, 1853. https://doi.org/10.3390/ma13081853
Link J, Sowoidnich T, Pfitzner C, Gil-Diaz T, Heberling F, Lützenkirchen J, Schäfer T, Ludwig H-M, Haist M. The Influences of Cement Hydration and Temperature on the Thixotropy of Cement Paste. Materials. 2020; 13(8):1853. https://doi.org/10.3390/ma13081853
Chicago/Turabian StyleLink, Julian, Thomas Sowoidnich, Christopher Pfitzner, Teba Gil-Diaz, Frank Heberling, Johannes Lützenkirchen, Thorsten Schäfer, Horst-Michael Ludwig, and Michael Haist. 2020. "The Influences of Cement Hydration and Temperature on the Thixotropy of Cement Paste" Materials 13, no. 8: 1853. https://doi.org/10.3390/ma13081853
APA StyleLink, J., Sowoidnich, T., Pfitzner, C., Gil-Diaz, T., Heberling, F., Lützenkirchen, J., Schäfer, T., Ludwig, H.-M., & Haist, M. (2020). The Influences of Cement Hydration and Temperature on the Thixotropy of Cement Paste. Materials, 13(8), 1853. https://doi.org/10.3390/ma13081853