Iron Oxide and Iron Sulfide Films Prepared for Dye-Sensitized Solar Cells


Abstract
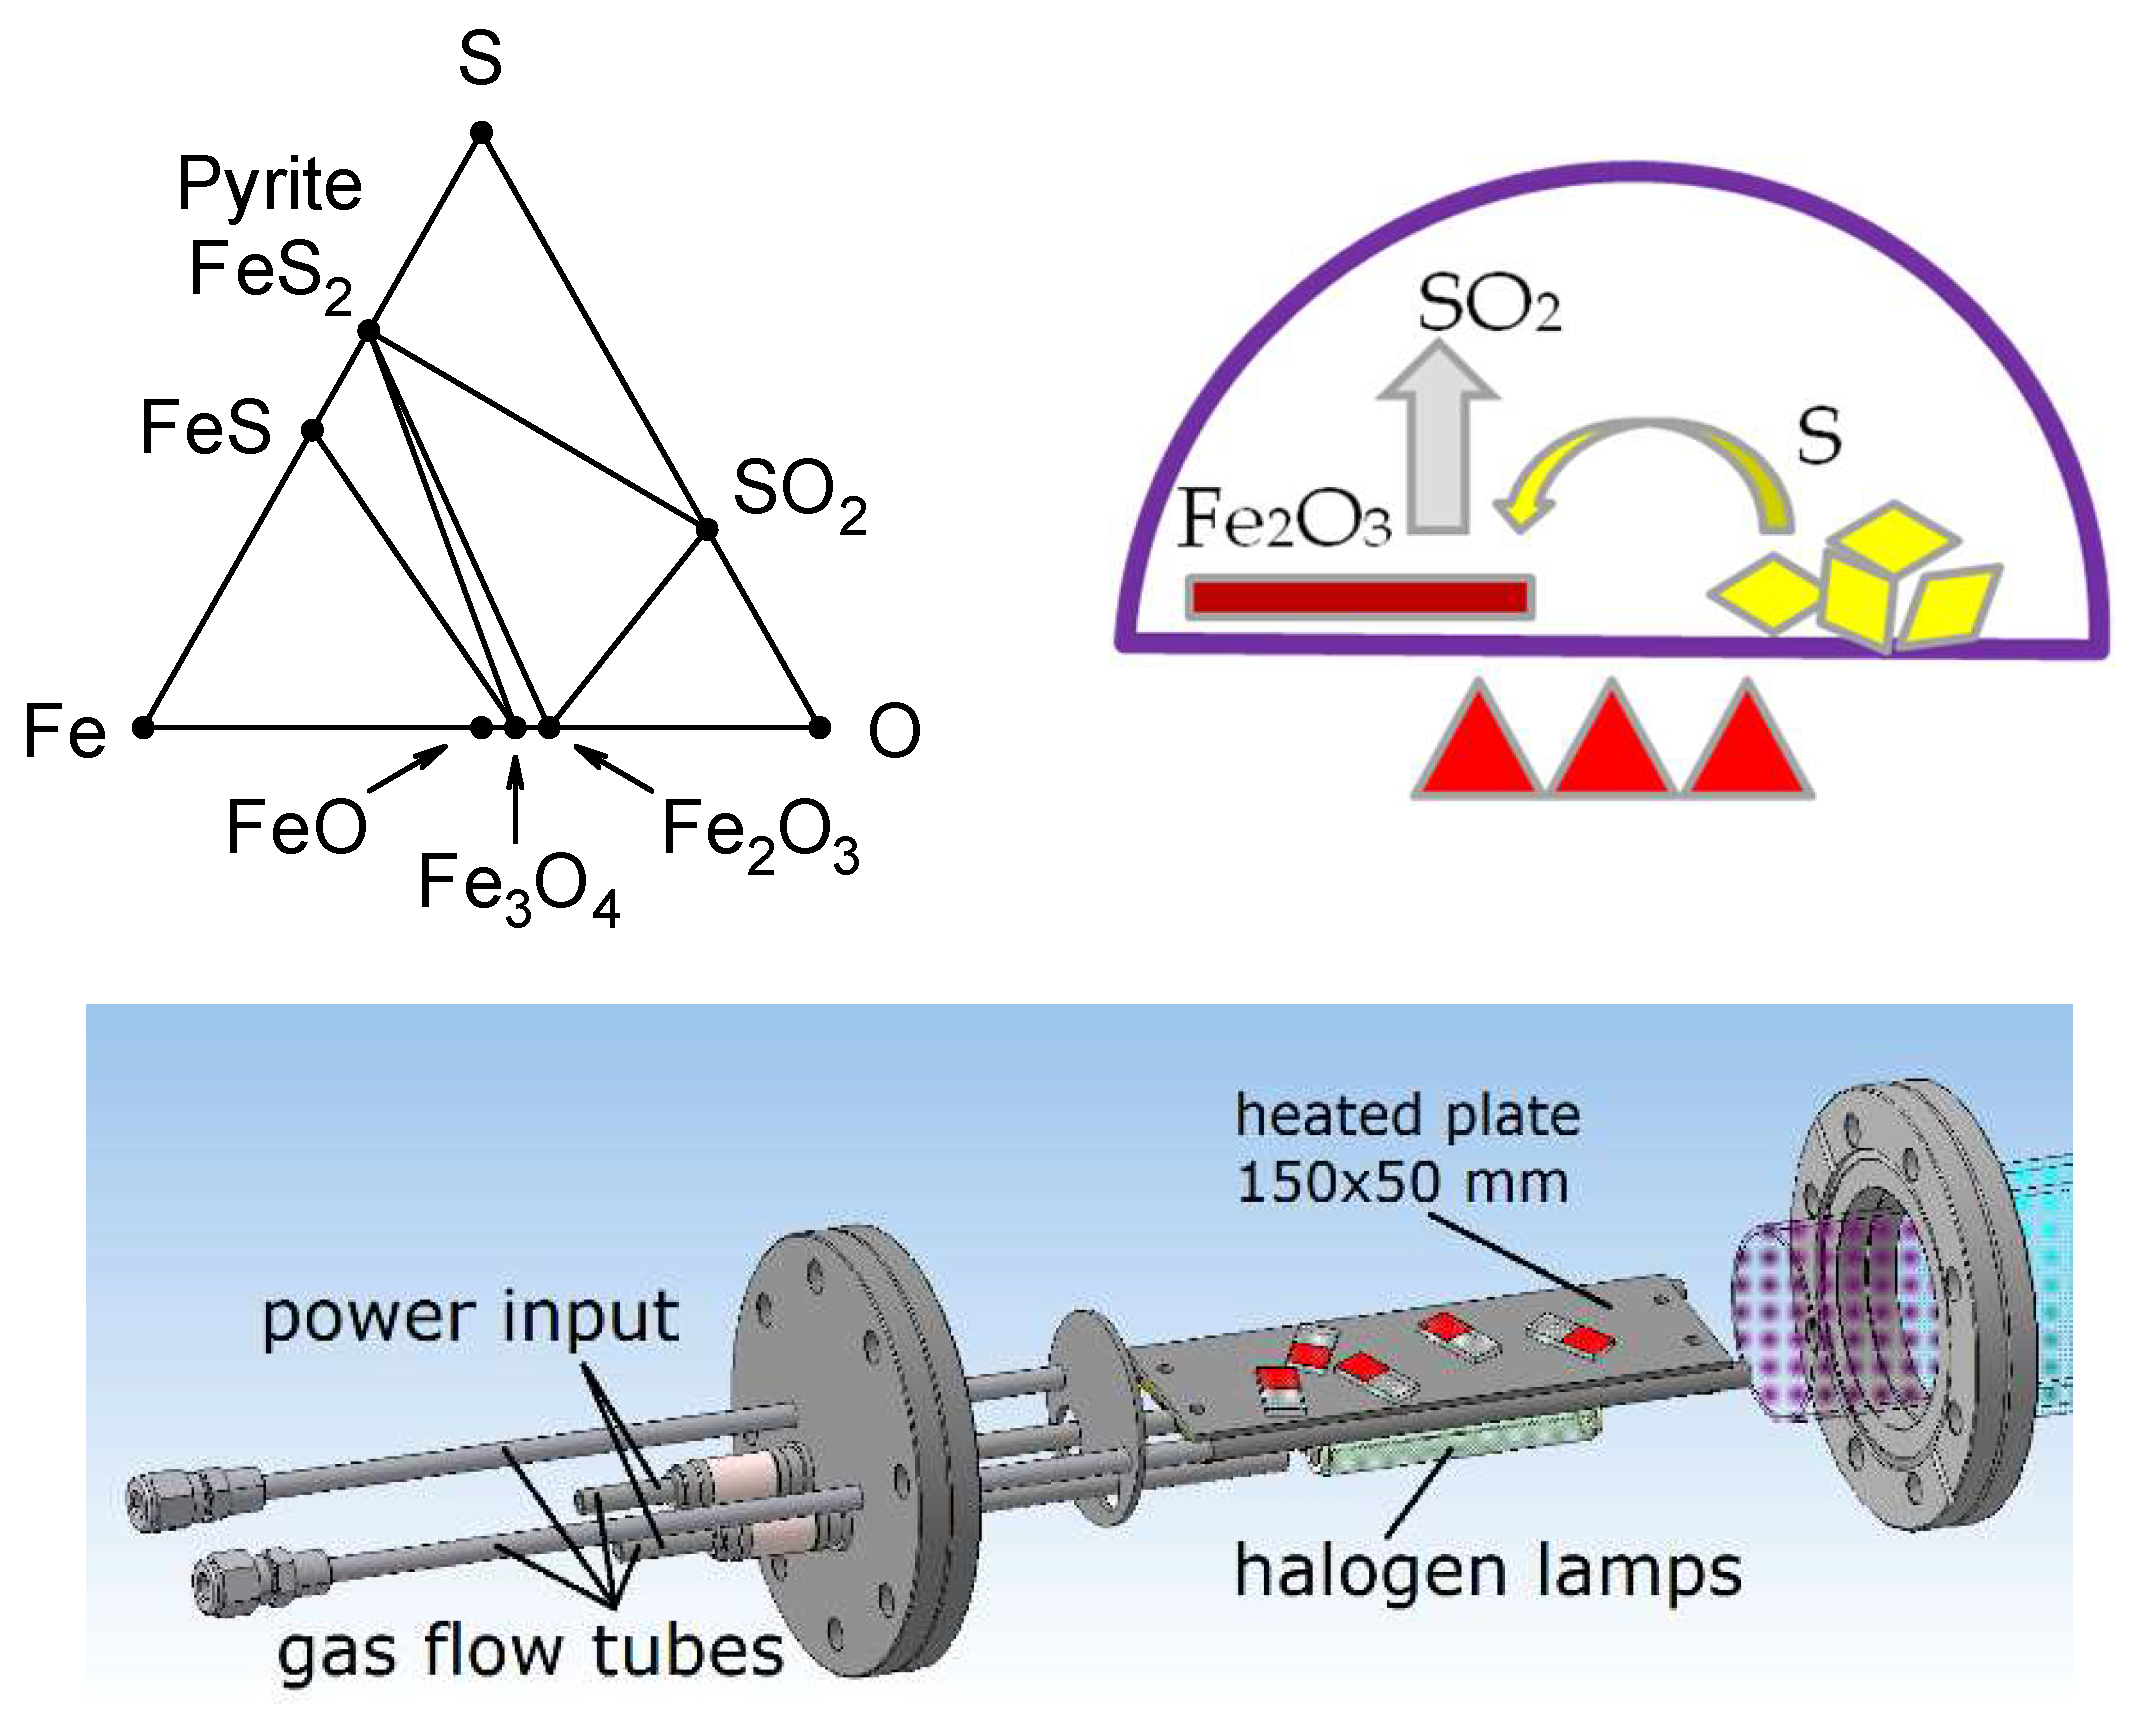
1. Introduction
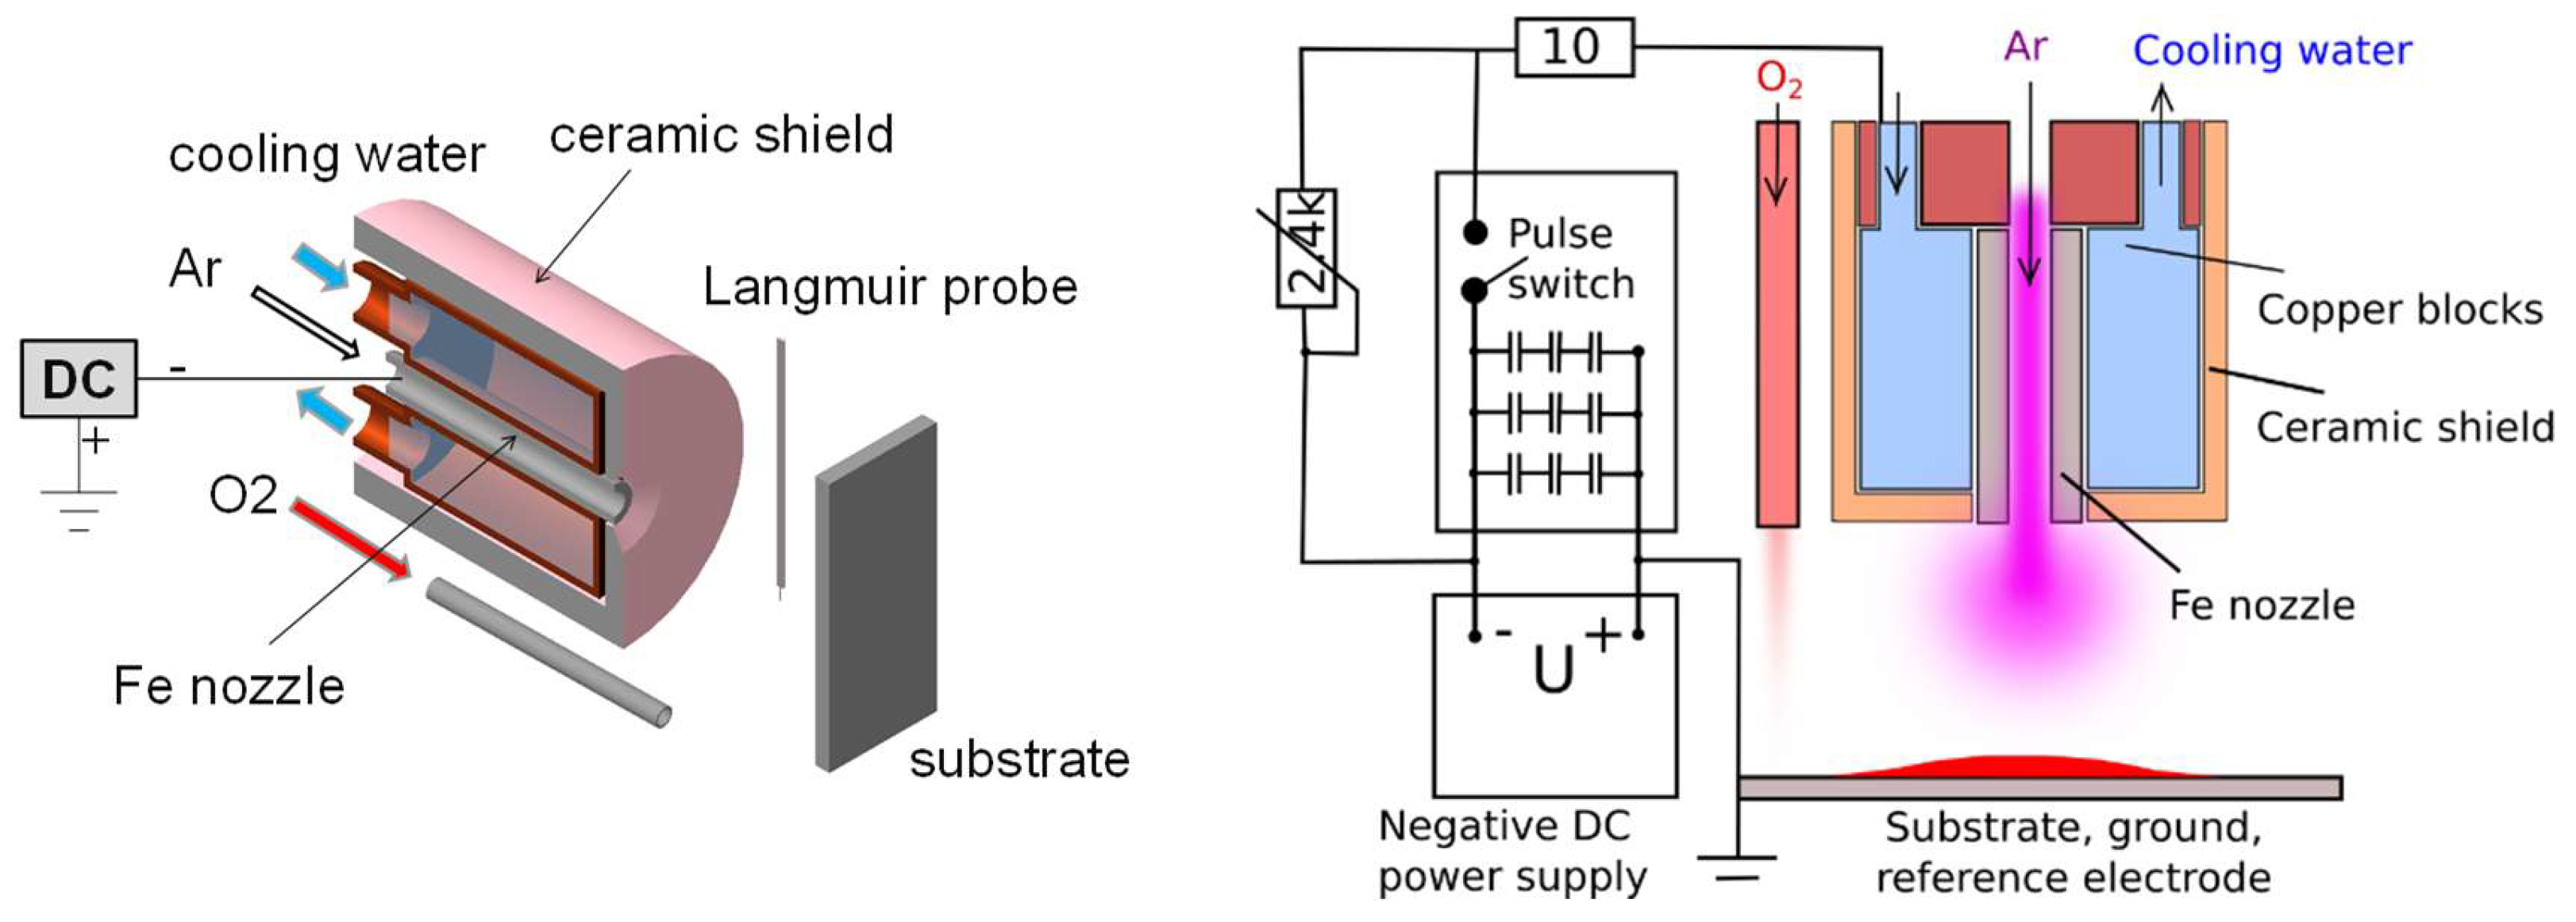
2. Experimental Setup
3. Results and Discussion
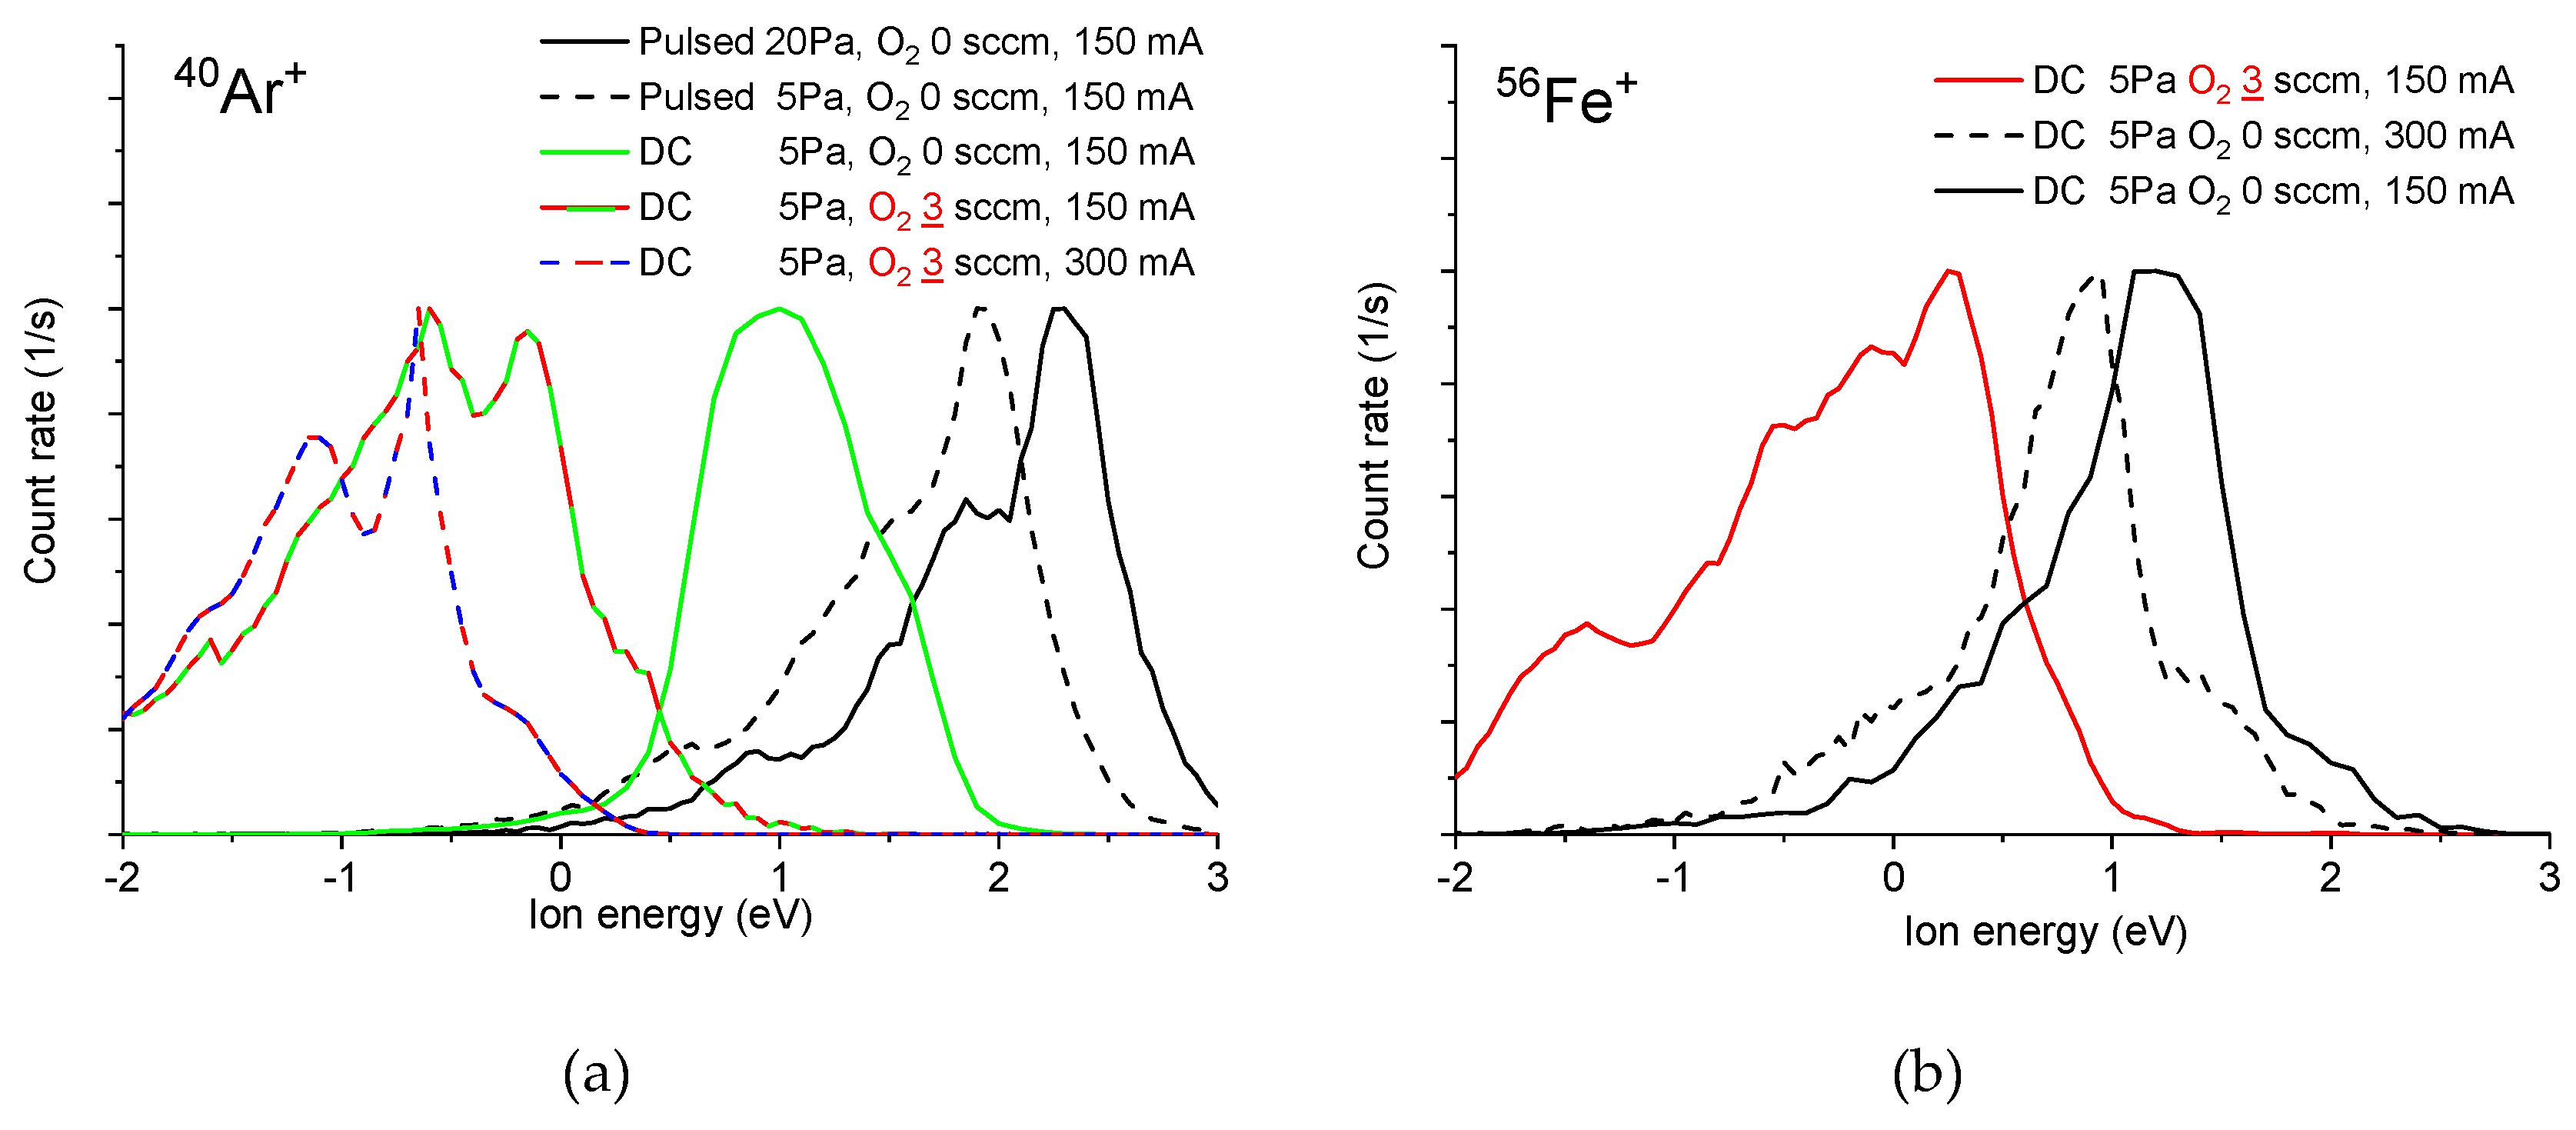
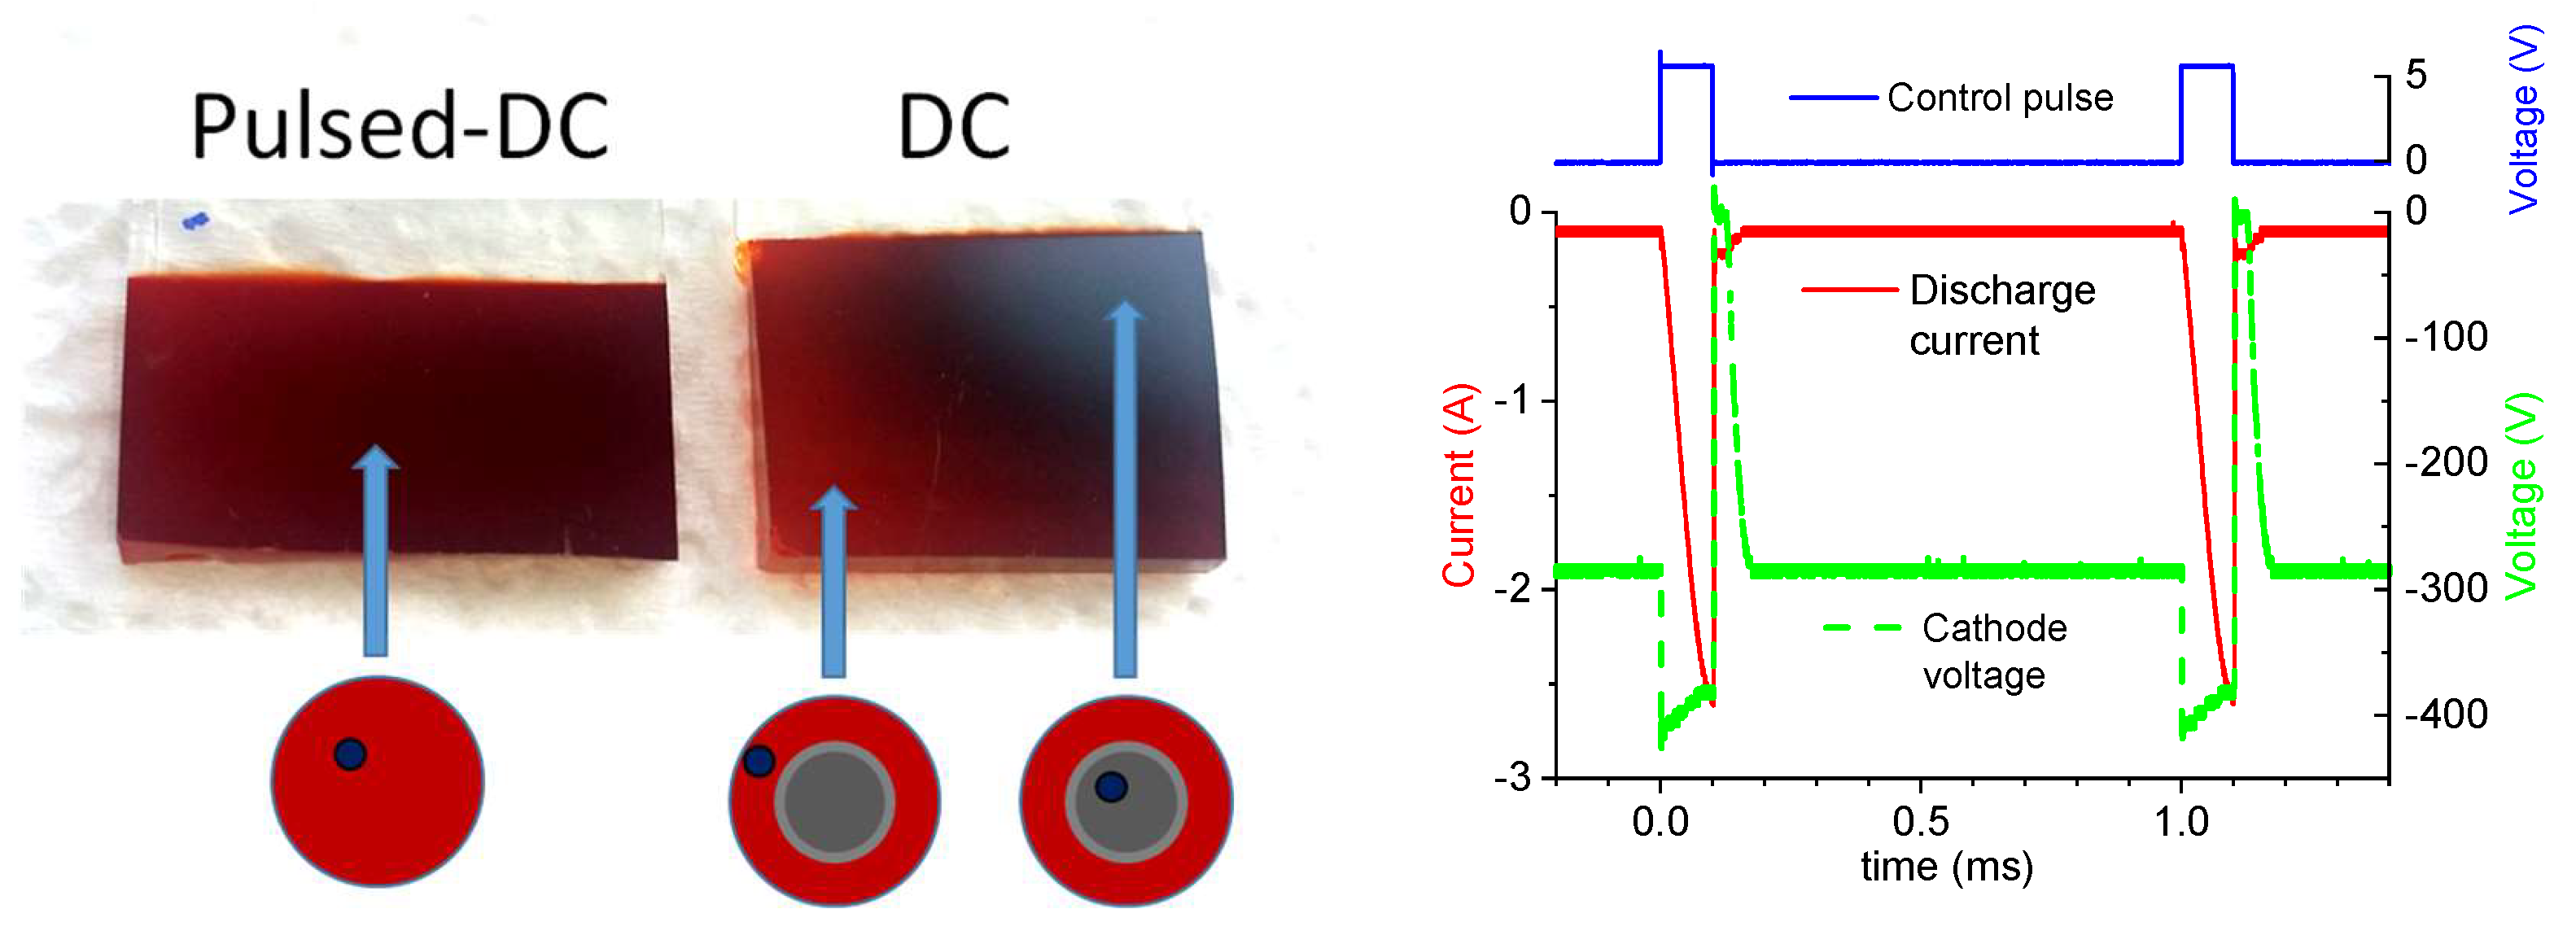
3.1. Mass Spectrometric Diagnostics
3.2. Thin Film Properties
4. Conclusions
Author Contributions
Funding
Conflicts of Interest
References
- Wang, D.-Y.; Li, C.-H.; Li, S.-S.; Kuo, T.-R.; Tsai, C.-M.; Chen, T.-R.; Wang, Y.-C.; Chen, C.-W.; Chen, C.-C. Iron Pyrite/Titanium Dioxide Photoanode for Extended Near Infrared Light Harvesting in a Photoelectrochemical Cell. Sci. Rep. 2016, 6, 20397. [Google Scholar] [CrossRef] [PubMed]
- Shukla, S.; Loc, N.H.; Boix, P.P.; Koh, T.M.; Prabhakar, R.R.; Mulmudi, H.K.; Zhang, J.; Chen, S.; Ng, C.F.; Huan, C.H.A.; et al. Iron pyrite thin film counter electrodes for dye-sensitized solar cells: High efficiency for iodine and cobalt redox electrolyte cells. ACS Nano 2014, 8, 10597–10605. [Google Scholar] [CrossRef] [PubMed]
- Xia, C.; Jia, Y.; Tao, M.; Zhang, Q. Tuning the band gap of hematite α-Fe2O3 by sulfur doping. Phys. Lett. Sect. A Gen. At. Solid State Phys. 2013, 377, 1943–1947. [Google Scholar] [CrossRef]
- Shi, X.; Tian, A.; Xue, X.; Yang, H.; Xu, Q. Synthesis of FeS2 (pyrite) nanotube through sulfuration of Fe2O3 nanotube. Mater. Lett. 2014, 2, 1–4. [Google Scholar] [CrossRef]
- Botchway, E.A.; Ampong, F.K.; Nkrumah, I.; Boakye, F.K.; Nkum, R.K. Growth of a Pure and Single Phase Iron Sulfide (Pyrite) Thin Film by Electrochemical Deposition for Photovoltaic Applications. Open J. Appl. Sci. 2019, 09, 725–735. [Google Scholar] [CrossRef]
- Ennaoui, A.; Fiechter, S.; Pettenkofer, C.; Alonsovante, N.; Buker, K.; Bronold, M.; Hopfner, C.; Tributsch, H. Iron Disulfide for Solar-Energy Conversion. Sol. Energy Mater. Sol. Cells 1993, 29, 289–370. [Google Scholar] [CrossRef]
- von Goldbeck, O.K. IRON—Binary Phase Diagrams; Springer: Berlin/Heidelberg, Germany, 1982; Volume 46, ISBN 978-3-662-08026-9. [Google Scholar]
- Kment, S.; Kmentova, H.; Sarkar, A.; Soukup, R.J.; Ianno, N.J.; Sekora, D.; Olejnicek, J.; Ksirova, P.; Krysa, J.; Remes, Z.; et al. Epoxy catalyzed sol-gel method for pinhole-free pyrite FeS2 thin films. J. Alloys Compd. 2014, 607, 169–176. [Google Scholar] [CrossRef]
- Hubička, Z.; Kment, Š.; Olejníček, J.; Čada, M.; Kubart, T.; Brunclíková, M.; Kšírová, P.; Adámek, P.; Remeš, Z. Deposition of hematite Fe2O3 thin film by DC pulsed magnetron and DC pulsed hollow cathode sputtering system. Thin Solid Films 2013, 549, 184–191. [Google Scholar] [CrossRef]
- Kolobov, V.I.; Tsendin, L.D. Analytic model of the hollow cathode effect. Plasma Sources Sci. Technol. 1995, 4, 551–560. [Google Scholar] [CrossRef]
- Kudrna, P.; Klusoň, J.; Leshkov, S.; Chichina, M.; Picková, I.; Hubička, Z.; Tichý, M. A study of plasma parameters in hollow cathode plasma jet in pulse regime. Contrib. to Plasma Phys. 2010, 50, 886–891. [Google Scholar] [CrossRef]
- Pedersen, H.; Larsson, P.; Aijaz, A.; Jensen, J.; Lundin, D. A novel high-power pulse PECVD method. Surf. Coat. Technol. 2012, 206, 4562–4566. [Google Scholar] [CrossRef]
- Leshkov, S.; Kudrna, P.; Chichina, M.; Klusoň, J.; Picková, I.; Virostko, P.; Hubička, Z.; Tichý, M. Spatial Distribution of Plasma Parameters in DC-Energized Hollow Cathode Plasma Jet. Contrib. Plasma Phys. 2010, 50, 878–885. [Google Scholar] [CrossRef]
- Cornell, R.M.; Schwertmann, U. Introduction to the Iron Oxides. In The Iron Oxides; Wiley-VCH Verlag GmbH & Co. KGaA: Weinheim, Germany, 2004; pp. 1–7. ISBN 3-527-30274-3. [Google Scholar]
- Schena, T.; Bihlmayer, G.; Blügel, S. First-Principles Studies of FeS2 using many-body perturbation theory in the G0W0 Approximation. Phys. Rev B 2013, 88, 235203. [Google Scholar] [CrossRef]
- The RRUFF Project. Available online: http://rruff.info/index.htm (accessed on 1 March 2020).


| Ion | H3+ | O+ | H2O+ | Ar++ | O2+ | O2H+ | ArH+ | Fe+ |
|---|---|---|---|---|---|---|---|---|
| Mass (amu) | 3 | 16 | 18 | 20 | 32 | 33 | 41 | 56 |
| Pulsed 5 Pa | — | — | — | 15.5 | — | — | 2.2 | 1.4 |
| Pulsed 20 Pa | 9.6 | — | — | 11.2 | — | — | 21 | 12.2 |
| DC 5 Pa | 2.2 | — | 4.0 | 20.5 | — | — | 6.3 | 1.5 |
| DC 5 Pa + O2 | — | 5.1 | 4.5 | 3.1 | 55 | 2.5 | — | 1.3 |
| Before Sulfidation | After Sulfidation |
|---|---|
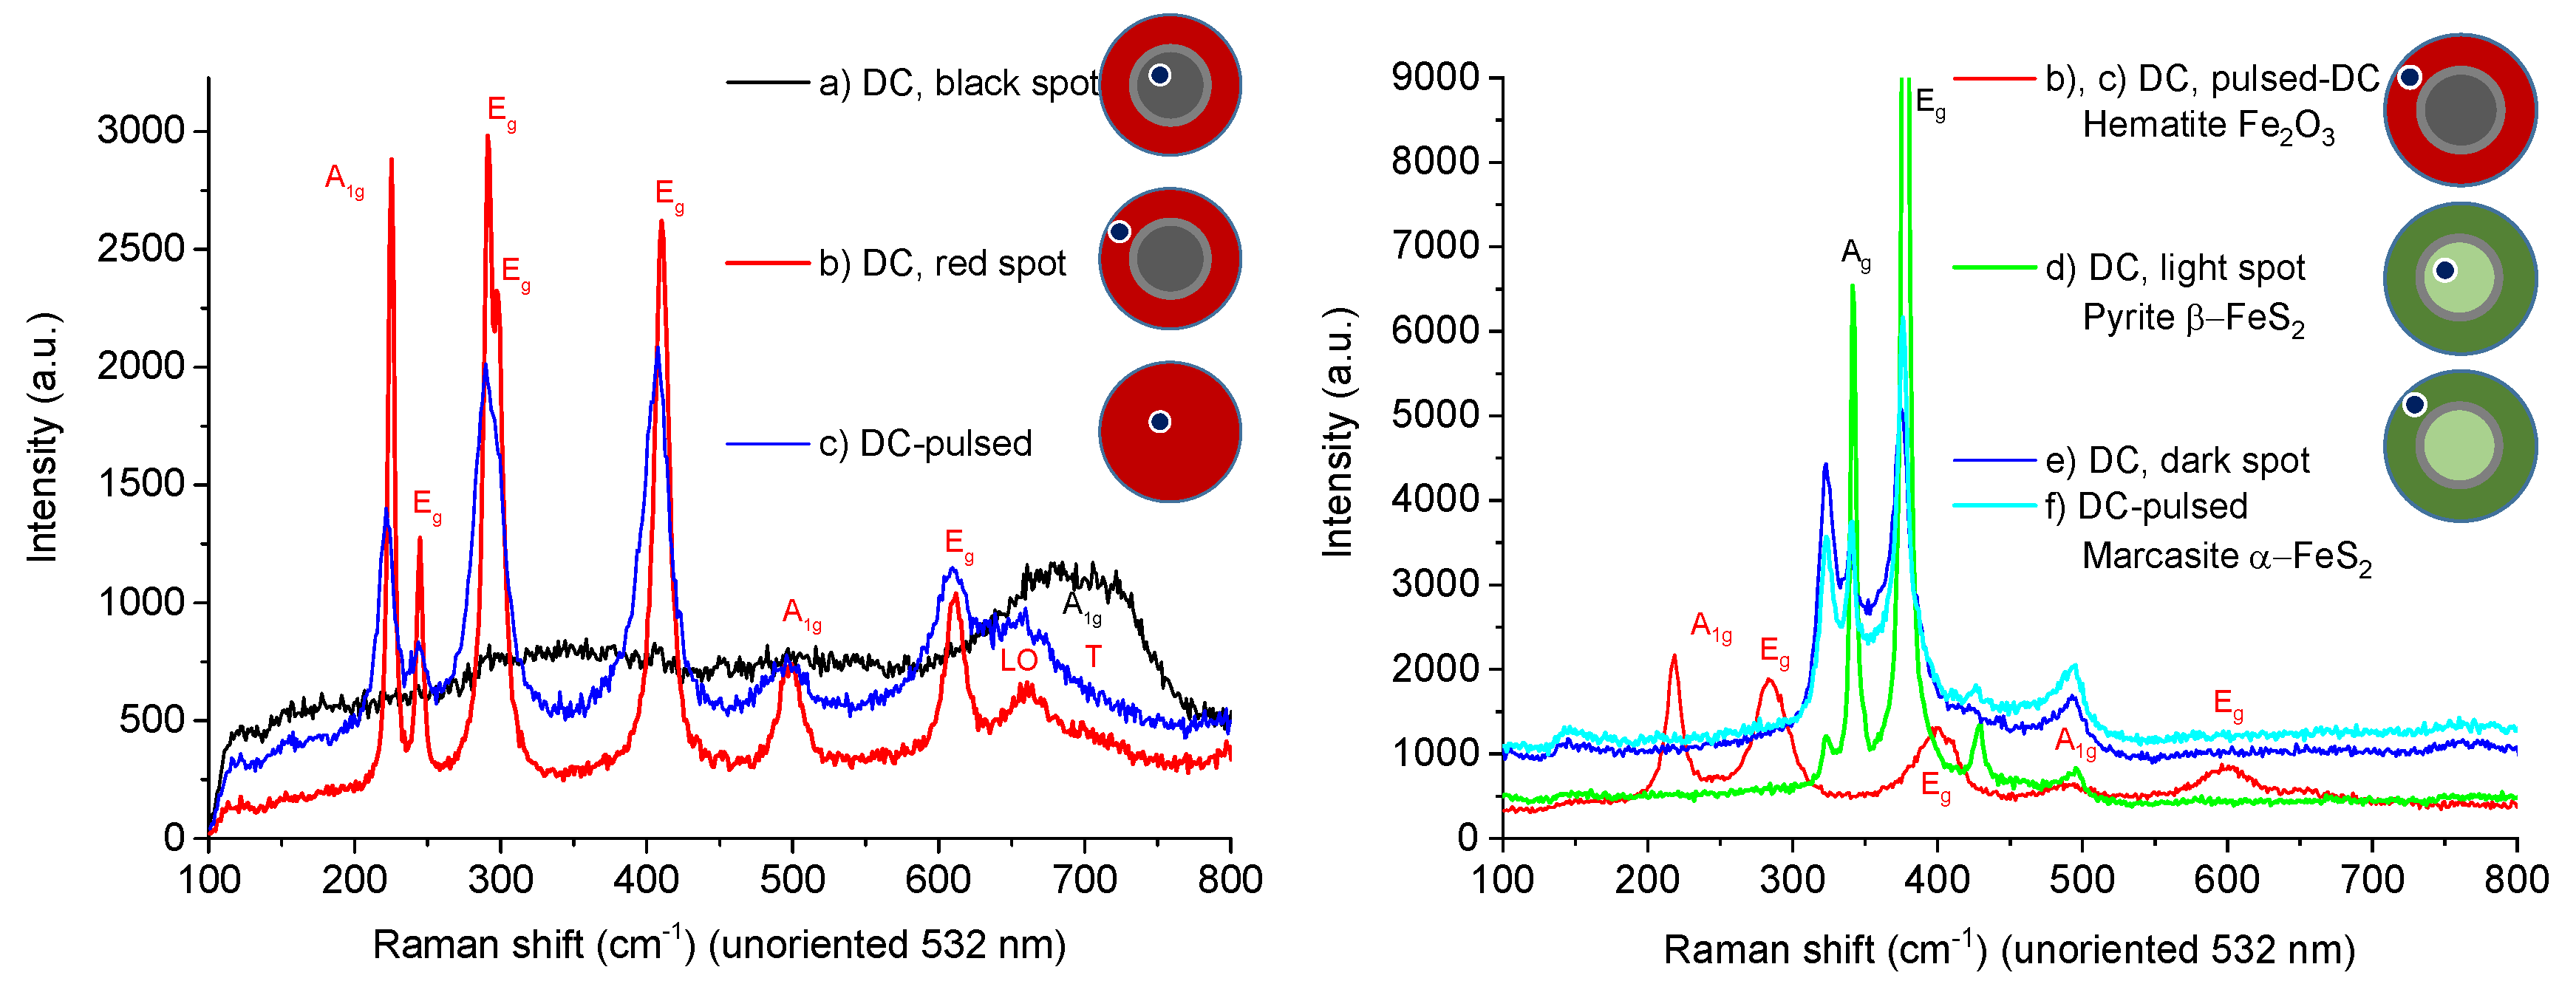
| (a) Magnetite Fe2+Fe3+2O4 (Fe3O4) | (d) Pyrite β-FeS2 |
| (b), (c) Hematite Fe2O3 | (e), (f) Marcasite α-FeS2 |
| Hematite | Magnetite | Marcasite | Pyrite | |||||
|---|---|---|---|---|---|---|---|---|
| Element | wt.% | at.% | wt.% | at.% | wt.% | at.% | wt.% | at.% |
| O (K line) | 35.1 | 67.6 | 31.8 | 62.0 | 8.8 | 22.4 | 8.3 | 20.5 |
| S (K line) | — | — | — | — | 31.8 | 40.5 | 28.3 | 35.0 |
| Sn (L line) | 11.7 | 3.0 | — | — | 16.7 | 5.8 | 1.3 | 0.4 |
| Fe (K line) | 53.2 | 29.4 | 68.2 | 38.0 | 42.7 | 31.3 | 62.1 | 44.1 |
© 2020 by the authors. Licensee MDPI, Basel, Switzerland. This article is an open access article distributed under the terms and conditions of the Creative Commons Attribution (CC BY) license (http://creativecommons.org/licenses/by/4.0/).
Share and Cite
Tuharin, K.; Turek, Z.; Zanáška, M.; Kudrna, P.; Tichý, M. Iron Oxide and Iron Sulfide Films Prepared for Dye-Sensitized Solar Cells. Materials 2020, 13, 1797. https://doi.org/10.3390/ma13081797
Tuharin K, Turek Z, Zanáška M, Kudrna P, Tichý M. Iron Oxide and Iron Sulfide Films Prepared for Dye-Sensitized Solar Cells. Materials. 2020; 13(8):1797. https://doi.org/10.3390/ma13081797
Chicago/Turabian StyleTuharin, Kostyantyn, Zdeněk Turek, Michal Zanáška, Pavel Kudrna, and Milan Tichý. 2020. "Iron Oxide and Iron Sulfide Films Prepared for Dye-Sensitized Solar Cells" Materials 13, no. 8: 1797. https://doi.org/10.3390/ma13081797
APA StyleTuharin, K., Turek, Z., Zanáška, M., Kudrna, P., & Tichý, M. (2020). Iron Oxide and Iron Sulfide Films Prepared for Dye-Sensitized Solar Cells. Materials, 13(8), 1797. https://doi.org/10.3390/ma13081797