Abstract
Cycle-dependent damage evolution in self-healing, 2.5D woven Hi-NicalonTM SiC/[Si-B-C] and 2D woven Hi-NicalonTM SiC/[SiC-B4C] ceramic-matrix composites (CMCs) at 600 and 1200 °C was investigated. The cycle-dependent damage parameters of internal friction, dissipated energy, Kachanov’s damage parameter, and broken fiber fraction were obtained to describe damage development in self-healing CMCs. The relationships between cycle-dependent damage parameters and multiple fatigue damage mechanisms were established. The experimental fatigue damage development of self-healing Hi-NicalonTM SiC/[Si-B-C] and Hi-NicalonTM SiC/[SiC-B4C] composites was predicted for different temperatures, peak stresses, and loading frequencies. The cycle-dependent damage evolution of self-healing Hi-NicalonTM SiC/[Si-B-C] and Hi-NicalonTM SiC/[SiC-B4C] composites depends on temperature, testing environment, peak stress, and loading frequency. For the Hi-NicalonTM SiC/[Si-B-C] composite, temperature is a governing parameter for the fatigue process. At an elevated temperature of 600 °C in an air atmosphere, the internal frictional parameter of Hi-NicalonTM SiC/[Si-B-C] composite decreases first and then increases with applied cycle number; however, at an elevated temperature of 1200 °C in an air atmosphere, the internal frictional parameter of Hi-NicalonTM SiC/[Si-B-C] composite decreases with applied cycle number, and the interface shear stress at 1200 °C is much lower than that at 600 °C. For Hi-NicalonTM SiC/[SiC-B4C] composite at 1200 °C, loading frequency is a governing parameter for the fatigue process. The degradation rate of interface shear stress is much higher at the loading frequency of 0.1 Hz than that at the loading frequency of 1 Hz.
1. Introduction
At present, superalloy is still the main material of any high temperature structure in an aeroengine (i.e., combustion chamber and turbine). After more than 40 years of development, the temperature resistance of metal materials represented by single crystal alloy has been greatly improved, but the difference between them and the combustion temperature of an aeroengine is still large, and the gap is gradually increasing in the new generation of aeroengines. In order to improve the temperature resistance, most designers adopt the active cooling of “thermal barrier coating + film cooling.” However, the introduction of cooling air affects the combustion efficiency, and the higher the combustion temperature, the greater the effect. Therefore, the improvement of temperature resistance is the key technology for developing next generation aeroengines. Ceramic materials with high temperature resistance, good mechanical properties, and low density have long been considered ideal materials for high-temperature structures in aeroengines. However, due to the low toughness of ceramics, once damaged, they will cause catastrophic consequences for aeroengine, which limits their application. In order to improve the toughness of ceramic materials, fiber-reinforced ceramic-matrix composites (CMCs) have been developed. The SiCf/SiC composite possesses low density and a long lifetime at high temperatures for up to thousands of hours, making it an ideal material for the hot section components of commercial aeroengines [1,2,3,4]. Under long-term applications at elevated temperatures, CMCs are subjected to mechanical or thermal cyclic fatigue loading [5,6,7]. Understanding the fatigue damage mechanisms of CMCs at elevated temperatures is necessary for hot section components designers [8,9,10]. To reduce the failure risk of CMC hot section components in aeroengines during operation, it is necessary to investigate the cycle-dependent fatigue damage evolution in a high temperature environment, and to develop related damage models, prediction methods, and computation tools [11,12,13].
Oxidation is the key factor to limiting the application of CMCs on hot section load-carrying components of aeroengines. Combining carbides deposited by the chemical vapor infiltration (CVI) process with specific sequences, a new generation of SiC/SiC composite with a self-healing matrix has been developed to improve the oxidation resistance [14,15]. The self-sealing matrix forms a glass with oxygen at high temperature and consequently prevents oxygen diffusion inside the material. At low temperature of 650–1000 °C in dry and wet oxygen atmospheres, the self-healing 2.5D NicalonTM NL202 SiC/[Si-B-C] with a pyrocarbon (PyC) interphase exhibits a better oxidation resistance compared to SiC/SiC with PyC, due to the presence of boron compounds [16]. The fatigue lifetime duration in an air atmosphere at intermediate and high temperatures is considerably reduced beyond the elastic yield point. For the NicalonTM SiC/[Si-B-C] composite, the elastic yield point is about σ = 80 MPa. The lifetime duration is about t = 10–20 h at T = 873 K and less than t = 1 h at T = 1123 K under σmax = 120 MPa. For the self-healing Hi-NicalonTM SiC/SiC composite, a duration of t = 1000 h without failure is reached at σmax = 170 MPa, and a duration higher than t = 100 h at σmax = 200 MPa and T = 873 K is reached [17]. For the self-healing Hi-NicalonTM SiC/[SiC-B4C] composite, at 1200 °C, there is little influence on the fatigue performance at f = 1.0 Hz, but there is a noticeably degraded fatigue lifetime at f = 0.1 Hz with the presence of steam [18,19]. Increase in temperature from T = 1200 to 1300 °C slightly degrades the fatigue performance in an air atmosphere, but not in a steam atmosphere [20]. The crack growth in the SiC fiber controls the fatigue lifetime of self-healing Hi-NicalonTM SiC/[Si-B-C] at T = 873 K; and the fiber creep controls the fatigue lifetime of self-healing SiC/[Si-B-C] at T = 1200 °C [21]. The typical cyclic fatigue behavior of a self-healing Hi-NicalonTM SiC/[Si-B-C] composite involves an initial decrease of the effective modulus to a minimum value, followed by a stiffening, and the time-to-the minimum modulus is in inverse proportion to the loading frequency [22]. The initial cracks within the longitudinal tows caused by interphase oxidation contribute to the initial decrease of modulus. The glass produced by the oxidation of the self-healing matrix may contribute to the stiffening of the composite either by sealing the cracks or by bonding the fiber to the matrix [23]. The damage evolution of self-healing Hi-NicalonTM SiC/[Si-B-C] composite at elevated temperature can be monitored using acoustic emission (AE) [24,25]. The relationship between interface oxidation and AE energy under static fatigue loading at elevated temperatures has been developed [26]. However, at a high temperature above 1000 °C, AE cannot be applied for cyclic fatigue damage monitoring. The complex fatigue damage mechanisms of self-healing CMCs affect damage evolution and lifetime. Hysteresis loops are related to cycle-dependent fatigue damage mechanisms [27,28,29]. The damage parameters derived from hysteresis loops have already been applied for analyzing the fatigue damage and fracturing of different non-oxide CMCs at elevated temperatures [30,31,32,33]. However, the cycle-dependent damage evolution and accumulation of self-healing CMCs have very different values from previous analysis results, especially at elevated temperatures. In the research mentioned above, the relationship between the cycle-dependent damage evolution and mechanical hysteresis of self-healing CMCs has not been established.
The objective of this paper is to analyze cycle-dependent damage development in self-healing 2.5D woven Hi-NicalonTM SiC/[Si-B-C] and 2D woven Hi-NicalonTM SiC/[SiC-B4C] composites at T = 600 °C and 1200 °C using damage evolution models and parameters. The cycle-dependent damage parameters of internal friction, dissipated energy, Kachanov’s damage parameter, and broken fiber fraction were obtained to analyze damage development in self-healing CMCs. The relationships between cycle-dependent damage parameters and multiple fatigue damage mechanisms are established. The experimental fatigue damage evolution of each of the composites—self-healing Hi-NicalonTM SiC/[Si-B-C] and Hi-NicalonTM SiC/[SiC-B4C]—is predicted. The effects of fatigue peak stress, testing environment, and loading frequencies on the evolution of internal damage and final fracture are analyzed.
2. Materials and Experimental Procedures
The Hi-NicalonTM fibers (Nippon Carbon Co., Ltd., Tokyo, Japan) with an interphase of pyrolytic carbon (PyC) reinforced multilayered matrix [Si-B-C] were provided by SNECMA Propulsion Solide, Le Haillan, France. The self-healing Hi-NicalonTM SiC/[Si-B-C] composite was fabricated using chemical vapor infiltration (CVI). The experimental results were performed and obtained by Penas [34]. The detailed information of materials and experimental procedures of 2.5D Hi-NicalonTM SiC/[Si-B-C] composite at 600 °C and 1200 °C in an air atmosphere are shown in Table 1. The 2.5D fiber preform was consolidated by an interphase PyC deposited by CVI with a thickness of 0.1 μm to optimize the interphase properties and promote the desired pseudo-ductile behavior in the composite. The fiber volume was about 35%, and the porosity was about 10%.

Table 1.
Materials and experimental procedures of 2.5D woven Hi-NicalonTM SiC/[Si-B-C] composite at 600 °C and 1200 °C in an air atmosphere.
The fatigue specimen was dog bone-shaped, and the dimensions were 200 mm total length, 5 mm thickness, and 16 mm width in the gage section. The fatigue experiments at elevated temperature were conducted in an INSTRON Model 8502 (INSTRON System Corp., Norwood, MA, USA) and an AET furnace system (AET Technologies Corp., Meylan, France). The fatigue tests were on a sinusoidal wave form and the loading frequency was f = 0.25 Hz. For tension–compression fatigue tests, the minimum stress is always equal to σmin = −50 MPa; and for tension–tension fatigue tests, the minimum stress is set to be σmin = 0 MPa, and the fatigue limit was defined to be N = 1,000,000.
The Hi-NicalonTM SiC/[SiC-B4C] composite was reinforced with Hi-NicalonTM fibers with the PyC interphase (about 0.4 μm thick) and boron carbide overlay (about 1.0 μm thick), and was processed via CVI by Hyper-Therm High-Temperature Composites, Inc. (Huntington Beach, CA, USA). The experimental results were obtained by Ruggles-Wrenn et al. [18]. The detailed information of materials and experimental procedures is shown in Table 2. The fiber volume was about 34.8%, and the composite density was about 2.56 g/cm3. The dimensions of the dog bone-shaped specimen were 152 mm total length, 10 mm width, and 3.5 mm thickness in the gage section. The fatigue tests were performed in an MTS 810 (MTS, Eden Prairie, MN, USA). The fatigue tests were performed under load control with a stress ratio of R = 0.05 and f = 0.1 and 1.0 Hz. The fatigue peak stress was σmax = 140 MPa. The fatigue limit was N = 100,000 at f = 0.1 Hz, and N = 200,000 at f = 1.0 Hz.
Table 2.
Materials and experimental procedures of 2D woven Hi-NicalonTM SiC/[SiC-B4C] composite at 1200 °C in air and steam atmospheres.
3. Theoretical Analysis
When the peak stress is higher than the first matrix cracking stress, under cyclic fatigue loading, multiple fatigue damage mechanisms of matrix cracking, interface debonding, wear and oxidation, and fiber fracturing occur [5,6,7,8,35,36]. Hysteresis loops appear and evolve with cycle number upon unloading and reloading due to internal multiple damages in CMCs [27,28,29,30,31,32,33,37]. A unit cell is extracted from the damaged CMCs, as shown in Figure 1. The total length of the unit cell is half of a matrix crack spacing (lc/2), and the interface debonding length between the space of matrix cracking is ld. Upon unloading, the debonding zone is divvied into a counter-slip zone with the length of ly and a slip zone of length ld–ly, as shown in Figure 1a; and upon reloading, the debonding zone is divvied into a new slip zone with a length of lz, a counter-slip region with a length of ly–lz, and a slip region with a length of ld–ly, as shown in Figure 1b.
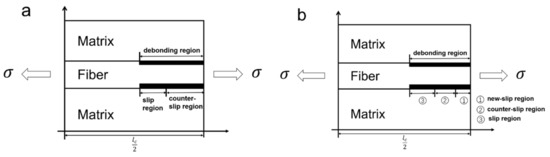
Figure 1.
Unit cell of damaged CMCs upon (a) unloading and (b) reloading.
Based on the interface debonding and slip state between the matrix crack spacing, the types of hysteresis loops can be divided into four cases, as shown in Table 3.
Table 3.
Interface debonding and slip state in CMCs.
For Case 1 and 2 in Table 3, the unloading and reloading composite hysteresis strain is a function of cycle-dependent unloading intact fiber stress (ΦU(N)), reloading intact fiber stress (ΦR(N)), interface shear stress (τi(N)), interface debonding, and slip length (ld(N), ly(N), and lz(N)). The cycle-dependent unloading composite hysteresis strain (εU(N)) and reloading composite hysteresis strain (εR(N)) are determined as:
where rf is the fiber radius; αf and αc denote the fiber and composite’s thermal expansion coefficient; and ΔT denotes the temperature difference between tested and fabricated temperatures.
For Cases 3 and 4 in Table 3, the cycle-dependent unloading composite hysteresis strain (εU(N)) and reloading composite hysteresis strain (εR(N)) can be expressed as:
The cycle-dependent internal damage parameter is defined by ∆W/We, where We is the maximum elastic energy stored during a cycle [30].
Substituting Equations (1)–(4) into Equation (5), the damage parameter (ΔW(N)) can be obtained, which is a function of cycle-dependent unloading intact fiber stress (ΦU(N)); reloading intact fiber stress (ΦR(N)); interface shear stress (τi(N)); interface debonding; and slip length, (ld(N), ly(N), and lz(N)). It should be noted that the cycle-dependent unloading intact fiber stress (ΦU(N)) and reloading intact fiber stress (ΦR(N)) consider fiber failure and broken fiber fraction. Comparing experimental ∆W/We or ∆W with theoretical values, the interface shear stress (τi(N)) and broken fiber fraction (P) can be obtained for different cycle numbers.
The mean elastic modulus (E) is the mean slope of hysteresis loop. This modulus is usually normalized by the Young’s modulus E0 of a undamaged composite, leading to the plotting of (E/E0). A Kachanov’s damage parameter (D) is given by:
The Kachanov’s damage parameter (D) is another way to describe the evolution of a composite’s mean elastic modulus (E) under cyclic fatigue but contains the same information as the normalized modulus (E/E0).
4. Experimental Comparisons
The monotonic tensile and cycle-dependent damage evolutions of self-healing 2.5D woven Hi-NicalonTM SiC/[Si-B-C] and 2D woven Hi-NicalonTM SiC/[SiC-B4C] composites were analyzed for different temperatures. The monotonic tensile curves exhibit obvious nonlinearity at elevated temperatures. For 2.5D woven Hi-NicalonTM SiC/[Si-B-C] at 600 °C and 1200 °C, the tensile curves can be divided into three main zones; however, for 2D woven Hi-NicalonTM SiC/[SiC-B4C] at 1200 °C, the tensile curve can only be divided into two main zones. The cycle-dependent damage parameters of internal friction (∆W(N)/We(N)), dissipated energy (∆W(N)), interface shear stress (τi(N)), Kachanov’s damage parameter (D(N)), and broken fiber fraction (P(N)) versus cycle number are analyzed for different temperatures, peak stresses, and loading frequencies. The interface shear stress decreases with applied cycle number; and the Kachanov’s damage parameter and broken fiber fraction increase with applied cycle number. However, the evolution of internal frictional and dissipated energy with more cycles is much more complex, as together, they depend on the peak stress, temperature, and testing environment. The internal damage evolution of each composite—2.5D woven Hi-NicalonTM SiC/[Si-B-C] and 2D woven Hi-NicalonTM SiC/[SiC-B4C]—when subjected to cyclic fatigue loading, was obtained.
4.1. 2.5D Woven Hi-NicalonTM SiC/[Si-B-C] at 600 °C in an Air Atmosphere
The monotonic tensile curve of 2.5D woven self-healing Hi-NicalonTM SiC/[Si-B-C] composite at T = 600 °C in an air atmosphere is shown in Figure 2. The self-healing Hi-NicalonTM SiC/[Si-B-C] composite fractures at σUTS = 341 MPa with the failure strain of εf = 0.64%. The tensile curve exhibits obvious nonlinearity, and can be divided into three zones, including: (1) the linear elastic zone with an elastic modulus of Ec = 195 ± 20 GPa; (2) the nonlinear zone due to multiple matrix cracking; and (3) the second linear zone after saturation of matrix cracking up to final fracture, with an elastic modulus of Ec = 23 ± 1 GPa, which is half of theoretical value EfVfl (43 GPa) when the load is supported only by the longitudinal fiber.
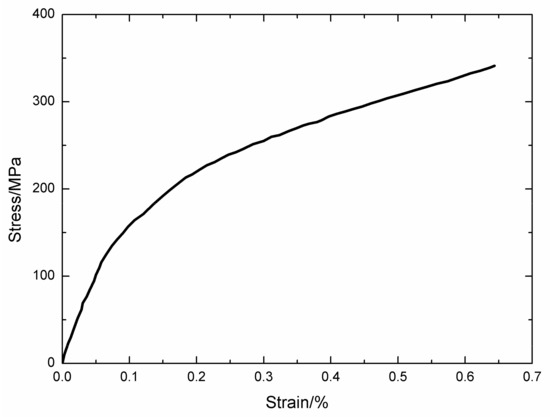
Figure 2.
Tensile curve of 2.5D woven self-healing Hi-NicalonTM SiC/[Si-B-C] composite at 600 °C in an air atmosphere.
The experimental cycle-dependent internal friction parameter (∆W/We) versus cycle number curves of 2.5D woven self-healing Hi-NicalonTM SiC/[Si-B-C] composite under σmin = −50/σmax = 300 MPa and σmin = 0/σmax = 200 MPa at T = 600 °C in an air atmosphere are shown in Figure 3. The cycle-dependent internal friction parameter (∆W/We) decreases first, followed by a short stabilization, and increases again before reaching a plateau; and finally, there is a sharp increase when the composite approaches failure. During initial stage of cyclic fatigue loading, matrix cracking and interface debonding occur when the fatigue peak stress is higher than the first matrix cracking stress. Under repeated unloading and reloading, the sliding between the fiber and the matrix leads to the interface wear and oxidation, which decreases the interface shear stress [5,8,27,29]. The initial decrease of internal friction parameter (∆W/We) is mainly attributed to matrix cracking, cycle-dependent interface debonding, and interface wear. However, with increasing cycle number, the interface wear and oxidation decrease the interface shear stress to a constant value [30], leading to the stabilization of cycle-dependent interface debonding and slip length and also the internal friction damage parameter (∆W/We). The interface wear and oxidation also decrease the fiber strength, leading to the gradual fracture of fiber, and the sudden increase of internal friction at the end of the test corresponding to fiber broken [30,33].
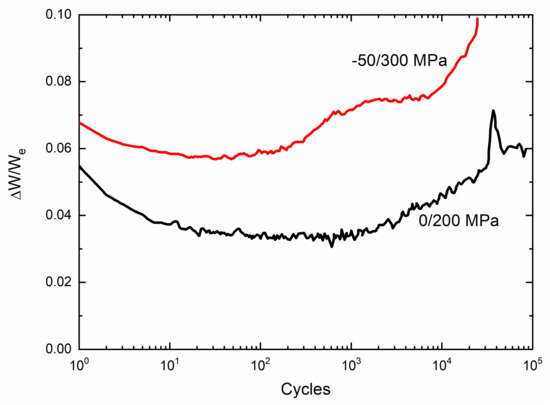
Figure 3.
Experimental ∆W/We versus cycle number curves of 2.5D woven self-healing Hi-NicalonTM SiC/[Si-B-C] composite at 600 °C in an air atmosphere.
The experimental and predicted cycle-dependent internal friction parameter (∆W(N)/We(N)) and broken fiber fraction (P(N)) versus the interface shear stress curves, and the cycle-dependent Kachanov’s damage parameter (D(N)) and the interface shear stress (τi(N)) versus cycle number curves of 2.5D woven self-healing Hi-NicalonTM SiC/[Si-B-C] at 600 °C in an air atmosphere are shown in Figure 4 and Table 4. Under σmax = 200 and 300 MPa, the internal damage parameter (∆W(N)/We(N)) first decreases with the interface shear stress, mainly due to the interface wear and oxidation, and then increases with the interface shear stress, mainly due to the fiber broken, corresponding to the interface slip Case 4 in Table 3, as shown in Figure 4a. Under σmax = 300 MPa, the broken fiber fraction (P(N)) at higher interface shear stress is much higher than that under σmax = 200 MPa, mainly due to higher peak stress, as shown in Figure 4b; and the Kachanov’s damage parameter (D(N)) is also higher than that under σmax = 200 MPa, as shown in Figure 4c. The interface shear stress under σmax = 300 MPa is also higher than that under σmax = 200 MPa, mainly due to the scatter of interface shear stress or compressive stress of σmin = −50 MPa acting on the composite.
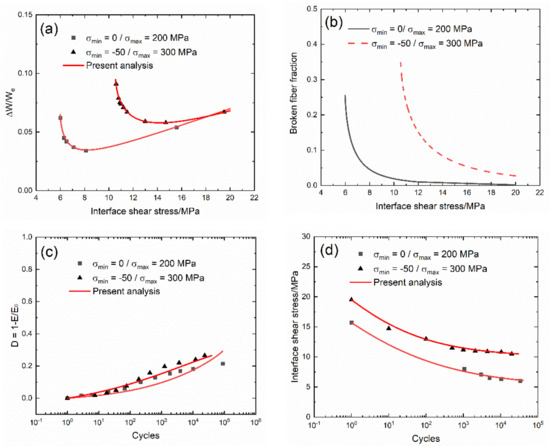
Figure 4.
(a) Experimental and predicted internal friction parameter (ΔW/We) versus the interface shear stress curves: (b) the broken fiber fraction (P) versus the interface shear stress curves; (c) the experimental and predicted Kachanov’s damage parameter (D) versus cycle number curves; and (d) the interface shear stress (τi(N)) versus cycle number curve of 2.5D woven self-healing Hi-NicalonTM SiC/[Si-B-C] composite at 600 °C in an air atmosphere.
Table 4.
Cycle-dependent damage evolution of 2.5D woven self-healing Hi-NicalonTM SiC/[Si-B-C] composite at 600 °C in an air atmosphere.
Under σmax = 200 MPa, the cycle-dependent damage parameter (∆W/We) decreases first, i.e., from ∆W/We = 0.054 at τi = 15.7 MPa to ∆W/We = 0.034 at τi = 8.0 MPa, and then increases from ∆W/We = 0.034 at τi = 8.0 MPa to ∆W/We = 0.062 at τi = 6.0 MPa. The cycle-dependent broken fiber fraction (P) increases from P = 0.004 at τi = 15.7 MPa to P = 0.24 at τi = 6.0 MPa. The cycle-dependent Kachanov’s damage parameter (D) increases from D = 0 at N = 1 to D = 0.21 at N = 89,459. The cycle-dependent interface shear stress (τi) decreases from τi = 15.7 MPa at N = 1 to τi = 6.0 MPa at N = 33,788.
Under the peak stress of σmax = 300 MPa, the cycle-dependent damage parameter (∆W/We) decreases first, i.e., from ∆W/We = 0.067 at τi = 19.5 MPa to ∆W/We = 0.058 at τi = 14.7 MPa; and then increases from ∆W/We = 0.058 at τi = 14.7 MPa to ∆W/We = 0.091 at τi = 10.5 MPa. The cycle-dependent broken fiber fraction (P) increases from P = 0.029 at τi = 19.5 MPa to P = 0.347 at τi = 10.5 MPa. The cycle-dependent Kachanov’s damage parameter (D) increases from D = 0 at N = 1 to D = 0.265 at N = 23,666. The interface shear stress (τi) decreases from τi = 19.5 MPa at N = 1 to τi = 10.5 MPa at N = 19,812.
4.2. 2.5D Woven Hi-NicalonTM SiC/[Si-B-C] at 1200 °C in an Air Atmosphere
The monotonic tensile curve of 2.5D woven self-healing Hi-NicalonTM SiC/[Si-B-C] composite at T = 1200 °C in an air atmosphere is shown in Figure 5. The composite tensile fractured at σUTS = 354 MPa with εf = 0.699%. The tensile curve can also be divided into three zones, including: (1) the initial linear elastic zone; (2) the non-linear zone; and (3) the second linear region with fiber broken. The average fracture strength and failure strain of 2.5D woven Hi-NicalonTM SiC/[Si-B-C] composite are slightly lower at T = 1200 °C; i.e., σUTS = 320 MPa and ɛf = 0.62%, against σUTS = 332 MPa and ɛf = 0.658% at T = 600 °C.
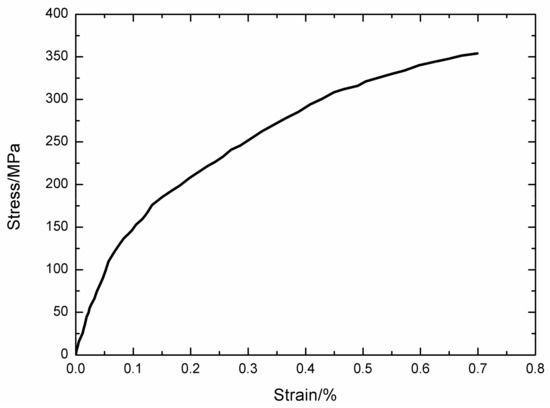
Figure 5.
Tensile curve of 2.5D woven self-healing Hi-NicalonTM SiC/[Si-B-C] composite at 1200 °C in an air atmosphere.
The experimental cycle-dependent internal friction parameter (∆W/We) versus cycle number curves of 2.5D woven self-healing Hi-NicalonTM SiC/[Si-B-C] at T = 1200 °C in an air atmosphere are shown in Figure 6. The cycle-dependent internal friction parameter (∆W/We) decreases continuously, and finally, there is a sharp increase when the composite approaches failure. The internal friction decreases as the interface wear reduces the interface shear stress. The sudden increase of internal friction at the end of the test corresponds to the fiber broken.
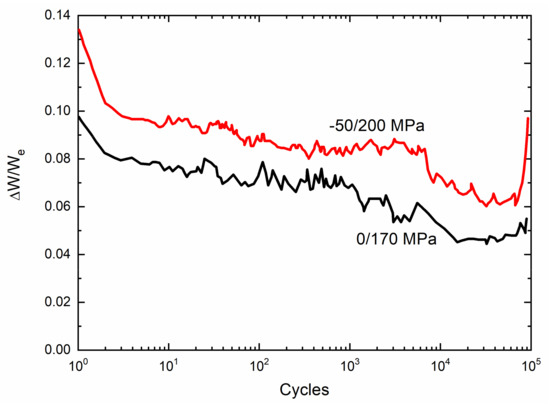
Figure 6.
Experimental internal friction parameter (∆W/We) versus cycle number curves of 2.5D woven self-healing Hi-NicalonTM SiC/[Si-B-C] composite at 1200 °C in an air atmosphere.
The experimental and predicted cycle-dependent internal friction parameter (∆W(N)/We(N)) and the broken fiber fraction (P(N)) versus the interface shear stress curves; and the cycle-dependent Kachanov’s damage parameter (D(N)) and the interface shear stress (τi(N)) versus cycle number curves of 2.5D woven self-healing Hi-NicalonTM SiC/[Si-B-C] composite at 1200 °C in an air atmosphere are shown in Figure 7 and Table 5. Under σmax = 170 and 200 MPa, the internal damage parameter (∆W/We) decreases with the interface shear stress, corresponding to the interface slip case (Case 4) in Table 3. Under σmax = 200 MPa, the broken fiber fraction (P) is higher than that under σmax = 170 MPa at the same interface shear stress; and the Kachanov’s damage parameter (D) is also higher than that under σmax = 170 MPa at the same cycle number. However, the value of the interface shear stress under σmax = 200 MPa is close to that under σmax = 170 MPa.
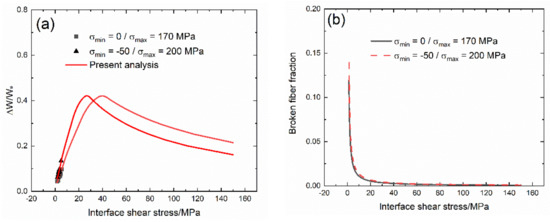
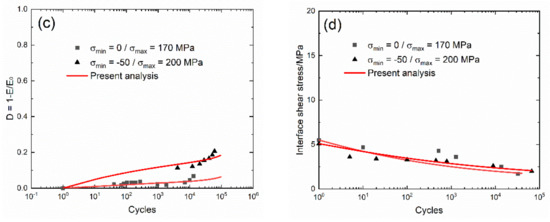
Figure 7.
(a) Experimental and predicted internal friction parameter (ΔW/We) versus the interface shear stress curves: (b) the broken fiber fraction (P) versus the interface shear stress curves; (c) the experimental and predicted Kachanov’s damage parameter (D) versus cycle number curves; and (d) the interface shear stress versus cycle number curves of 2.5D woven self-healing Hi-NicalonTM SiC/[Si-B-C] composite at 1200 °C in an air atmosphere.
Table 5.
Cycle-dependent damage evolution of 2.5D woven self-healing Hi-NicalonTM SiC/[Si-B-C] composite at 1200 °C in an air atmosphere.
Under σmax = 170 MPa, the cycle-dependent internal friction parameter (∆W/We) increases to the peak value first and then decreases; i.e., from ∆W/We = 0.2 at τi = 150 MPa to ∆W/We = 0.42 at τi = 39.5 MPa, and then to ∆W/We = 0.04 at τi = 1.25 MPa. The broken fiber fraction (P) increases from P = 0.0007 at τi = 150 MPa to P = 0.12 at τi = 1.2 MPa. The Kachanov’s damage parameter (D) increases from D = 0 at N = 1 to D = 0.068 at N = 13,202. The interface shear stress (τi) decreases from τi = 5.5 MPa at N = 1 to τi = 1.7 MPa at N = 32334.
Under σmax = 200 MPa, the cycle-dependent internal friction parameter (∆W/We) increases to the peak value first and then decreases; i.e., from ∆W/We = 0.161 at τi = 150 MPa to ∆W/We = 0.42 at τi = 26.4 MPa, and then to ∆W/We = 0.05 at τi = 1.37 MPa. The broken fiber fraction (P) increases from P = 0.0008 at τi = 150 MPa to P = 0.14 at τi = 1.3 MPa. The Kachanov’s damage parameter (D) increases from D = 0 at N = 1 to D = 0.2 at N = 60530. The interface shear stress (τi) decreases from τi = 5.1 MPa at N = 1 to τi = 2 MPa at N = 66794.
4.3. 2D Woven Self-healing Hi-NicalonTM SiC/[SiC-B4C] at 1200 °C in Air and in a Steam Atmospheres
The monotonic tensile curve of 2D woven self-healing Hi-NicalonTM SiC/[SiC-B4C] composite at T = 1200 °C in an air atmosphere is shown in Figure 8. The composite tensile fractured at σUTS = 345 MPa with εf = 0.79%. The experimental cycle-dependent dissipated energy (ΔW(N)) versus cycle number curves of 2D woven self-healing Hi-NicalonTM SiC/[SiC-B4C] composite under σmax = 140 MPa at T = 1200 °C in an air atmosphere and in a steam atmosphere with f = 0.1 and 1 Hz are shown in Figure 9.
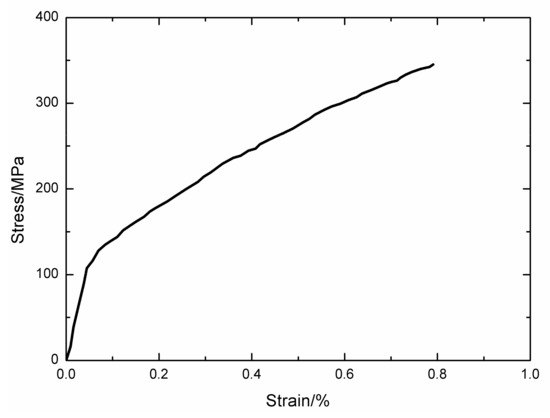
Figure 8.
Tensile curve of 2D woven self-healing Hi-NicalonTM SiC/[SiC-B4C] composite at 1200 °C.

Figure 9.
Experimental cycle-dependent dissipated energy (ΔW) versus cycle number curves of 2D woven self-healing Hi-NicalonTM SiC/[SiC-B4C] composite under σmax = 140 MPa at 1200 °C in air and in steam atmospheres.
The experimental and predicted cycle-dependent dissipated energy (ΔW(N)) and broken fiber fraction (P(N)) versus the interface shear stress curves, and the cycle-dependent interface shear stress (τi(N)) and dissipated energy (ΔW(N)) versus cycle number curves of 2D woven self-healing Hi-NicalonTM SiC/[SiC-B4C] composite under σmax = 140 MPa and f = 0.1 and 1 Hz at T = 1200 °C in air and in steam atmospheres are shown in Figure 10 and Table 6. The damage parameter (ΔW) increases with the interface shear stress, corresponding to the interface slip case (Case 2) in Table 3, as shown in Figure 10a. The broken fiber fraction (P) increases with decreasing interface shear stress, as shown in Figure 10b. The interface shear stress degrades with cycle number, and the degradation rate of the interface shear stress under f = 0.1 Hz is higher than that under f = 1 Hz. When f = 1 Hz, the degradation rate of the interface shear stress is slightly affected in air or in steam; however, when f = 0.1 Hz, the degradation rate of the interface shear stress in steam is higher than that in air.
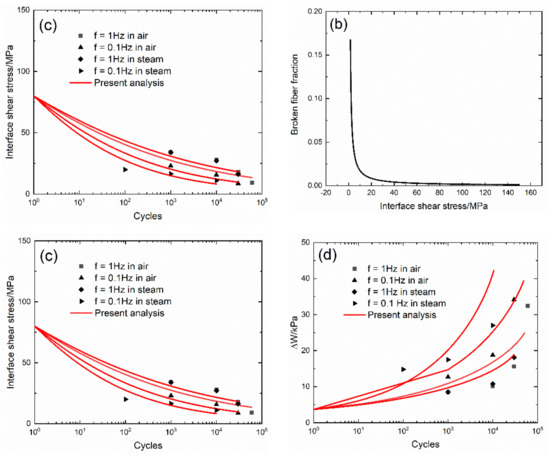
Figure 10.
(a) Experimental and predicted dissipated energy (ΔW) versus the interface shear stress curves: (b) the broken fiber fraction (P) versus the interface shear stress curves; (c) the experimental and predicted interface shear stress (τi) versus cycle number curves; and (d) the experimental and predicted dissipated energy (ΔW) versus cycle number curves of 2D woven self-healing Hi-NicalonTM SiC/[SiC-B4C] composite at 1200 °C in an air atmosphere.
Table 6.
Cycle-dependent damage evolution of 2D woven self-healing Hi-NicalonTM SiC/[SiC-B4C] composite under σmax = 140 MPa at 1200 °C in air and in steam atmospheres.
At T = 1200 °C in air, under σmax = 140 MPa and f = 1 Hz, the experimental cycle-dependent dissipated energy (ΔW) increases from ΔW = 8.5 kPa at τi = 34 MPa to ΔW = 32.4 kPa at τi = 9.2 MPa; the broken fiber fraction (P) increases from P = 0.001 at τi = 150 MPa to P = 0.167 at τi = 1.57 MPa; the experimental interface shear stress (τi) decreases from τi = 34 MPa at N = 1000 to τi = 9.2 MPa at N = 60,000; and the experimental dissipated energy (ΔW) increases from ΔW = 8.4 kPa at N = 1000 to ΔW = 32.4 kPa at N = 60,000.
Under σmax = 140 MPa and f = 0.1 Hz, the experimental cycle-dependent dissipated energy (ΔW) increases from ΔW = 12.7 kPa at τi = 23 MPa to ΔW = 34.2 kPa at τi = 8.7 MPa; the broken fiber fraction (P) increases from P = 0.001 at τi = 150 MPa to P = 0.167 at τi = 1.57 MPa; the experimental interface shear stress (τi) decreases from τi = 23 MPa at N = 1000 to τi = 8.7 MPa at N = 30,000; and the experimental dissipated energy (ΔW) increases from ΔW = 12.7 kPa at N = 1000 to ΔW = 34.2 kPa at N = 30,000.
At T = 1200 °C in steam, under σmax = 140 MPa and f = 1 Hz, the experimental cycle-dependent dissipated energy (ΔW) increases from ΔW = 8.5 kPa at τi = 34 MPa to ΔW = 18.1 kPa at τi = 16.3 MPa; the broken fiber fraction (P) increases from P = 0.001 at τi = 150 MPa to P = 0.167 at τi = 1.57 MPa; the experimental interface shear stress (τi) decreases from τi = 34 MPa at N = 1000 to τi = 16.3 MPa at N = 30,000; and the experimental dissipated energy (ΔW) increases from ΔW = 8.5 kPa at N = 1000 to ΔW = 18.1 kPa at N = 30,000.
At T = 1200 °C in steam, under σmax = 140 MPa and f = 0.1 Hz, the experimental cycle-dependent dissipated energy (ΔW) increases with decreasing interface shear stress—i.e., from ΔW = 14.8 kPa at τi = 20 MPa to ΔW = 27 kPa at τi = 11 MPa; the broken fiber fraction (P) increases from P = 0.001 at τi = 150 MPa to P = 0.167 at τi = 1.57 MPa; the experimental interface shear stress (τi) decreases from τi = 20 MPa at N = 100 to τi = 11 MPa at N = 10000; and the experimental dissipated energy (ΔW) increases from ΔW = 14.8 kPa at N = 100 to ΔW = 27 kPa at N = 10000.
4.4. Discussion
The evolution curves of cycle-dependent interface shear stress (τi(N)) and broken fiber fraction (P(N)) versus cycle number of 2.5D woven self-healing Hi-NicalonTM SiC/[Si-B-C] composite under different peak stresses at T = 600 °C and 1200 °C in an air atmosphere are shown in Figure 11. For 2.5D SiC/[Si-B-C] composite, the temperature is a governing parameter for the fatigue damage process. When the temperature increases from T = 600 °C to 1200 °C, the interface shear stress decreases a lot, and the interface shear stress degradation rate and broken fiber fraction increase with peak stress.
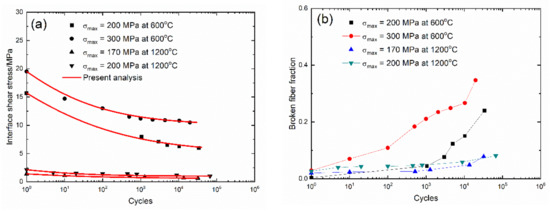
Figure 11.
(a) Experimental and predicted interface shear stress (τi) versus cycle number curves; and (b) the broken fiber fraction (P) versus cycle number curves of 2.5D woven self-healing Hi-NicalonTM SiC/[Si-B-C] composite at 600 °C and 1200 °C in air and in steam atmospheres.
At T = 600 °C and σmax=200 MPa, the interface shear stress (τi) decreases from τi = 15.7 MPa at N = 1 to τi = 6.0 MPa at N = 33788, and the broken fiber fraction (P) increases from P = 0.004 to P = 0.24; and under σmax = 300 MPa, the interface shear stress (τi) decreases from τi = 19.5 MPa at N = 1 to τi = 10.5 MPa at N = 19,812, and the broken fiber fraction (P) increases from P = 0.029 to P = 0.347. However, at T = 1200 °C and under σmax = 170 MPa, the interface shear stress (τi) decreases from τi = 5.5 MPa at N = 1 to τi = 1.7 MPa at N = 32,334, and the broken fiber fraction (P) increases from P = 0.0007 to P = 0.12; and under σmax = 200 MPa, the interface shear stress (τi) decreases from τi = 5.1 MPa at N = 1 to τi = 2 MPa at N = 66794, and the broken fiber fraction (P) increases from P = 0.0008 to P = 0.14.
The evolution curves of cycle-dependent interface shear stress (τi(N)) and the broken fiber fraction (P(N)) versus cycle number of 2D woven self-healing Hi-NicalonTM SiC/[SiC-B4C] composite under σmax = 140 MPa at T = 1200 °C in air and in steam atmospheres with f = 0.1 and 1Hz are shown in Figure 12. For the 2D SiC/[SiC-B4C] composite, the loading frequency is the governing parameter for the fatigue process. Under σmax = 140 MPa, at the same cycle number, the interface shear stress (τi) decreases with decreasing loading frequency, and the interface shear stress in a steam atmosphere is lower than that in an air atmosphere; and the broken fiber fraction (P) increases with decreasing loading frequency, and the broken fiber fraction in a steam atmosphere is higher than that in an air atmosphere.
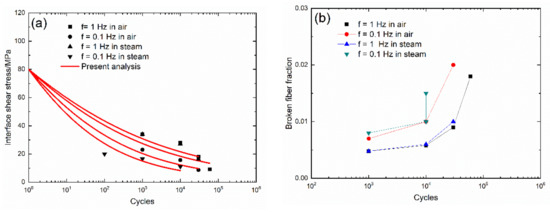
Figure 12.
(a) Experimental and predicted interface shear stress (τi) versus cycle number curves; and (b) the broken fiber fraction (P) versus cycle number curves of 2D woven self-healing Hi-NicalonTM SiC/[SiC-B4C] composite under σmax = 140 MPa at 1200 °C in air and in steam atmospheres.
At T = 1200 °C in an air atmosphere with f = 1 Hz, the interface shear stress (τi) decreases from τi = 34 MPa at N = 1000 to τi = 9.2 MPa at N = 60,000, and the broken fiber fraction (P) increases from P = 0.0048 to P = 0.018; when f = 0.1 Hz, the interface shear stress (τi) decreases from τi = 23 MPa at N = 1000 to τi = 8.7 MPa at N = 30,000, and the broken fiber fraction (P) increases from P = 0.007 to P = 0.02. At T = 1200 °C in a steam atmosphere and f = 1 Hz, the interface shear stress (τi) decreases from τi = 34 MPa at N = 1000 to τi = 16.3 MPa at N = 30,000, and the broken fiber fraction (P) increases from P = 0.0048 to P = 0.01; and when f = 0.1 Hz, the interface shear stress (τi) decreases from τi = 20 MPa at N = 100 to τi = 11 MPa at N = 10000, and the broken fiber fraction (P) increases from P = 0.008 to P = 0.015.
5. Conclusions
In this paper, cycle-dependent damage evolution of self-healing 2.5D woven Hi-NicalonTM SiC/[Si-B-C] and 2D woven Hi-NicalonTM SiC/[SiC-B4C] composites under different peak stresses and loading frequencies at T = 600 °C and 1200 °C are investigated. The damage parameters of internal friction (∆W/We), dissipated energy (∆W), Kachanov’s damage parameter (D), broken fiber fraction (P), and interface shear stress (τi) are used to describe fatigue damage evolution.
- (1)
- For 2.5D woven self-healing Hi-NicalonTM SiC/[Si-B-C] composite, temperature is a governing parameter for the fatigue process. At T = 600 °C in an air atmosphere, ∆W/We first decreases and then increases with cycle number; and at T = 1200 °C in an air atmosphere, ∆W/We decreases with cycle number. The degradation rate of the interface shear stress and broken fiber faction increases with peak stress.
- (2)
- For 2D woven self-healing Hi-NicalonTM SiC/[SiC-B4C] composite at T = 1200 °C, loading frequency is a governing parameter for the fatigue process. ∆W increases with cycle number; under σmax = 140 MPa, at the same applied cycle number, the interface shear stress decreases with the loading frequency, and the interface shear stress in a steam atmosphere is lower than that in an air atmosphere, and the broken fiber fraction increases with decreasing loading frequency, and the broken fiber fraction in a steam atmosphere is higher than that in an air atmosphere.
Author Contributions
Conceptualization, L.L., P.R., G.F.; methodology, L.L., P.R., G.F.; writing—original draft preparation, L.L., P.R., G.F.; writing—review and editing, P.R., G.F. All authors have read and agreed to the published version of the manuscript.
Funding
This research was funded by Fundamental Research Funds for the Central Universities of China, grant number NS2019038.
Acknowledgments
The authors also wish to thank five anonymous reviewers and editors for their helpful comments on an earlier version of the paper.
Conflicts of Interest
The authors declare no conflict of interest. The funders had no role in the design of the study; in the collection, analyses, or interpretation of data; in the writing of the manuscript, or in the decision to publish the results.
Nomenclature
| rf | fiber radius |
| lc | matrix crack spacing |
| ld | fiber/matrix interface debonding length |
| ly | fiber/matrix interface counter slip length |
| lz | fiber/matrix interface new slip length |
| σmax | fatigue peak stress |
| σmin | fatigue valley stress |
| ΦU | intact fiber stress upon unloading |
| ΦR | intact fiber stress upon reloading |
| εU | unloading composite strain |
| εR | reloading composite strain |
| τi | fiber/matrix interface shear stress |
| αf | fiber thermal expansional coefficient |
| αc | composite thermal expansional coefficient |
| ΔT | temperature difference between tested and fabricated temperature |
| Ef | fiber elastic modulus |
| We | maximum elastic energy stored during the cycle |
| ΔW | hysteresis dissipated energy |
| E0 | Young’s modulus of undamaged composite |
| E | mean slope of hysteresis loop |
| D | Kachanov’s damage parameter |
References
- Naslain, R. Design, preparation and properties of non-oxide CMCs for application in engines and nuclear reactors: An overview. Compos. Sci. Technol. 2004, 64, 155–170. [Google Scholar] [CrossRef]
- Bendnarcyk, B.A.; Mital, S.K.; Pineda, E.J.; Arnold, S.M. Multiscale modeling of ceramic matrix composites. In Proceedings of the 56th AIAA/ASCE/AHS/ASC Structures, Structural Dynamics, and Materials Conference, Kissimmee, FL, USA, 5–9 January 2015. [Google Scholar] [CrossRef]
- Padture, N.P. Advanced structural ceramics in aerospace propulsion. Nat. Mater. 2016, 15, 804. [Google Scholar] [CrossRef] [PubMed]
- Steibel, J.; Blank, J.; Dix, B. Ceramic matrix composites at GE Aviation. In Proceedings of the Advanced Ceramic Matrix Composites: Science and Technology of Materials, Design, Applications, Performance and Integration, LaFonda on the Plaza, Santa Fe, NM, USA, 5–9 November 2017. [Google Scholar]
- Zhu, S.J.; Mizuno, M.; Kagawa, Y.; Mutoh, Y. Monotonic tension, fatigue and creep behavior of SiC-fiber-reinforced SiC-matrix composites: A review. Compos. Sci. Technol. 1999, 59, 833–851. [Google Scholar] [CrossRef]
- Ruggles-Wrenn, M.B.; Christensen, D.T.; Chamberlain, A.L.; Lane, J.E.; Cook, T.S. Effect of frequency and environment on fatigue behavior of a CVI SiC/SiC ceramic matrix composite at 1200 °C. Compos. Sci. Technol. 2011, 71, 190–196. [Google Scholar] [CrossRef]
- Ruggles-Wrenn, M.B.; Jones, T.P. Tension-tension fatigue of a SiC/SiC ceramic matrix composite at 1200°C in air and in steam. Int. J. Fatigue 2013, 47, 154–160. [Google Scholar] [CrossRef]
- Li, L.B. Damage and failure of fiber-reinforced ceramic-matrix composites subjected to cyclic fatigue, dwell fatigue and thermomechanical fatigue. Ceram. Int. 2017, 43, 13978–13996. [Google Scholar] [CrossRef]
- Racle, E.; Godin, N.; Reynaud, P.; Fantozzi, G. Fatigue lifetime of ceramic matrix composites at intermediate temperature by acoustic emission. Materials 2017, 10, 658. [Google Scholar] [CrossRef]
- Ikarashi, Y.; Ogasawara, T.; Aoki, T. Effects of cyclic tensile loading on the rupture behavior of orthogonal 3-D woven SiC fiber/SiC matrix composites at elevated temperatures in air. J. Eur. Ceram. Soc. 2019, 39, 806–812. [Google Scholar] [CrossRef]
- Murthy, L.N.; Nemeth, N.N.; Brewer, D.N.; Mital, S. Probabilistic analysis of a SiC/SiC ceramic matrix composite turbine vane. Compos. Part B Eng. 2008, 39, 694–703. [Google Scholar] [CrossRef]
- Santhosh, U.; Ahmad, J.; John, R.; Ojard, G.; Miller, R.; Gowayed, Y. Modeling of stress concentration in ceramic matrix composites. Compos. Part B Eng. 2013, 45, 1156–1163. [Google Scholar] [CrossRef]
- Li, L.B. Advanced SiC/SiC composite system. In Comprehensive Composite Materials II; Beaumont, P.W.R., Zweben, C.H., Eds.; Academic Press: Oxford, UK, 2018; Volume 5, pp. 41–85. [Google Scholar] [CrossRef]
- Lamouroux, F.; Camus, G.; Thebault, J. Kinetics and mechanisms of oxidation of 2D woven C/SiC composites: I, Experimental approach. J. Am. Ceram. Soc. 1994, 77, 2049–2057. [Google Scholar] [CrossRef]
- Hay, R.S.; Chater, R.J. Oxidation kinetics strength of Hi-NicalonTM-S SiC fiber after oxidation in dry and wet air. J. Am. Ceram. Soc. 2017, 100, 4110–4130. [Google Scholar] [CrossRef]
- Viricelle, J.P.; Goursat, P.; Bahloul-Hourlier, D. Oxidation behavior of a multi-layered ceramic-matrix composite (SiC)f/C/(SiBC)m. Compos. Sci. Technol. 2001, 61, 607–614. [Google Scholar] [CrossRef]
- Bouillon, E.; Abbe, F.; Goujard, S.; Pestourie, E.; Habarou, G. Mechanical and thermal properties of a self-sealing matrix composite and determination of the life time duration. Ceram. Eng. Sci. Proc. 2002, 21, 459–467. [Google Scholar] [CrossRef]
- Ruggles-Wrenn, M.B.; Delapasse, J.; Chamberlain, A.L.; Lane, J.E.; Cook, T.S. Fatigue behavior of a Hi-NicalonTM/SiC-B4C composite at 1200 °C in air and in steam. Mater. Sci. Eng. A 2012, 534, 119–128. [Google Scholar] [CrossRef]
- Ruggles-Wrenn, M.B.; Kurtz, G. Notch sensitivity of fatigue behavior of a Hi-NicalonTM/SiC-B4C composite at 1200 °C in air and in steam. Appl. Compos. Mater. 2013, 20, 891–905. [Google Scholar] [CrossRef]
- Ruggles-Wrenn, M.B.; Lee, M.D. Fatigue behavior of an advanced SiC/SiC composite with a self-healing matrix at 1300 °C in air and in steam. Mater. Sci. Eng. A 2016, 677, 438–445. [Google Scholar] [CrossRef]
- Reynaud, P.; Rouby, D.; Fantozzi, G. Cyclic fatigue behaviour at high temperature of a self-healing ceramic matrix composite. Ann. Chim. Sci. Mater. 2005, 30, 649–658. [Google Scholar] [CrossRef]
- Carrere, P.; Lamon, J. Fatigue behavior at high temperature in air of a 2D woven SiC/SiBC with a self healing matrix. Key Eng. Mater. 1999, 164–165, 321–324. [Google Scholar] [CrossRef]
- Forio, P.; Lamon, J. Fatigue behavior at high temperatures in air of a 2D SiC/Si-B-C composite with a self-healing multilayered matrix. Adv. Ceram. Matrix Compos. VII 2001. [Google Scholar] [CrossRef]
- Simon, C.; Rebillat, F.; Camus, G. Electrical resistivity monitoring of a SiC/[Si-B-C] composite under oxidizing environments. Acta Mater. 2017, 132, 586–597. [Google Scholar] [CrossRef]
- Simon, C.; Rebillat, F.; Herb, V.; Camus, G. Monitoring damage evolution of SiCf/[Si-B-C]m composites using electrical resistivity: Crack density-based electromechanical modeling. Acta Mater. 2017, 124, 579–587. [Google Scholar] [CrossRef]
- Moevus, M.; Reynaud, P.; R’Mili, M.; Godin, N.; Rouby, D.; Fantozzi, G. Static fatigue of a 2.5D SiC/[Si-B-C] composite at intermediate temperature under air. Adv. Sci. Technol. 2006, 50, 141–146. [Google Scholar] [CrossRef]
- Reynaud, P. Cyclic fatigue of ceramic-matrix composites at ambient and elevated temperatures. Compos. Sci. Technol. 1996, 56, 809–814. [Google Scholar] [CrossRef]
- Dalmaz, A.; Reynaud, P.; Rouby, D.; Fantozzi Abbe, F. Mechanical behavior and damage development during cyclic fatigue at high-temperature of a 2.5D carbon/sic composite. Compos. Sci. Technol. 1998, 58, 693–699. [Google Scholar] [CrossRef]
- Fantozzi, G.; Reynaud, P. Mechanical hysteresis in ceramic matrix composites. Mater. Sci. Eng. Part A Struct. 2009, 521–522, 18–23. [Google Scholar] [CrossRef]
- Li, L.B. A hysteresis dissipated energy-based damage parameter for life prediction of carbon fiber-reinforced ceramic-matrix composites under fatigue loading. Compos. Part B Eng. 2015, 82, 108–128. [Google Scholar] [CrossRef]
- Li, L.B. Damage monitoring and life prediction of carbon fiber-reinforced ceramic-matrix composites at room and elevated temperatures using hysteresis dissipated energy-based damage parameter. Compos. Interface 2018, 25, 335–356. [Google Scholar] [CrossRef]
- Li, L.B.; Reynaud, P.; Fantozzi, G. Mechanical hysteresis and damage evolution in C/SiC composites under fatigue loading at room and elevated temperatures. Int. J. Appl. Ceram. Technol. 2019, 16, 2214–2228. [Google Scholar] [CrossRef]
- Li, L.B. Failure analysis of long-fiber-reinforced ceramic-matrix composites subjected to in-phase thermomechanical and isothermal cyclic loading. Eng. Fail. Anal. 2019, 104, 856–872. [Google Scholar] [CrossRef]
- Penas Olivia. Etude de Composites SiC/SiBC à Matrice Multiséquencée en Fatigue Cyclique à Hautes Températures Sous Air. Ph.D. Thesis, INSA de Lyon, Villeurbanne, France, 2002.
- Li, L.B. Time-dependent damage and fracture of fiber-reinforced ceramic-matrix composites at elevated temperatures. Compos. Interfaces 2019, 26, 963–988. [Google Scholar] [CrossRef]
- Budiansky, B.; Hutchinson, J.W.; Evans, A.G. Matrix fracture in fiber-reinforced ceramics. J. Mech. Phys. Solids 1986, 34, 167–189. [Google Scholar] [CrossRef]
- Evans, A.G. Design and life prediction issues for high-temperature engineering ceramics and their composites. Acta Mater. 1997, 45, 23–40. [Google Scholar] [CrossRef]


© 2020 by the authors. Licensee MDPI, Basel, Switzerland. This article is an open access article distributed under the terms and conditions of the Creative Commons Attribution (CC BY) license (http://creativecommons.org/licenses/by/4.0/).