Article

Review of Requirements for the Durability and Damage Tolerance Certification of Additively Manufactured Aircraft Structural Parts and AM Repairs

1
Centre of Expertise for Structural Mechanics, Department of Mechanical and Aerospace Engineering, Monash University, Clayton, Victoria 3800, Australia
2
Department of Mechanical Engineering, Indian Institute of Technology Bombay, Powai, Mumbai, Maharashtra 400076, India
3
RUAG Australia, 836 Mountain Highway, Bayswater VIC 315, Australia
4
Department of Chemical Engineering, Monash University, Clayton, Victoria 3800, Australia
*
Author to whom correspondence should be addressed.
Materials 2020, 13(6), 1341; https://doi.org/10.3390/ma13061341
Submission received: 9 February 2020 / Revised: 6 March 2020 / Accepted: 12 March 2020 / Published: 15 March 2020
(This article belongs to the Special Issue Additively Manufactured Metallic Materials)

Abstract

:
The USAF requirements for the durability and damage tolerance certification for additively manufactured (AM) aircraft structural parts, which are detailed in Structures Bulletin EZ-19-01, raise a number of new and, as yet, unanswered questions. The present paper attempts to address three questions: How to perform a fracture mechanics-based analysis of crack growth in an AM part so as to account for the residual stresses, how to perform a fracture mechanics-based durability analysis of a cold spray repair so as to account for both the induced residual stresses and the presence of multiple co-located cracks, and how to perform a fracture mechanics-based durability analysis of an AM part so as to account for the presence of multiple collocated surface braking cracks. In this context, the present paper reveals the potential of the Hartman–Schijve variant of the NASGRO crack growth equation to accurately predict the growth of each of the individual (collocated) cracks that arose in a cold spray-repaired specimen and in a specimen from a crack that nucleated and grew from a rough surface.

1. Introduction

The March 2019 memo by the Under Secretary, Acquisition and Sustainment [1] enunciated that, as of March 21st 2019, the US Department of Defense (DoD) will use additive manufacturing (AM) to “enable the transformation of maintenance operations and supply chains, increase logistics resiliency, and improve self-sustainment and readiness for DoD forces.” This memo further stated that: “AM parts or AM repair processes can be used in both critical and non-critical applications. For all applications, the appropriate level of qualification, certification, and risk/safety evaluation must be completed by the appropriate engineering support activity.” This statement represents a significant development since, until recently, the focus has been on “low hanging fruit,” i.e., non-critical parts that do not affect the safety of flight. Indeed, as implied in [1] and as reflected in [2,3], AM offers the potential for the “on-demand” manufacturing of structural parts, albeit with a life that may be less than the original design life but nevertheless sufficient to ensure continued operational capability until a conventionally manufactured replacement part can be obtained. USAF Structures Bulletin EZ-19-01 [3,4] subsequently outlined the USAF requirements for the durability and damage tolerance certification for AM aircraft structural parts and AM repairs, such as cold spray. Structures Bulletin EZ-19-01 states that for structural parts that are manufactured from an AM process, the most difficult challenge is to establish an “accurate prediction of structural performance” specific to DADT (durability and damage tolerance). Several challenges to which there are no current answers arise directly from Structures Bulletin EZ-19-10:
(i)
How can we accurately compute crack growth in an AM part when there is a residual stress field?
(ii)
How can we accurately compute crack growth in a cold spray repair where cracking can nucleate, either in the substructure being repaired or at the intersection between the cold spray?
(iii)
How can we accurately perform a durability analysis for a cold spray repair if there are collocated cracks?
(iv)
Can we relate da/dN versus ΔK equations, where da/dN is the crack growth rate and ΔK is the difference between the maximum and minimum values of the stress intensity factor in a load cycle, the crack growth rate needed to perform items (i) through (iii) to the corresponding curves determined for the conventionally manufactured material?
In this context, it should be noted that Section 5 of MIL-STD-1530D [5] explains that analysis is the key to both the damage tolerant design and the through life sustainment of USAF aircraft, and that the primary role of full scale testing is “to validate or correct analysis methods and results and to demonstrate that requirements are achieved”.
To answer these questions, a “building block” approach is adopted. It is first shown that the Hartman–Schijve variant of the NASGRO crack growth equation [6,7,8,9,10] can be used to compute crack growth in AM, and to compute the effect of residual stresses on crack growth in problems involving laser shot peening (LSP) and friction stir welding (FSW). Laser shock peening, which uses short-time (nanosecond) laser pulses to vaporize the material on the surface of a specimen, is now being widely used in the aerospace industry, and applications to both F-22 and F-35 aircraft were discussed in [11,12]. The ability of LSP to improve the fatigue life of a component is believed to be due to the residual stresses that arise from the LSP process [12,13,14,15]. As a result, LSP has been shown to be particularly effective as a post processing tool to improve the fatigue performance of additively manufactured parts [14,15]. Friction stir welding, which was invented by Wayne Thomas and colleagues at The Welding Institute in Cambridge [16,17], is also recognized [18] as a “key technology” for primary aerospace structures. Crack growth in FSW components also involves the interaction between the applied loads and the residual stresses [18,19,20].
In this context, it should be noted that it has long been known that the residual stresses resulting from the manufacturing processes can significantly influence crack growth in laser shock peened parts, AM parts, and FSW parts [18,19,20,21,22,23]. It is now known [24,25,26,27] that, for welded structures, provided that allowance is made for the effect that the residual stress intensity factor (Kres) has upon the true range of the stress intensity factor (∆Ktrue) and on the true value of the maximum stress intensity factor (Ktrue,max), then crack growth can often be reasonably accurately computed. Unfortunately, there are few studies regarding whether this observation has been shown to be true for AM parts.
In this paper, we have chosen to focus on the ability of the Hartman–Schijve variant of the NASGRO crack growth equation to answer questions (i) through (iv). The reason for this is that it is now known [6,7,8,9,10,28,29,30,31,32,33,34,35,36,37,38,39,40,41,42,43,44,45,46] that the Hartman–Schijve equation can be used to study crack growth in traditionally manufactured aerospace aluminum and titanium alloys, aerospace steels, rail steels, bridge steels, adhesively-bonded metallic structures, and adhesively-bonded wood structures. The Hartman–Schijve equation has also been shown to be able to represent crack growth in cold spray repairs [46,47], AM materials [3,48,49,50], and delamination growth in polymer composites [51,52,53,54,55,56,57,58,59]. Aerospace-related examples that illustrate the ability of the Hartman–Schijve equation to accurately compute the crack growth histories that are obtained in conventionally manufactured metallic structures tested under an operational flight load spectra include:
(i)
The growth of small, naturally occurring cracks in the 1969 F-111 D6ac wing test [6,32].
(ii)
The growth of small, naturally occurring cracks in an aluminum alloy AA7050-T7451 plate simulating a combat aircraft wing root shear restraint (or shear tie post) subject to a combined aerodynamic buffet and maneuver load spectrum [33].
(iii)
Cracking in an aluminum alloy AA7050-T7451 plate that was tested under a civil aircraft flight load spectrum (MiniTWIST) [34].
(iv)
The growth of both small and long cracks in AA7075-T6 under measured maritime patrol aircraft (P3C Orion) flight load spectra [29,31].
(v)
The growth of small, naturally occurring cracks in an aluminum alloy AA7050-T7451 plate that was tested under a F/A-18 flight load spectrum [6,9,33].
Furthermore, not only is it known that the Hartman–Schijve equation is able to represent crack growth in a range of AM materials, it has also been shown [3,48,49,50] that the Hartman–Schijve crack growth equation holds for AM Ti-6Al-4V regardless of whether the AM process is electron beam melting (EBM), direct metal laser sintering (DMLS), selective laser melt (SLM), hot isostatic pressing (HIP), and laser engineered net shaping (LENS). In the case of LENS Ti-6Al-4V, this has been shown to be true regardless of whether the LENS process is low- or high-power or whether the build direction is horizontal or vertical. Indeed, it has been shown [50] that the growth of small sub mm cracks in LENS Ti-6Al-4V is captured by the same Hartman–Schijve equation with the fatigue threshold set to a small value. (This finding is particularly relevant to the durability/economic life assessment of an AM replacement part where the equivalent initial size (EIDS) required is small (e.g., sub mm) [4].).
Similarly, it has been shown [46] that for cold spray repair, which is sometimes referred to as supersonic particle deposition (SPD) [47] which is also being used to repair damaged aircraft structures [46,60,61,62,63,64], the Hartman–Shijve equation can be used to compute the fastest growing crack in the substrate.
As a result of this study, we find that:
(a)
The Hartman–Schijve crack growth equation has the potential to perform a fracture mechanics-based analysis of crack growth in AM materials with a known residual stress field.
(b)
It can also be used to perform a fracture mechanics-based durability analysis of crack growth in cold spray repairs when there are multiple collocated cracks.
(c)
It has the potential to analyze crack growth that is associated with multiple surface breaking cracks.
These findings are significant given the central role that analysis has in the certification of AM and AM repairs and that, as noted, the above role of testing is to validate or correct analysis methods.

2. Materials and Methods

The studies analyzed in this paper were either taken from peer reviewed journals that are publicly available or from texts that are publicly available—their ISBN number is quoted. Similarly, the references used in this paper were taken from peer reviewed journals that are publicly available, refereed conferences, texts that are publicly available (in such cases, the ISBN number is quoted), or from Google searches. Of these references, seventy seven are in journals listed in SCOPUS and World of Science (WOS), the seven books/book chapters referenced are all listed in SCOPUS, one report is on the North American Space Administration (NASA) Technical Report Server, two references are contained in the proceedings of 13th International Conference on Materials (ICM13) with the ISBN number is given, two references are available on the US Department of Defense DTIC website, one is on the NATO-RTO web site, one is on the US Federal Aviation Administration (FAA) website, and another is on the US Navy navy.mil website. Keywords that were used in these searchers were cold spray, supersonic particle deposition (SPD), durability, damage tolerance, Hartman–Schijve, friction stir wording, laser shot peening, small cracks, additive manufacturing, AM, crack growth in operational aircraft, full scale fatigue tests, and aircraft certification, among others. The exception to this is the memo from the Under Secretary, Acquisition and Sustainment [1], which is unclassified and has no release restriction; this was provided by RUAG Switzerland.
The analysis presented in this paper began by using the Hartman–Schijve variant [13] of the NASA NASGRO crack growth equation to compute the effect of the residual stress field on crack growth in an FSW Ti-6Al-4V specimen. This crack growth equation was then used in each of the subsequent analyses, viz: crack growth in a laser shot peened, AM, and cold spray-repaired specimens.
The general form of the Hartman–Schijve variant of the NASGRO equation that was used in this paper is as given in [22]:
da/dN = D (Δκ)p
where a is the crack length/depth, N is the number of cycles, D is a material constant, p is another material constant that is often approximately 2, and A is the cyclic fracture toughness. The crack driving force Δκ that is used in this formulation was first suggested by Schwalbe [65]:
Δκ = (ΔK − ΔKthr)/(1 − Kmax/A)1/2
where K is the stress intensity factor, Kmax and Kmin are the maximum and minimum values of stress intensity factor seen in the cycle, ∆K = (KmaxKmin ) is the range of the stress intensity factor that is seen in the cycle, and ΔKthr is the “effective fatigue threshold.” As explained in [6,48], the terms ΔKthr and A (which is commonly referred to as the cyclic fracture toughness) are best interpreted as parameters that are chosen so as to fit the measured da/dN versus ∆K data. As further explained in [48], the term ΔKthr is related to the US American Society for Testing and Materials (ASTM) definition of fatigue threshold ΔKth, which is arbitrarily be taken to be the value of ΔKth at a value of da/dN of 10−10 m/cycle, by:
ΔKth = ΔKthr + (10−10/D)1/p
A similar crack growth equation was presented in [66,67,68,69] and has been applied to a wide range of problems including both the growth of small surface breaking [67] and subsurface cracks [68]. The primary difference in these two related equations lies in the form of the denominator, i.e., how the increase in the crack growth rate as K approaches Kc (the fracture toughness) is represented; see [6] and the Appendix A for more details.
Reasons for focusing on the Hartman–Schijve equation for AM parts and additive metal repairs are:
(i)
It has been shown [3,48,49,50] that the variability in crack growth due to the AM manufacturing process can be captured by allowing for the variability in the terms ΔKthr and A.
(ii)
The Hartman–Schijve equation, with the threshold term ΔKthr set to a small value, is able to compute the growth of small cracks in LENS AM Ti-6Al-4V [50].
(iii)
The Hartman–Schijve equation is able to compute the variability in the growth of small cracks in laser additively deposited (LAD) metal repairs [49].
(iv)
It has been shown to capture the growth of the fastest cracks in cold spray repairs to cracked fastener holes in specimens that are cut from AA7075-T6 P3C Orion wing skins [46]. Here, it should be noted that its ability to capture the growth of multiple collocated cracks has not as yet been established. This is done in the present paper.
Though, as noted above, the present paper focuses on the use of the Hartman–Schijve crack growth equation, it should be noted that a range of other approaches are commonly used to study crack growth in conventionally manufactured materials [6]. For example, approaches that have been used to model crack growth in FSW include crack closure [70], AFGROW [71,72], NASGRO [20], and the two-parameter crack growth model [71]. As previously mentioned, a number of authors have suggested that fatigue crack growth in FSW joints is dominated by weld residual stress. The experimental data presented in [70,73,74] revealed that the effect of weld residual stress on crack growth is less at high R ratio than at the low R ratio, and that the da/dN versus ΔK curves associated with base metal and FSW joints tend to become closer in the Paris region. As such, it would appear that, as suggested in [9,10,18,19,20,21], the difference in the da/dN versus ΔK curves is essentially due to the residual stresses and that this difference may be accounted for by allowing for the residual stress field.
With this in mind, let us next examine whether this formulation can also capture crack growth in components with a complex residual stress field.

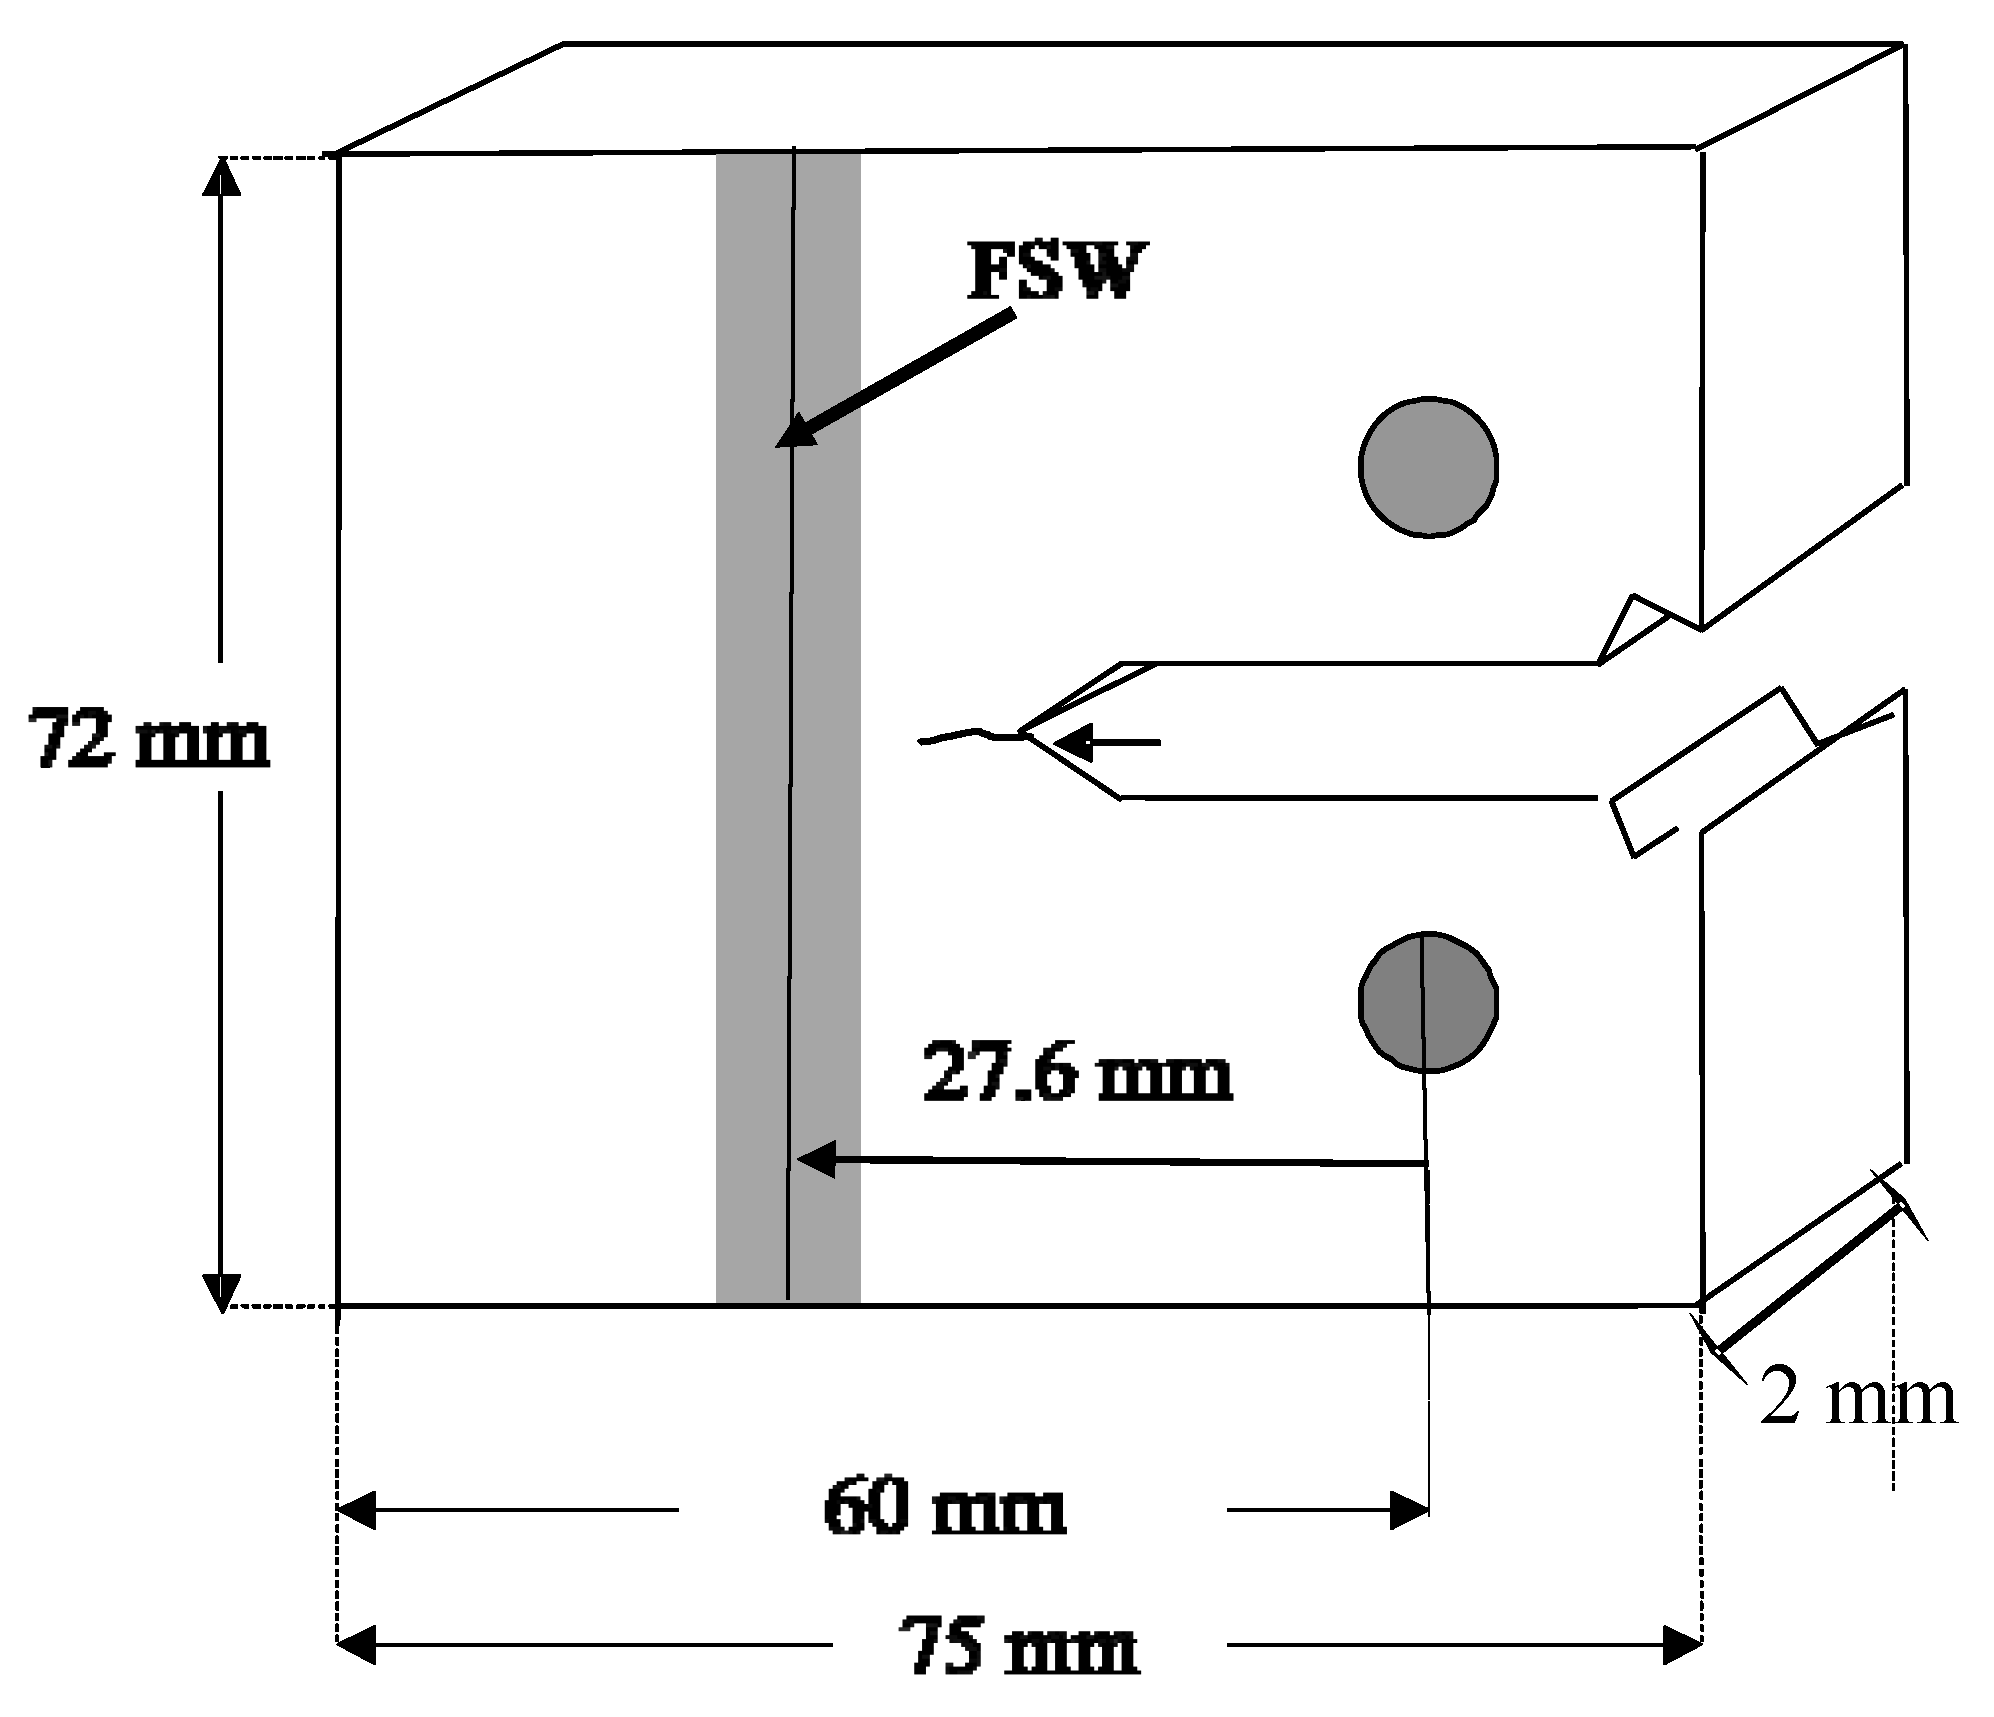
3. Crack Growth in FSW Ti-6Al-4V

Let us first consider cracking in 2 mm-thick Ti-6Al-4V FSW compact tension (CT) specimens reported in [72] that were tested with an applied ΔK of 30 MPa √m. The geometry of the test specimens is shown in Figure 1, and the variation of the residual stress intensity factor Kres, that resulted from FSW, is given in Figure 2 from [72].
It is now known [3,48,49,50] that the da/dN versus ΔK relationship for Mil-annealed Ti-6Al-4V can be expressed as:
da/dN = 2.79 × 10⁻¹⁰ [(ΔK − ΔKthr)/(1 − Kmax/A)1/2]2.12
The value of the cyclic fracture toughness A = 87.9 MPa √m for this material was given in [72]. To estimate the value of ΔKthr associated with R = 0.1 tests, we compared predictions that were made by using Equation (4) with the experimental R = 0.1 da/dN versus ΔK curve given in [72] for Mil-annealed Ti-6Al-4V. This yielded a value of ∆Kthr = 2.4 MPa √m. Figure 3 reveals a reasonably good agreement between the measured and the resultant computed da/dN versus ΔK crack growth curves.
Equation (4), with the values of A (=87.9 MPa √m) and ∆Kthr (=2.4 MPa √m) given above, was then used in conjunction with the variation in the residual stress intensity factor field as a function crack length given in [72] to compute the variation in the crack growth rate for an FSW specimen that was tested with ∆K = 30 MPa √m and R= 0.1. This analysis used the true range of the stress intensity factor, which we defined as ∆Ktrue, where:
Ktrue = Ktrue,maxKtrue,min
Ktrue,max = KmaxKres
Ktrue,min = KminKres
and
Ktrue = Ktrue,max
if      ΔKtrue < 0
This in turn results in an effective R ratio, which we define as Rtrue:
Rtrue = Ktrue,min/Ktrue,max
If the relationship between R and ΔKthr is not known, then an approximate value of the threshold term ΔKtrue,thr, which corresponds to Rtrue and can be estimated by using the formulae given by McEvily and Groeger [69]:
ΔKtrue,thr = ΔKthr (R = 0) √((1 − Rtrue)/(1 + Rtrue))
where ΔKthr (R = 0) is the value of the threshold term ΔKthr corresponding to an R ratio of zero; see the Appendix A.
The resultant measured [72] and predicted crack growth rate curves, obtained by using the methodology and the values outlined above, are shown in Figure 4 together with the crack growth rates that were computed in [72] by using AFGROW. In the present analysis, the residual stress field was first used to compute the value of Rtrue, and Equation (11) was then used to determine the value of ΔKtrue,thr to be used in Equation (4); see the Appendix A. Figure 4 reveals reasonably good agreement between the measured and the computed crack growth curves.

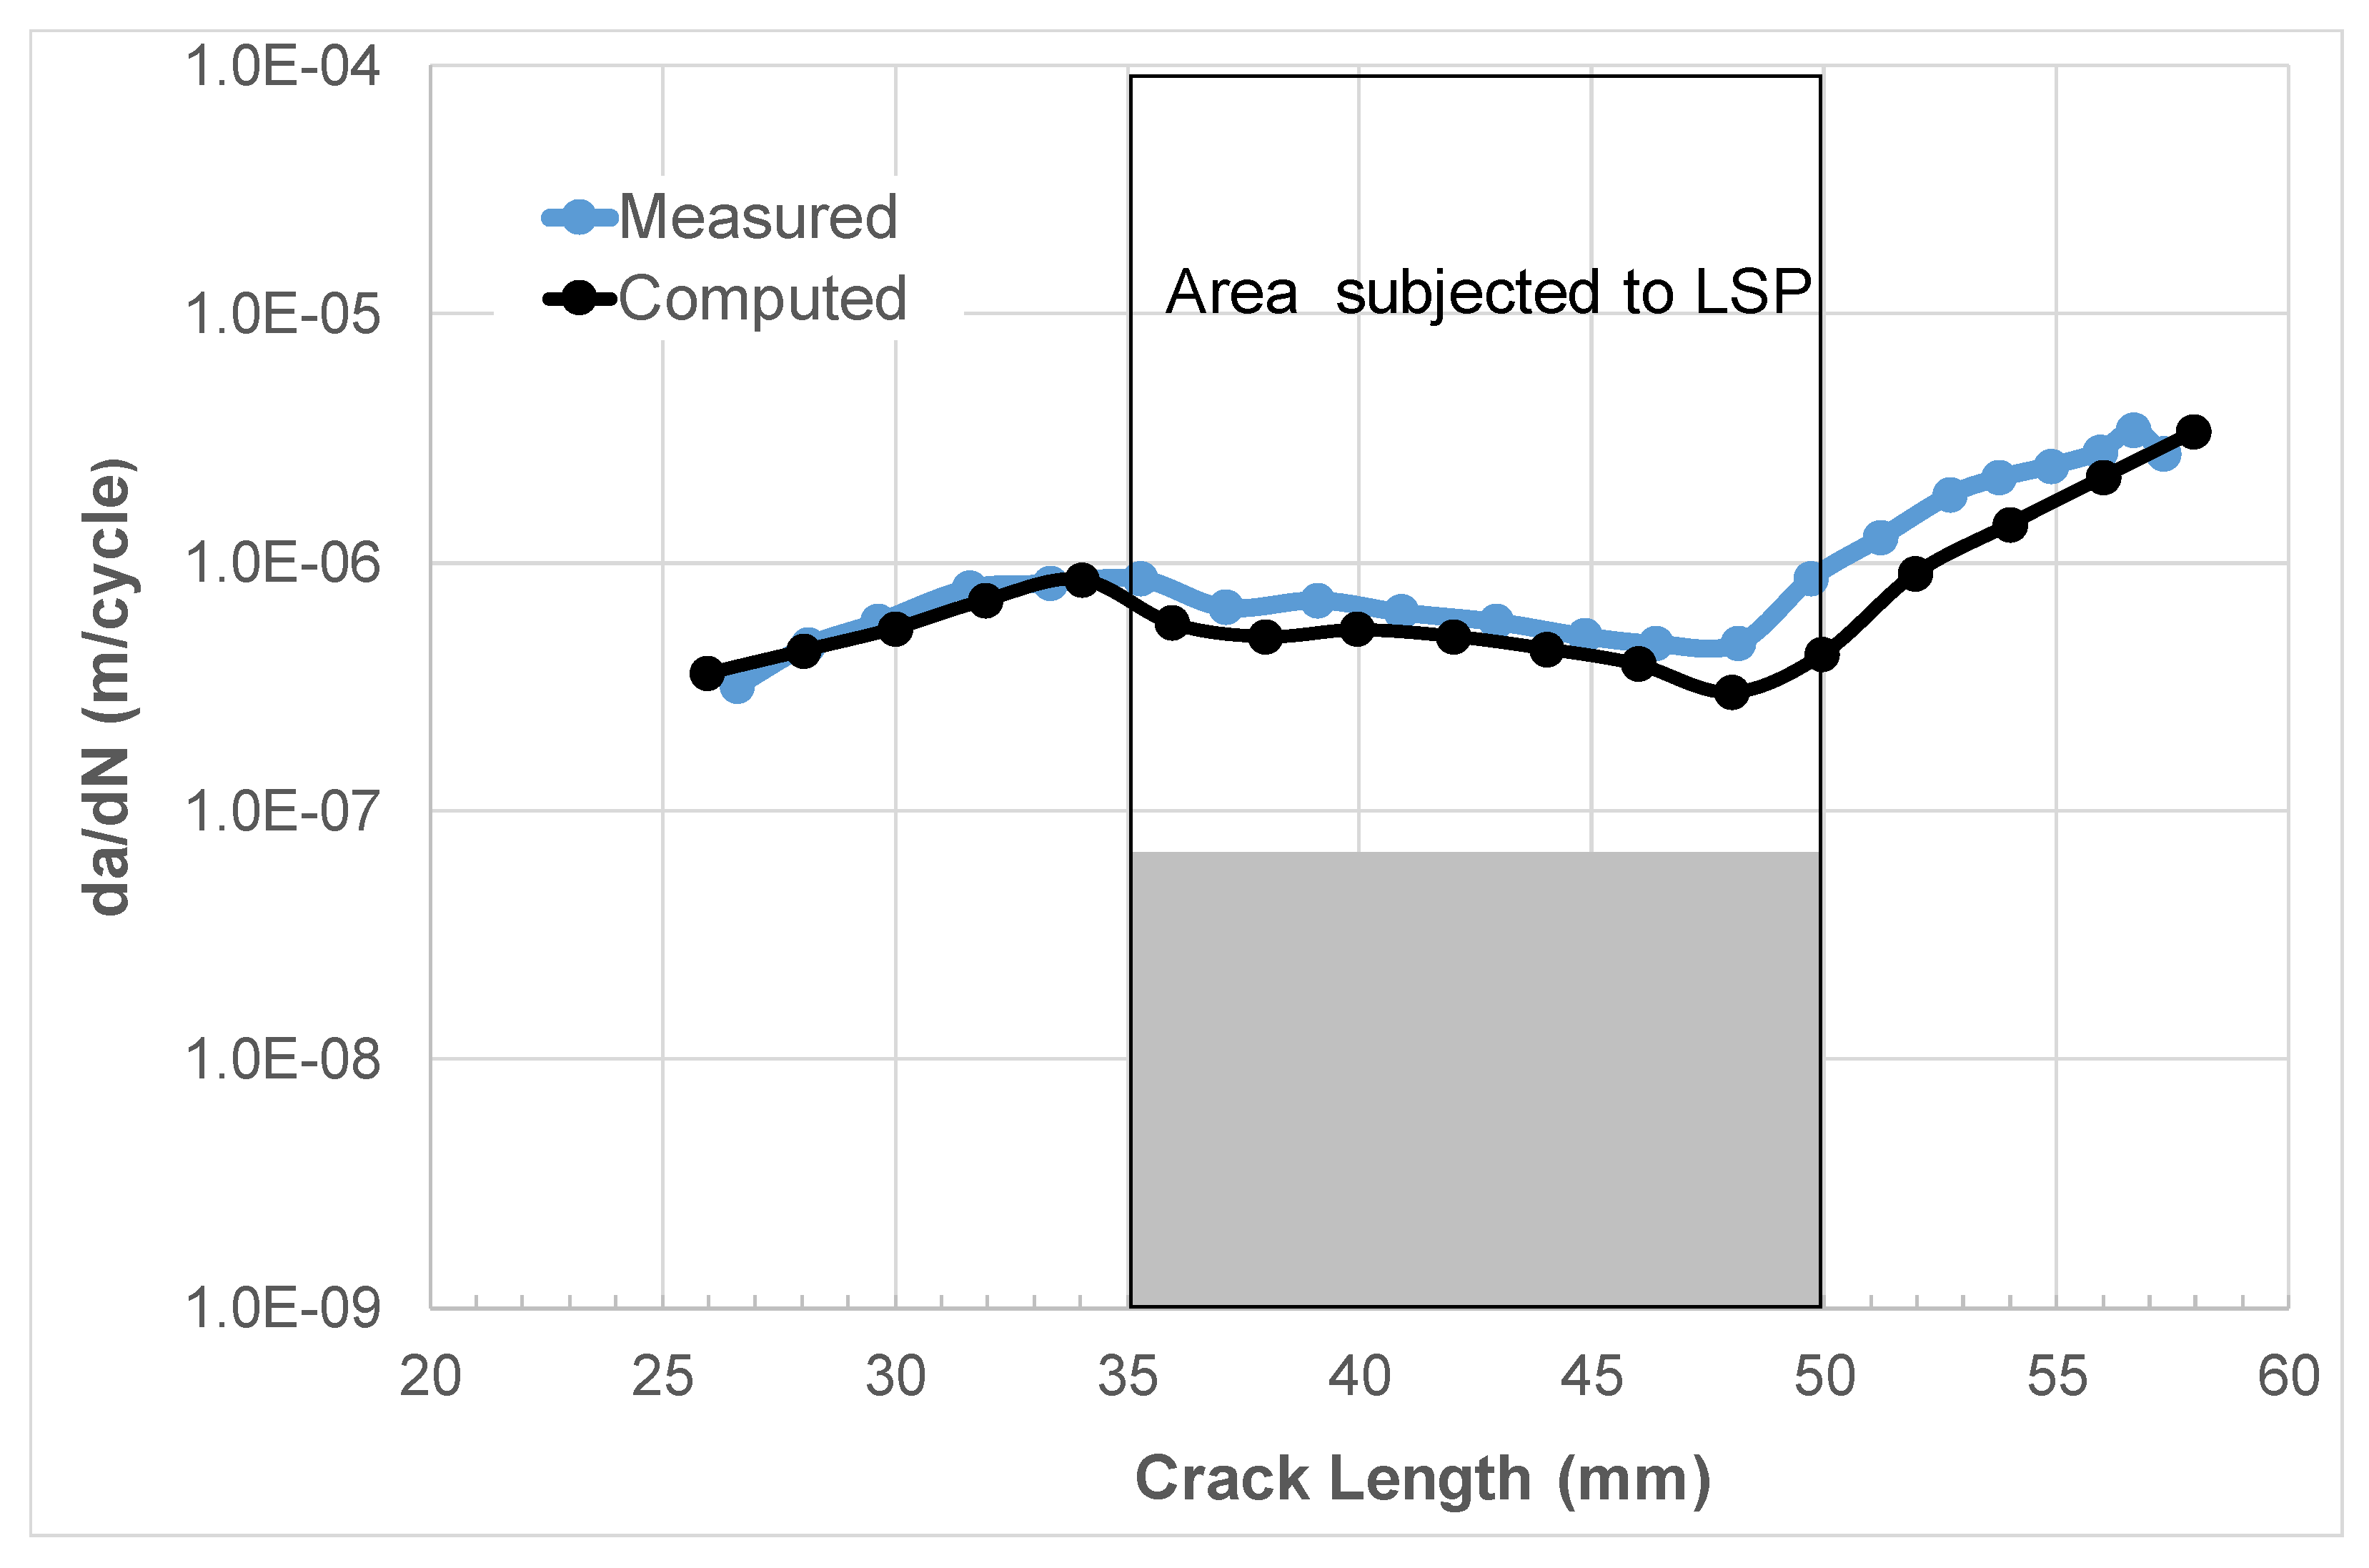
4. Crack Growth in Laser Shock Peened 2024-T3

As previously mentioned, laser shock peening (LSP) is used on both F-22 and F-35 aircraft. The challenge is to be able to account for the residual stresses that result from the use of LSP on crack growth. To address this challenge, let us next analyze cracking in the laser shot peened 4.8 mm compact tension 2024-T3 specimens reported in [75]. The geometry of the test specimens is shown in Figure 5. The relationship between the applied stress intensity factors Kmax and Kmin, ΔK, and the residual stress intensity factor Kres with crack length reported in [75] is shown in Figure 6. A plot of relationship between the true R ratio, Rtrue, and crack length seen in [75] is given in Figure 7.
Before we could compute the effect of the residual stress on crack growth, we needed the constants D, p and A in Equations (1) and (2) for this thickness material. These constants—D = 1.8 × 10⁻⁹, p = 2 and A = 45 MPa √m—were obtained from R = 0.5 and 0.05 crack growth data that were obtained from the NASGRO database. To do this, we represented the crack growth data by plotting da/dN against Δκ; see Figure 8. The values of ∆Kthr, D, A and p used in this analysis are given in Table 1.
By using the value of ∆Kthr (=2.65 MPa √m) associated with the R = 0.5 tests and Equation (11), we obtained a value of ΔKthr (R = 0) equal to approximately 4.65 MPa √m. This value together with the values of Kmax, Kmin, and Kres shown in Figure 6 and the values of D, A and p given in Table 1 were then used to compute the relationship between da/dN and the crack length (a). A comparison between the computed and measured curves is shown in Figure 9, where we see that, allowing for experimental error, there is a reasonably good agreement between the two curves.

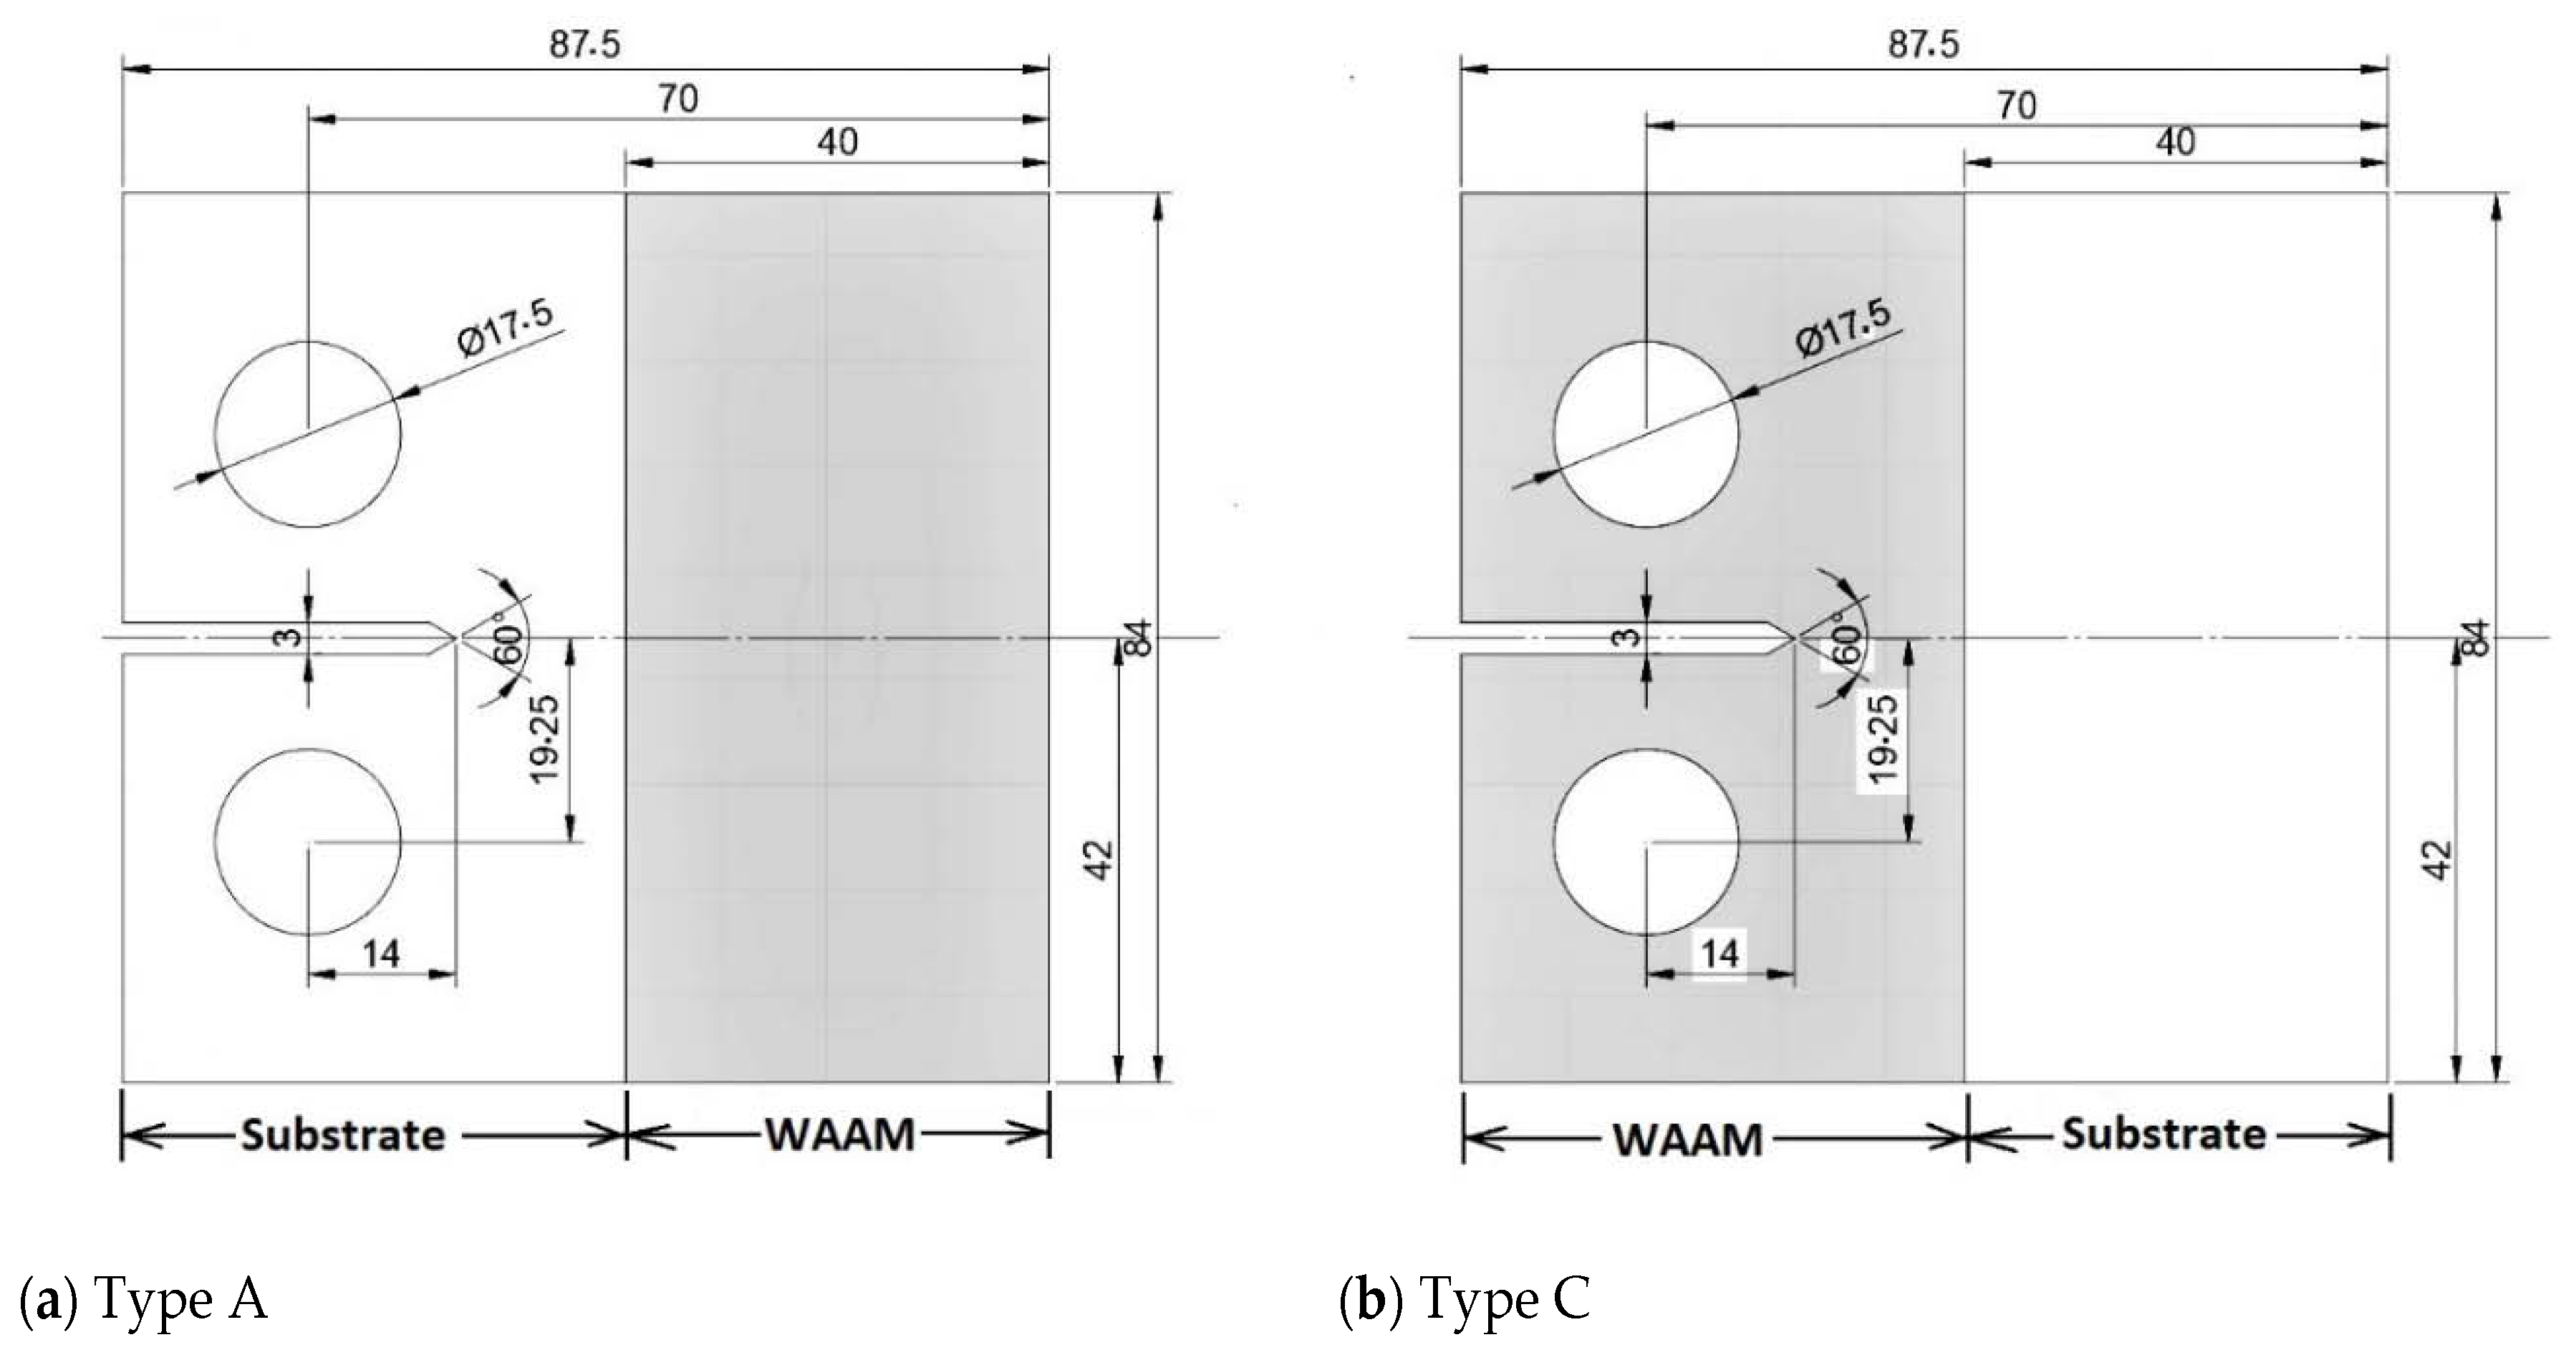
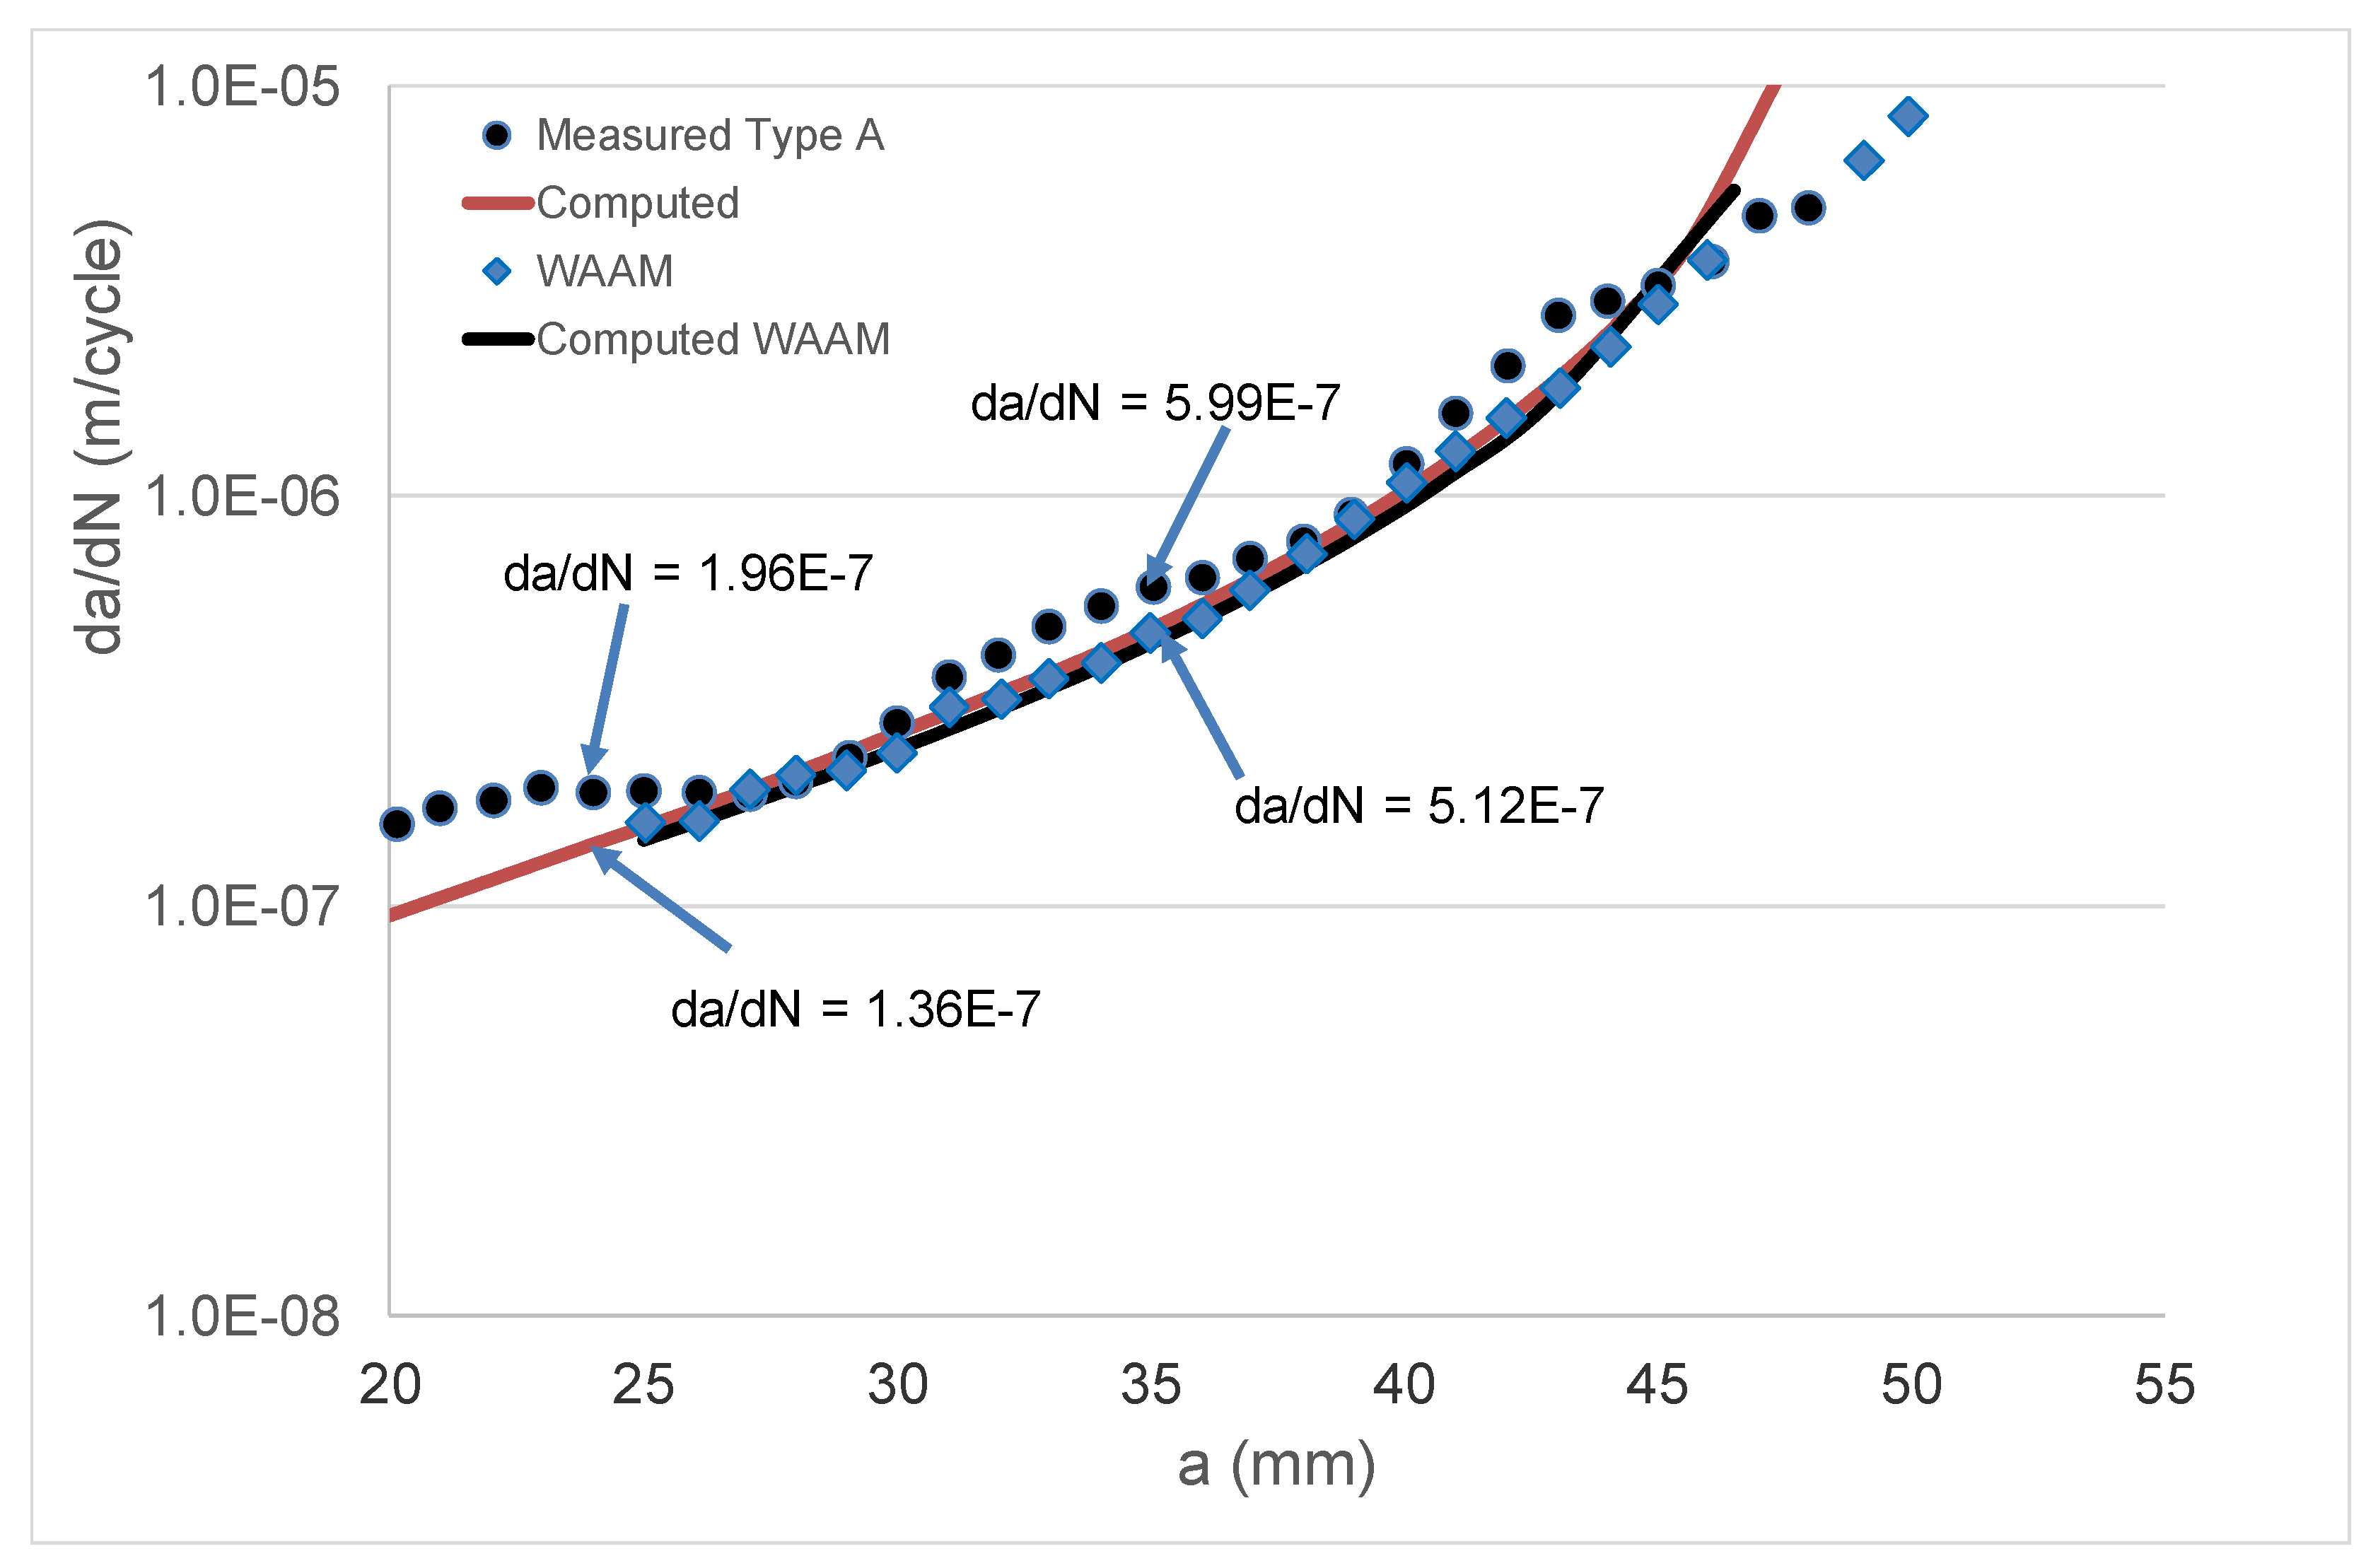
5. Effect of Residual Stress on Crack Growth in Wire and Arc Additive Manufactured Ti-6Al-4V

Having established the ability of the Hartman–Schijve equation to reasonably accurately compute growth in an FSW joint and in an LSP specimen by accounting for the effect of the residual stress field, let us next examine crack growth in tests on a wire and arc additive manufactured (WAAM) Ti-6Al-4V specimen. The paper by Zhang et al. [76] presented R = 0.1 da/dN versus ΔK data associated with the effect of residual stress on WAAM Ti-6Al-4V CT specimens. One test involved annealed WAAM compact tension specimens. Two additional tests, termed Type A and Type C, were performed on a CT specimen where the WAAM Ti-6Al-4V was deposited on a wrought Ti-6Al-4V substrate; see Figure 10. The tests on specimen Types A and C resulted in a significant residual stress field, as well as a residual stress intensity factor Kres that varied as a function of the crack length [76]—see Figure 11—that also contains the relationship between ΔK and the crack length. The da/dN versus crack length (a) curves for the WAAM tests are shown in Figure 12.
As previously mentioned, it is now known [3,48,49,50] that crack growth in AM Ti-6Al-4V can be expressed as per Equation (4). As noted in [3], for AM Ti-6Al-4V, the mean value of the parameter A in Equation (4) is approximately 62 MPa √m. Indeed, this value is consistent with the crack growth data that were presented by Zhang et al. for this material [77]. This value of A, together with a threshold term ΔKthr = 0.6 MPa √m, was used to compute the da/dN versus crack length (a) curve for the WAAM tests, and a comparison between the measured and computed curves is shown in Figure 12 (a somewhat better fit could have been obtained by slightly increasing the value of the cyclic fracture toughness term (A)). Equation (4), together with the value of A (=62 MPa √m) given above, was then used to compute the R = 0.1 da/dN versus crack length (a) curves for the Type A and Type C test specimens. Noting that the natural variability associated with tests on both conventionally manufactured parts [30] and AM Ti-6Al-4V [3,48,49,50] parts can be captured by allowing for small changes in the threshold term (ΔKthr), as well as the fact that that the crack growth rate in the Type A and Type C tests was somewhat greater than that seen in the WAAM tests, a threshold value of ΔKthr = 0.1 MPa √m was used in these analyses. This value was chosen since, as noted in [3,50], it represents an approximate upper bound for the value of ΔKthr for AM Ti-6Al-4V parts. In this analysis, the residual stress field was first used to compute the value of Rtrue, and Equation (11) was then used to determine the value of ΔKtrue,thr. The resultant measured and computed da/dN versus crack length (a) curves are shown in Figure 13 and Figure 14. Figure 13 and Figure 14 reveal that, allowing for experimental error, the resultant computed and measured da/dN versus crack length (a) curves are in reasonably good agreement. This represents an interesting finding in that it suggests that even in the presence of residual stresses, crack growth in AM Ti-6Al-4V can be computed by using the crack growth equation that was determined for conventionally manufactured Ti-6Al-4V, i.e., Equation (4), provided that allowance is made for the effect of the residual stresses.

6. Residual Stresses: AM Replacement Parts and Cold Spray

Though this paper initially concentrated on the growth of long, artificially induced cracks, it should be recalled that the airworthiness certification of AM replacement parts requires a durability analysis [4] and that the EIDS that is required for the associated durability analysis is generally sub mm [4]. Indeed, as first shown by Lincoln and Melliere [78] as part of the USAF F-15 program and subsequently highlighted in [3,6,79,80,81,82], a durability analysis necessitates the use of the associated small crack da/dN versus ΔK curve (a similar statement is contained in Appendix A3 of the ASTM fatigue test standard E647-13a [83]). In this context, as noted in [6], the experimental data revealed that the R ratio effect associated with the growth of small, naturally occurring cracks is often quite small. This in turn suggests that the effect of the residual stresses on the growth of small, naturally occurring cracks in an AM part may also be small. This hypothesis is consistent with the findings that were reported in [84] for the growth of small cracks in annealed cast AM60 magnesium alloy specimens, where it was stated that the “Maximum stress did not appear to affect the crack propagation rate of small cracks in the stress and crack size ranges considered,” and in [50], where it was shown that the growth of small cracks in a cast rail steel was essentially independent of the R ratio. Interestingly, the authors of [50] also revealed that the da/dN versus ΔK curves associated with for the growth of small cracks in LENS Ti-6Al-4V essentially coincided with that seen in this particular cast steel. Unfortunately, there are currently insufficient data to assess the R ratio independence of small crack growing in an AM part.
The durability analysis of AM replacement parts and additive metal repairs needs to consider both surface breaking and near surface material discontinuities, e.g., a lack of fusion. Whilst it is now generally acknowledged that for laboratory tests on flat AM coupons, surface breaking material discontinuities are the most critical [3,6,85,86,87,88], this is not necessarily true for parts with complex geometries. This conclusion is aptly illustrated by the cast steel rail side frame failures reported in [89], where failure was often initiated as a result of the interaction between (near) subsurface material discontinuities and the local geometric stress concentrator; see Figure 15. Consequently, the question of the effect of residual stresses on near surface material discontinuities needs to be resolved. In this context, it should be noted that the seminal paper by Schijve [90] established that the reduction in the growth rate of interior (sub-surface) cracks in conventionally manufactured material was due to the environment, with interior cracks growing in a “vacuum-like” environment. It is now known [91,92] that cracks growing in a near vacuum-like environment see both an enhanced fatigue threshold and a greatly reduced R ratio effect. These observations suggest that the effect of the residual stresses on the growth of small, naturally occurring sub surface material discontinuities in an AM part should be less than for surface breaking material discontinuities. Unfortunately, there are insufficient data to investigate this hypothesis.
The situation is somewhat different for cold spray repairs, also known as SPD repairs, to aluminum alloy airframes. For cold spray repairs deposited by using 7075 and 6061 aluminum alloy powders, it is generally found that, provided that the repair is not heat treated, the compressive residual stresses induced in the cold spray by the deposition process inhibits the development of surface breaking cracks [46,47,93]. Indeed, as shown in [46,93] cold spray repairs are often very resistant to cracking in the underlying airframe. An example of this is shown in Figure 16, Figure 17 and Figure 18, which presents the results of a study [93] into cold spray repairs to multi-site damage in fuselage lap joints representative of that in Boeing 737 aircraft. In these tests, each fastener hole contained initial cracks that did not extend beyond the head of the (5/32 inch diameter) countersink rivet and hence were not visible; see [94] for more details. The geometry of the baseline test specimen, i.e., a specimen without cold spray repair, is shown in Figure 16; from [93]. An important feature of this test program is that the design of the baseline specimen was such that it reproduced the crack growth history seen in the US Boeing 737 fleet [94]. Specimens with and without cold spray repairs were tested. The cold spray repair covered the three rows of fasteners in the top skin; see Figure 16 and Figure 17. In this test program, it was found that the residual compressive stresses in the cold spray meant that it could tolerate cracks of up to 6 mm in length in the underlying 2024-T3 skin without cracking; see Figure 18.
As a result, it appears that, provided that the repair is not heat treated, cracking in cold spray repairs tends to develop either in the airframe (i.e., the underlying structure) or at the intersection between the cold spray repair and the airframe (substrate); see [46,62,95]. As such, the question of the effect of residual stresses on the growth of subsurface material discontinuities is of particular relevance for cold spray repairs.
In this context, the specimens test program reported in [46] addressed the use of cold spray to repair when using 7075 powder on specimens containing a dome nut fastener hole that were cut from sections of an approximately 2.0 mm-thick AA7075-T6 P3C Orion wing skin; see Figure 19 and Figure 20. These test specimens contained intergranular cracking at the fastener hole; see [46] for more details. This study revealed that cracks could nucleate either at the bore of the holes near the intersection between the cold spray and the 7075-T6, or away from the fastener holes at the intersection between the cold spray and the 7075-T6 substructure. This is aptly illustrated in Figure 20, which illustrates the initiation locations for six cracks, which are labelled Crack 1 to Crack 6, in test specimen dome nut fastener hole specimen (DNHS)-1-12. The size of the initial material discontinuities (cracks) seen in these tests lay in the range (approximately) 0.02 to 0.045 mm; see [46] for more details. Specimen DNHS-1-12 was subjected to a series repeated load blocks. Each load block consisted of 3000 cycles at R = 0.1, and 15,000 cycles at R = 0.8, with the maximum remote stress (σmax) of 150 MPa being held constant throughout the test.
While [46] compared the computed and measured crack growth histories associated with the fastest growing cracks in seven different specimen tests, it did not present the crack growth histories associated with each of the six cracks seen in DNHS-1-12. The analysis methodology that was used in [46] used the approach presented in [96,97], which was based on the three dimensional multi-crack finite element alternating technique [98] and, as such, did not require the cracks to be explicitly modelled to determine the stress intensity factor versus crack geometry solutions for each of the specimen tests. The present paper also used this methodology to determine the stress intensity factor histories associated with each of the six cracks seen in DNHS-1-12.
As in [31,46], the crack growth analysis used the stress intensity factor solutions as input to the Hartman–Schijve crack growth equation for AA7075-T6 [31,46]:
da/dN = 1.86 × 10⁻⁹ [(ΔK − ΔKthr)2/(1 − Kmax/111)
As per [50], the value of the threshold term ΔKthr that was used in the analysis of each of these six (small) cracks was taken to be 0.2 MPa √m. The resultant measured and computed crack length histories for cracks 1–3 and cracks 4–6 are shown in Figure 21 and Figure 22, respectively, where it can be seen that, in each case, the agreement was quite good. At this point, it should be stressed that this is the first study to show how to compute the growth of small, naturally occurring collocated cracks in an AM repair and that is a requirement that is enunciated in Structures Bulletin EZ-19-01 [4].
As such, it appears that as in [46], which found that the crack growth histories associated with the fastest growing (small) cracks in seven different cold spray repair specimens could be captured without allowing for the effect of the residual stresses that are induced both in the cold spray and the substrate as a result of the deposition process, the growth of these six different co-located small cracks was also captured reasonably well when the effect of the residual stresses was ignored (at this stage, it should be noted that the paper by White et al. [62], which examined cold spray repairs to corroded fastener holes, also reported that failure was due to cracks growing either at the interface between the substrate and the cold spray or in the substrate). Consequently, the study presented in [62], when taken in conjunction with the results presented in [46], and the results presented above appear to suggest that the residual stresses induced in the 7075-T6 substrate by the cold spray deposition process do not appear to have a particularly detrimental influence on the growth of small, naturally occurring cracks that nucleate either in the substrate or at the interface between the substrate and the cold spray.
Unfortunately, despite the need to predict the growth of cracks in cold spray repairs that nucleate from small, naturally occurring material discontinuities at the cold spray-substrate interface other than the analyses presented in [46] and in the present paper, there are, to the best of the author’s knowledge, no papers that attempt to analyze this phenomenon. It is thus suggested that further work is required to address the question of the effect of residual stresses on the growth of small, naturally occurring material discontinuities in AM parts and on the growth of small, naturally occurring material discontinuities at the intersection between a cold spray repair and the airframe.
On a related topic, it should be noted that the experimental data presented in [46,99] also suggest that the buckling load of panels containing either skin corrosion or stress corrosion cracking in the risers that are repaired by using cold spray is also relatively unaffected by the induced residual stress.

7. AM Illustration of the Use of EIDS to Compute the Growth of Multiple Cracks from A Rough Surface

The Airbus study [100] into the effect of surface roughness on the fatigue performance of AM Ti-6Al-4V noted that surface roughness often results in the initiation of cracks at multiple sites. USAF Structures Bulletin EZ-19-01 [4] also highlights the need to develop a fracture mechanics-based methodology for the analysis of the growth of multiple surface breaking cracks from a rough surface. In the present investigation, two AA7050-T7451 dog-bone shaped specimens were tested to investigate crack growth from an array surface material discontinuities. The specimens were 380 mm long, 60 mm wide, and 11 mm thick. The specimens were first polished to remove the oxidation layers on the surface and surface scratches and then cleaned by using methyl alcohol.
In an attempt to mimic a rough surface with multiple collocated potential initiation sites, it was decided to create an array of surface pits. To produce an array of pits, with depths and diameters comparable with the EIDS requirement, given in USAF Structures Bulletin EZ-19-01 [4], of a minimum size of 0.254 mm (0.01 inch) a total of 12 by 14 drops of a 3.54% NaCl solution were introduced on both the upper and lower surfaces of the specimens. The spacing between each location was approximately 3.5 mm. This meant that there was a total of 336 possible initiation sites. The specimens were then kept in a sealed container for six days. A bottle of supersaturated K2SO4 solution was placed in the container to maintain the moisture and hence prevent the evaporation of the “drops.” After six days of “corrosion,” the specimens were dried at 50 °C in an oven for an hour. An example of a resultant “rough” surface created by this process is shown in Figure 23.
The specimens were subsequently fatigue tested under constant amplitude loading with a marker band inserted at the end of each block. Each load block consisted of 15,000 cycles at R = 0.1 and 300 cycles at R = 0.8. The maximum load associated with the R = 0.1 and 0.8 cycles was kept constant at 139.92 kN. The tests were performed at 5Hz in a (laboratory) air environment. The 300 cycles at R = 0.8 were introduced to aid in quantitative fractography. Specimen #1 failed after 505,000 cycles of load, i.e., 34 load blocks. Specimen #2 failed after 489,690 cycles, i.e., 32 load blocks; see Figure 24.
Quantitative fractography analysis was subsequently used to determine the crack growth histories of each of the eleven cracks seen on the fracture surface of Specimen 1 and the eight cracks seen on the fracture surface of Specimen 2. These cracks were labelled as shown in Figure 24. It was subsequently found that there were four cracks that were not fully opened after fatigue testing. These cracks, which had grown to a surface length of approximately 3 mm, are shown in Figure 25. The crack growth histories associated with these twenty three surface breaking cracks are shown in Figure 26 and Figure 27. The size of the initiating material discontinuities (pits) was also measured, and details of the twenty three surface pits (including initial surface length, depth and location from the edges of the specimen) are given in Table 2. The mean initial depth (ai) was 0.195 mm, and the standard deviation was 0.052 mm. The maximum depth was approximately 0.33 mm. The mean surface half length (ci), at the fracture plane, was 0.315 mm, and the standard deviation was 0.115 mm. The maximum value of ci was approximately 0.437 mm. The mean aspect ratio (=ci/ai) was approximately 1.64 with a standard deviation of 0.45. As such, the depths and surface lengths were comparable with the minimum EIDS required in [4] of 0.254 mm (0.01 inch).
The crack growth history for each of these twenty cracks was then computed by using the Equation (1). The values of D, p, and A that were used in this analysis were taken from [9] and were: D = 7 × 10⁻¹⁰, p = 2, and A = 47 MPa √m. The values of ∆Kthr that were used in the analyses are given in Table 3.
The resultant measured and computed fatigue crack depth histories, with the initial crack sizes assumed to be as per Table 2, for each of the twenty three cracks are shown in Figure 26 and Figure 27. Here, we see that the variability in the crack growth histories was captured reasonably well by using an EIDS that was comparable with the measured initial defect sizes. The mean value of ΔKthr in these analyses was 0.8 MPa√m, with a standard deviation of 0.24 MPa√m. The maximum and minimum values of ΔKthr used in the analysis were 1.6 and 0.35 MPa√m, respectively. The value of ΔKthr = 0.35 MPa√m was associated with the fastest growing crack.

8. Conclusions

USAF Structures Bulletin EZ-19-01 [4] highlights the need to develop a fracture mechanics-based methodology for certifying both AM parts and AM repairs. Specific mention is made of the need for the analysis tools to be able to allow for manufacturing induced residual stresses and for multiple collocated cracks. This paper presented examples of how to perform such an analysis. To this end, the present paper first examined a range of examples that illustrate the potential of the Hartman–Schijve crack growth equation to reasonably-well account for the effect of residual stresses on the growth of long cracks in tests on laser shock peened and friction stir welded specimens. These studies illustrate that when allowance is made for the effect that the residual stress intensity factor Kres has upon the true range of the stress intensity factor (∆Ktrue) and on the true value of the maximum stress intensity factor (Ktrue,max) then crack growth can be reasonably accurately computed. Here, the approach was then shown to hold for AM Ti-6Al-4V specimens.
The present paper also illustrated how this approach can also be used to perform the fracture mechanics-based durability analyses required in Structures Bulletin EZ-190-01 for a cold spray repair where there are multiple cracks and where the initiating defect sizes are comparable with the EIDS sizes presented in Structures Bulletin EZ-19-01. It was also shown how the Hartman–Schijve crack growth equation can be used to compute the crack growth histories associated with multiple cracks that nucleate from a rough surface where the initiating defect sizes are comparable with both EIDS sizes presented in Structures Bulletin EZ-19-01.

Author Contributions

Conceptualization, methodology and rewriting the manuscript to address the reviewers comments—R.J.; Analysis of the cold spray repairs—D.P.; Tests on specimens with a rough surface and the associated analysis—P.H.; Cold spray repair of the test specimens—N.M.; Analysis of residual stresses on WAAM specimens and the FSW test—S.K.; Initial draft preparation and supervision of Supid Kundu at Monash—S.R.K.R.; Review, editing, and supervision of S.K. at IIT Bombay—A.A. All authors have read and agreed to the published version of the manuscript.

Funding

This research received no external funding.

Conflicts of Interest

The authors declare no conflict of interest.

Appendix A

The crack growth equation given by McEvily and Groeger [69] can be written in the form:
da/dN = D [(ΔK − ΔKthr) (1 + ΔK/(KcKmax))1/2]2
where Kc is the cyclic fracture toughness. The role of the term (1 + ΔK/(KcKmax)) in Equation (A1) is to increase the crack growth rate when Kmax approaches Kc. McEvily and Groeger [69] revealed that Equation (A1) led to the following expression for ΔKthr:
ΔKthr = ΔKthr(R = 0) [(1 + R)/(1 + R)]1/2
where the term ΔKthr(R = 0) denotes the value of ΔKthr at R = 0.
In the tests studied in the present paper, the R ratio associated with the applied load was 0.1. These tests enabled the value of ΔKthr at R = 0.1, which in this section, we denote as ΔKthr(R = 0.1), to be determined. This value can be used together with Equation (A2) to estimate the value of ΔKthr(R = 0):
ΔKthr(R = 0) = 0.9045 ΔKthr(R = 0.1)
The value of the fatigue threshold at the various effective R ratio values can now be estimated by using Equation (A2).

References

  1. Under Secretary, Acquisition and Sustainment, Directive-type Memorandum (DTM)-19-006—Interim Policy and Guidance for the Use of Additive Manufacturing (AM) in Support of Materiel Sustainment, Pentagon, Washington, DC, 21 March 2019. Available online: https://www.esd.whs.mil/Portals/54/Documents/DD/issuances/dtm/DTM-19-006.pdf?ver=2019-03-21-075332-443 (accessed on 2 February 2020).
  2. McMichael, E.; Frazer, E. NAVAIR Additive Manufacturing, Proceedings Summary Report: Joint Federal Aviation Administration-Air Force Workshop on Qualification/Certification of Additively Manufactured Parts, DOT/FAA/TC-16/15. 2015. Available online: http://www.tc.faa.gov/its/worldpac/techrpt/tc16-15.pdf (accessed on 2 February 2020).
  3. Jones, R.; Singh Raman, R.K.; Iliopoulos, A.P.; Michopoulos, J.G.; Phan, N.; Peng, D. Additively manufactured Ti-6Al-4V replacement parts for military aircraft. Int. J. Fatigue 2019, 124, 227–235. [Google Scholar] [CrossRef]
  4. Structures Bulletin EZ-SB-19-01, Durability and Damage Tolerance Certification for Additive Manufacturing of Aircraft Structural Metallic Parts, Wright Patterson Air Force Base, OH, USA, 10 June 2019. Available online: https://daytonaero.com/usaf-structures-bulletins-library/ (accessed on 2 February 2020).
  5. MIL-STD-1530D, Department Of Defense Standard Practice Aircraft Structural Integrity Program (ASIP), 13 October 2016. Available online: http://everyspec.com/MIL-STD/MIL-STD.../download.php?spec=MIL-STD-1530D, (accessed on 2 February 2020).
  6. Jones, R. Fatigue crack growth and damage tolerance. Fatigue Fract. Eng. Mater. Struct. 2014, 37, 463–483. [Google Scholar] [CrossRef]
  7. Jones, R.; Huang, P.; Peng, D. Crack growth from naturally occurring material discontinuities under constant amplitude and operational loads. Int. J. Fatigue 2016, 91, 434–444. [Google Scholar] [CrossRef]
  8. Molent, L.; Jones, R. The influence of cyclic stress intensity threshold on fatigue life scatter. Int. J. Fatigue 2016, 82, 748–756. [Google Scholar] [CrossRef]
  9. Jones, R.; Molent, L.; Barter, S. Calculating crack growth from small discontinuities in 7050-T7451 under combat aircraft spectra. Int. J. Fatigue 2013, 55, 178–182. [Google Scholar] [CrossRef]
  10. Jones, R.; Singh Raman, R.K.; McMillan, A.J. Crack growth: Does microstructure play a role? Eng. Fract. Mech. 2018, 187, 190–210. [Google Scholar] [CrossRef]
  11. Jensen, D. Adaptation of LSP Capability for Use on F-22 Raptor Primary Structure at an Aircraft Modification Depot. In Proceedings of the Second International Conference on Laser Peening, San Francisco, CA, USA, 19–21 April 2010; Available online: http://flytoazuresky.tistory.com/attachment/[email protected] (accessed on 2 February 2020).
  12. Wilburn, H. New F-35 Modification Facility Brings Strategic Capability to FRCE. 2020. Available online: https://www.navy.mil/submit/display.asp?story_id=110618 (accessed on 2 February 2020).
  13. Kalentics, N.; Boillata, E.; Peyre, P.; Gorny, C.; Kenel, C.; Leinenbach, C.; Jhabvala, J.; Logé, R.E. 3D Laser Shock Peening—A new method for the 3D control of residual stresses in Selective Laser Melting. Mater. Design 2017, 130, 350–356. [Google Scholar] [CrossRef] [Green Version]
  14. Guo, W.; Sun, R.; Song, B.; Zhu, Y.; Li, F.; Che, Z.; Li, B.; Guo, C.; Liu, L.; Peng, P. Laser shock peening of laser additive manufactured Ti6Al4V titanium alloy. Surf. Coat. Technol. 2018, 349, 503–510. [Google Scholar] [CrossRef]
  15. Allan, H.; Clauer, A.H. Laser Shock Peening, the Path to Production. Metals 2019, 9, 626. [Google Scholar] [CrossRef] [Green Version]
  16. Thomas, W.M.; Nicholas, E.D.; Needham, J.C.; Murch, M.G.; Temple-Smith, P.; Dawes, C.J. The Welding Institute, Improvements relating to friction welding. Eur. Patent Specif. 1992, 615, B1. [Google Scholar]
  17. Thomas, W.M. Friction Stir Butt Welding. International Patent Application No. 9125978.8, 1991. [Google Scholar]
  18. Ghidinia, T.; Polese, C.; Lanciotti, A.; Dalle Donne, C. Simulations of Fatigue Crack Propagation in Friction Stir Welds under Flight Loading Conditions. Mater. Test. 2006, 48, 370–375. [Google Scholar] [CrossRef]
  19. Bussu, G.; Irving, P.E. The role of residual stress and heat affected zone properties on fatigue crack propagation in friction stir welded 2024-T351 aluminum joints. Int. J. Fatigue 2003, 25, 77–88. [Google Scholar] [CrossRef]
  20. Ghidini, T.; Dalle Donnne, C. Fatigue crack propagation assessment based on residual stresses obtained through cut-compliance technique. Fatigue Fract. Eng. Mater. Struct. 2006, 30, 214–222. [Google Scholar] [CrossRef]
  21. Zhai, Y.; Lados, D.; Lagoy, J.L. Additive Manufacturing: Making Imagination the Major Limitation. JOM 2014, 66, 808–816. [Google Scholar] [CrossRef] [Green Version]
  22. Torres, B.; Imandoust, A.; Beretta, S.; Shao, S.; Shamsaei, N. Overview on Microstructure- and Defect-Sensitive Fatigue Modeling of Additively Manufactured Materials. JOM 2018, 70, 1853–1861. [Google Scholar] [CrossRef]
  23. Boni, L.; Lanciotti, A.; Polese, C. “Size effect” in the fatigue behavior of Friction Stir Welded Plates. Int. J. Fatigue 2015, 80, 238–245. [Google Scholar] [CrossRef]
  24. Parker, A.P. Stress intensity factors, crack profiles, and fatigue crack growth rates in residual stress fields. In Residual Stress Effects in Fatigue; ASTM STP 776; American Society for Testing and Materials: West Conshohocken, PA, USA, 1982; pp. 13–31. [Google Scholar]
  25. Itoh, Y.Z.; Suruga, S.; Kashiwaya, H. Prediction of fatigue crack growth rate in welding residual stress field. Eng. Fract. Mech. 1989, 33, 397–407. [Google Scholar] [CrossRef]
  26. Newman, J.A.; Smith, S.W.; Seshadri, B.R.; James, M.A.; Brazill, R.L.; Robert, W.; Schultz Donald, J.K.; Blair, A. Characterization of Residual Stress Effects on Fatigue Crack Growth of a Friction Stir Welded Aluminum Alloy. NASA/TM–2015-218685. 2015. Available online: https://ntrs.nasa.gov/search.jsp?R=20150002817 (accessed on 2 February 2020).
  27. Servetti, G.; Zhang, X. Predicting fatigue crack growth rate in a welded butt joint: The role of effective R ratio in accounting for residual stress effect. Eng. Fract. Mech. 2009, 76, 1589–1602. [Google Scholar] [CrossRef] [Green Version]
  28. Ali, K.; Peng, D.; Jones, R.; Singh, R.R.K.; Zhao, X.L.; McMillan, A.J.; Berto, F. Crack growth in a naturally corroded bridge steel. Fatigue Fract. Eng. Mater. Struct. 2017, 40, 1117–1127. [Google Scholar] [CrossRef]
  29. Jones, R.; Tamboli, D. Implications of the lead crack philosophy and the role of short cracks in combat aircraft. Eng. Fail. Anal. 2013, 29, 149–166. [Google Scholar] [CrossRef]
  30. Peng, D.; Jones, R.; Cairns, K.; Baker, J.; McMillan, A. Life cycle analysis of steel railway bridges. Theor. Appl. Fract. Mech. 2018, 97, 385–398. [Google Scholar] [CrossRef]
  31. Lo, M.; Jones, R.; Bowler, A.; Dorman, M.; Edwards, D. Crack growth at fastener holes containing intergranular cracking. Fatigue Fract. Eng. Mater. Struct. 2017, 40, 1664–1675. [Google Scholar] [CrossRef]
  32. Jones, R.; Peng, D.; Singh Raman, R.K.; Pu, H.; Tamboli, D.; Matthews, N. On the growth of fatigue cracks from corrosion pits and manufacturing defects under variable amplitude loading. JOM 2015, 67, 1385–1391. [Google Scholar] [CrossRef]
  33. Main, B.; Evans, R.; Walker, K.; Yu, X.; Molent, L. Lessons from a Fatigue Prediction Challenge for an Aircraft Wing Shear TiePost. Int. J. Fatigue 2019, 123, 53–65. [Google Scholar] [CrossRef]
  34. Tamboli, D.; Barter, S.; Jones, R.; Tamboli, D.; Barter, S.; Jones, R. On the growth of cracks from etch pits and the scatter associated with them under a miniTWIST spectrum. Int. J. Fatigue 2017, 109, 10–16. [Google Scholar] [CrossRef]
  35. Jones, R.; Peng, D.; Pu, H.; Singh Raman, R.K. Crack growth from naturally occurring material discontinuities in operational aircraft. Procedia Eng. 2015, 101, 227–234. [Google Scholar] [CrossRef] [Green Version]
  36. Tan, J.L.; Chen, B.K. Prediction of fatigue life in aluminum alloy (AA7050-T7451) structures in the presence of multiple artificial short cracks. Theor. Appl. Fract Mech. 2015, 78, 1–7. [Google Scholar] [CrossRef]
  37. Jones, R.; Molent, L.; Walker, K. Fatigue crack growth in a range of diverse materials. Int. J. Fatigue 2012, 40, 43–50. [Google Scholar] [CrossRef]
  38. Zhang, Y.; Zheng, K.; Heng, J.; Zhu, J. Corrosion-Fatigue Evaluation of Uncoated Weathering Steel Bridges. Appl. Sci. 2019, 9, 3461. [Google Scholar] [CrossRef] [Green Version]
  39. Godefroid, L.B.; Moreira, L.P.; Vilela, T.C.G.; Faria, G.L.; Candido, L.C.; Pinto, E.S. Effect of chemical composition and microstructure on the fatigue crack growth resistance of pearlitic steels for railroad application. Int. J. Fatigue 2019, 120, 241–253. [Google Scholar] [CrossRef]
  40. Cano, A.J.; Salazar, A.; Rodríguez, J. Evaluation of different crack driving forces for describing the fatigue crack growth behaviour of PET-G. Int. J. Fatigue 2018, 107, 27–32. [Google Scholar] [CrossRef]
  41. Rocha, A.V.M.; Akhavan-Safar, A.; Carbas, R.; Marques, E.A.S.; Goyal, R.; El-Zein, M.; da Silva, L.F.M. Paris law relations for an epoxy-based adhesive. Proc. IMechE. Part L J. Mater. Design Appl. 2019. [Google Scholar] [CrossRef]
  42. Jones, R.; Hu, W.; Kinloch, A.J. A convenient way to represent fatigue crack growth in structural adhesives. Fatigue Fract. Eng. Mater. Struct. 2015, 38, 379–391. [Google Scholar] [CrossRef] [Green Version]
  43. Jones, R.; Kinloch, A.J.; Hu, W. Cyclic-fatigue crack growth in composite and adhesively-bonded structures: The FAA slow crack growth approach to certification and the problem of similitude. Int. J. Fatigue 2016, 88, 10–18. [Google Scholar] [CrossRef] [Green Version]
  44. Clerc, G.; Brunner, A.J.; Niemz, P.; Van de Kuilen, J.W.G. Feasibility study on Hartman–Schijve data analysis for Mode II fatigue fracture of adhesively bonded wood joints. Int. J. Fract. 2019, 221, 123–140. [Google Scholar] [CrossRef]
  45. Jones, R.; Lo, M.; Peng, D.; Bowler, A.; Dorman, M.; Janardhana, M.; Iyyer, N.S. A study into the interaction of intergranular cracking and cracking at a fastener hole. Meccanica 2015, 50, 517–532. [Google Scholar] [CrossRef]
  46. Jones, R.; Matthews, N.; Peng, D.; Phan, N.; Nguyen, T. Chapter 16, Applications of SPD to enhance the structural integrity of corroded airframes. In Aircraft Sustainment and Repair; Jones, R., Matthews, N., Baker, A., Champagne, V., Eds.; Butterworth-Heinemann Press: Oxford, UK, 2018; pp. 863–905. ISBN 9780081005408. [Google Scholar]
  47. Jones, R.; Matthews, N.; Baker, A.; Champagne, V. Aircraft Sustainment and Repair; Butterworth-Heinemann Press: Oxford, UK, 2018; ISBN 9780081005408. [Google Scholar]
  48. Jones, R.; Michopoulos, J.G.; Iliopoulos, A.P.; Raman, R.S.; Phan, N.; Nguyen, T. Representing crack growth in additively manufactured Ti-6Al-4V. Int. J. Fatigue 2018, 116, 610–622. [Google Scholar] [CrossRef]
  49. Jones, R.; Matthews, N.; Peng, D.; Phan, N.; Nguyen, T.T. Damage Tolerant Assessment of Additively Manufactured Replacement Parts. In Proceedings of the 13th International Conference on the Mechanical Behaviour of Materials (ICM13), Melbourne, Australia, 11–14 June 2019; pp. 384–393, ISBN 978-1-922016-65-2. [Google Scholar]
  50. Iliopoulos, A.; Jones, R.; Michopoulos, J.; Phan, N.; Singh Raman, R.K. Crack Growth in a Range of Additively Manufactured Aerospace Structural Materials. Aerospace 2018, 5, 118. [Google Scholar] [CrossRef] [Green Version]
  51. Jones, R.; Stelzer, S.; Brunner, A.J. Mode I, II and Mixed Mode I/II delamination growth in composites. Compos. Struct. 2014, 110, 317–324. [Google Scholar] [CrossRef]
  52. Jones, R.; Pitt, S.; Hui, D.; Brunner, A. Fatigue crack growth in nano-composites. Compos. Struct. 2013, 99, 375–379. [Google Scholar] [CrossRef]
  53. Jones, R.; Iliopoulos, A.P.; Michopoulos, J.G.; Peng, D.; Phan, N.; Kinloch, A.J.; Lua, J. Delamination and disbonding in composite airframes. In Proceedings of the 13th International Conference on the Mechanical Behaviour of Materials (ICM13), Melbourne, Australia, 11–14 June 2019; pp. 401–410, ISBN 978-1-922016-65-2. [Google Scholar]
  54. Brunner, A.J.; Stelzer, S.; Pinter, G.; Terrasi, G.P. Cyclic fatigue delamination of carbon fiber-reinforced polymer-matrix composites: Data analysis and design considerations. Int. J. Fatigue 2016, 83, 293–299. [Google Scholar] [CrossRef]
  55. Chocron, T.; Banks-Sills, L. Nearly mode I fracture toughness and fatigue delamination propagation in a multidirectional laminate fabricated by a wet-layup. Phys. Mesomech. 2019, 22, 107–140. [Google Scholar] [CrossRef]
  56. Simon, I.; Banks-Sills, L.; Fourman, V. Mode I delamination propagation and R-ratio effects in woven composite DCB specimens for a multi-directional layup. Int. J. Fatigue 2017, 96, 237–251. [Google Scholar] [CrossRef]
  57. Jones, R.; Kinloch, A.J.; Michopoulos, J.G.; Brunner, A.J.; Phan, N. Delamination growth in polymer-matrix fibre composites and the use of fracture mechanics data for material characterisation and life prediction. Compos. Struct. 2017, 180, 316–333. [Google Scholar] [CrossRef]
  58. Yao, L.; Alderliesten, R.C.; Jones, R.; Kinloch, A.J. Delamination fatigue growth in polymer-matrix fibre composites: A methodology for determining the design and lifing allowables. Compos. Struct. 2018, 196, 8–20. [Google Scholar] [CrossRef] [Green Version]
  59. Simon, I.; Banks-Sills, L.; Fourman, V.; Eliasi, R. Delamination Propagation and Load Ratio Effects in DCB MD Woven Composite Specimens. Procedia Struct. Integr. 2016, 2, 205–212. [Google Scholar] [CrossRef] [Green Version]
  60. Champagne, V., Jr.; Matthews, N.; Champagne, V., III. Chapter 14: Introduction to Supersonic Particle Deposition. In Aircraft Sustainment and Repair; Jones, R., Matthews, N., Baker, A., Champagne, V., Eds.; Butterworth-Heinemann Press: Oxford, UK, 2018; pp. 799–844. ISBN 9780081005408. [Google Scholar]
  61. Matthews, N. Additive Metal Technologies for Aerospace Sustainment; Chapter 15; Jones, R., Matthews, N., Baker, A., Champagne, V., Eds.; Butterworth-Heinemann Press: Oxford, UK, 2018; pp. 845–862. ISBN 9780081005408. [Google Scholar]
  62. White, B.; Story, W.; Brewer, L.; Jordon, J.B. Fatigue behaviour of fastener holes in high-strength aluminum plates repaired by cold spray deposition. Fatigue Fract. Eng. Mater. Struct. 2019, 1–13. [Google Scholar] [CrossRef]
  63. Spencer, K.; Luzin, V.; Matthews, N.; Zhang, N.X. Residual stresses in cold spray Al coatings: The effect of alloying and of process parameters. Surf. Coat. Technol. 2012, 206, 4249–4255. [Google Scholar] [CrossRef]
  64. Saleh, M.; Luzin, V.; Spencer, K. Analysis of the residual stress and bonding mechanism in the cold spray technique using experimental and numerical methods. Surf. Coat. Technol. 2014, 252, 15–28. [Google Scholar] [CrossRef]
  65. Schwalbe, K.H. On the beauty of analytical models for fatigue crack propagation and fracture—A personal historical review. In Fatigue and Fracture Mechanics: 37th Volume; ASTM International: West Conshohocken, PA, USA, 2011; pp. 3–73. [Google Scholar] [CrossRef]
  66. McEvily, A.J.; Eifler, D.; Macherauch, E. An analysis of the growth of short fatigue cracks. Eng. Fract. Mech. 1991, 40, 571–584. [Google Scholar] [CrossRef]
  67. Endo, M.; McEvily, A.J. Prediction of the behavior of small fatigue cracks. Mater. Sci. Eng. A 2007, 468, 51–58. [Google Scholar] [CrossRef]
  68. Masuda, K.; Oguma, N.; Ishihara, S.; McEvily, A.J. Investigation of subsurface fatigue crack growth behavior of D2 tool steel (JIS SKD11) based on a novel measurement method. Int. J. Fatigue 2020, 133. [Google Scholar] [CrossRef]
  69. McEvily, A.J.; Groeger, J. On the Threshold for Fatigue crack growth. In Proceedings of the ICF4, Fracture 1977, Waterloo, ON, Canada, 19–24 June 1977; Volume 2, pp. 1293–1298. [Google Scholar]
  70. Ma, Y.E.; Staron, P.; Fischer, T.; Irving, P.E. Size effects on residual stress and fatigue crack growth in friction stir welded 2195-T8 aluminum—Part II: Modelling. Int. J. Fatigue 2011, 33, 1426–1434. [Google Scholar] [CrossRef] [Green Version]
  71. John, R.; Jata, K.V.; Sadananda, K. Residual stress effects on near-threshold fatigue crack growth in friction stir welds in aerospace alloys. Int. J. Fatigue 2003, 25, 939–948. [Google Scholar] [CrossRef]
  72. Pasta, S.; Reynolds, A.P. Residual stress effects on fatigue crack growth in a Ti-6Al-4V friction stir weld. Fatigue Fract. Eng. Mater. Struct. 2008, 31, 569–580. [Google Scholar] [CrossRef]
  73. Biallas, G. Effect of welding residual stresses on fatigue crack growth thresholds. Int. J. Fatigue 2013, 50, 10–17. [Google Scholar] [CrossRef]
  74. Tra, T.H.; Okazaki, M.; Suzuki, K. Fatigue crack propagation behavior in friction stir welding of AA6063-T5: Roles of residual stress and microstructure. Int. J. Fatigue 2012, 43, 23–29. [Google Scholar] [CrossRef]
  75. Keller, S.; Horstmann, M.; Kashaev, N.B.; Klusemann, B. Experimentally validated multi-step simulation strategy to predict the fatigue crack propagation rate in residual stress fields after laser shock peening. Int. J. Fatigue 2019, 133, 265–276. [Google Scholar] [CrossRef]
  76. Zhang, J.; Wang, X.; Paddea, S.; Zhang, X. Fatigue crack propagation behaviour in wire+ arc additive manufactured Ti-6Al-4V: Effects of microstructure and residual stress. Mater. Des. 2016, 90, 551–561. [Google Scholar] [CrossRef]
  77. Zhang, X.; Martina, F.; Syed, A.K.; Wang, X.; Ding, J.; Williams, S.W. Fatigue Crack Growth in Additive Manufactured Titanium: Residual stress control and life evaluation method development. In Proceedings of the 29th ICAF Symposium, Nagoya, Japan, 7–9 June 2017. [Google Scholar]
  78. Lincoln, J.W.; Melliere, R.A. Economic life determination for a military aircraft. J. Aircraft 1999, 36, 737–742. [Google Scholar] [CrossRef]
  79. Berens, A.P.; Hovey, P.W.; Skinn, D.A. Risk analysis for aging aircraft fleets—Volume 1: Analysis, WL-TR-91-3066, Flight Dynamics Directorate, Wright Laboratory, Air Force Systems Command, Wright-Patterson Air Force Base. October 1991. Available online: https://apps.dtic.mil/dtic/tr/fulltext/u2/a252000.pdf (accessed on 2 February 2020).
  80. Jones, R.; Peng, D.; McMillan, A.J. Crack growth from naturally occurring material discontinuities, Chapter 5. In Aircraft Sustainment and Repair; Jones, R., Matthews, N., Baker, A., Champagne, V., Eds.; Butterworth-Heinemann Press: Oxford, UK, 2018; pp. 129–190. ISBN 9780081005408. [Google Scholar]
  81. Molent, L.; Dixon, B. Airframe metal fatigue revisited. Int. J. Fatigue 2020, 131. [Google Scholar] [CrossRef]
  82. Sandgren, H.R.; Zhai, Y.; Lados, D.A.; Shade, P.A.; Schuren, J.C.; Groeber, M.A.; Kenesei, P.; Gavras, A.G. Characterization of fatigue crack growth behavior in LENS fabricated Ti-6Al-4V using high-energy synchrotron x-ray microtomography. Addit. Manuf. 2016, 12, 132–141. [Google Scholar] [CrossRef] [Green Version]
  83. ASTM. Measurement of Fatigue Crack Growth Rates; ASTM: West Conshohocken, PA, USA, 2013. [Google Scholar]
  84. Chen, Z.; Shyam, A.; Huang, J.; Decker, R.F.; Lebeau, S.E.; Boehlert, C.J. The Small Fatigue Crack Growth Behavior of an AM60 Magnesium Alloy. Metall. Mater. Trans. A 2013, 44A, 1045–1058. [Google Scholar] [CrossRef]
  85. Cao, F.; Zhang, T.; Ryder, M.A.; Lados, D.A. A review of the fatigue properties of additively manufactured Ti-6Al-4V. JOM 2018, 70, 349–357. [Google Scholar] [CrossRef]
  86. Beretta, S.; Romano, S. A comparison of fatigue strength sensitivity to defects for materials manufactured by AM or traditional processes. Int. J. Fatigue 2017, 94, 178–191. [Google Scholar] [CrossRef]
  87. Romano, S.; Brückner-Foit, A.; Brandão, A.; Gumpinger, J.; Ghidini, T.; Beretta, S. Fatigue properties of AlSi10Mg obtained by additive manufacturing: Defect-based modelling and prediction of fatigue strength. Eng. Fract. Mech. 2018, 187, 165–189. [Google Scholar] [CrossRef]
  88. Masuo, H.; Tanaka, Y.; Morokoshi, S.; Yagura, H.; Uchida, T.; Yamamoto, Y.; Murakami, Y. Influence of defects, surface roughness and HIP on the fatigue strength of Ti-6Al-4V manufactured by additive manufacturing. Int. J. Fatigue 2018, 117, 163–179. [Google Scholar] [CrossRef]
  89. TTCI R&D: How Healthy Are Your Castings? Available online: http://www.railwayage.com/index.php/mechanical/freight-cars/ttci-rd-how-healthy-are-your-castings.html (accessed on 2 February 2020).
  90. Schijve, J. Fatigue crack growth, physical understanding and practical application. Fatigue Fract. Eng. Mater. Struct. 2009, 32, 867–871. [Google Scholar] [CrossRef]
  91. Kirby, B.R.; Beevers, C.J. Slow fatigue crack growth and threshold behaviour in air and vacuum of commercial aluminum alloys. Fatigue Fract. Eng. Mater. Struct. 1979, 1, 203–215. [Google Scholar] [CrossRef]
  92. Ritchie, R.O. Near-threshold fatigue-crack propagation in steels. Int. Metals Rev. 1979, 24, 205–230. [Google Scholar]
  93. Jones, R.; Molent, L.; Barter, S.; Matthews, N.; Tamboli, D. Supersonic particle deposition as a means for enhancing the structural integrity of aircraft structures. Int. J. Fatigue 2014, 68, 260–268. [Google Scholar] [CrossRef]
  94. Molent, L.; Jones, R. Repair of Multisite Damage in Civil Transport Aircraft: An Example of the Damage-Tolerant Design of Composite Repairs. Aircr. Sustain. Repair 2018, 9, 463–510. [Google Scholar]
  95. Jones, R. Synchrotron radiation microcomputed tomography for assessing internal cracks in cold spray repairs. Fatigue Fract. Eng. Mater. Struct. 2020, 43, 431–432. [Google Scholar] [CrossRef]
  96. Peng, D.; Huang, P.; Jones, R. Practical Computational Fracture Mechanics for Aircraft Structural Integrity. Aircr. Sustain. Repair 2018, 4, 67–128. [Google Scholar]
  97. Peng, D.; Jones, R.; Constable, T. Tools and methods for addressing the durability of rolling stock. Eng. Fail. Anal. 2013, 34, 278–289. [Google Scholar] [CrossRef]
  98. Pitt, S.; Jones, R.; Atluri, S.N. Further studies into interacting 3D cracks. Comput. Struct. 1999, 70, 583–597. [Google Scholar] [CrossRef]
  99. Matthews, N.; Jones, R.; Peng, D.; Phan, N.; Nguyen, T. Additive Metal Solutions to Corroded Wing Skins, NATO-RTO-AVT-303. In Proceedings of the AVT-303 Research Workshop on, Corrosion Management, Athens, Greece, 10–12 December 2018. [Google Scholar] [CrossRef]
  100. Greitemeier, D.; Donne, C.D.; Syassen, F.; Eufinger, J.; Melz, T. Effect of surface roughness on fatigue performance of additive manufactured Ti-6Al-4V. Mater. Sci. Technol. 2016, 32, 629–634. [Google Scholar] [CrossRef]
Figure 1. Compact tension (CT) specimen test geometry; from [72].
Materials 13 01341 g001
Figure 2. The dependency of residual stress intensity factor (Kres) versus crack length (a); from [72].
Materials 13 01341 g002
Figure 3. Comparison between the measured [72] and computed da/dN versus ∆K curve for the baseline material.
Materials 13 01341 g003
Figure 4. Comparison of the measured values, from [72], and computed crack growth rates.
Materials 13 01341 g004
Figure 5. Geometry of the CT test specimen and the location of the laser shot peened (LSP) region; from [75].
Materials 13 01341 g005
Figure 6. The various stress intensity factor versus crack length curves given in [75].
Materials 13 01341 g006
Figure 7. The relationship between an effective R ratio (Rtrue) and the crack length for the LSP study reported in [75].
Materials 13 01341 g007
Figure 8. Hartman–Schijve representation of crack growth in AA2024-T3.
Materials 13 01341 g008
Figure 9. Comparison between the measured [75] and measured da/dN and crack length (a) curves.
Materials 13 01341 g009
Figure 10. The specimen test geometry used in the Type A, and Type C tests; from [76].
Materials 13 01341 g010
Figure 11. The relationship between the residual stress intensity factors and the crack length (a) as determined in [76] for the Type A and Type C specimens.
Materials 13 01341 g011
Figure 12. Comparison between the measured and computed growth rate (da/dN) versus crack length (a) curves for the wire and arc additive manufactured (WAAM) test specimens.
Materials 13 01341 g012
Figure 13. Comparison between the measured and computed growth rate (da/dN) versus crack length (a) curves for the Type A specimens.
Materials 13 01341 g013
Figure 14. Comparison between the measured and computed growth rate (da/dN) versus crack length (a) curves for the Type C specimens.
Materials 13 01341 g014
Figure 15. Typical subsurface defect at the inner pedestal leg of a side frame.
Materials 13 01341 g015
Figure 16. Plan view a fuselage lap joint specimen panel and fastener numbers showing the area over which the cold spray was deposited; from [93].
Materials 13 01341 g016
Figure 17. A close up view of a cold spray repair over fasteners; from [93].
Materials 13 01341 g017
Figure 18. View of the underside (on which the cold spray was not deposited) of the 2024-T3 lap joint skin, where there was no cracking in the cold spray; from [93].
Materials 13 01341 g018
Figure 19. Schematic diagram of the supersonic particle deposition (SPD)-repaired dome nut fastener hole (DNH) coupons; from [46].
Materials 13 01341 g019
Figure 20. Schematic of ½ of a dome nut fastener hole specimen (DNHS) coupon with a 0.453 mm-thick cold spray repair on either side of the test specimen; from [46].
Materials 13 01341 g020
Figure 21. Measured and computed crack length histories for cracks 1–3 in specimen DNHS-1-12.
Materials 13 01341 g021
Figure 22. Measured and computed crack length histories for cracks 4–6 in specimen DNHS-1-12.
Materials 13 01341 g022
Figure 23. View of a typical surface.
Materials 13 01341 g023
Figure 24. Fracture surface and schematic locations of cracks in Specimen #1 (left) and Specimen #2 (right).
Materials 13 01341 g024
Figure 25. The two cracks on the manually opened surfaces of Specimen #1 (left) and Specimen #2 (right).
Materials 13 01341 g025
Figure 26. Comparison between the measured and computed crack growth histories for Specimen 1.
Materials 13 01341 g026
Figure 27. Comparison between the measured and computed crack growth histories for Specimen 2.
Materials 13 01341 g027
Table 1. The values of ∆Kthr used in Figure 8.
Kthr (MPa √m)DA (MPa √m)
R = 0.52.651.8 × 10−945
R = 0.054.01.8 × 10−945
Table 2. Details of the twenty three surface material defects in Specimens 1 and 2.
SpecimenCrackci (mm)ai (mm)Aspect Ratio (=ci/ai)Distance to Edge (mm)
1c10.2710.1242.1884.2
c2_20.1290.111.1734.9
c40.2720.1941.4028.8
c5_10.250.191.31616.5
c5_20.250.21.25016.5
c6_b0.310.241.29219
c70.2520.1691.48820.5
c80.350.221.59116.3
c90.1850.1761.0512.4
c100.3360.2321.44819.5
c110.250.1222.05012.2
ck0.4070.22.0352.5
cp0.390.3281.1897.5
2c10.260.151.7338.9
c30.3210.1691.89620.5
c60.4370.2851.5335.2
c70.4140.152.76013.8
c80.70.2692.6026.7
c90.310.181.72220.6
c100.230.1741.32220.2
c110.2710.2121.27813
cq0.290.1911.5183.5
ct0.3690.1991.8548.7
Table 3. Values of the threshold term (ΔKthr) that were used in the analysis.
SpecimenCrackΔKthr (MPa√m)
1c10.7
c2_20.35
c40.75
c5_10.8
c5_20.6
c6_b0.75
c70.85
c80.72
c90.65
c101.6
c110.61
ck0.83
cp0.63
2c10.6
c30.95
c61
c70.9
c81.2
c90.8
c100.68
c110.75
cq0.66
ct0.92

