Precipitation Strengthening of Cu–Ni–Si Alloy


Abstract
1. Introduction
2. Materials and Methods
- thermo-derivative analysis using the UMSA device (Method and Apparatus for Universal Metallurgical Simulation and Analysis-Patent Serial No. PCT/CA02/01903, Silesian University of Technology, Gliwice, Poland) equipped with a computer-controlled cooling system, which allows to set flexibly the cooling rate applied of the Cu–2Ni–1Si (11.36 g) and Cu–2Ni–1Si–0.6Re (24.2 g) alloys. The samples for thermo-derivative analysis were prepared with a diameter of Ø8 mm and a height of 10 mm. Holes were also made for thermocouples in the samples where the thermal node occurs for this type and arrangement of the sample geometry. K-type thermocouples were used for testing due to their linear measurement characteristics;
- the supersaturation temperature of Cu–2Ni–1Si and Cu–2Ni–1Si–0.6Re alloys was 950 °C, heating time 1 h (in a protective atmosphere of argon) and subsequent ageing at a temperature of 450 °C (in a protective atmosphere of argon); in the investigation the simulator of heat and plastic treatment used was a DSI (Dynamic System Inc., Austin, TX, USA) Gleeble 3800;
- alloy structure was examined using electron scanning microscope using the Zeiss Supra 25 device (SEM, Thornwood, New York, USA) within the high-resolution mode;
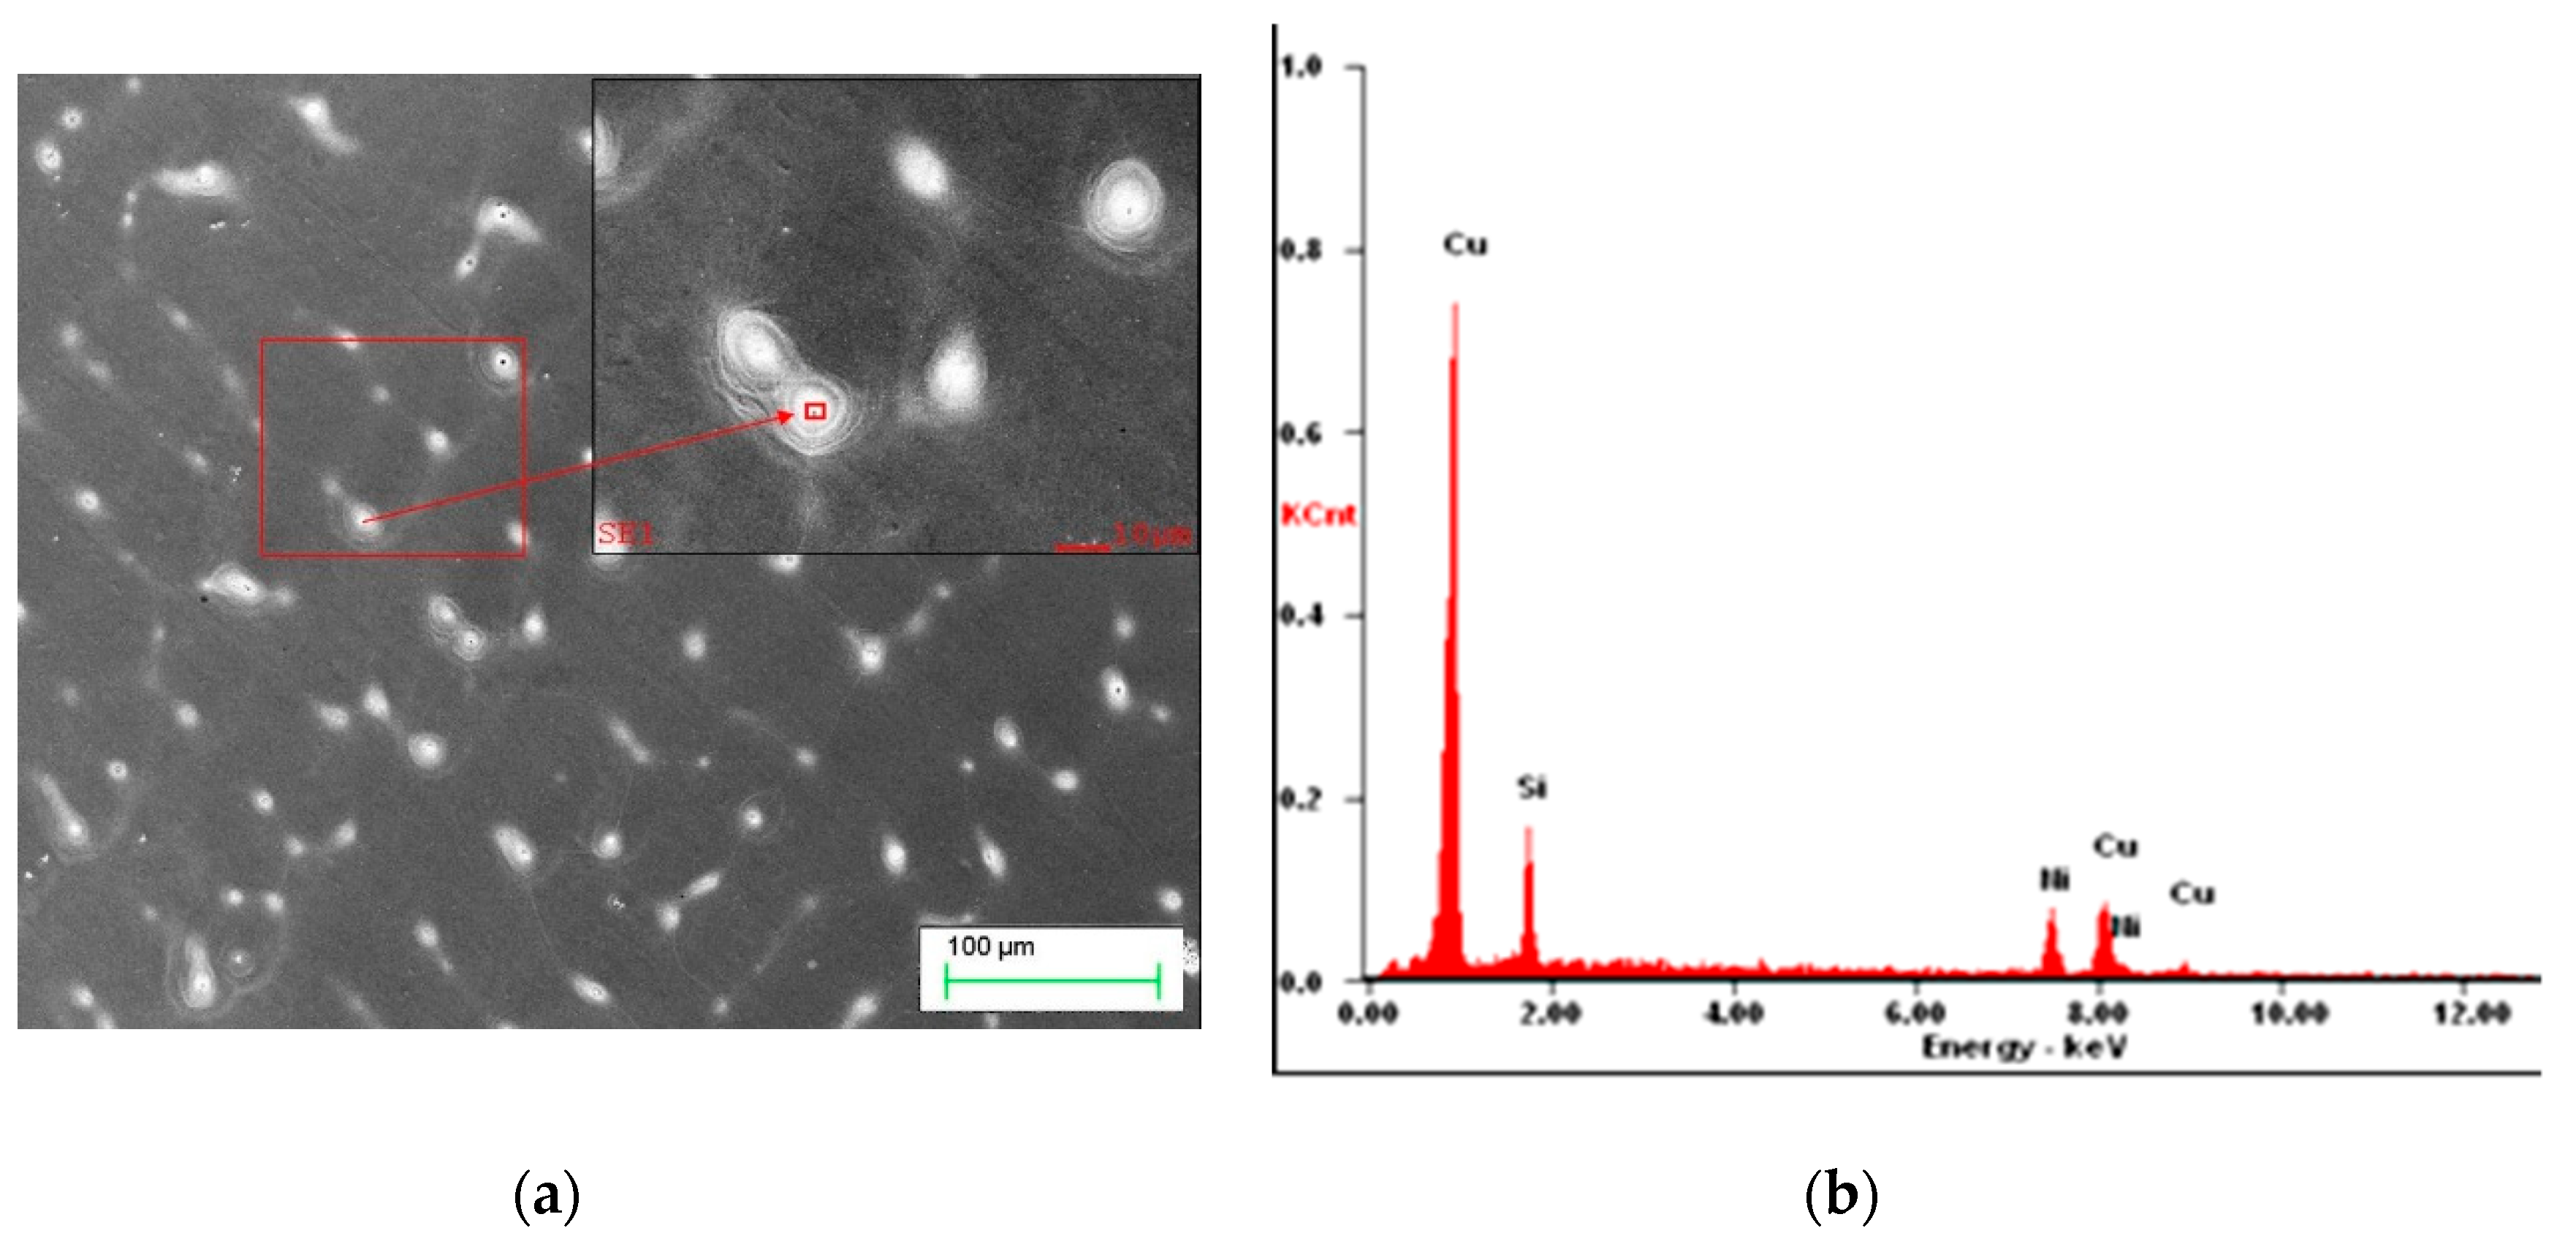
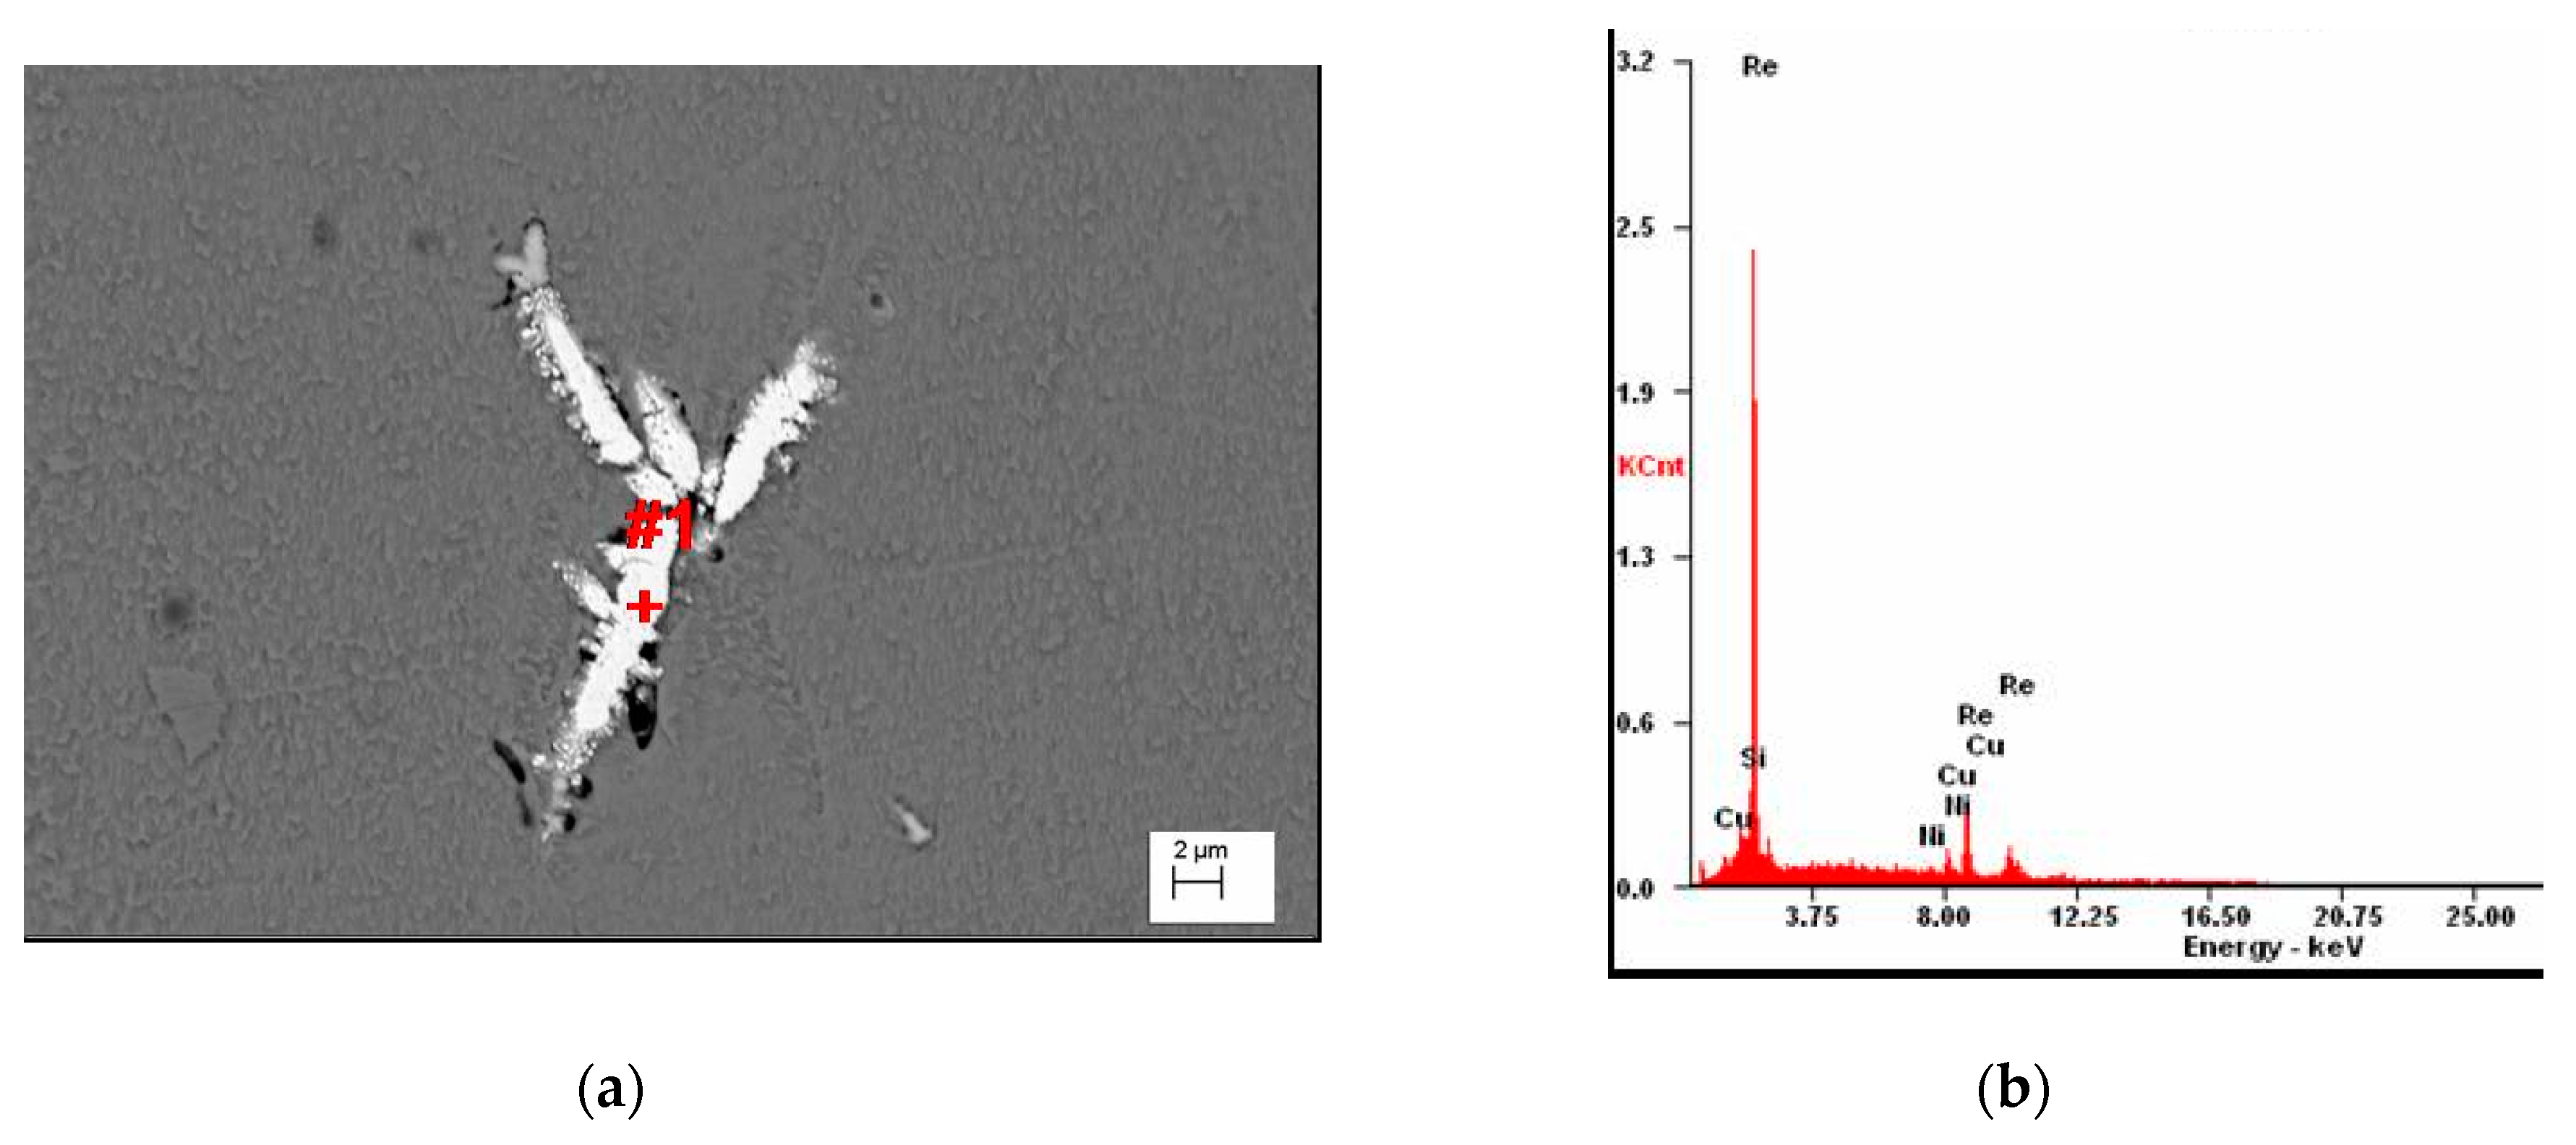
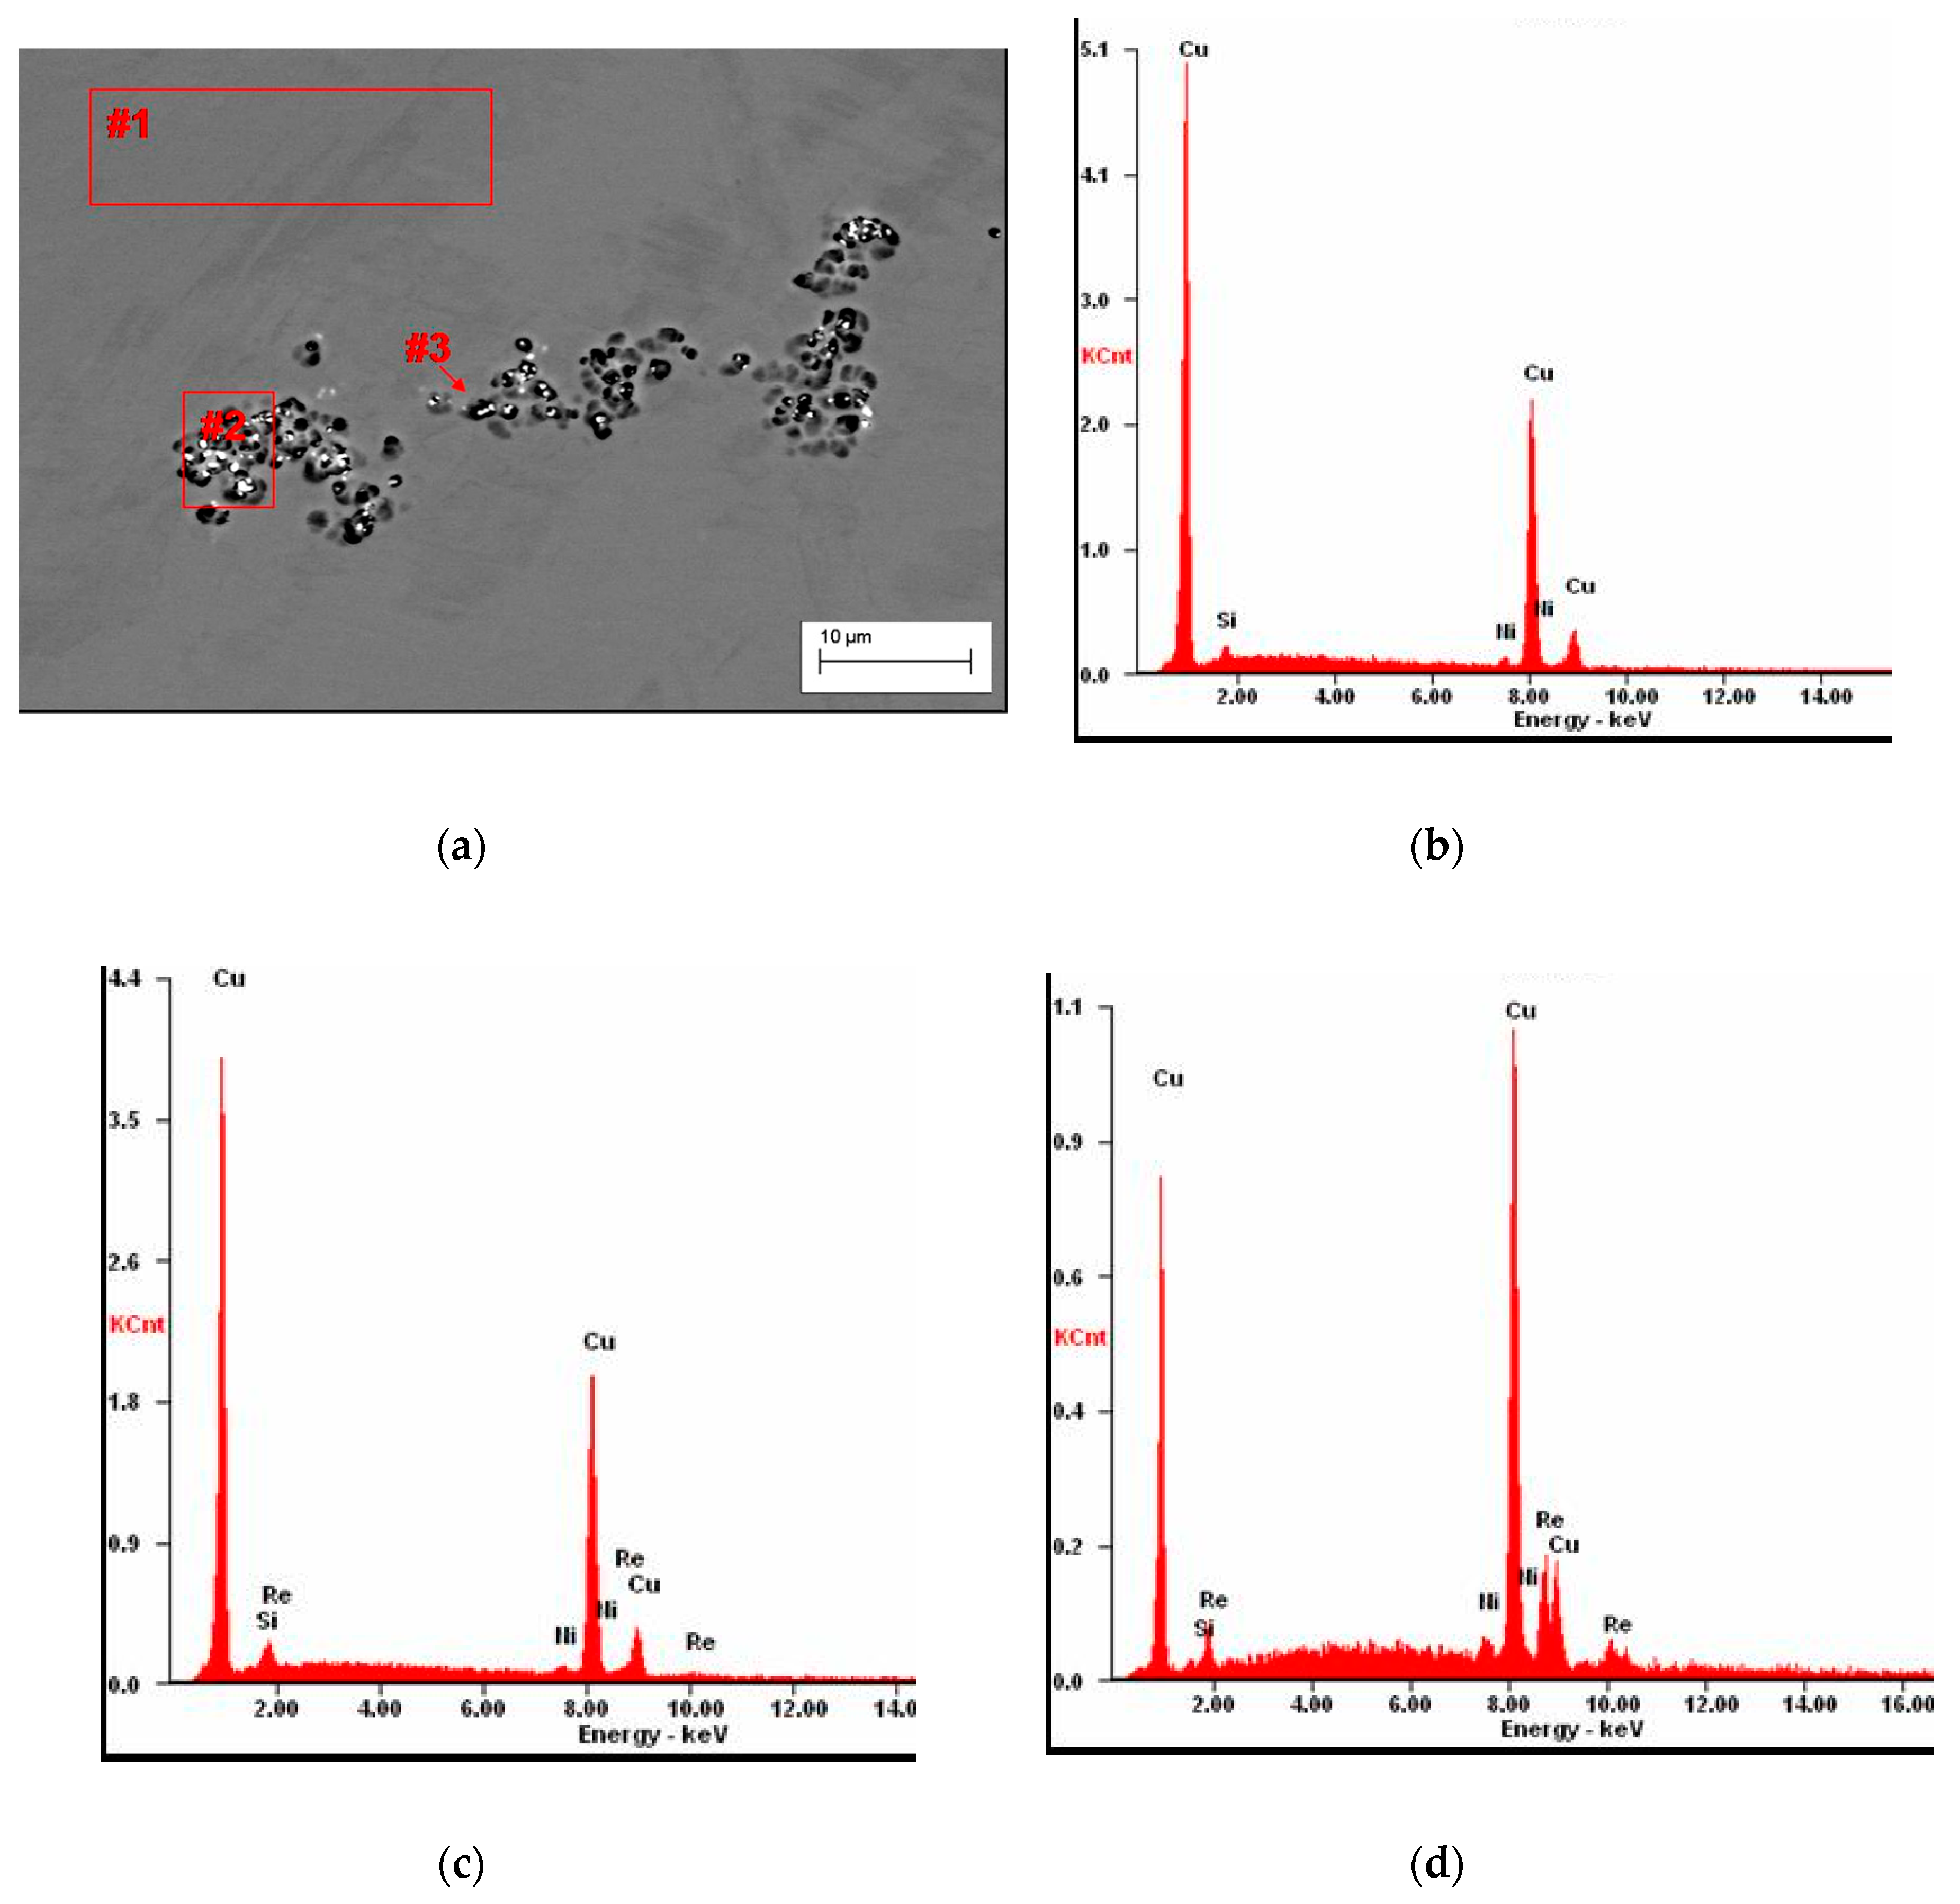
- microstructure and chemical composition investigations using EDS microanalysis was undertaken on the scanning electron microscope Zeiss Supra 25;
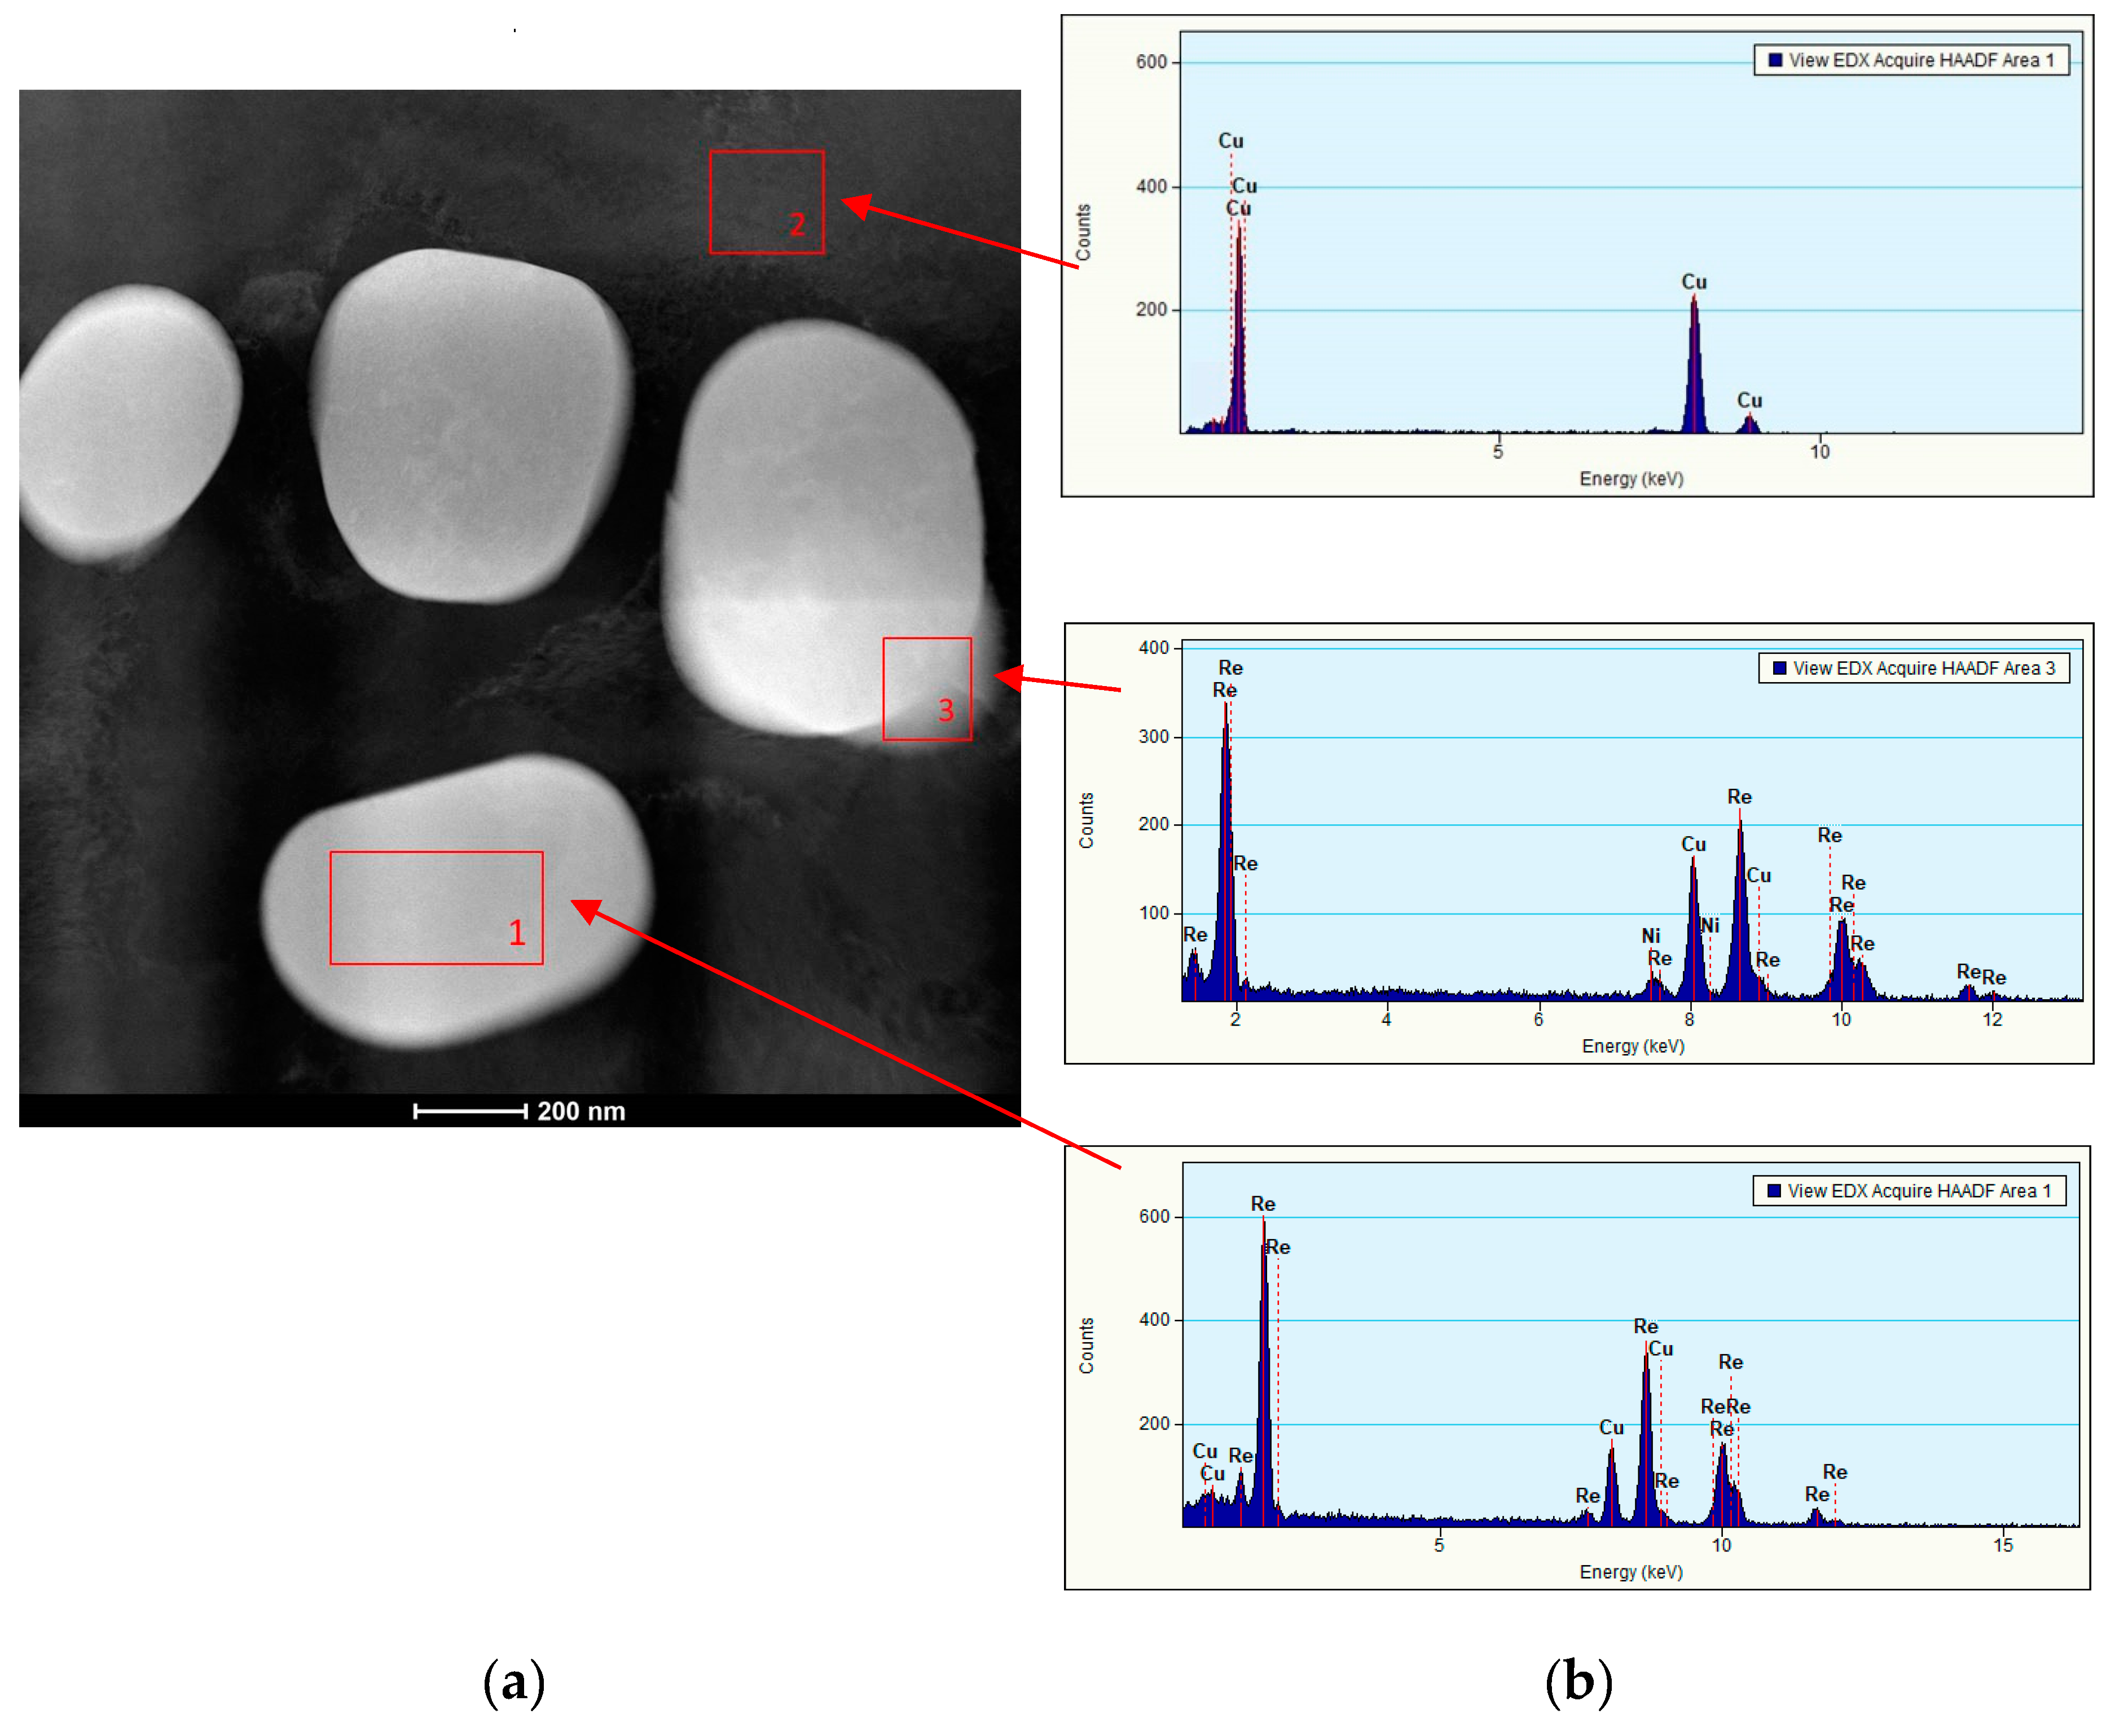
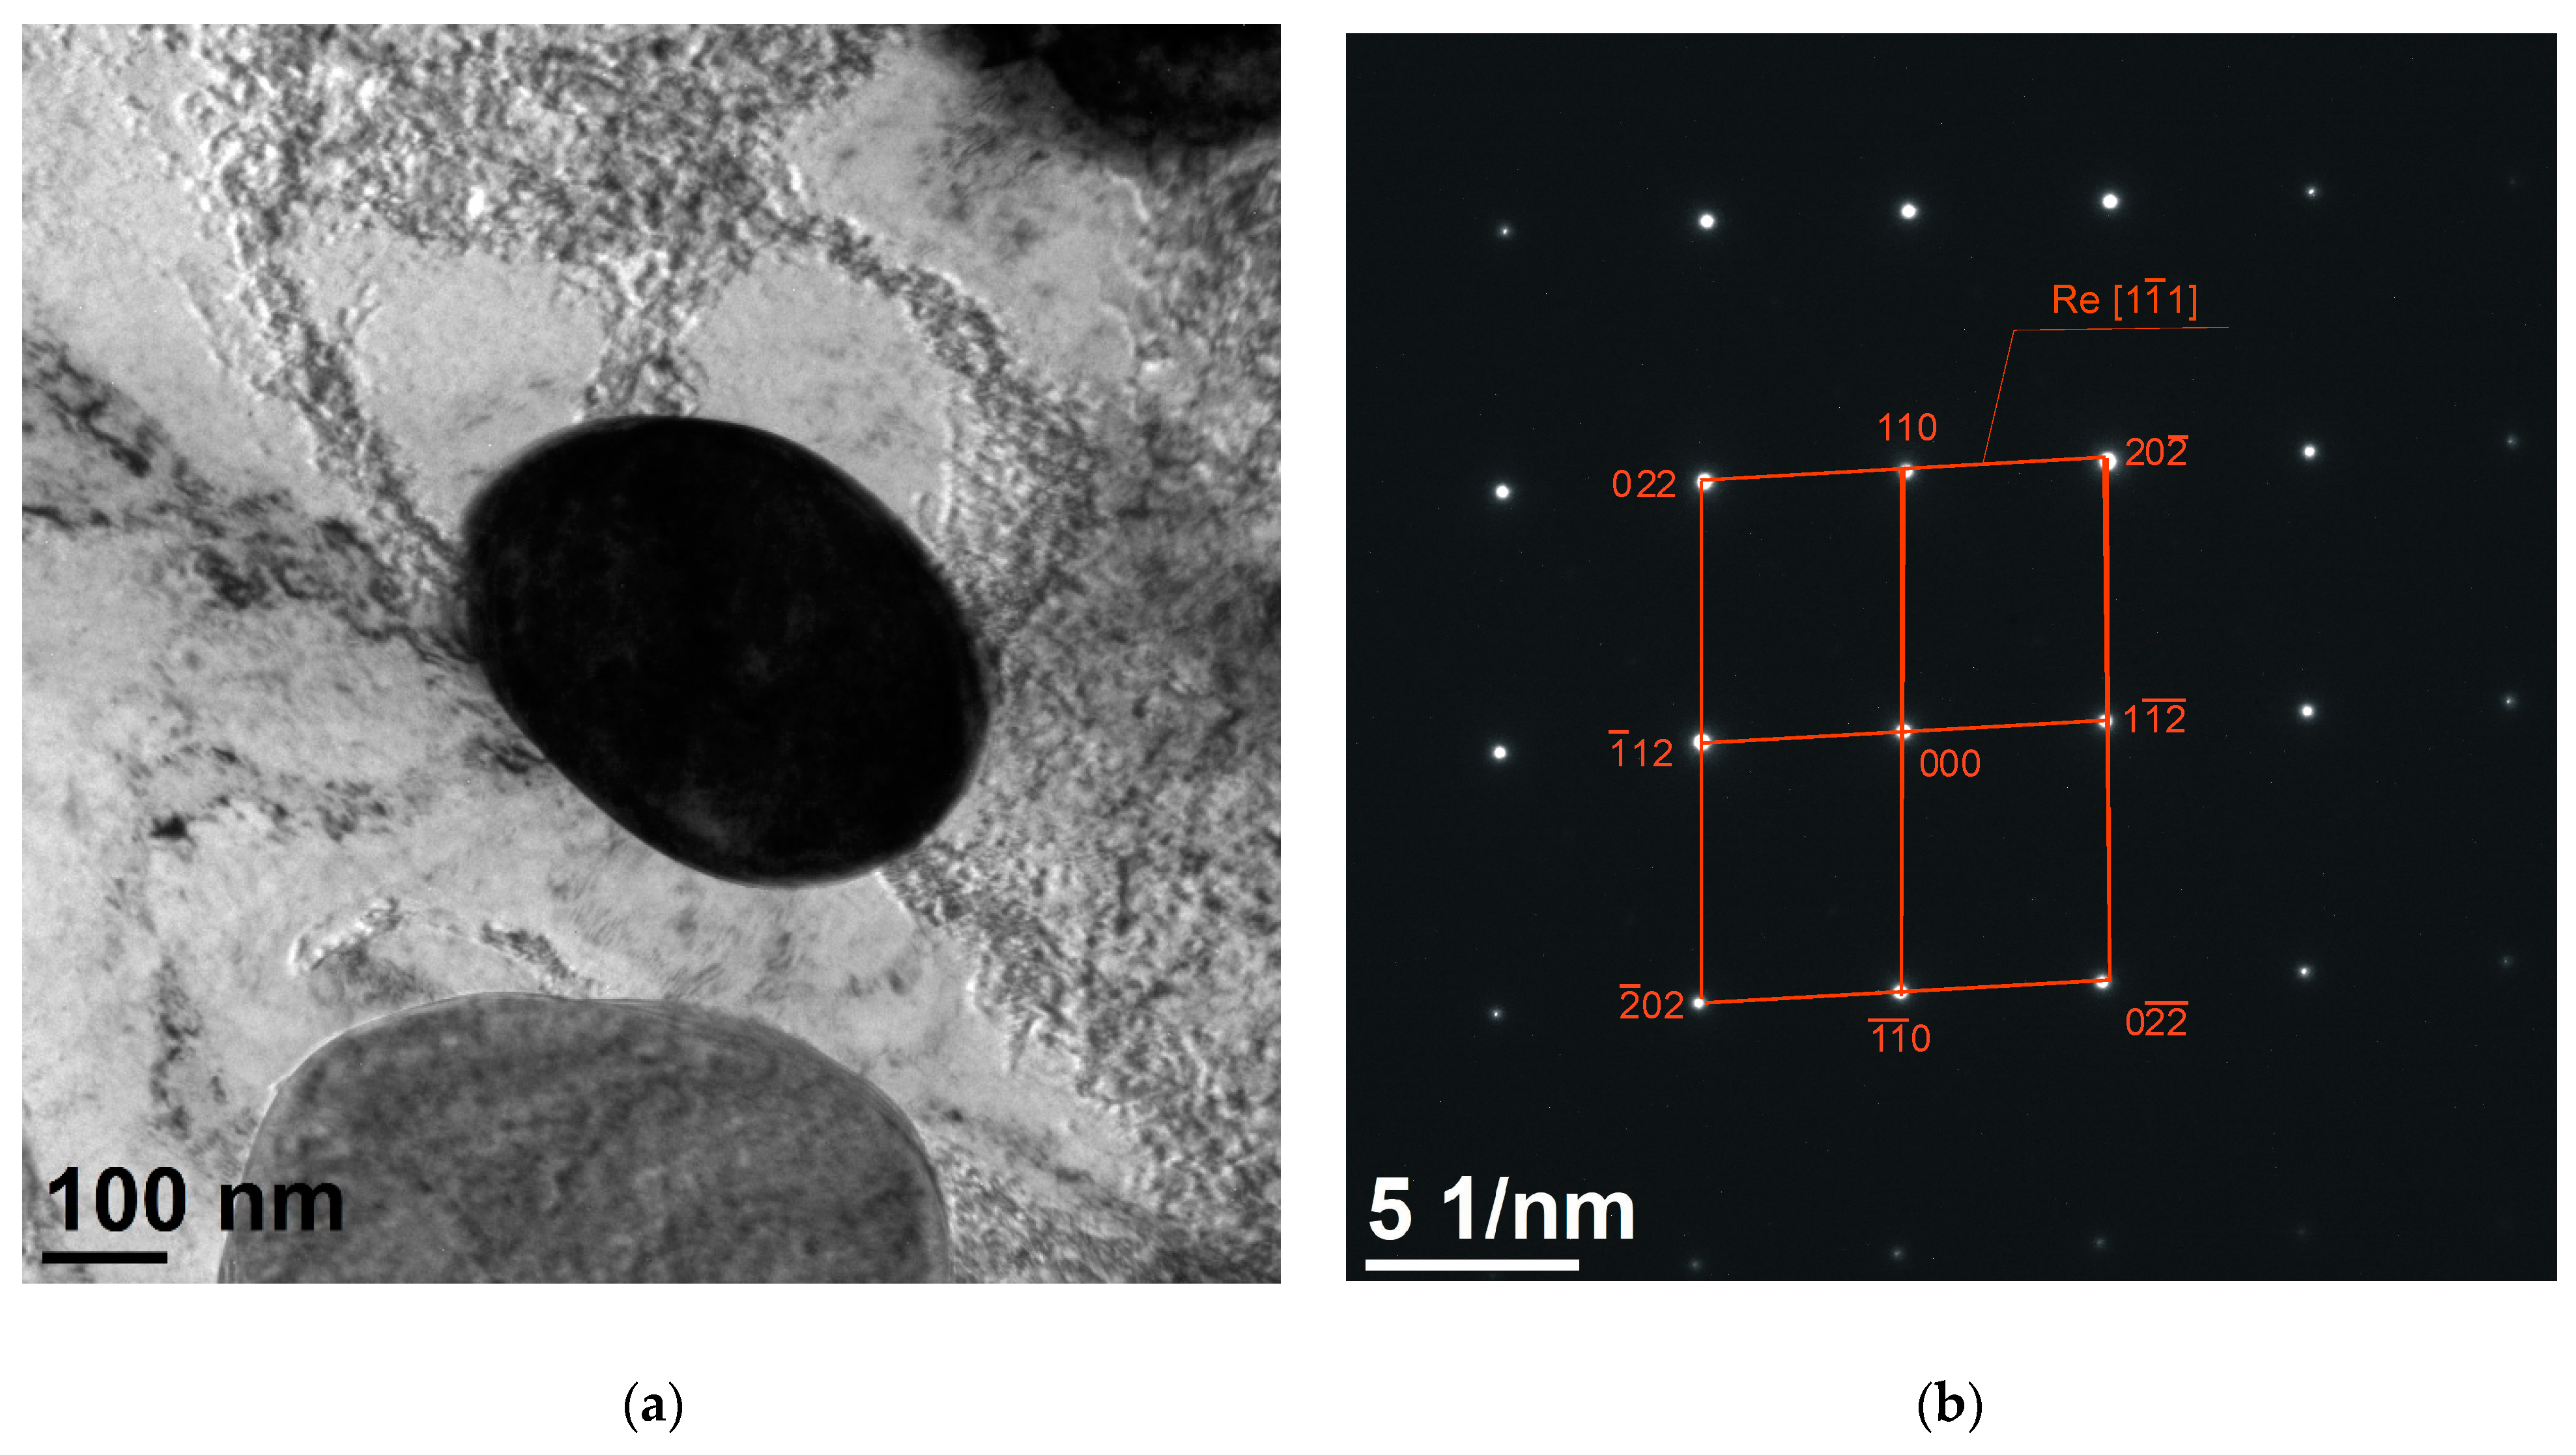
- microstructure, chemical and phase composition were carried out using a FEI TITAN TEM, using selected area diffraction (SAD, FEI Company, Hillsboro, OR, USA) at 300 kV acceleration voltage, to identify the crystalline phase structures. The obtained diffraction patterns were analysed by specialized software dedicated to solving electron diffraction patterns;
- the microhardness test was performed on the hardness tester Vickers FUTURE-TECH (FM-ARS9000, Future-Tech, Tokyo, Japan) with 1000 gf for 15 s;
- the measurement of electrical conductivity was performed with the Sigmatest Foerster device (FOERSTER, Pittsburgh, PA, USA);
3. Results and Discussion
4. Conclusions
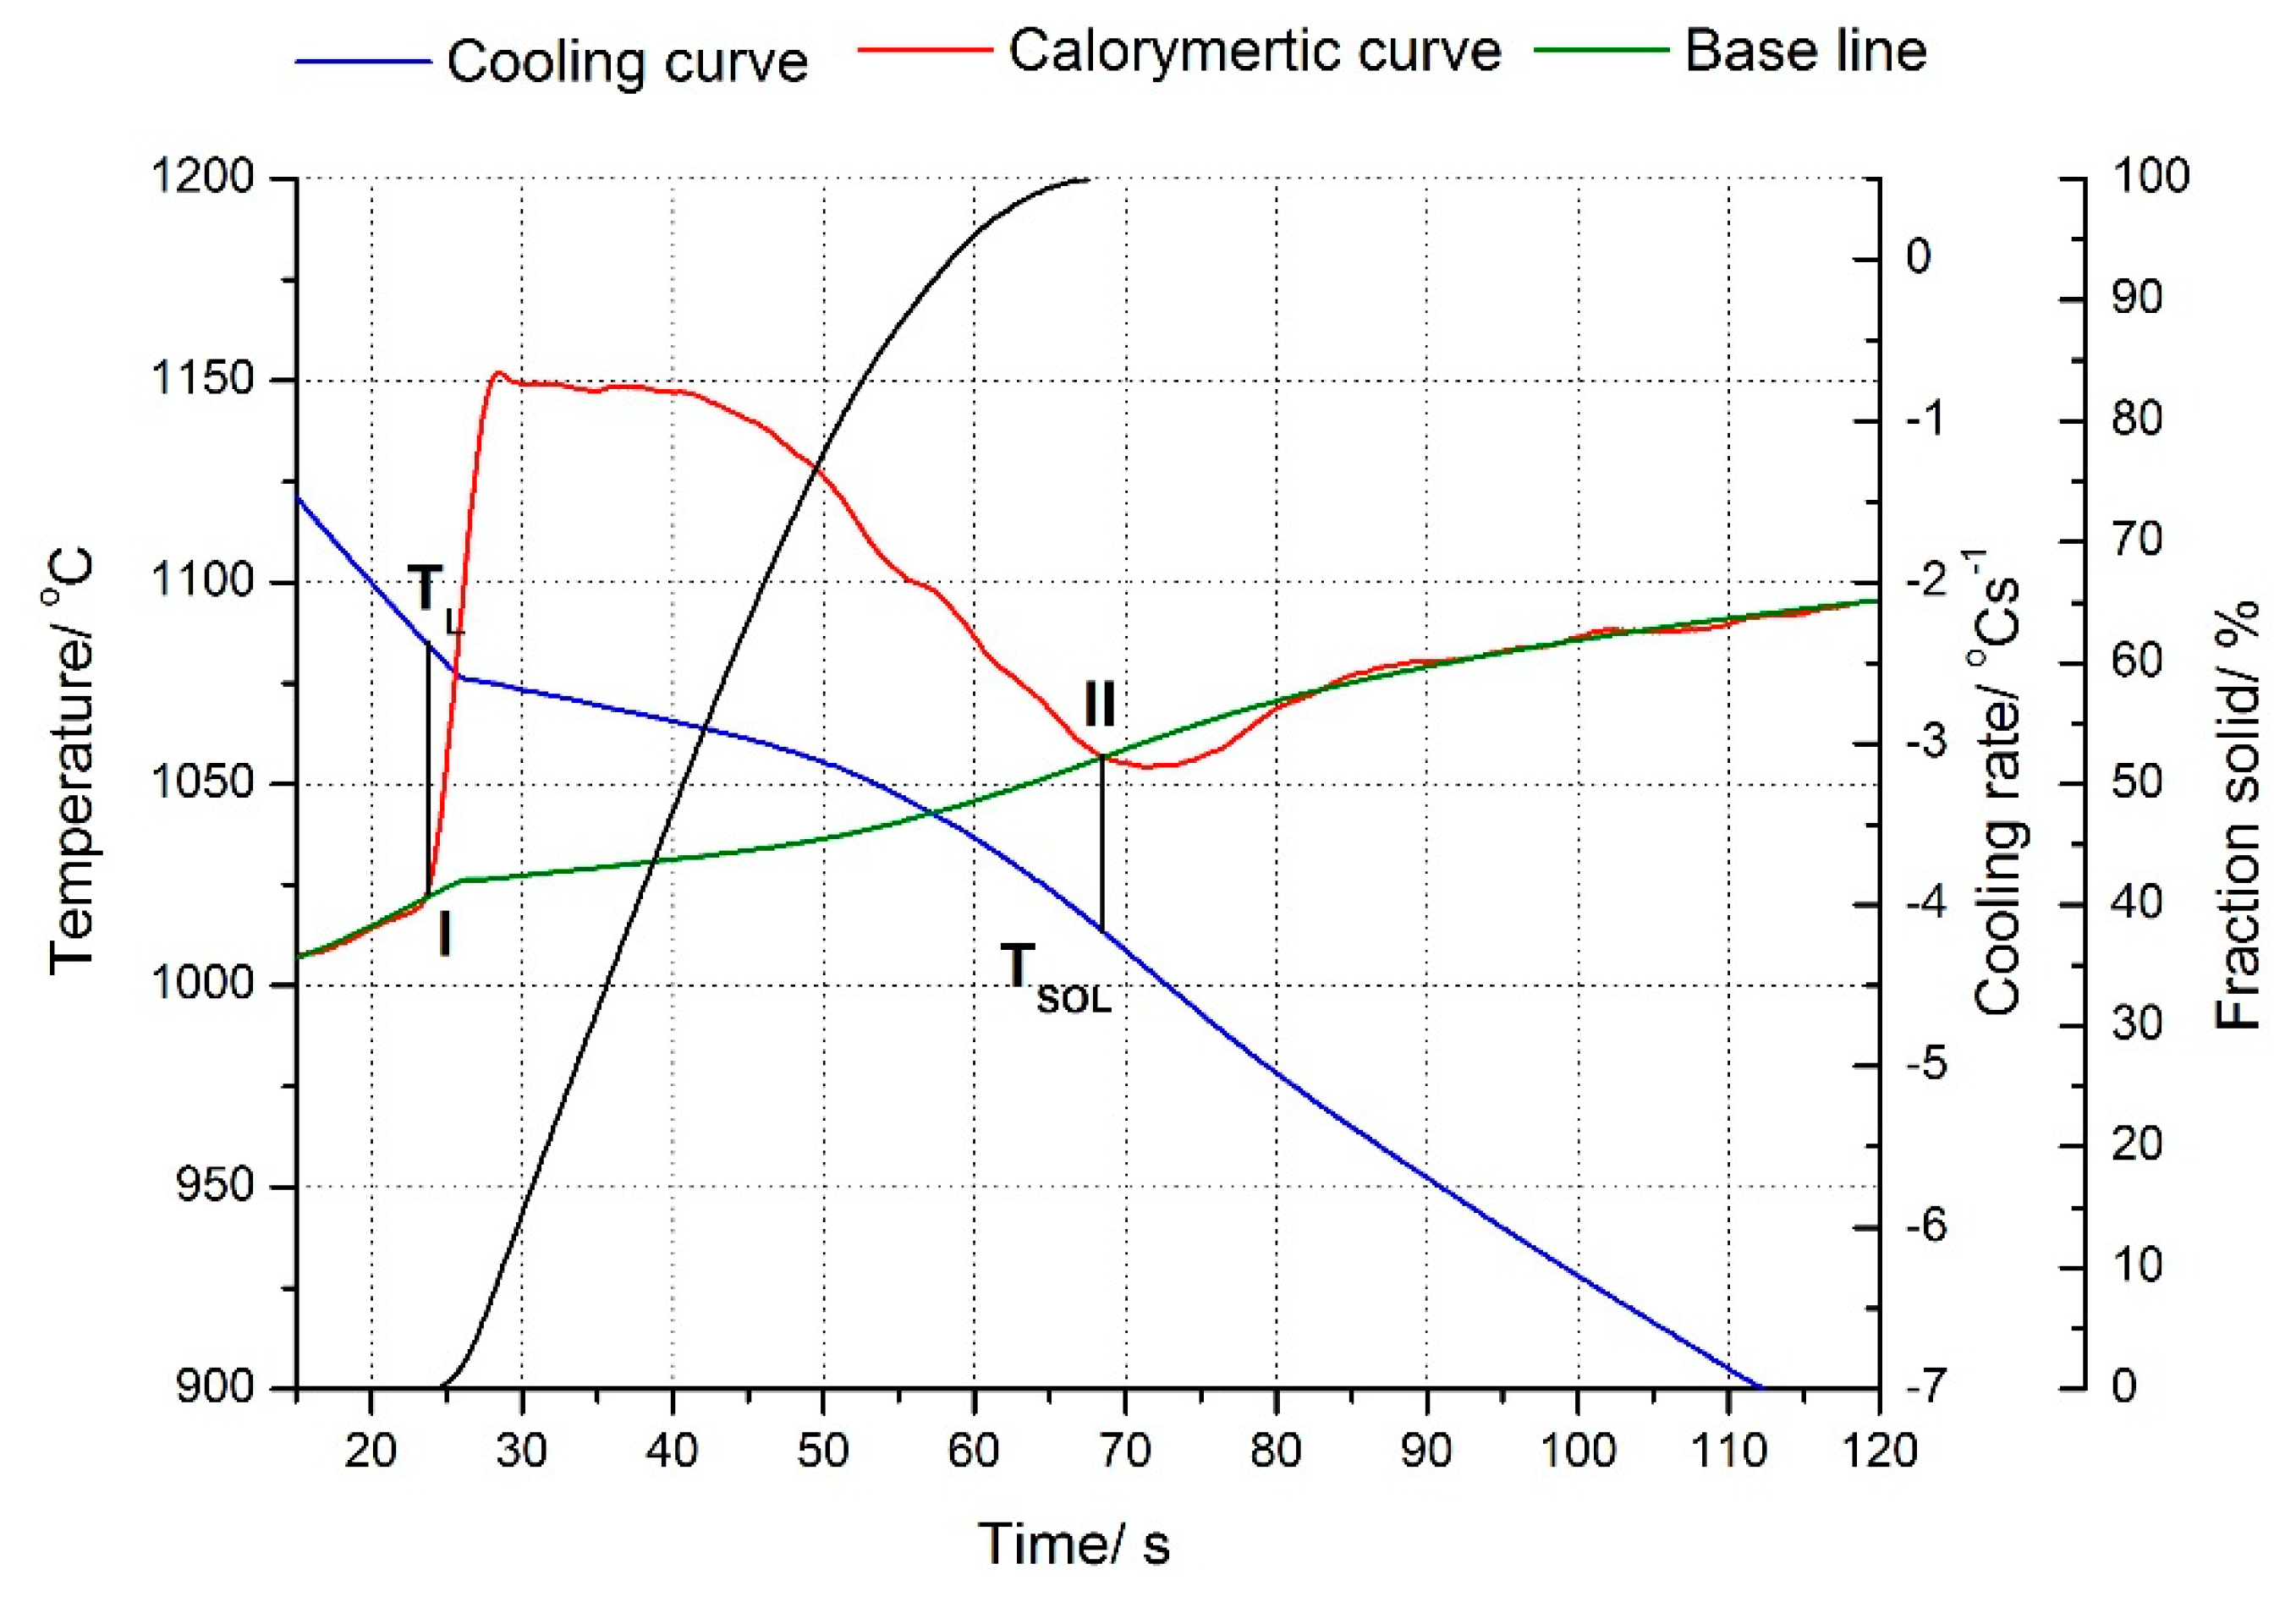
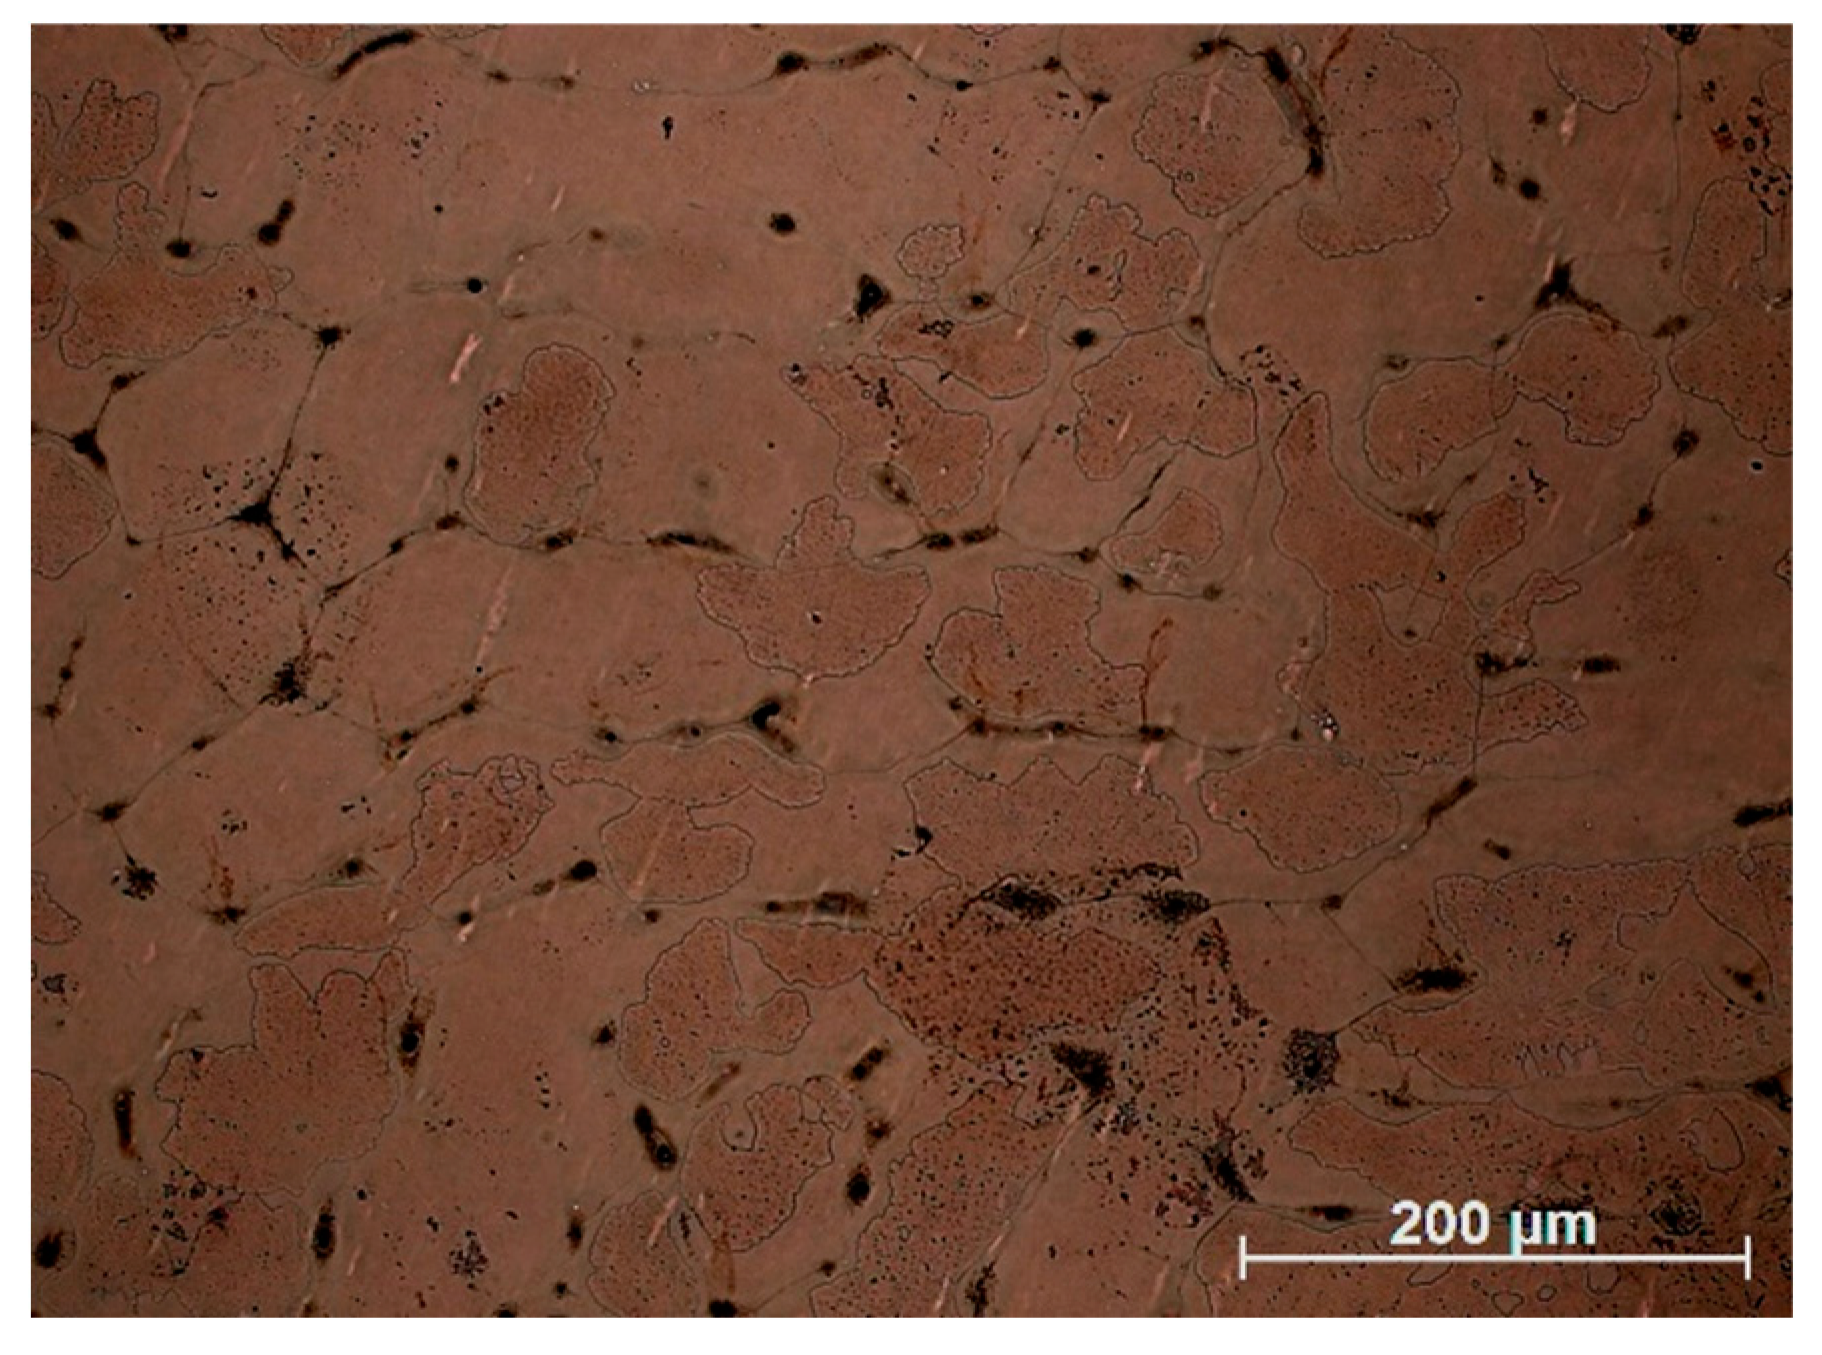
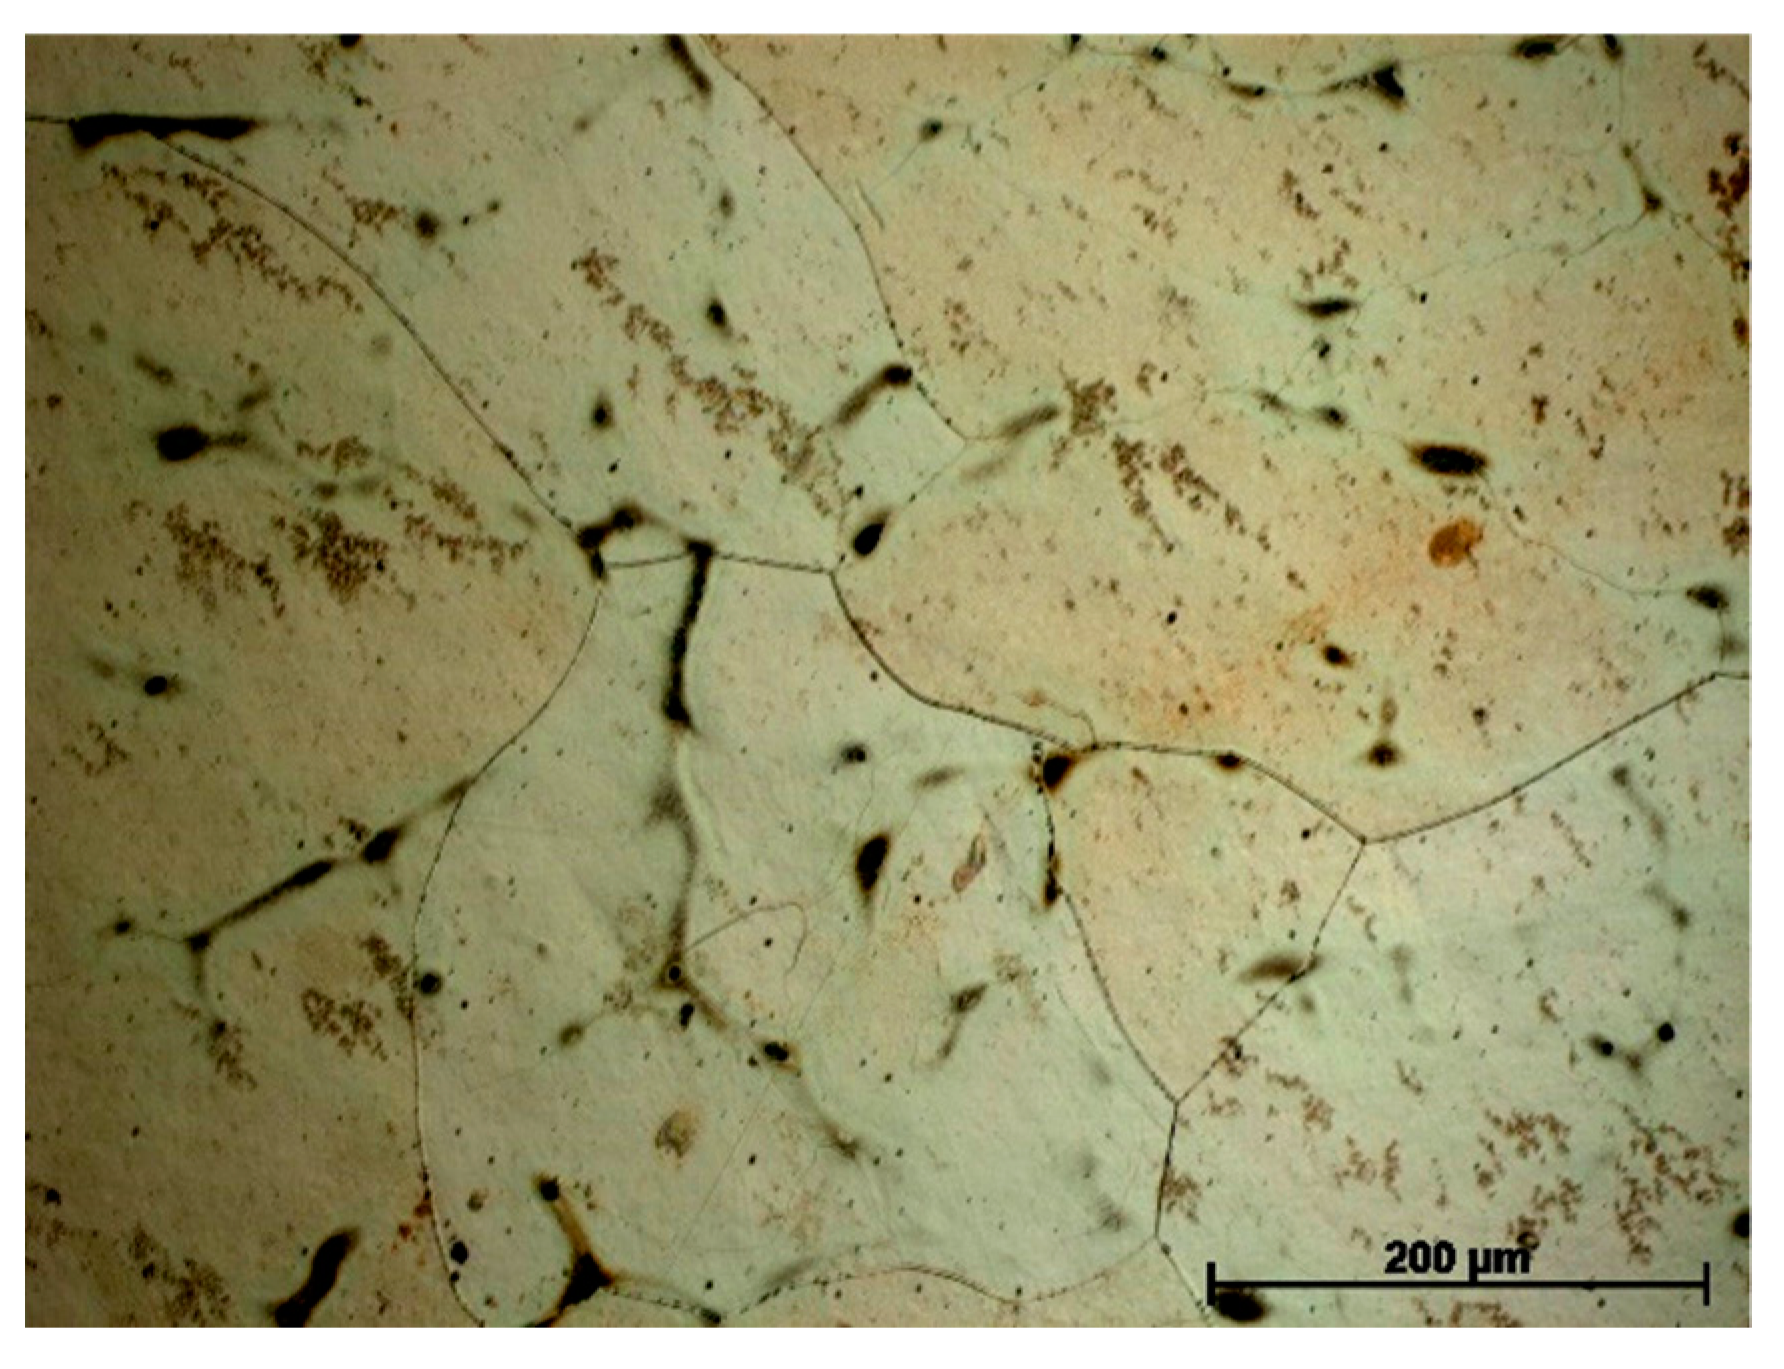
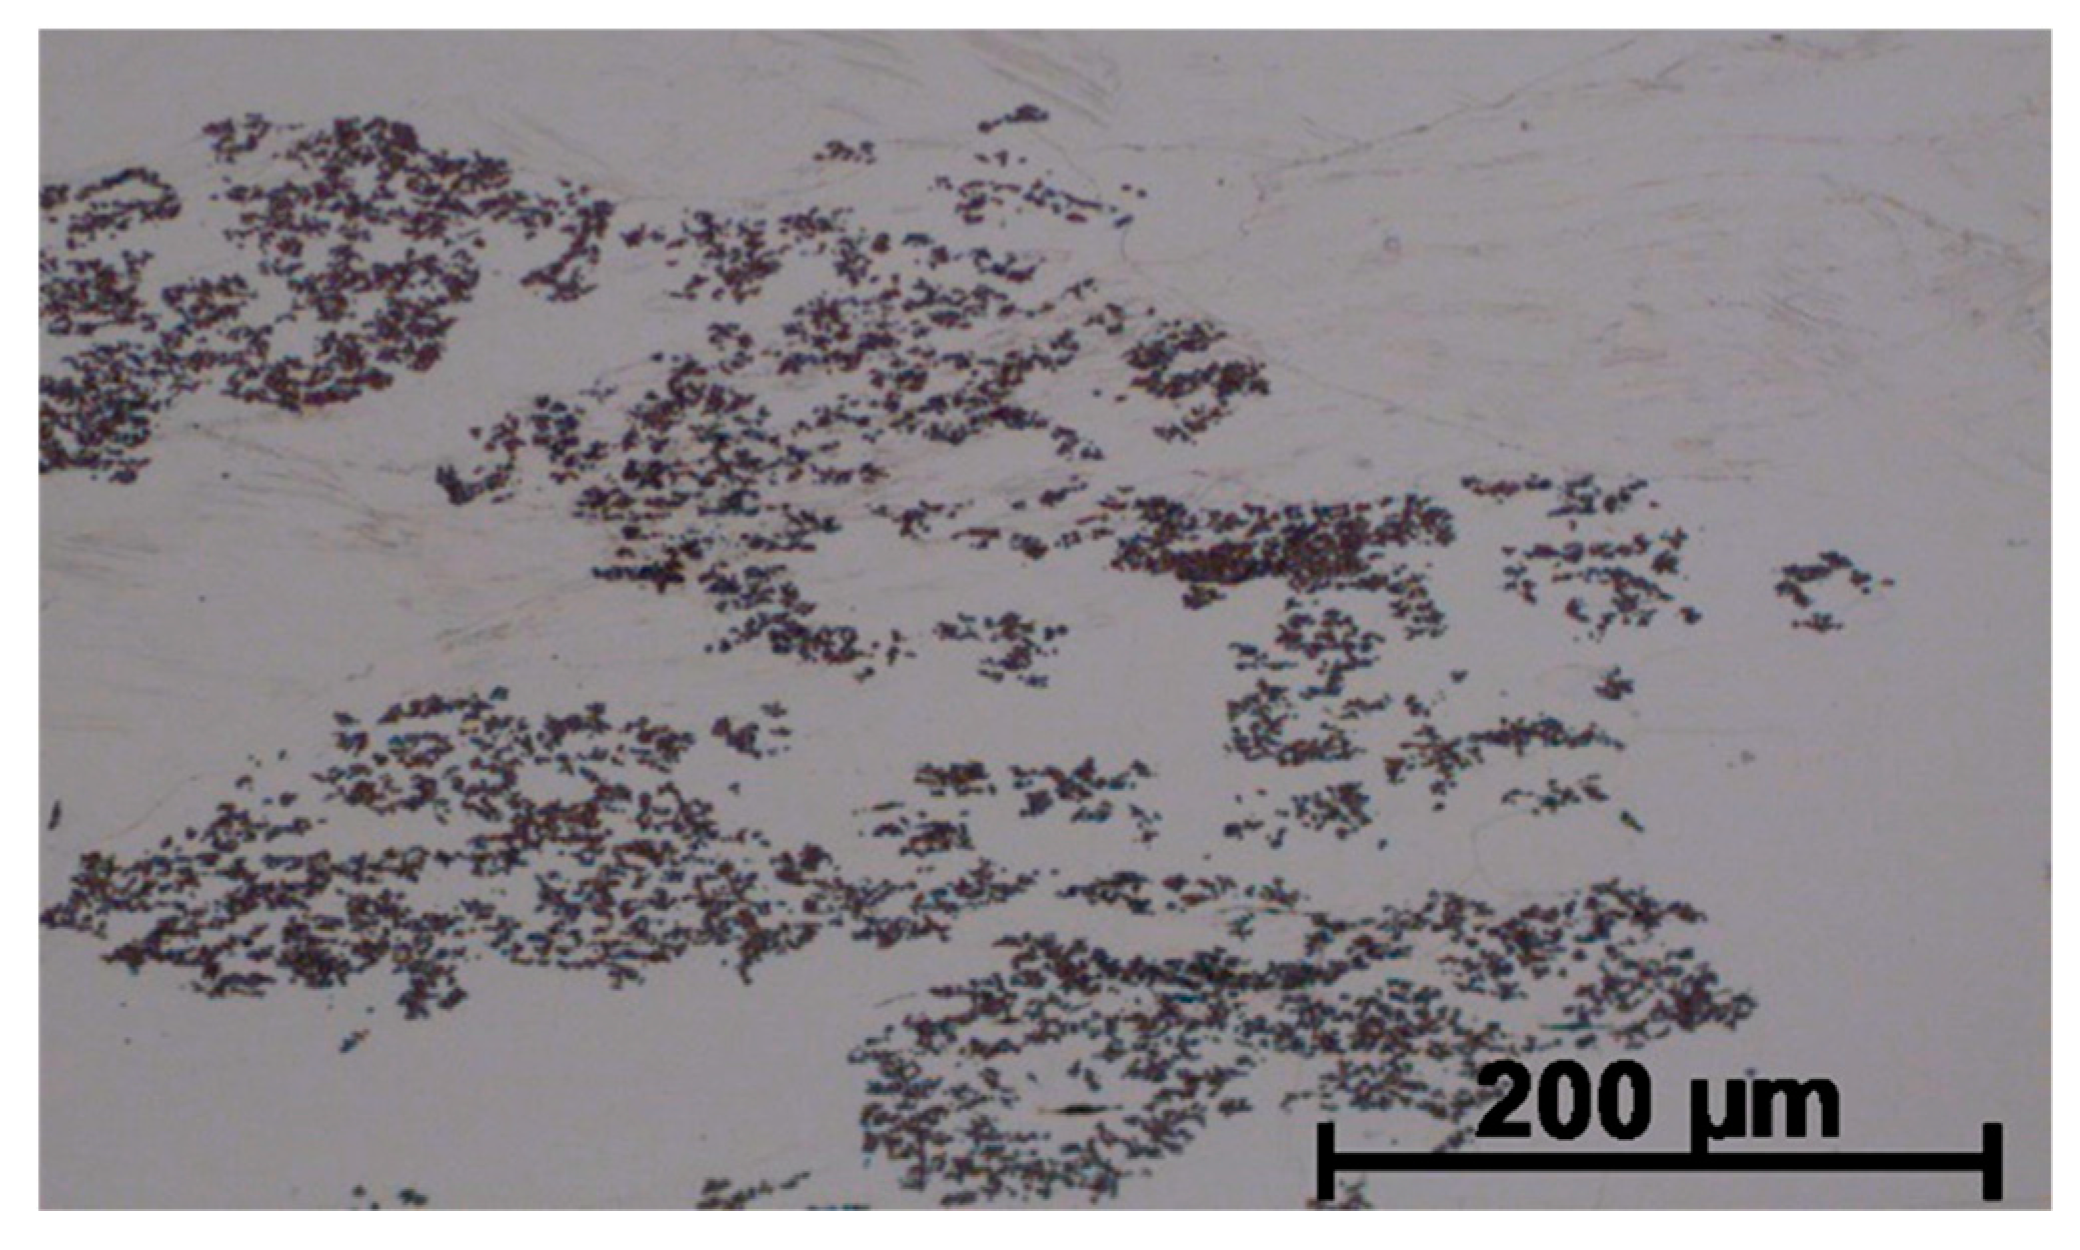
- The addition of rhenium in the form of 50% Ni–Re master alloy did not change the shape of the derivative curve during the crystallization of the alloy. The alloy was cooled from 1150 °C in order not to cause any overheating of the alloy. The alloy was annealed at the target temperature for 300 s. An increase in grain size was observed as a result of the tests due to a decrease in the crystallization rate in the range from TL to TSOL by 0.5 °C. This difference caused a two-fold increase in grain size. In the alloy with the addition of rhenium, the phases with Ni and Si have solidified at the grain boundary of the α phase, whereas, the Re phase has solidified in the form of plates (Figure 6a).
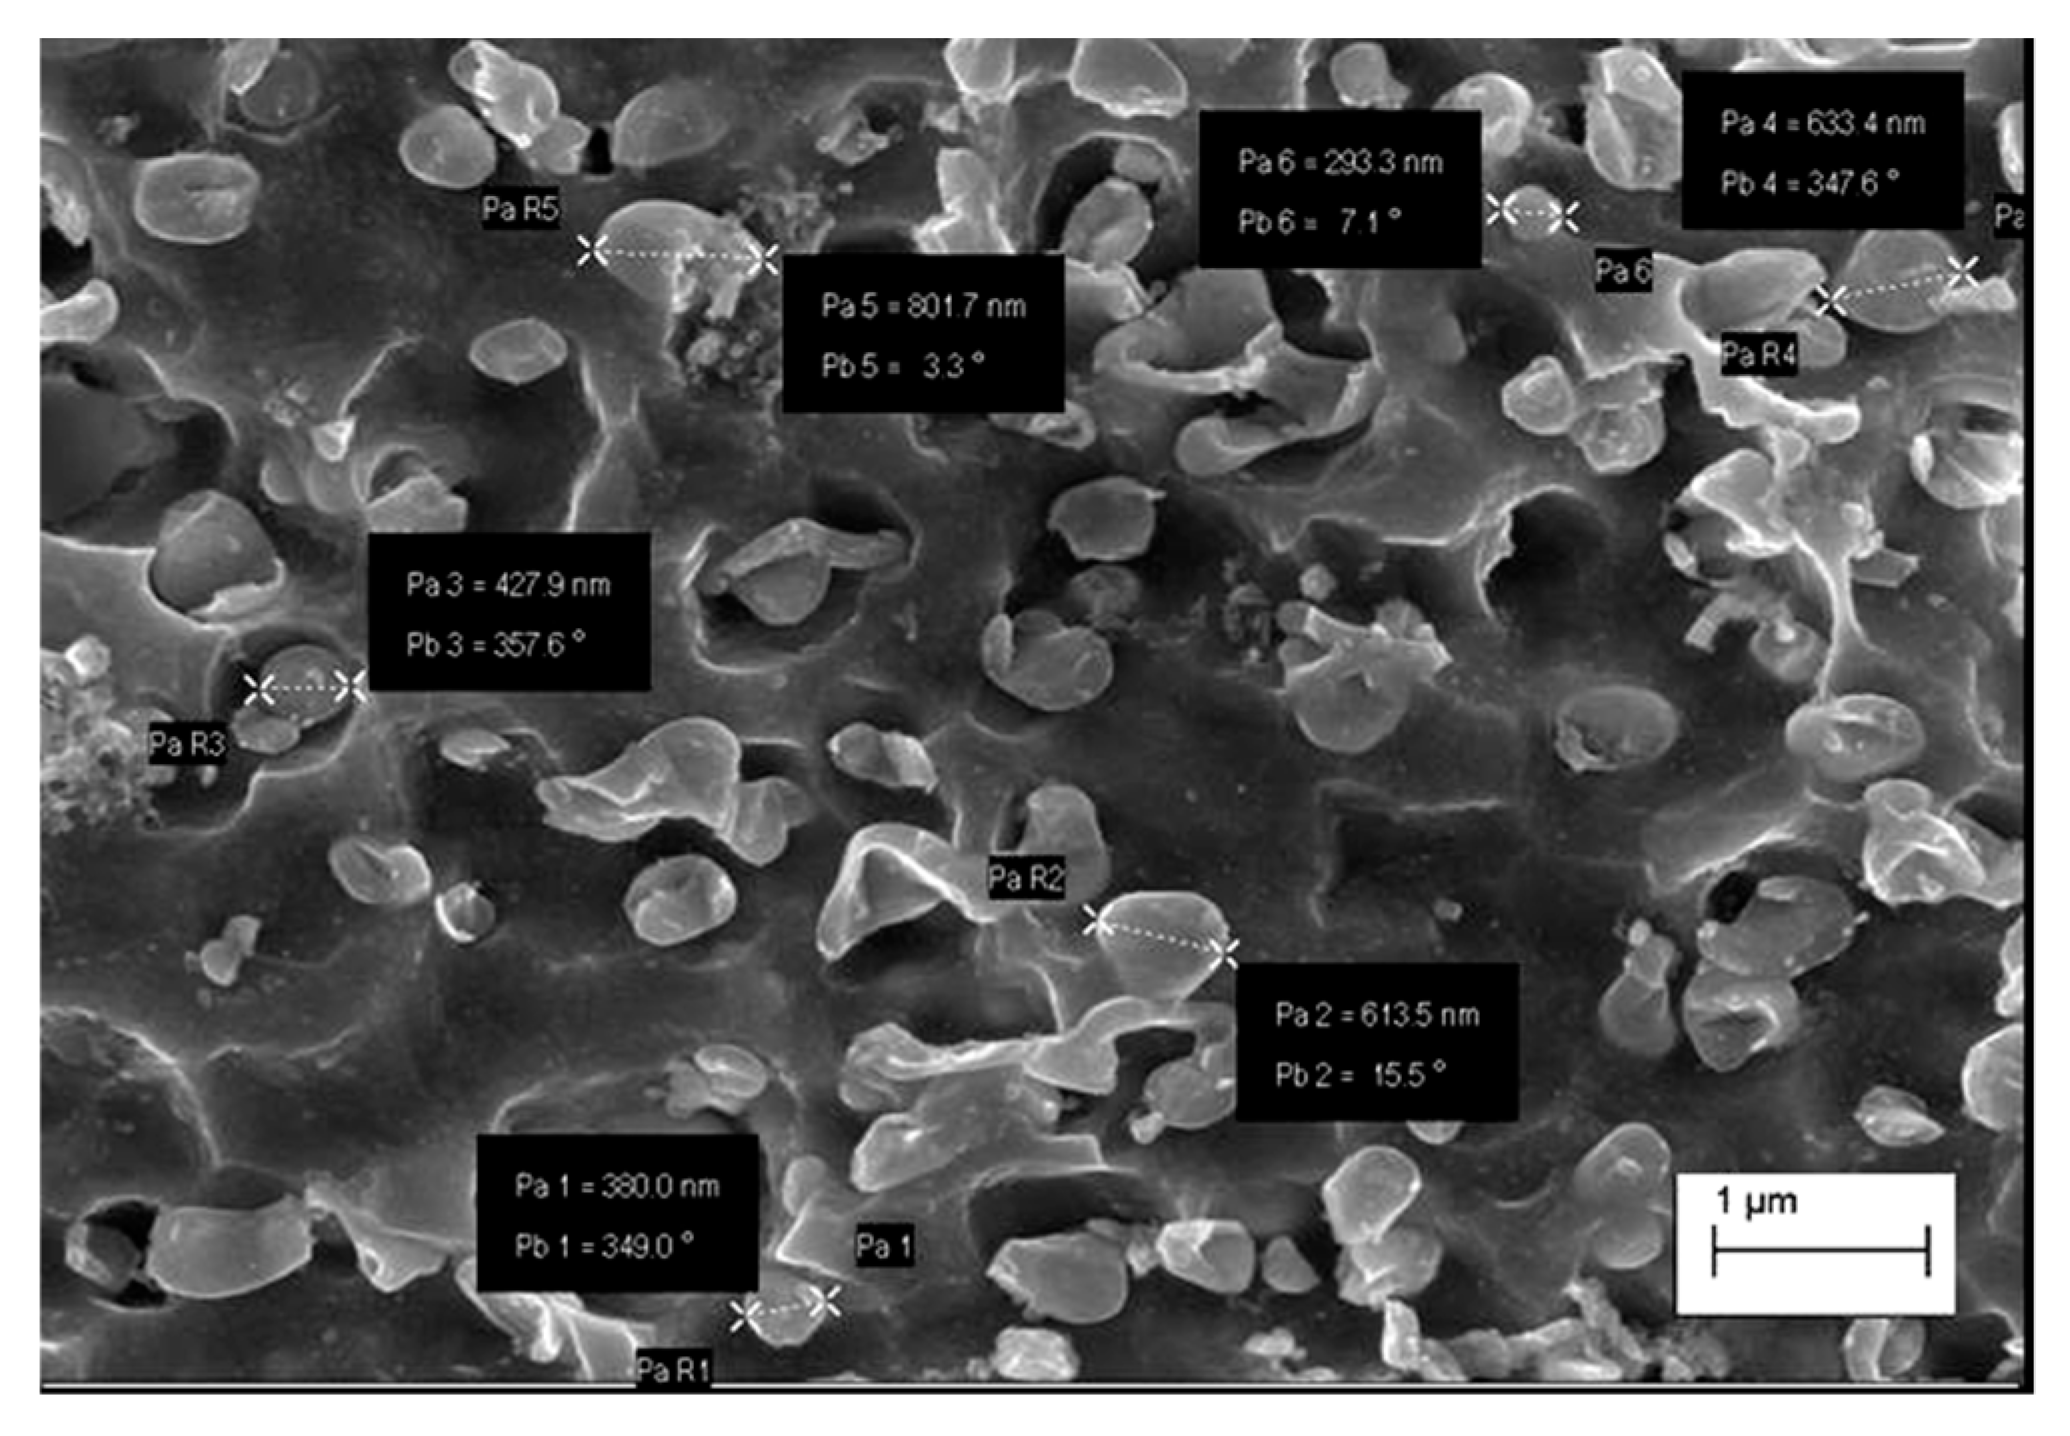
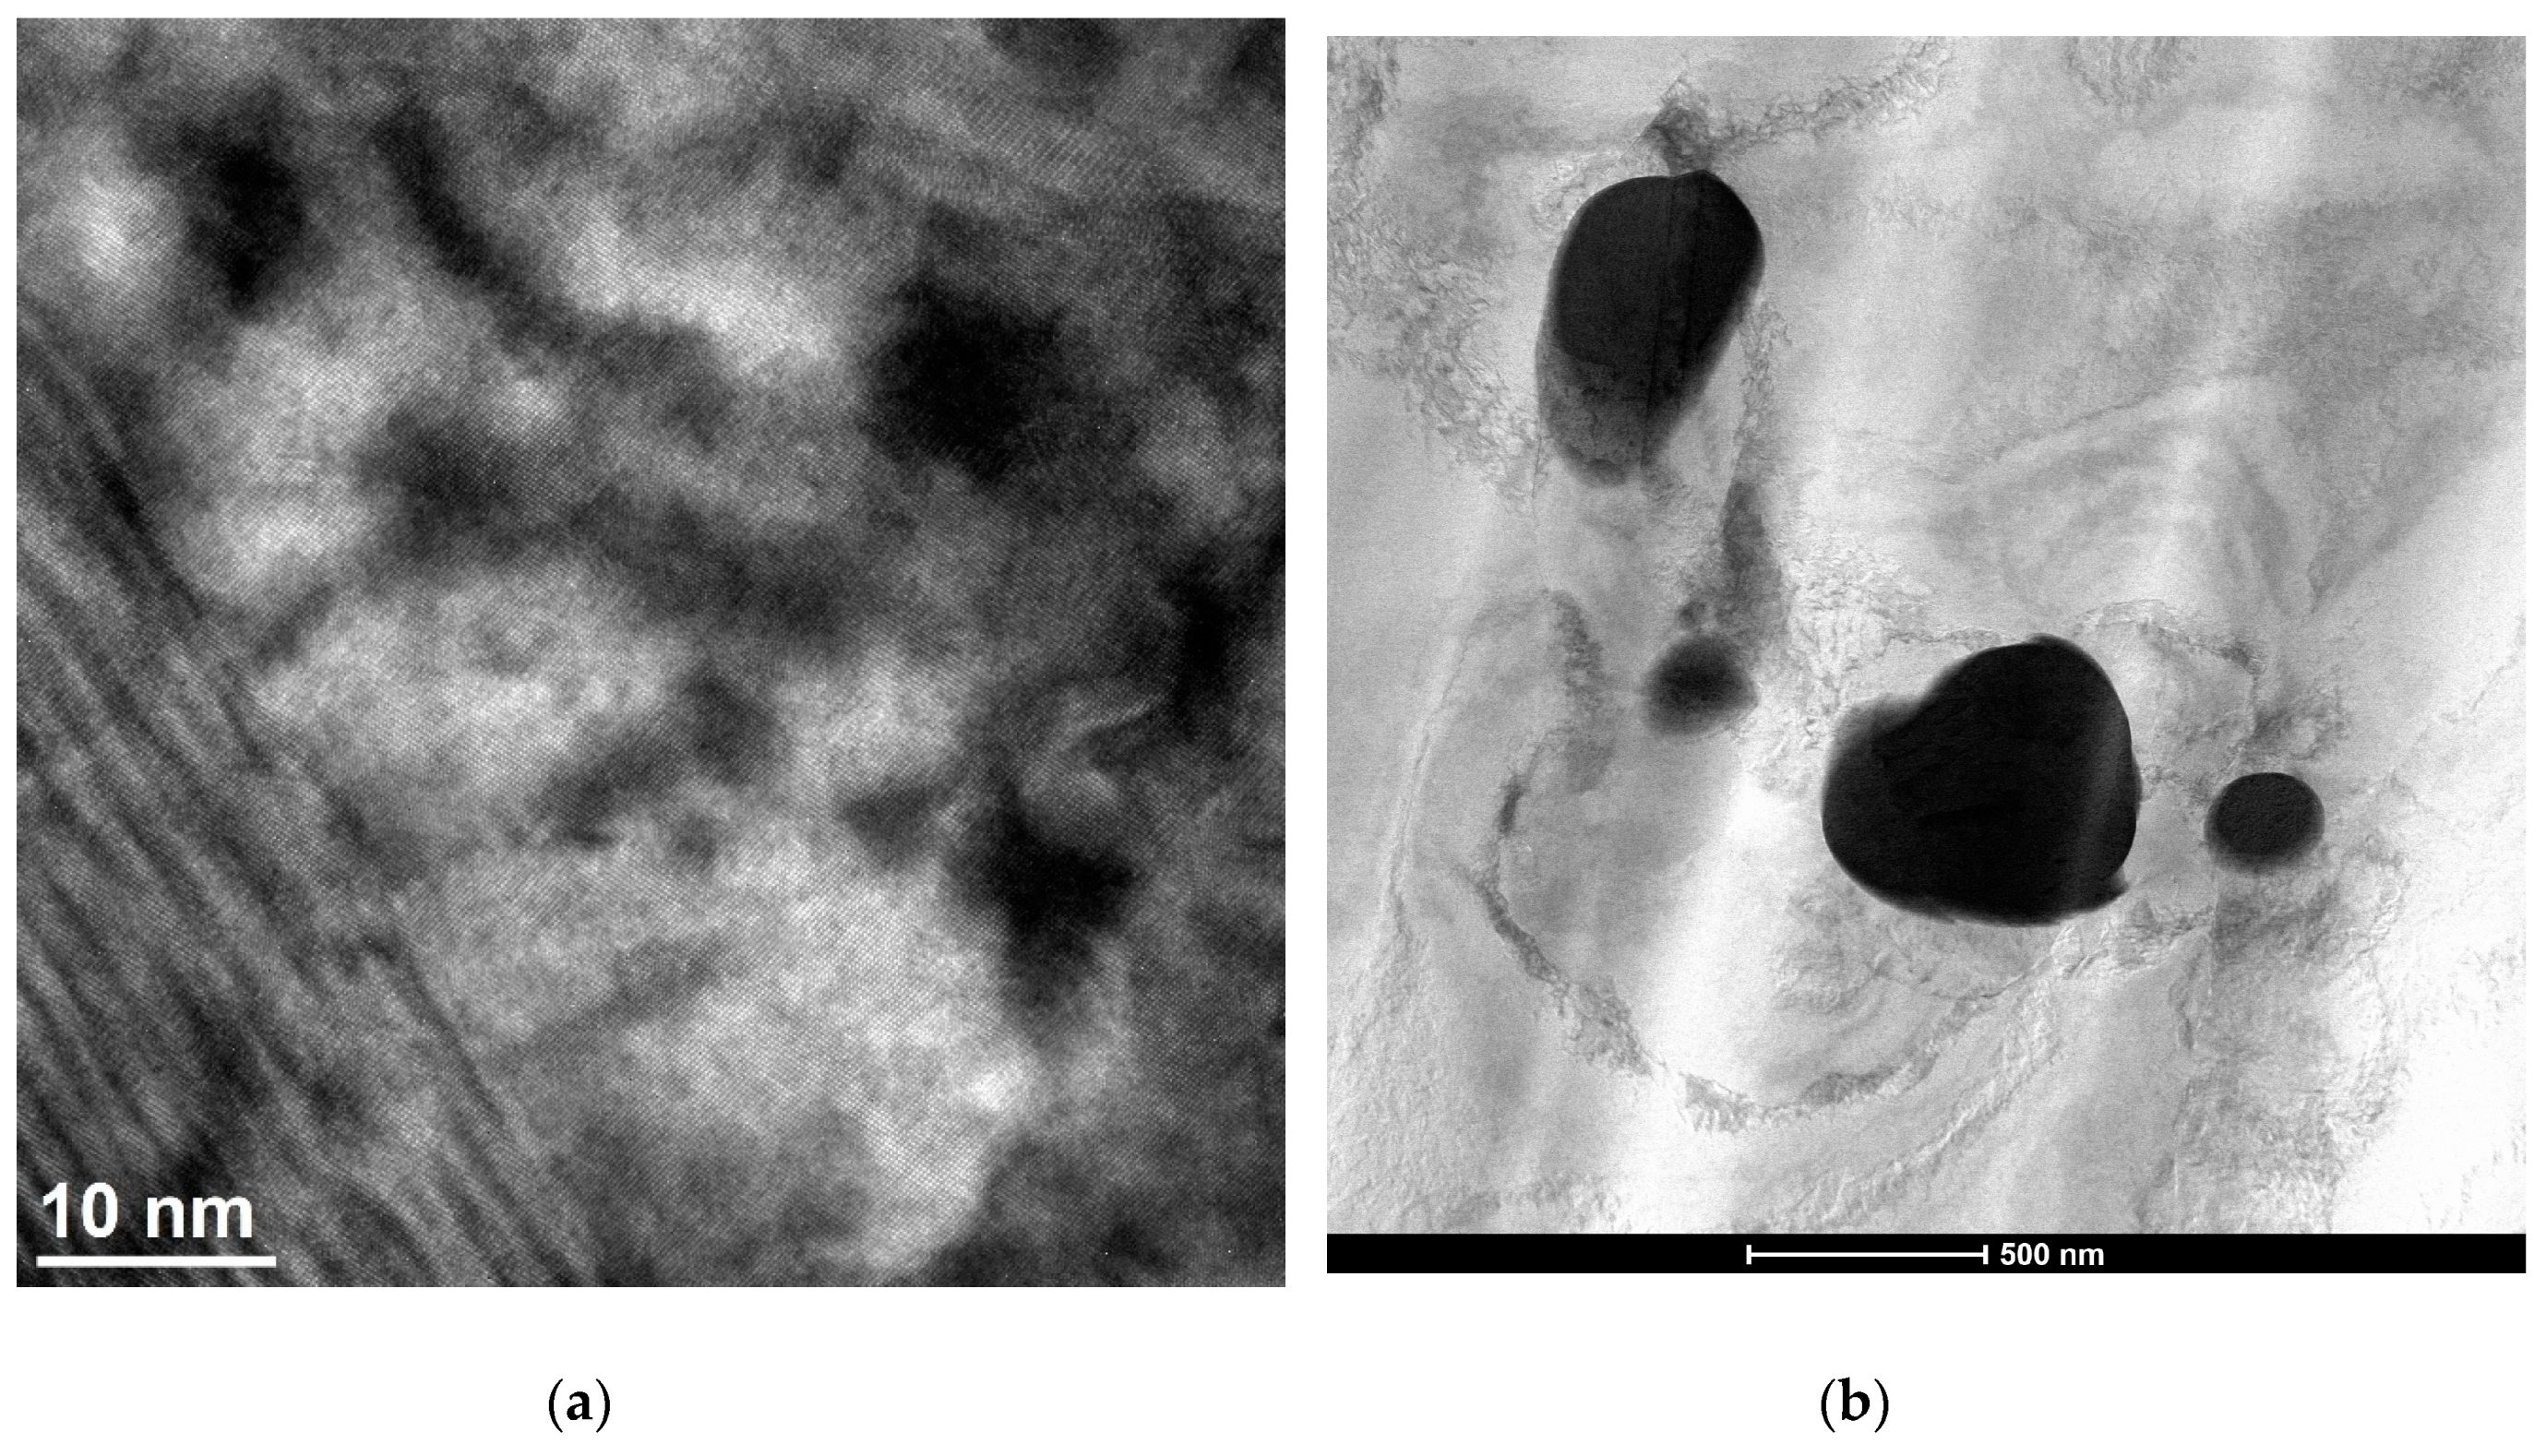
- As a result of the heat treatment consisting of solution heat treatment (SHT) and aging as well as plastic deformation, the Re phase was obtained with a size from 200 nm to 600 nm, The particles themselves are incoherent with the matrix and are responsible for strengthening the alloy. Diffraction investigations using high-resolution TEM identified nanometric Re phases with a zone axis of . As a result of using Re with a concentration of 0.6% by mass, the hardness increased by 50%, while the conductivity in the modified alloy remained at a comparable level.
Author Contributions
Funding
Conflicts of Interest
References
- Stobrawa, J.; Rdzawski, Z.W.; Głuchowski Malec, W. Microstructure and properties of CuNi2Si1 alloy processed by continuous RCS method. J. Achiev. Mater. Manuf. Eng. 2009, 37, 466–479. [Google Scholar]
- Rdzawski, Z.; Stobrawa, J. Thermomechanical processing of CuNiSiCrMg alloy. Mater. Sci. Technol. 1993, 9, 142–149. [Google Scholar] [CrossRef]
- Krupińska, B.; Rdzawski, Z. Effect of Re addition on the crystallization, heat treatment and structure of the Cu–Ni–Si-Cr alloy. J. Therm. Anal. Calorim. 2018, 134, 173–179. [Google Scholar] [CrossRef]
- Krupiński, M.; Krol, M.; Krupinska, B.; Mazur, K.; Labisz, K. Influence of Sr addition on microstructure of the hypereutectic Zn–Al–Cu alloy. J. Therm. Anal. Calorim. 2018, 133, 255–260. [Google Scholar] [CrossRef]
- Rdzawski, Z. Copper Alloy; Silesian University of Technology: Gliwice, Poland, 2009. [Google Scholar]
- Knych, T.; Kwaśniewski, P.; Kaweck, I.A. Impact of supersaturation conditions of CuNi2Si alloy on its mechanical and electrical properties after artificial aging. In Proceedings of the 37th School of Materials Engineering, Krynica, Poland, 29 September 2009; pp. 135–138. (In polish). [Google Scholar]
- Zhao, D.; MDong, Q.; Liu, P.; Kang, B.X.; Huang, J.L.; Jin, Z.H. Structure and strength of the age hardened Cu-Ni-Si alloy. Mater. Chem. Phys. 2003, 79, 81–86. [Google Scholar] [CrossRef]
- Li, J.; Huang, G.; Mi, X.; Peng, L.; Xie, H.; Kang, Y. Effect of Ni/Si Mass Ratio and Thermomechanical Treatment on the Microstructure and Properties of Cu-Ni-Si Alloys. Materials 2019, 12, 2076. [Google Scholar] [CrossRef] [PubMed]
- Xie, H.; Jia, L.; Lu, Z. Microstructure and solidification behavior of Cu-Ni-Si alloys. Mater. Charact. 2009, 60, 114–118. [Google Scholar] [CrossRef]
- Zhang, Y.; Liu, P.; Tian, B.; Jia, S.; Liu, Y. The effects of aging precipitation on the recrystallization of CuNiSiCr alloy. Sci. Procedia Eng. 2012, 27, 1789–1793. [Google Scholar] [CrossRef]
- Snopinski, P.; Krol, M.; Tanski, T.; Krupinska, B. Effect of cooling rate on microstructural development in alloy ALMG9. J. Therm. Anal. Calorim. 2018, 133, 379–390. [Google Scholar] [CrossRef]
- Connatable, D.; Thomas, O. First-principles study of nickel-silicides order phases. J. Alloy. Compd. 2011, 509, 2639–2644. [Google Scholar] [CrossRef]
- Wang, C.; Zhu, J.; Lu, Y.; Guo, Y.; Liu, X. Thermodynamic description of the Cu-Ni-Si system. J. Ph. Equilib. Diffus. 2014, 35, 93–104. [Google Scholar] [CrossRef]
- Krupinski, M. Crystallisation kinetics and structure of modified Zn–Al–Cu alloys. J. Therm. Anal. Calorim. 2018. [Google Scholar] [CrossRef]
- Krupinski, M. Effect of addition Ce on crystallisation kinetics and structure of Zn-Al-Cu alloys. Arch. Metall. Mater. 2018, 63, 1173–1178. [Google Scholar]
- Krupińska, B. Structure and properties of Zn-Al-Cu alloys with alloying additives. In Mechanical and Materials Engineering of Modern Structure and Component Design; Springer: Cham, Switzerland, 2015; pp. 341–349. [Google Scholar]
- Krupiński, M.; Rdzawski, Z.; Krupińska, B.; Szajnar, J.; Czok, B. Mortar Alloy Useful for Preparing Lanthanum-Modified Zinc-Aluminum-Copper Alloy, Comprises Lanthanum, and the Rest of Aluminum; Politechnika Slaska Gliwicach; Politechnika Slaska Pstrowski: Gliwice, Poland, 2018. [Google Scholar]
- Gornastyrev, Y.N.; Kotsnelson, M.I.; Peschanskikh, G.V.; Trefilov, A.V. On the nature of the rhenium effect. Peculiarities of the bane structure and clastic moduli of W—and Mo—based alloys. Phys. Stat. Sol. 1991, 164, 185–191. [Google Scholar] [CrossRef]
- Wojtasik, K.; Stolarz, S.; Walczuk, E. Research on the structure and properties of Wolfram-Copper-Rhine materials. In Proceedings of the 7th Powder Metallurgy Conference, Orlando, FL, USA, 5–10 June 1988. [Google Scholar]
- Wojtasik, K.; Stolarz, S.; Walczuk, E. New Silver-Wolfram-Ren contact material. Powder Metall. 1988, 21, 74–78. [Google Scholar]
- Wojtasik, K. Impact of rhenium addition on technological properties of tungsten-silver materials. Metall. Powders 1992, 25, 153–159. [Google Scholar]
- Bose, A.; Ierman, G.; German, R.M. Rhenium Alloing of Tungsten Heavy Alloys. Powder Metall. Int. 1989, 21, 9–13. [Google Scholar]
- Geddes, B.; Leon, H.; Huang, X. Superalloys: Alloying and Performance; ASM International: Novelty, OH, USA, 2010; ISBN 978-1-61503-040-8. [Google Scholar]
- Burch, R. The oxidation otate of rhenium and its role in rhenium-platinium reforming catalysts. Platin. Met. Rev. 1978, 22, 57–60. [Google Scholar]
- Gonazales, J.M.; Oxgaard, J.; Periana, R.A.; Goddard, W.A. III: Methane Activation with rhenium catalysts: Bidentate oxygenated ligands. Organometallics 2007, 26, 1505–1511. [Google Scholar] [CrossRef]


| Analyzed Alloy | Mass Concentration of the Elements in % Mass | |||
|---|---|---|---|---|
| Ni | Si | Re | Cu | |
| Cu–2Ni–1Si | 2 | 1 | − | rest |
| Cu–2Ni–1Si–0.6Re | 2 | 1 | up to 0.6 | rest |
| Analyzed Alloy | Temperature, °C | Sample Mass, g | |
|---|---|---|---|
| TL | TSOL | ||
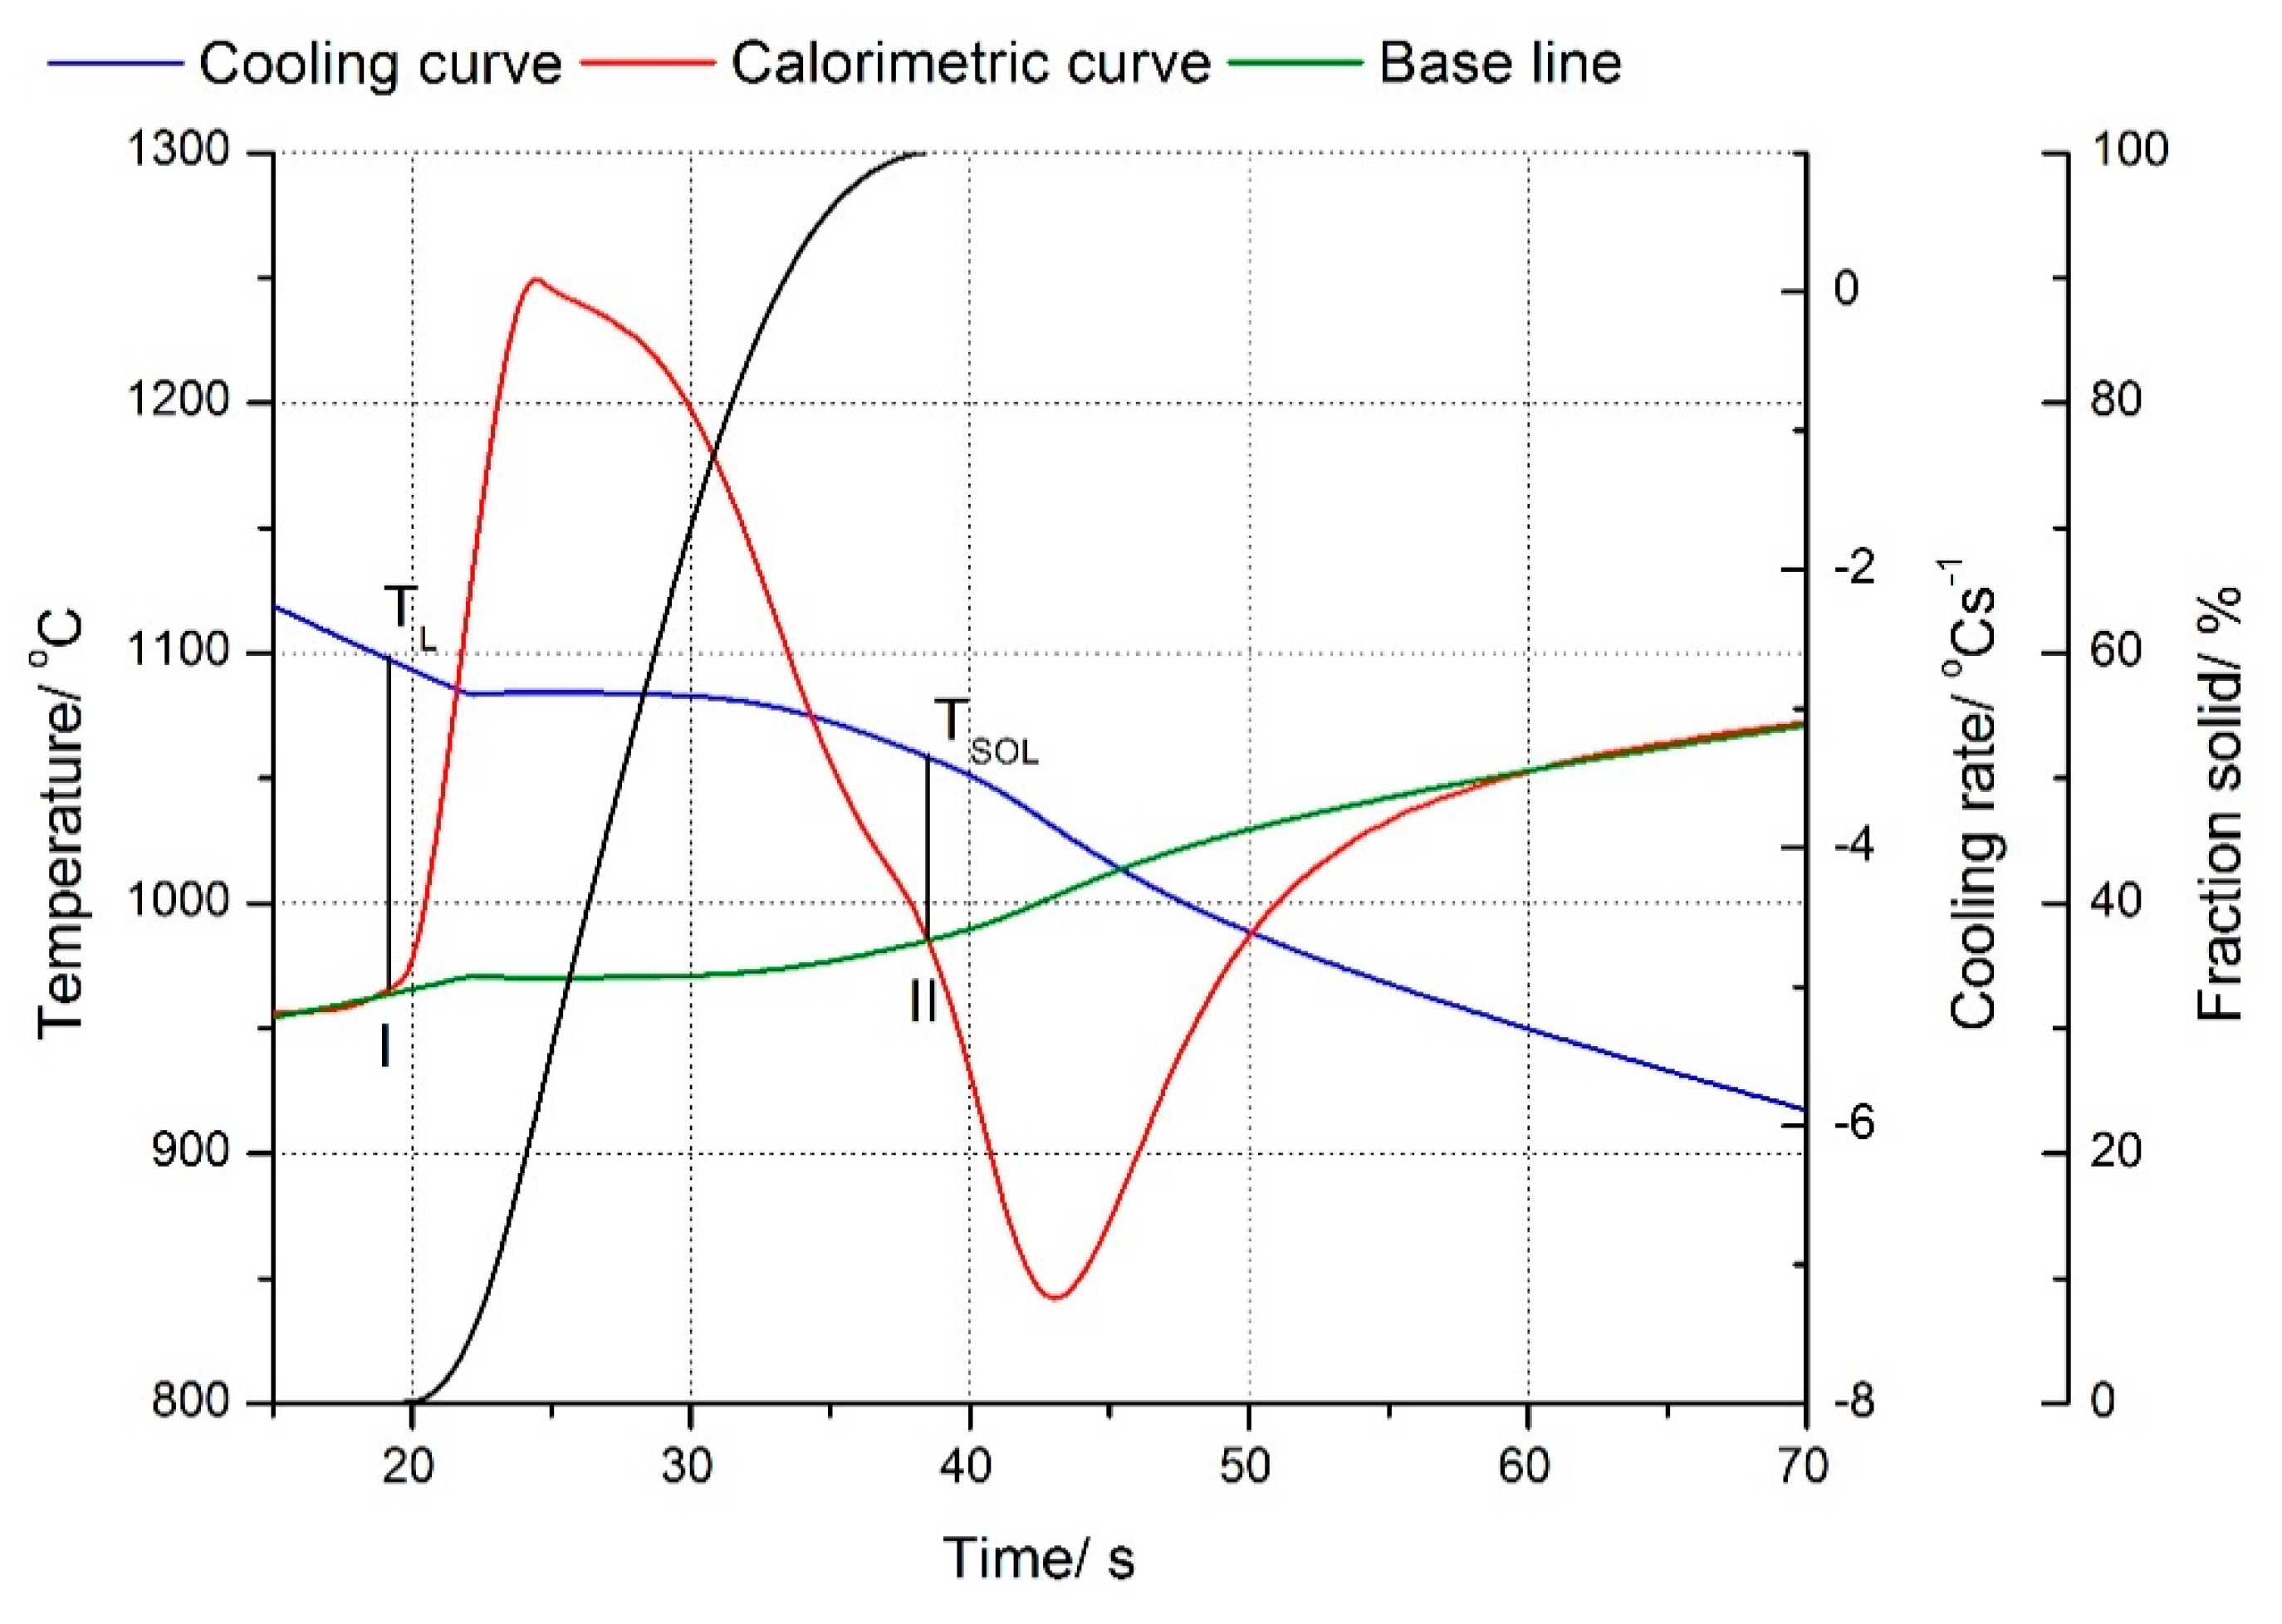
| Cu–2Ni–1Si | 1098 | 1057 | 11.36 |
| Cu–2Ni–1Si–0.6Re | 1083 | 1014 | 24.2 |
| Cu–2Ni–1Si | |||
| Heat Capacity in Liquid State Cpl, J/g °C | Heat Capacity in Solid State Cps, J/g °C | Weight of Sample, g | |
| 0.448 | 0.392 | 11.36 | |
| Reaction | Latent heat of crystallization | Percentage, % | |
| Samples, J | Unit Weight of a Sample, J/g | ||
| L → α | 1295.31 | 114.02 | 98.01 |
| L → α + Ni + Si | 22.35 | 1.97 | 1.99 |
| Total | 1317.66 | 115.99 | 100 |
| Cu–2Ni–1Si–0.6Re | |||
| Heat Capacity in Liquid State Cpl, J/g °C | Heat Capacity in Solid State Cps, J/g °C | Weight of Sample, g | |
| 0.460 | 0.364 | 24.2 | |
| Reaction | Latent Heat of Crystallization | Percentage, % | |
| Samples J | Unit Weight of a Sample, J/g | ||
| L → α | 4139.26 | 171.04 | 91.8 |
| L → α + Ni + Si | 305.84 | 12.64 | 8.2 |
| Total | 4445.10 | 183.68 | 100 |
| Element | Area #1 | Area #2 | Point #3 |
|---|---|---|---|
| Si | 1.75 | 1.21 | 0.26 |
| Ni | 2.47 | 2.28 | 2.2 |
| Re | − | 12.38 | 36.19 |
| Cu | 95.78 | 84.13 | 61.35 |
| Alloy Symbol | Microhardness, HV | Conductivity, MS/m |
|---|---|---|
| Cu–2Ni–1Si | 60 | 8 |
| Cu–2Ni–1Si_HTPD * | 150 | 14 |
| Cu–2Ni–1Si–0.6Re | 96 | 9 |
| Cu–2Ni–1Si–0.6Re_HTPD * | 225 | 12 |
© 2020 by the authors. Licensee MDPI, Basel, Switzerland. This article is an open access article distributed under the terms and conditions of the Creative Commons Attribution (CC BY) license (http://creativecommons.org/licenses/by/4.0/).
Share and Cite
Krupińska, B.; Rdzawski, Z.; Krupiński, M.; Pakieła, W. Precipitation Strengthening of Cu–Ni–Si Alloy. Materials 2020, 13, 1182. https://doi.org/10.3390/ma13051182
Krupińska B, Rdzawski Z, Krupiński M, Pakieła W. Precipitation Strengthening of Cu–Ni–Si Alloy. Materials. 2020; 13(5):1182. https://doi.org/10.3390/ma13051182
Chicago/Turabian StyleKrupińska, Beata, Zbigniew Rdzawski, Mariusz Krupiński, and Wojciech Pakieła. 2020. "Precipitation Strengthening of Cu–Ni–Si Alloy" Materials 13, no. 5: 1182. https://doi.org/10.3390/ma13051182
APA StyleKrupińska, B., Rdzawski, Z., Krupiński, M., & Pakieła, W. (2020). Precipitation Strengthening of Cu–Ni–Si Alloy. Materials, 13(5), 1182. https://doi.org/10.3390/ma13051182