Numerical Investigation on Lateral Confinement Effects on Concrete Cracking Induced by Rebar Corrosion


Abstract
1. Introduction
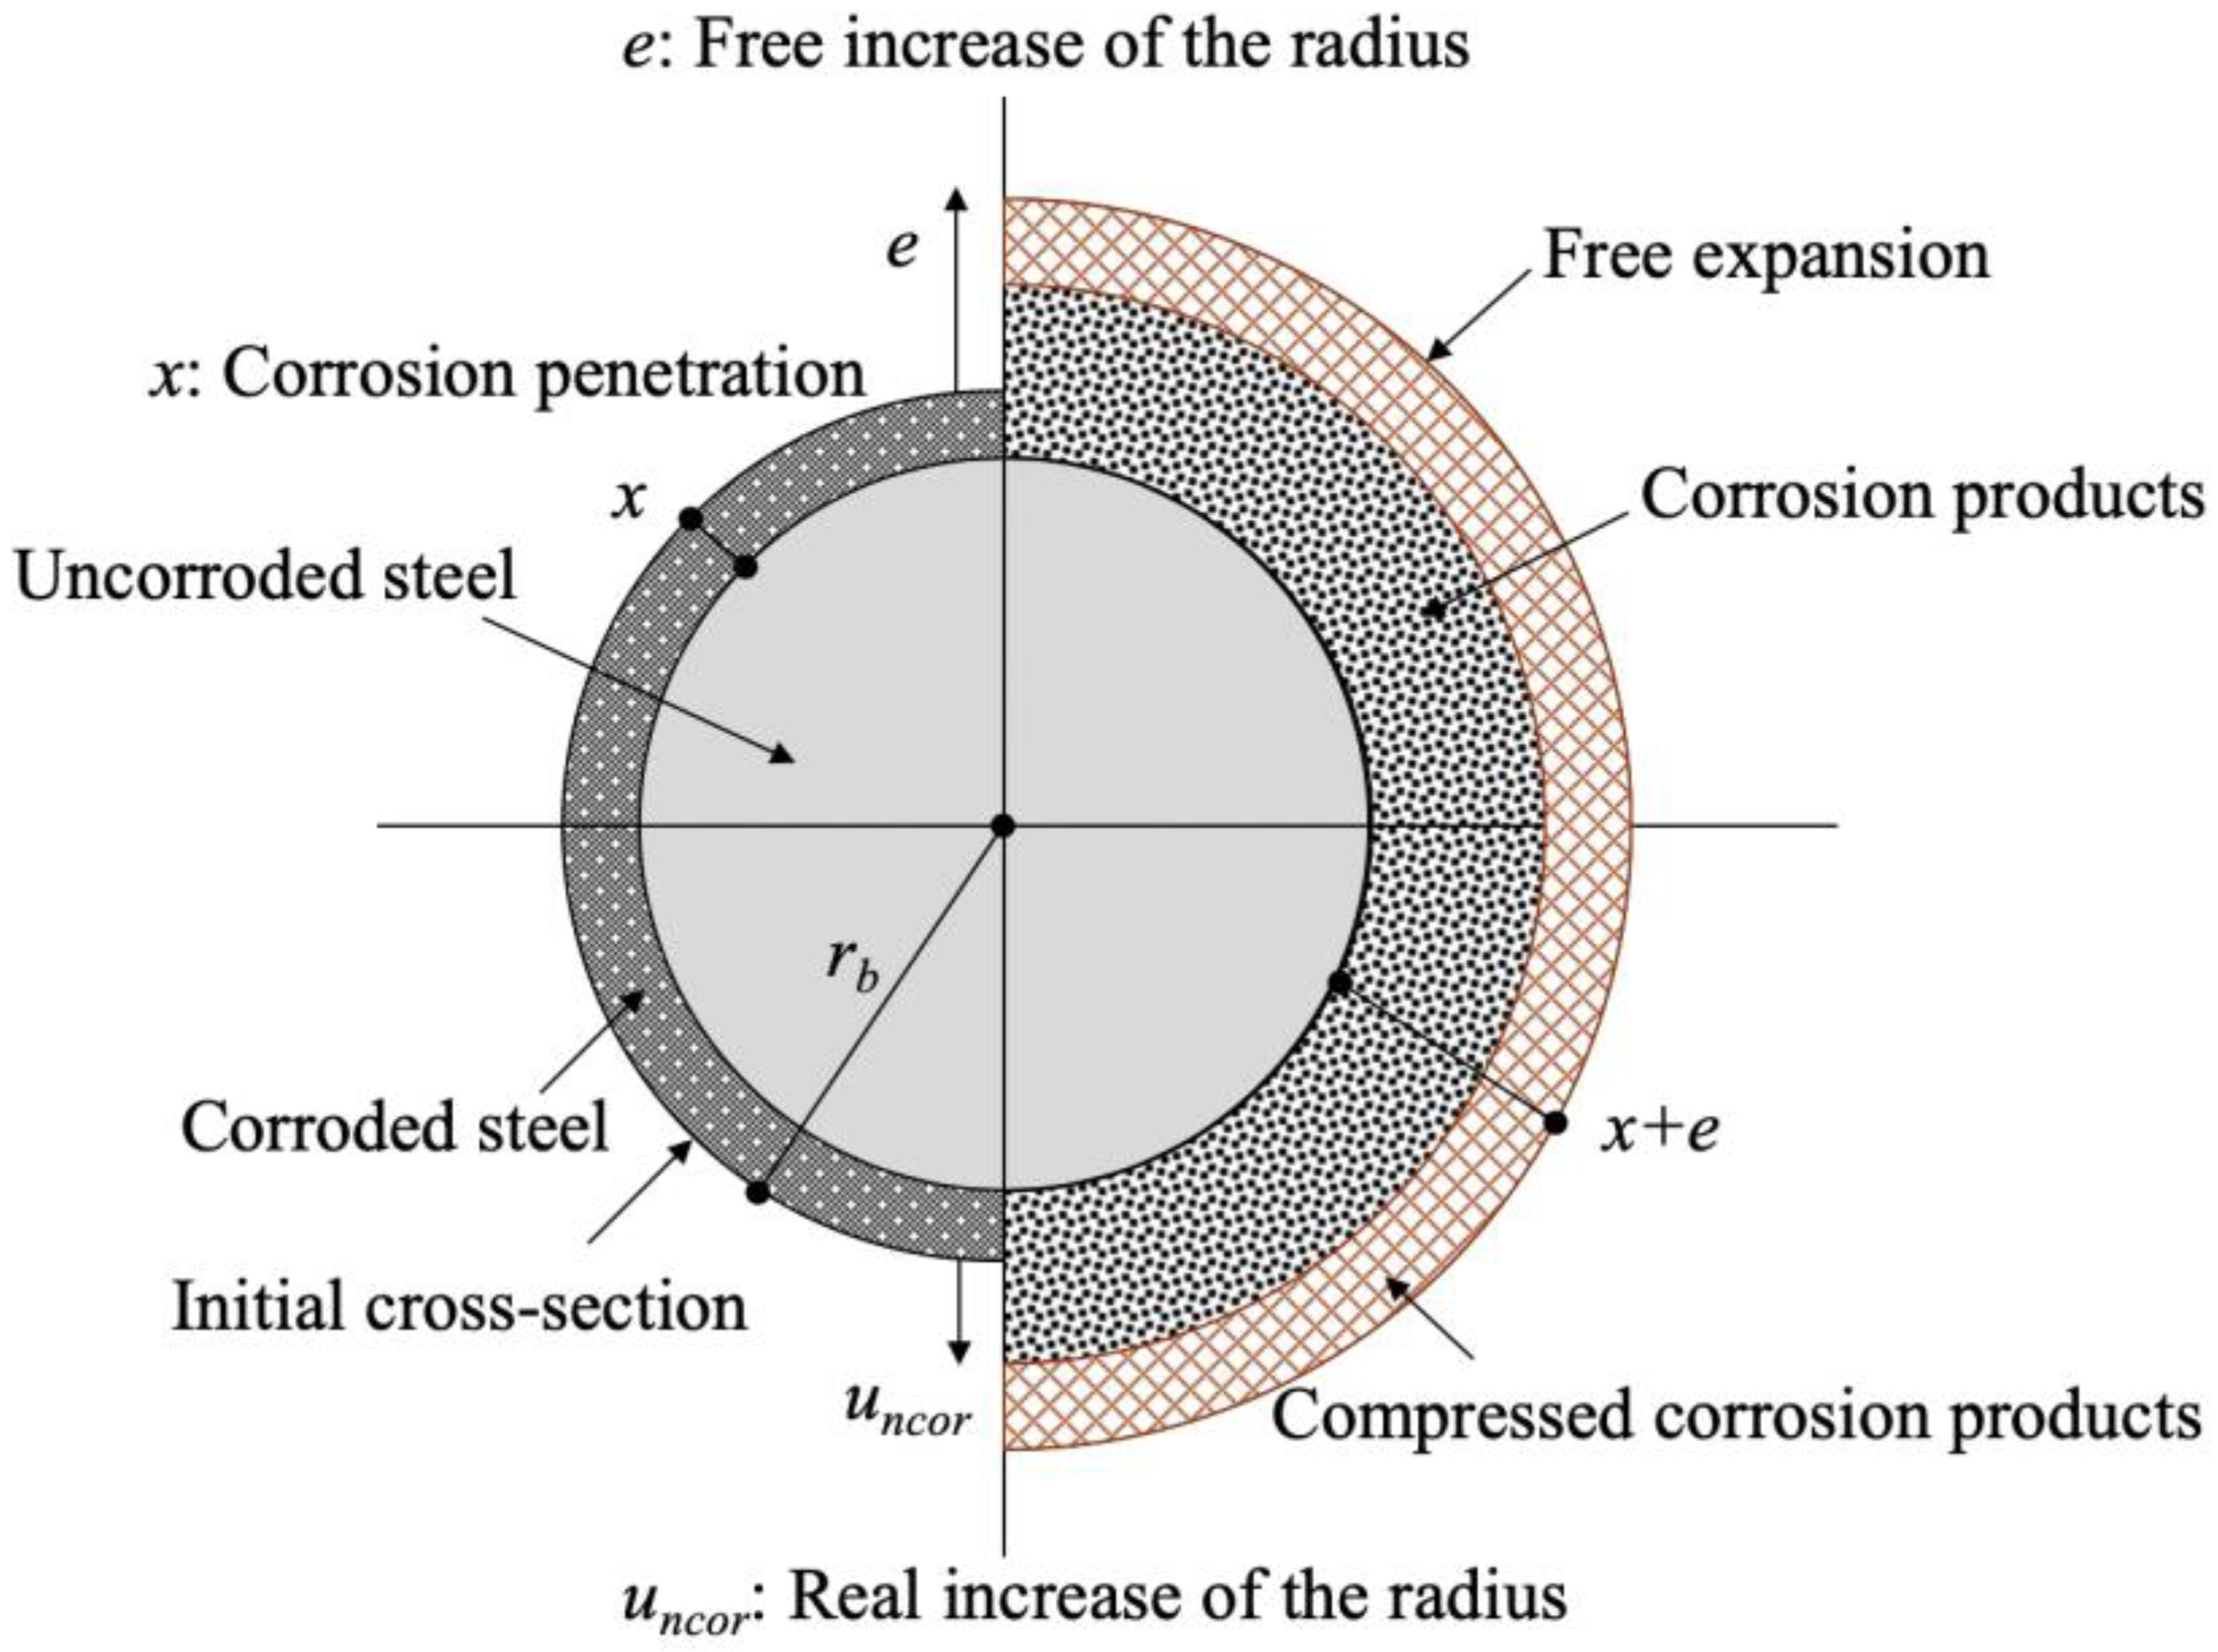
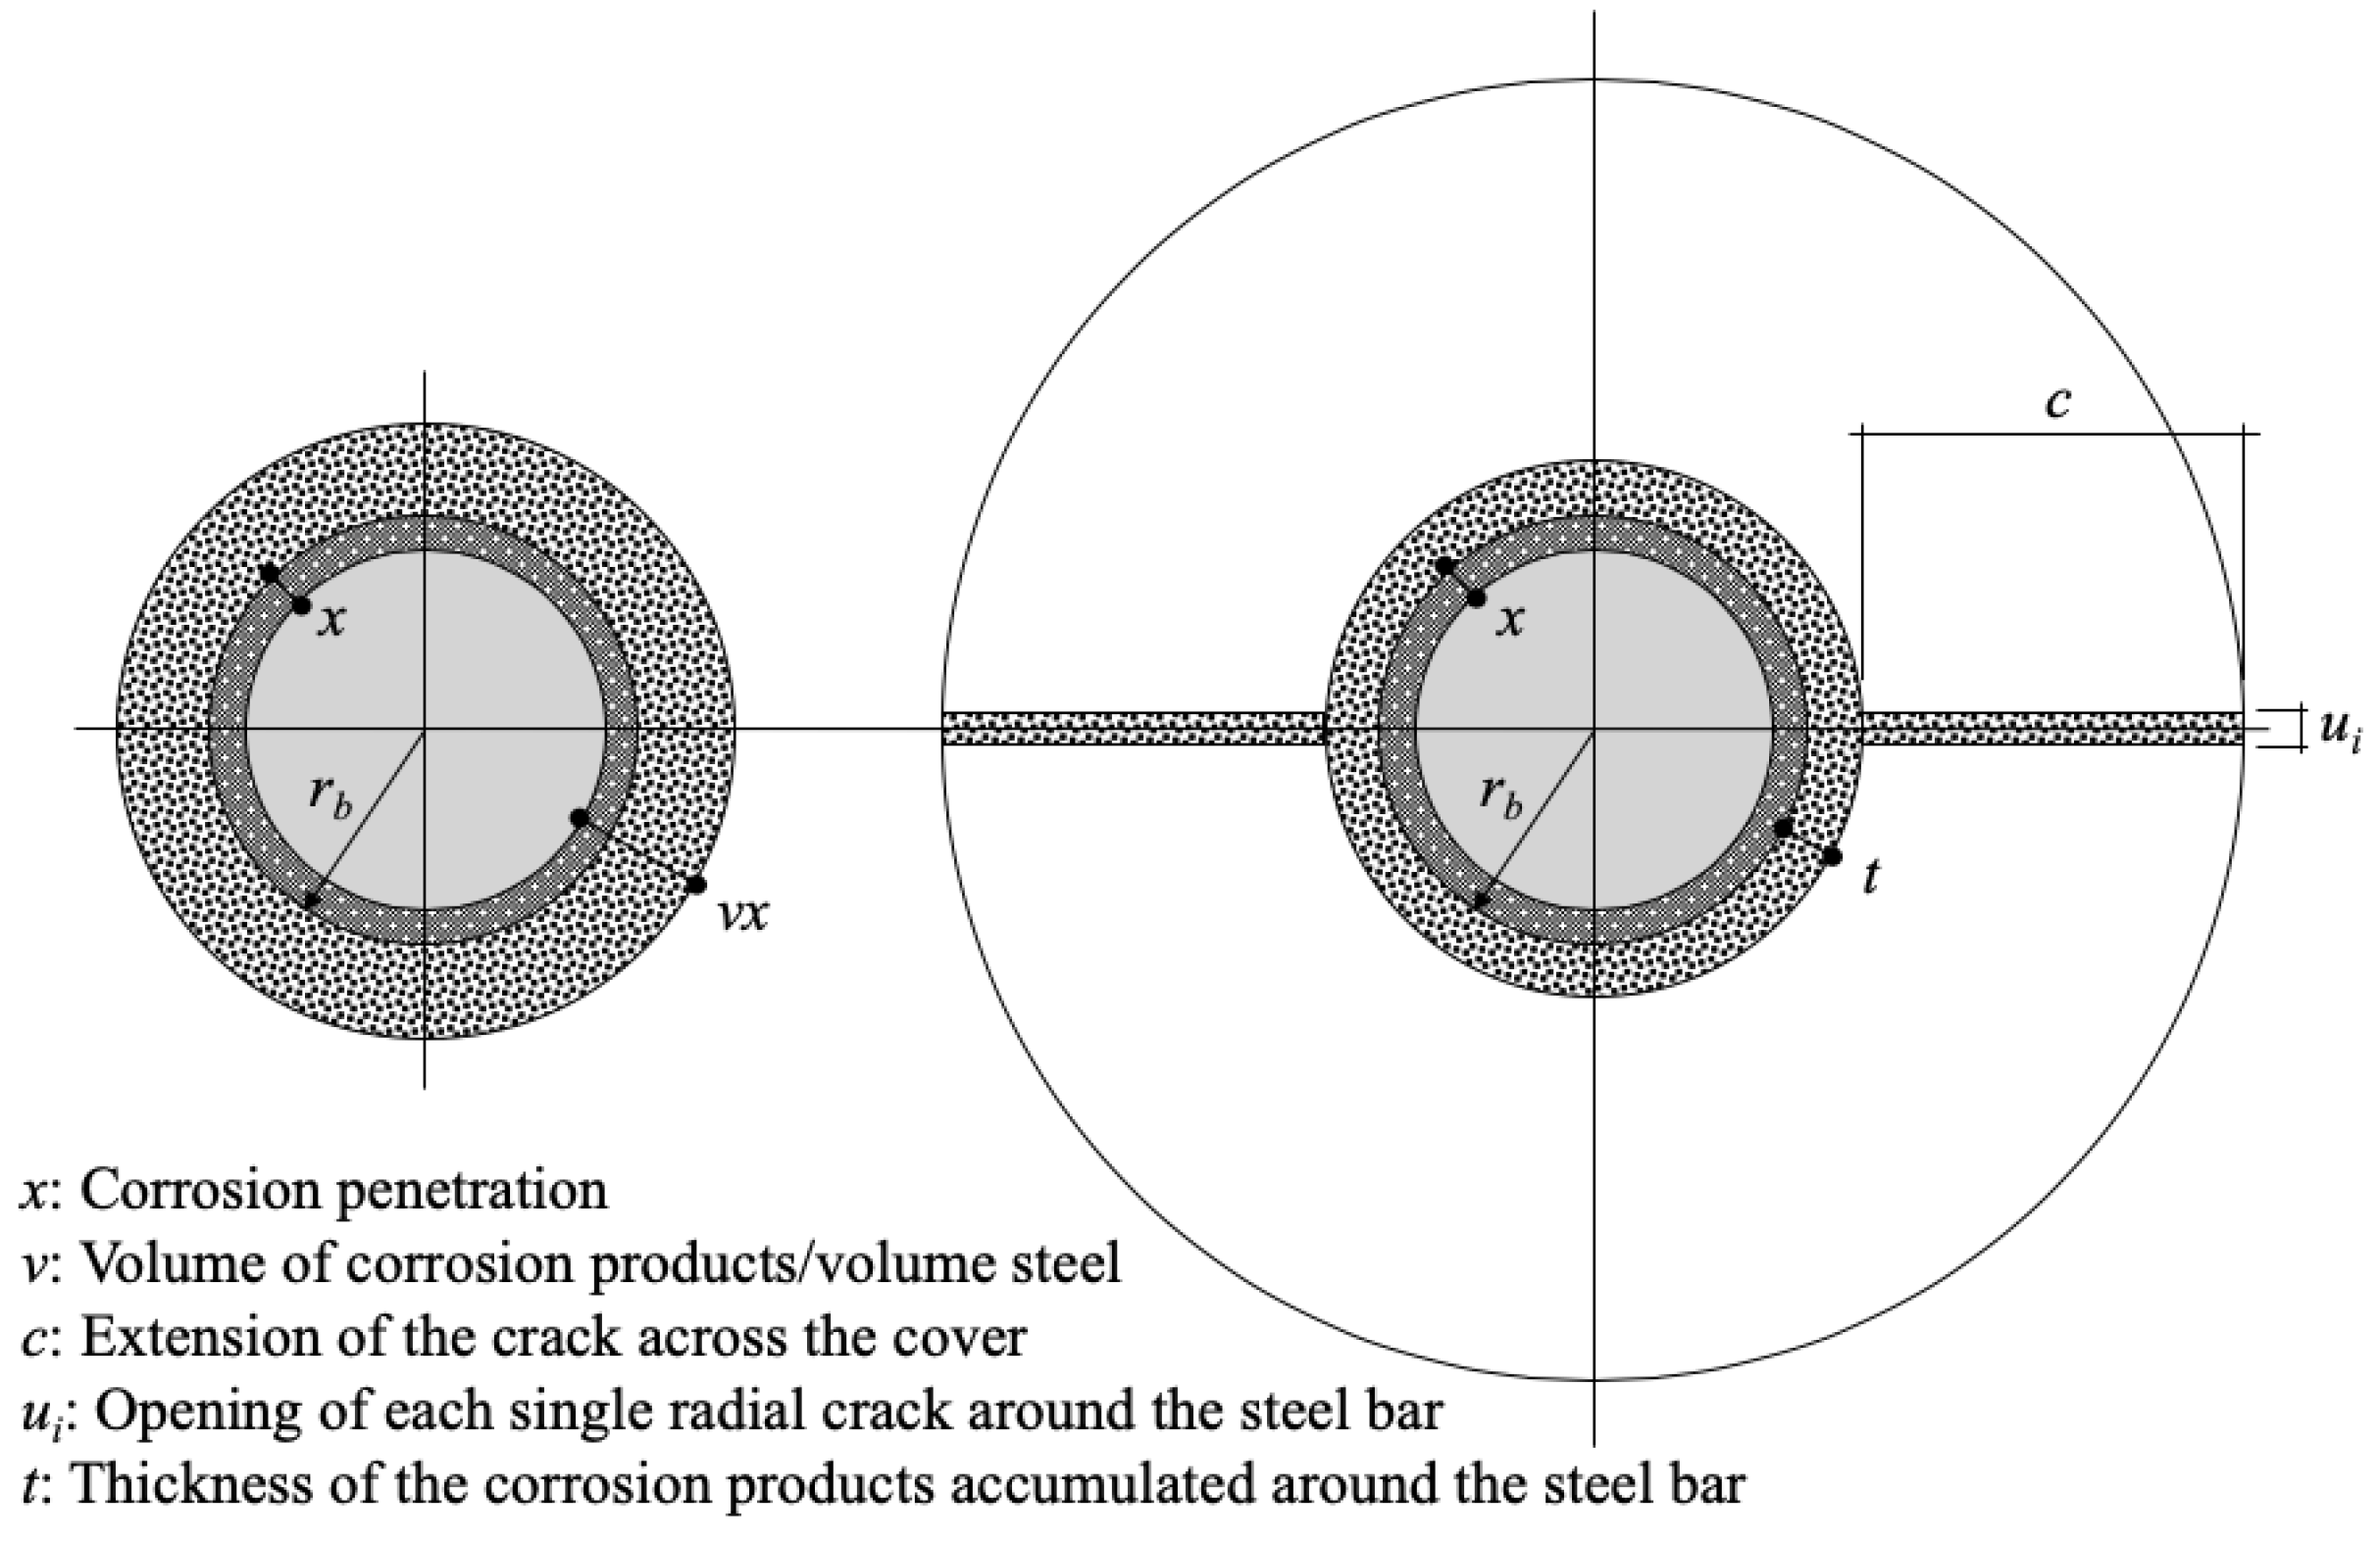
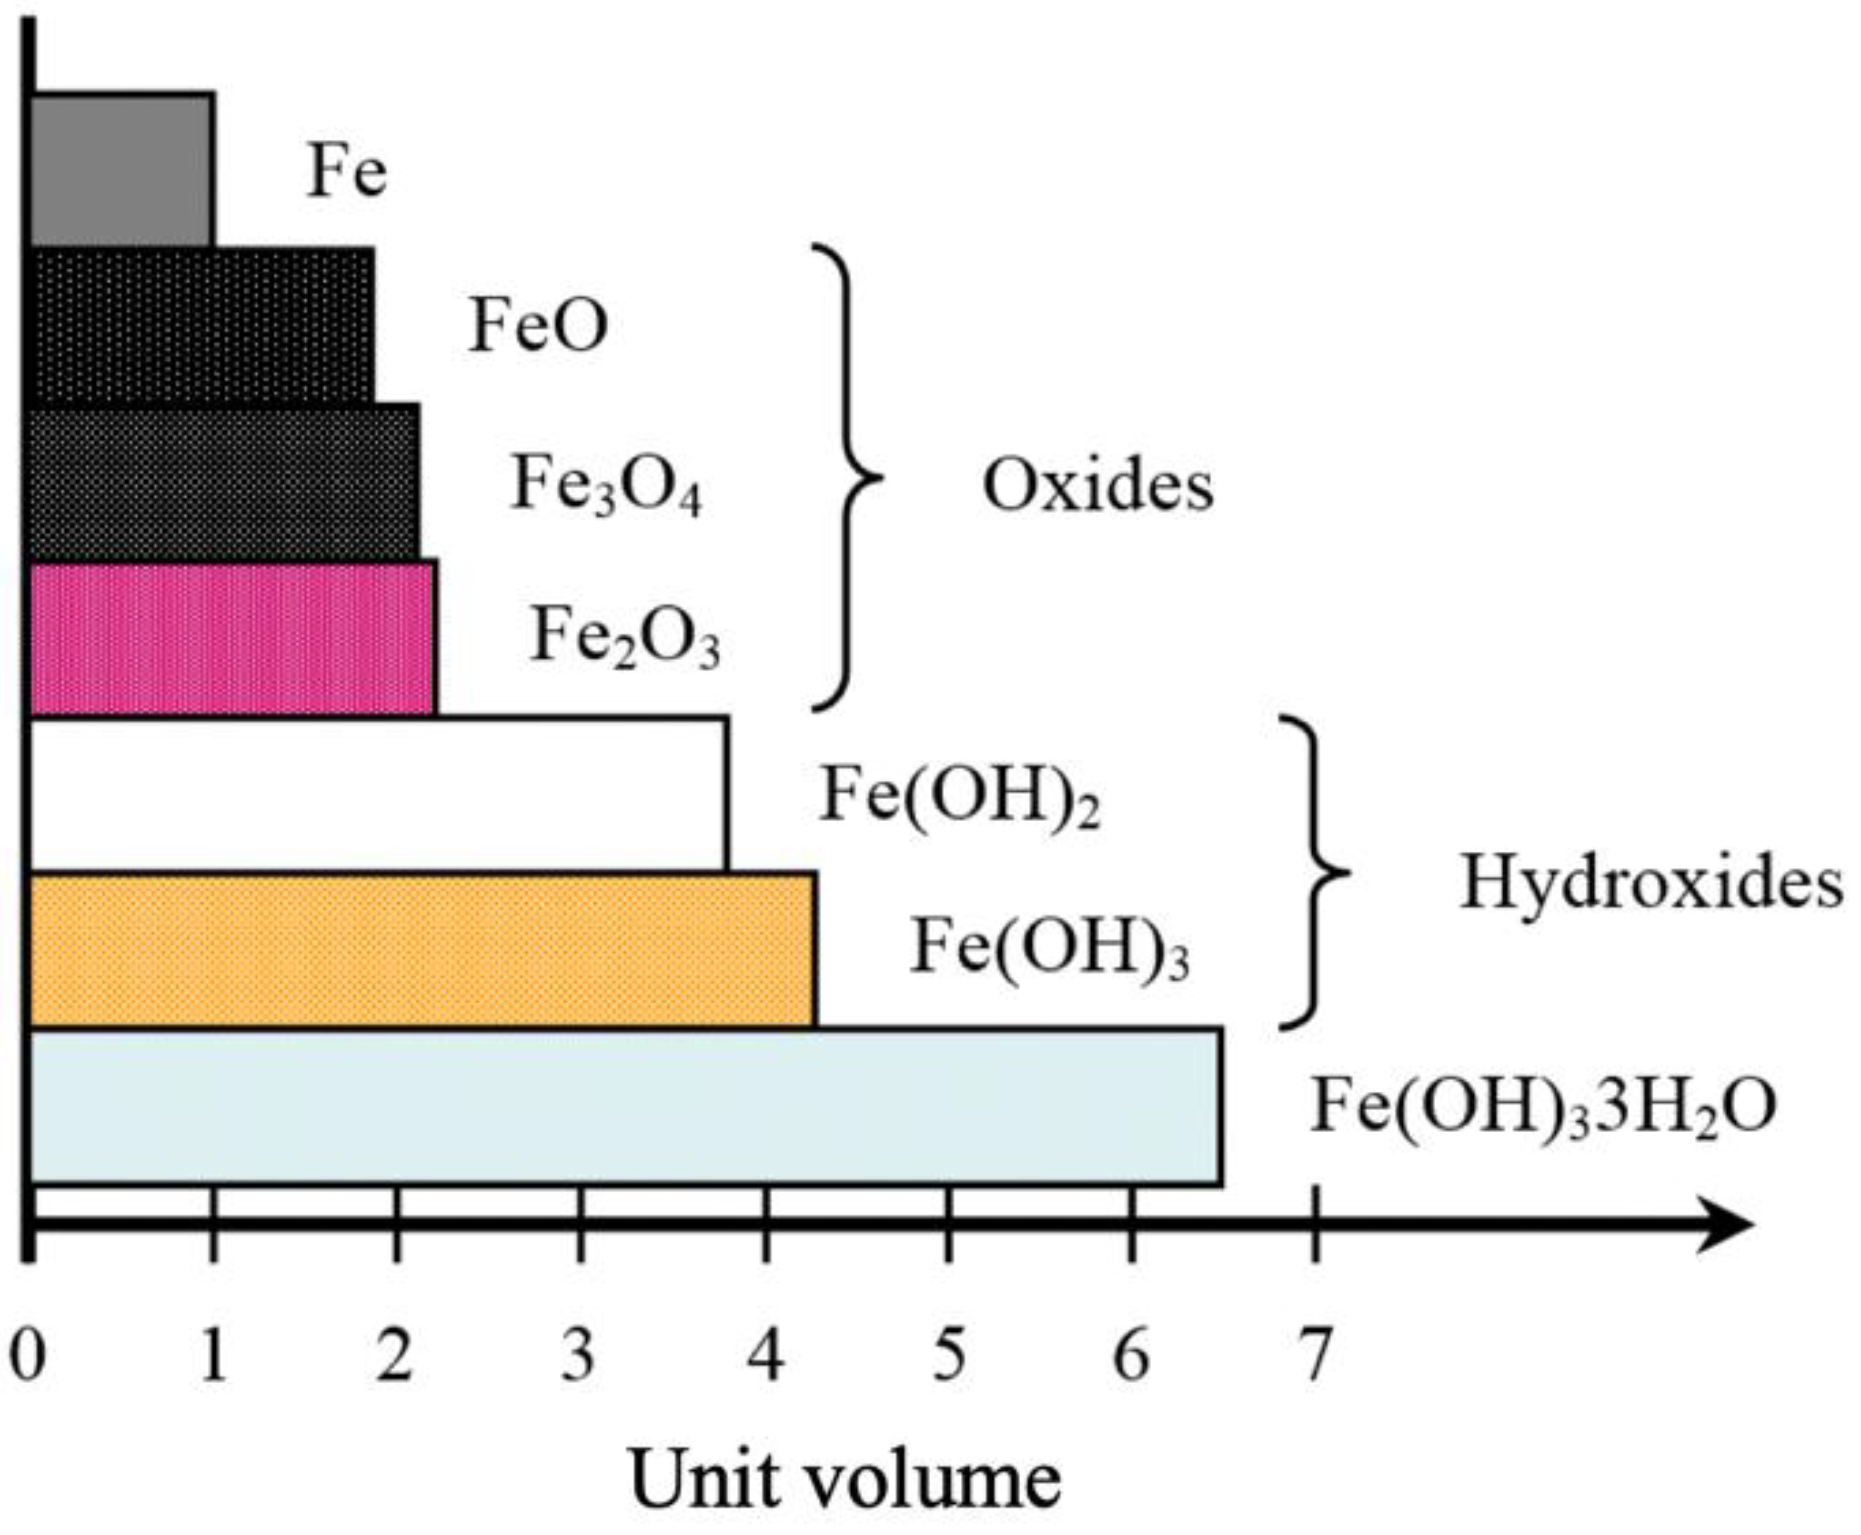
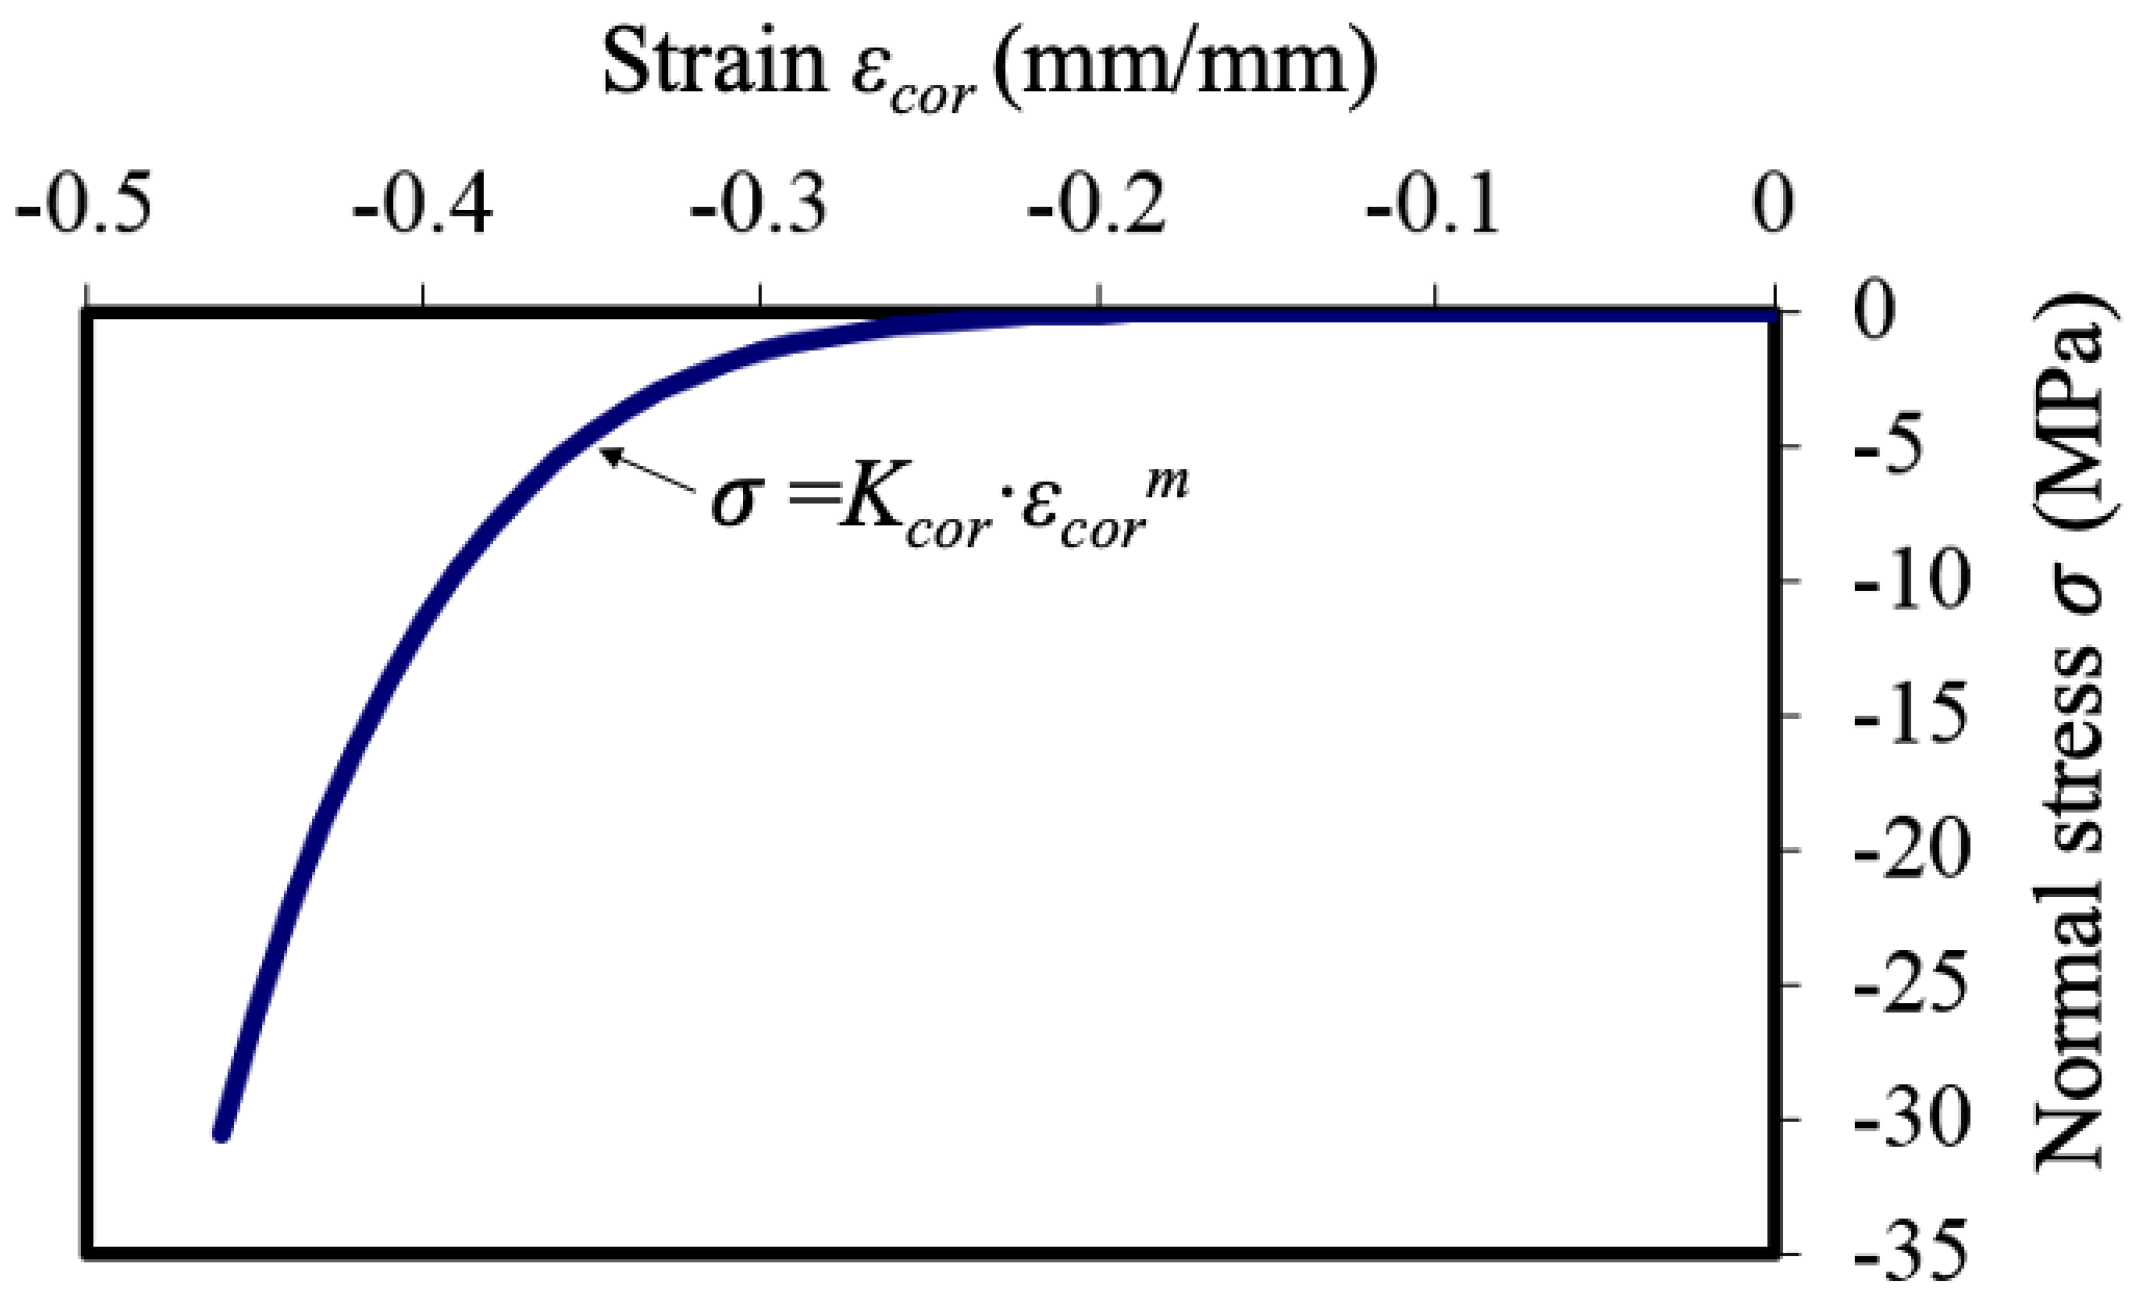
2. Expansion Model of Steel Corrosion Products
3. Accelerated Corrosion
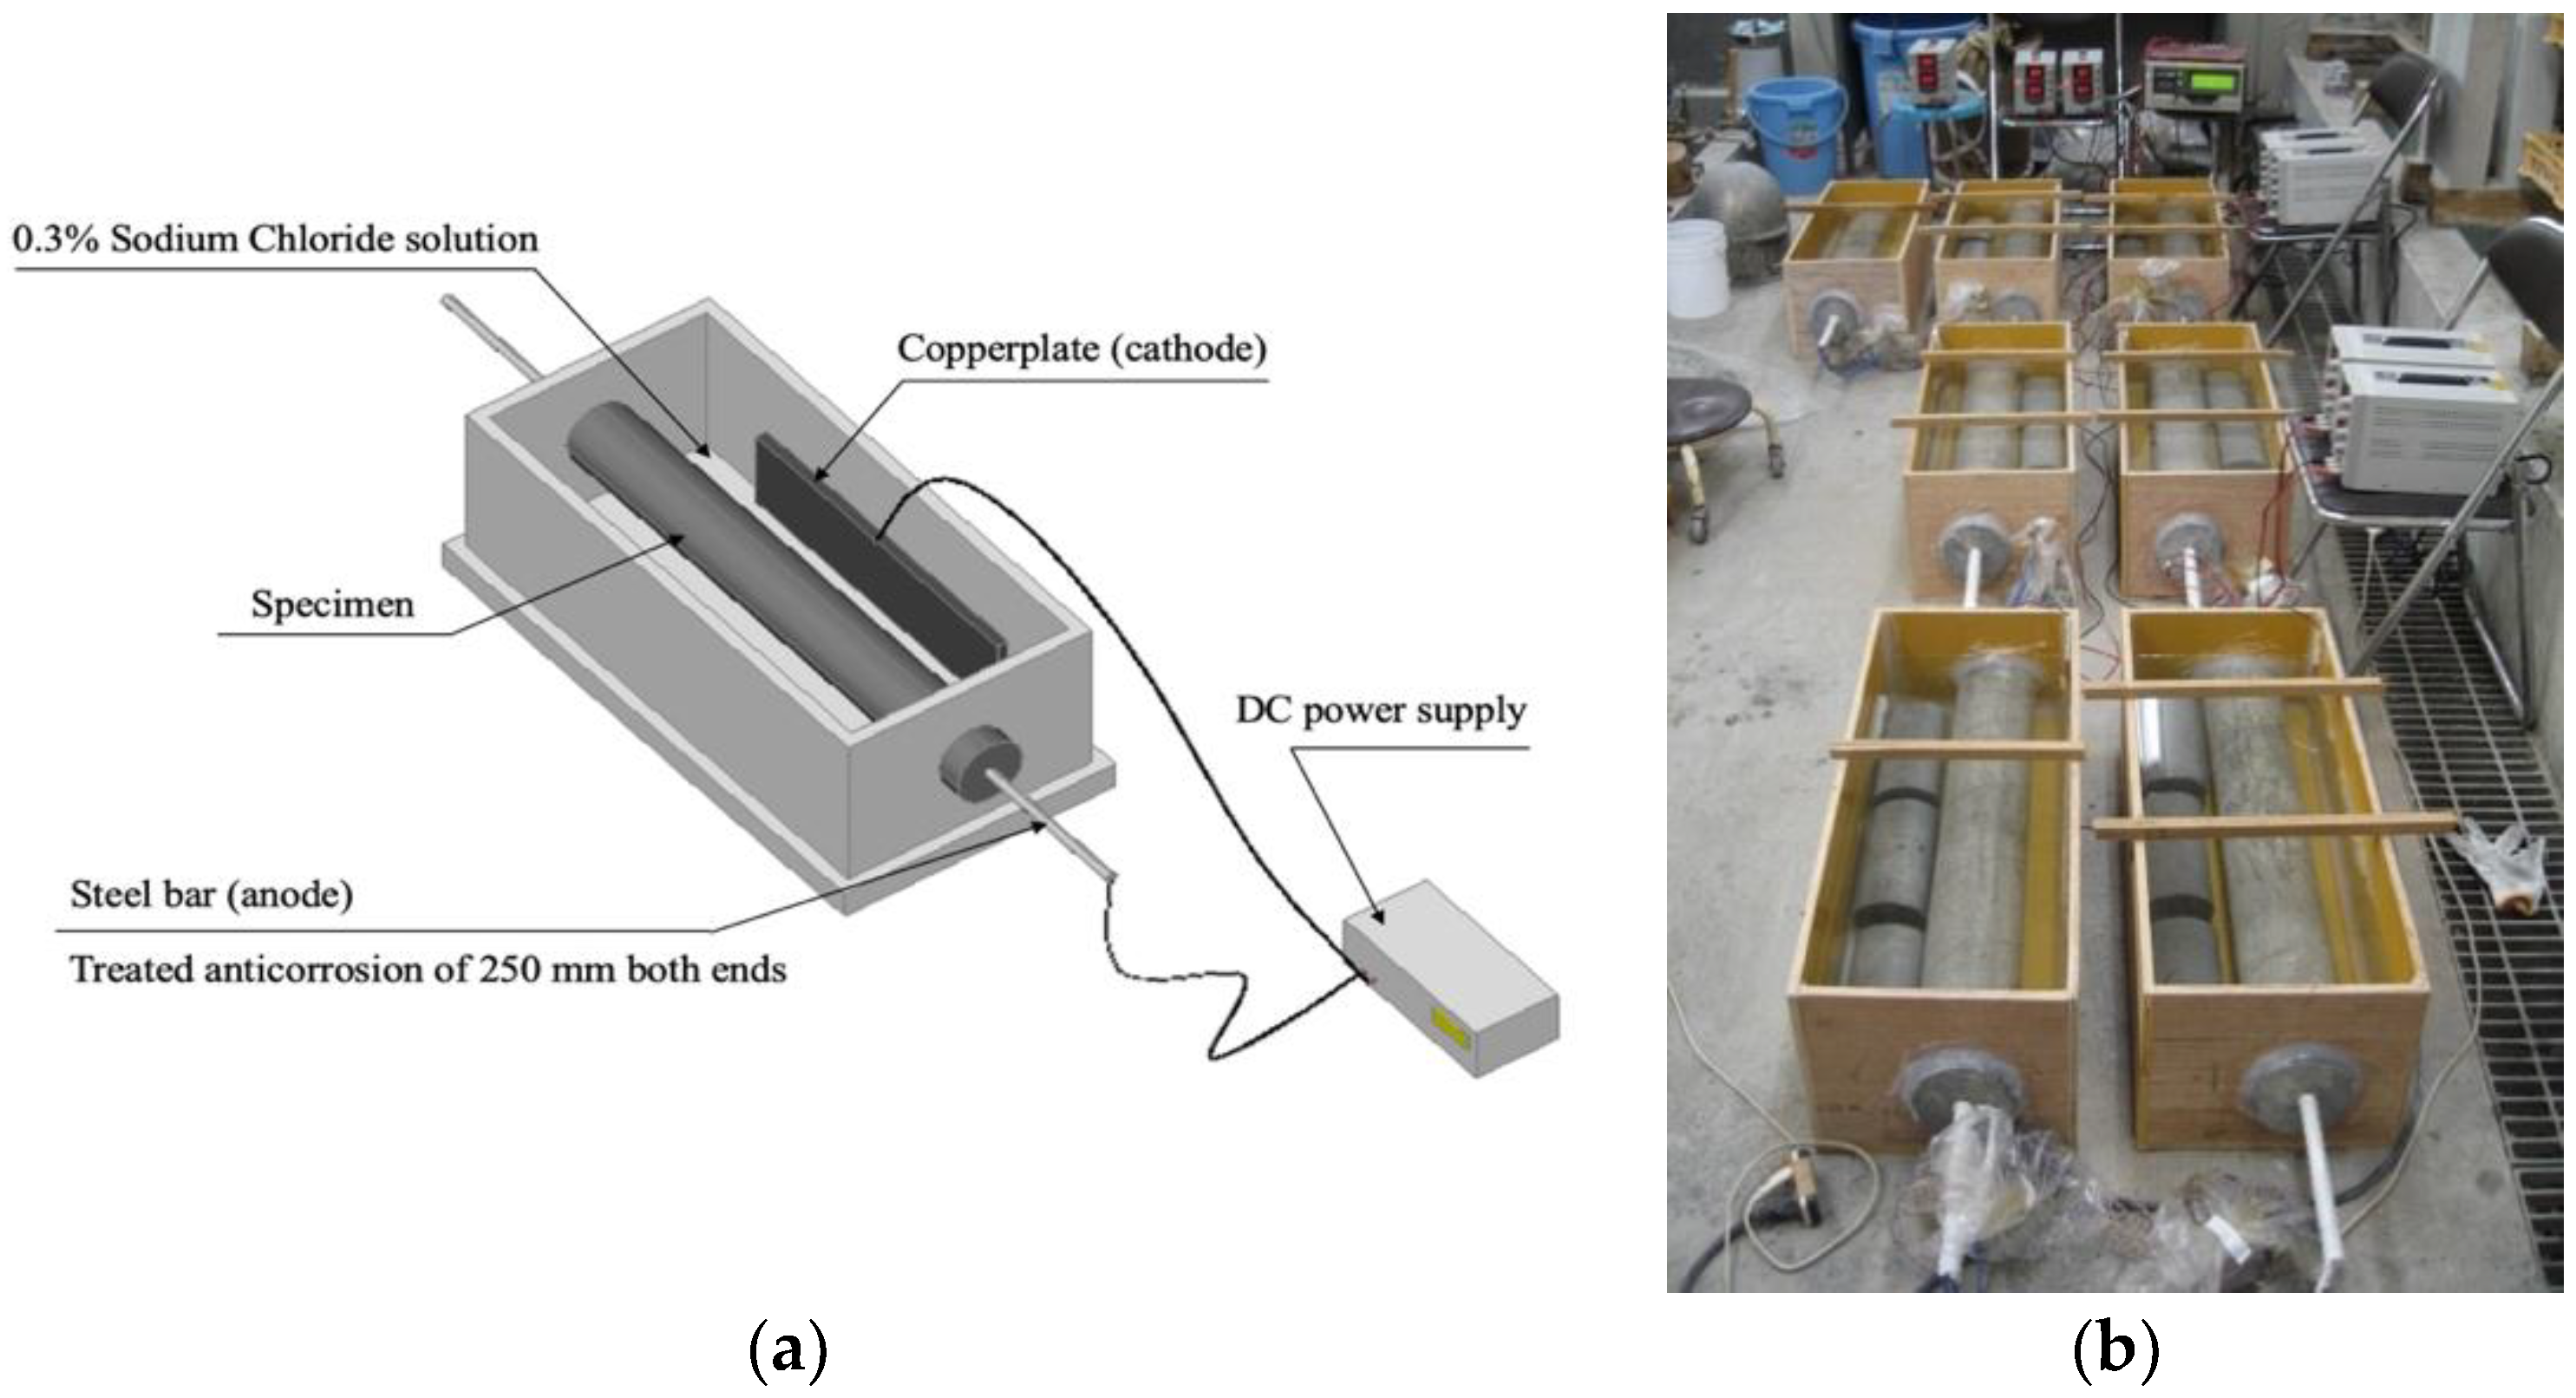
3.1. Specimens
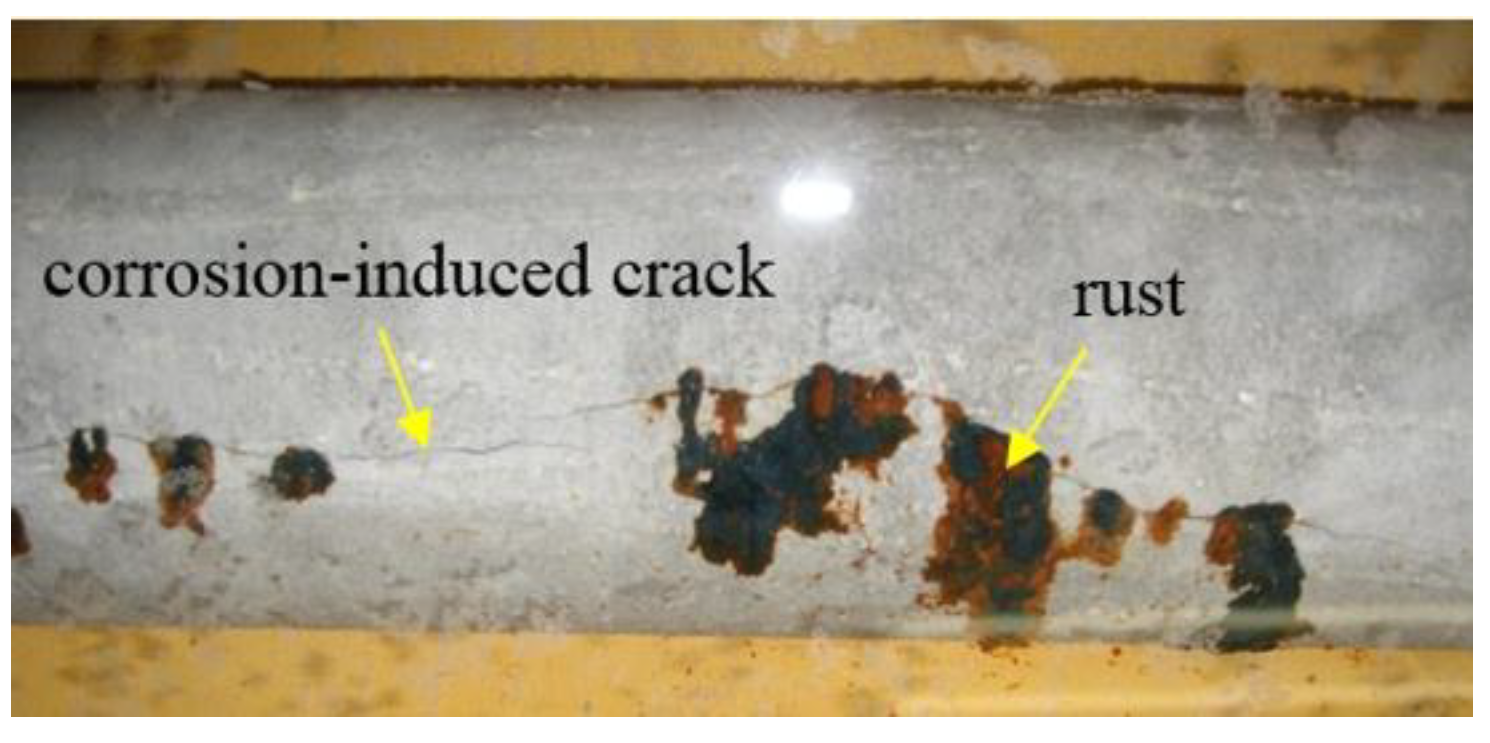
3.2. Test Method
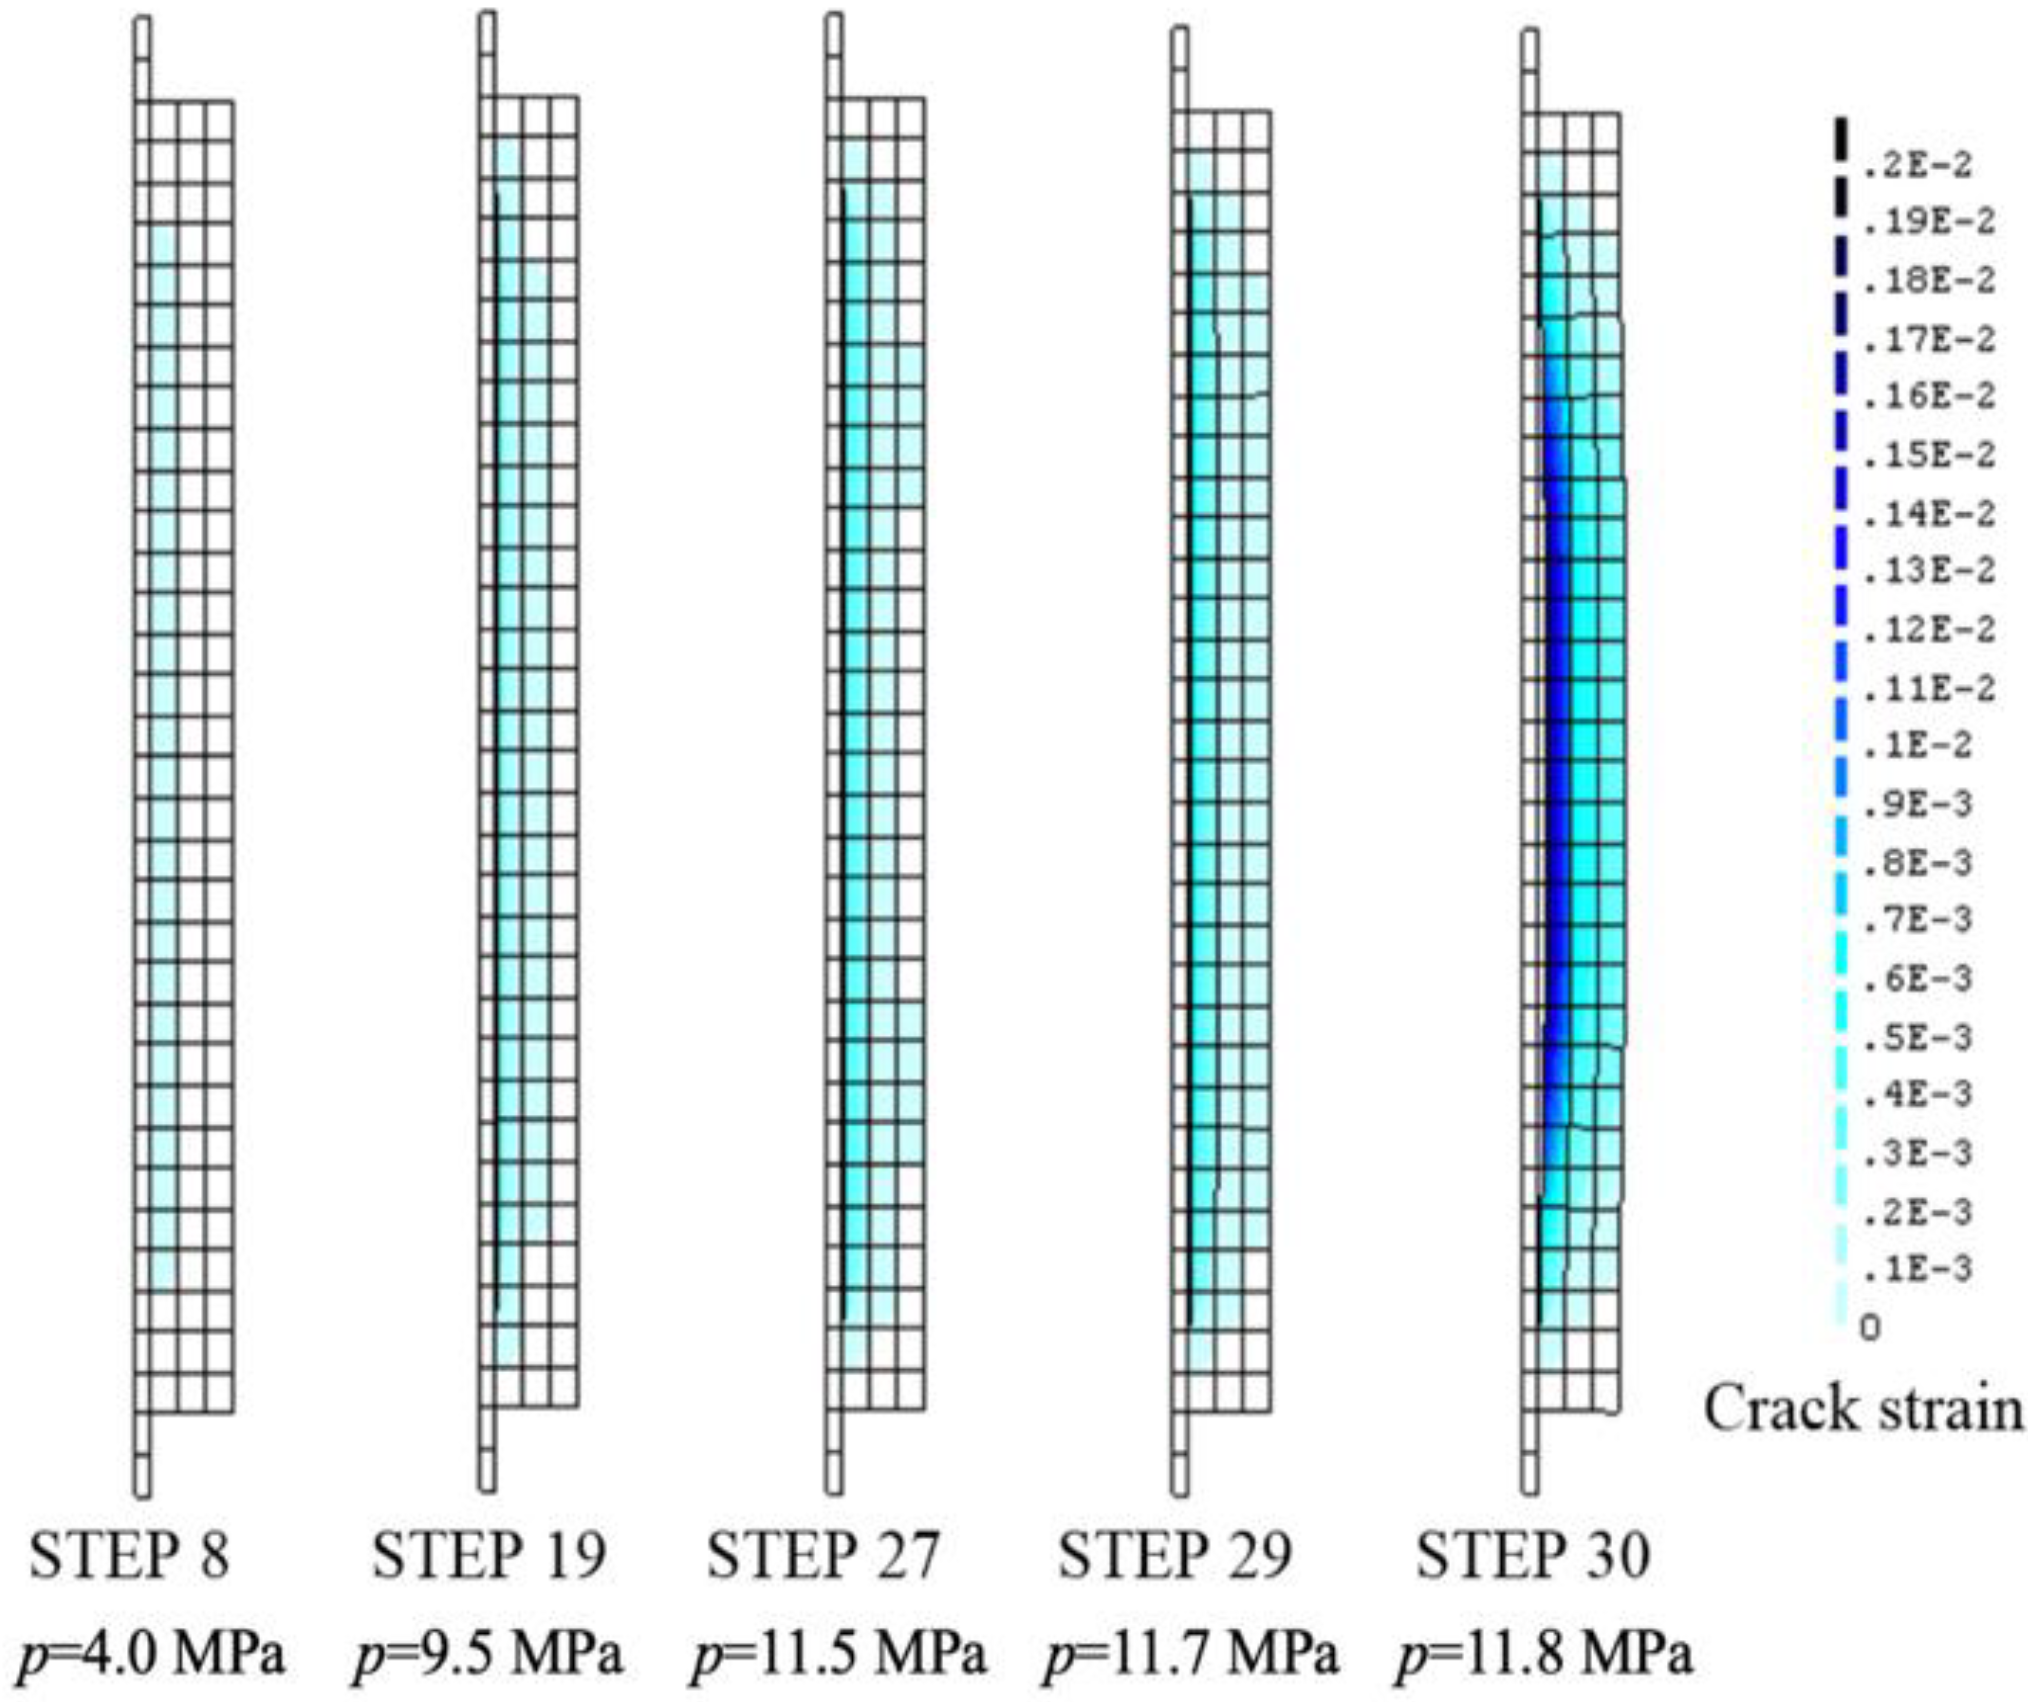
4. Axial Symmetric Simulation of the Corrosion Expansion
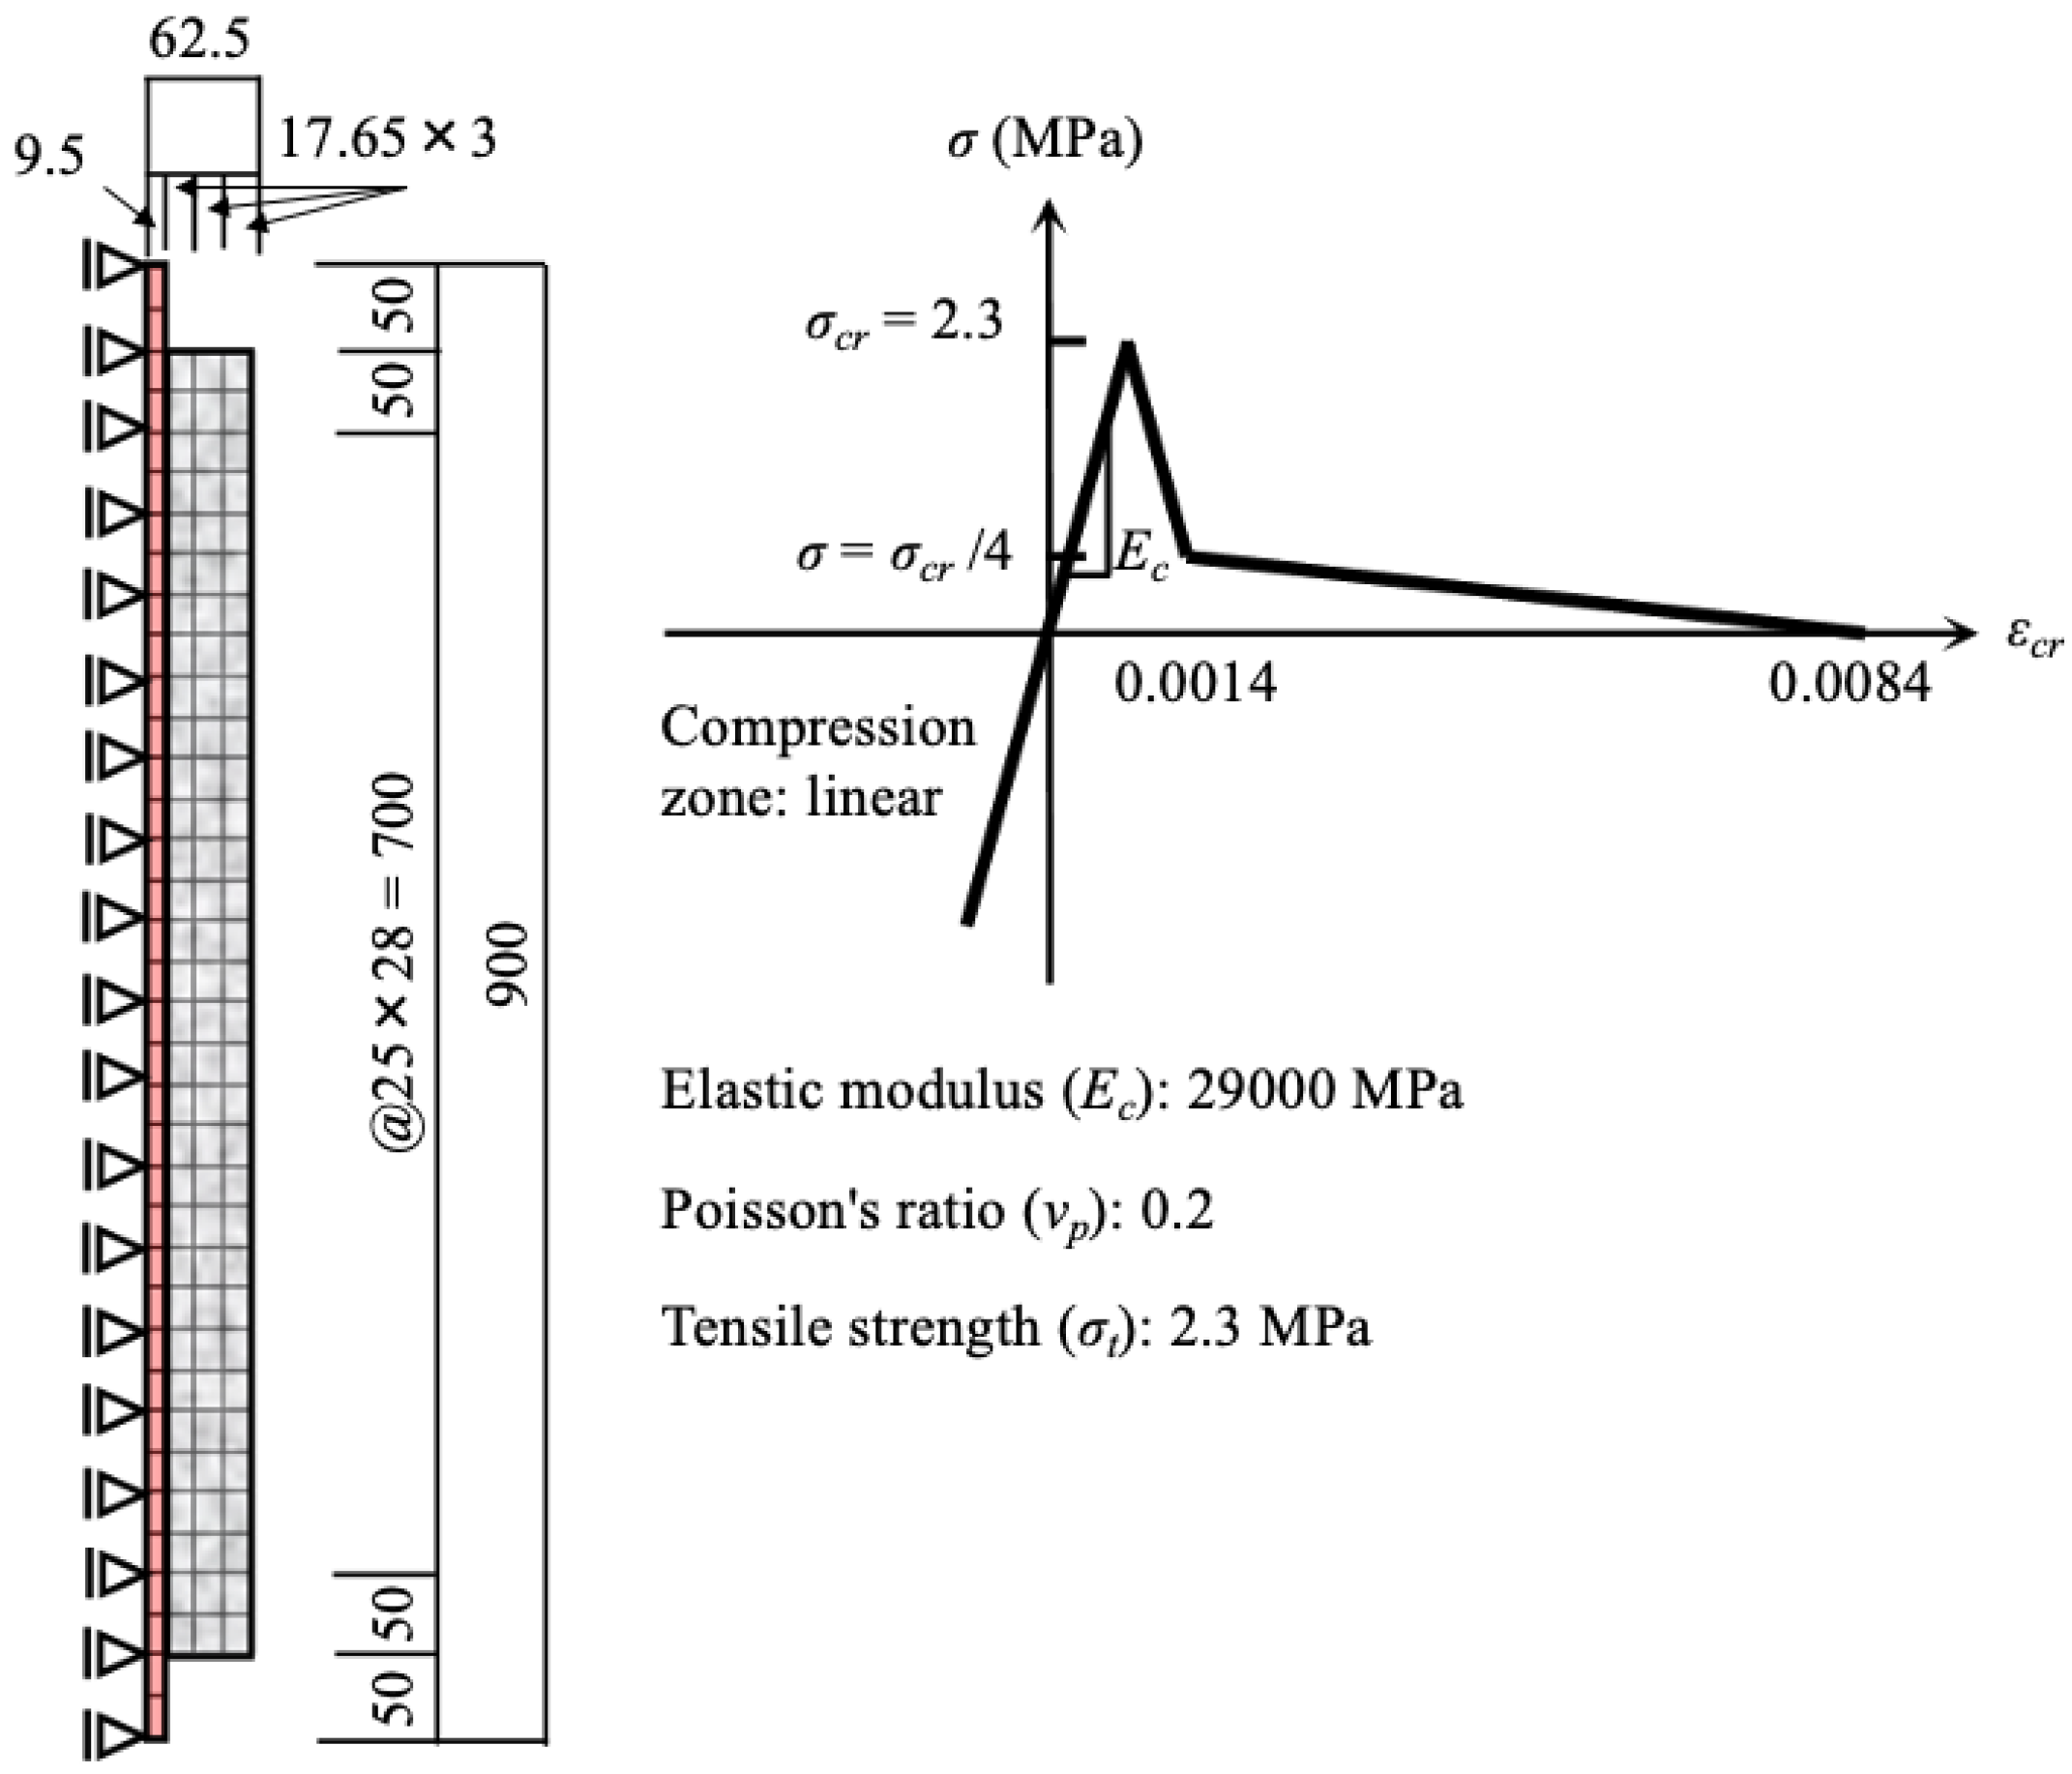
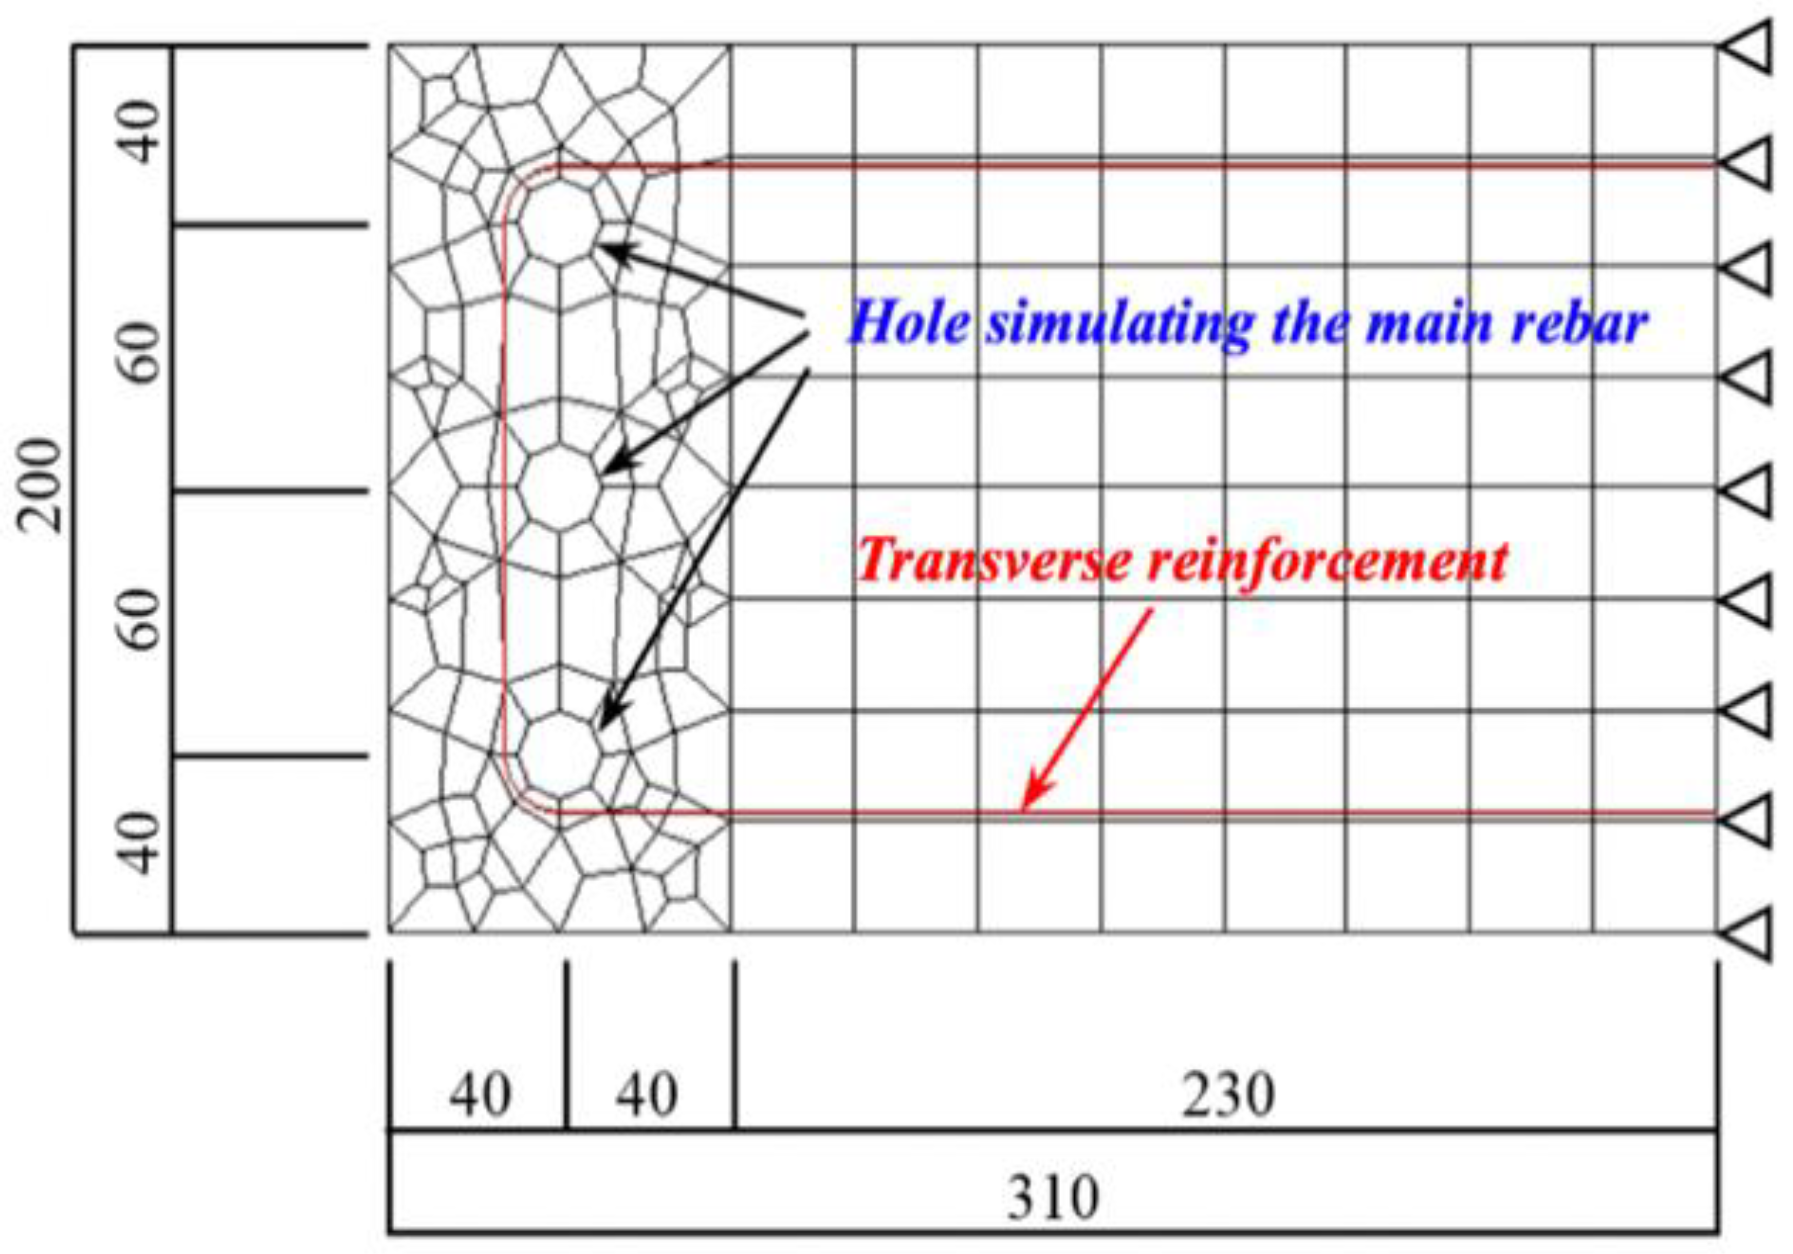
5. Corrosion Expansion in the Numerical Model and Material Properties of RC Beams
6. Results and Discussion
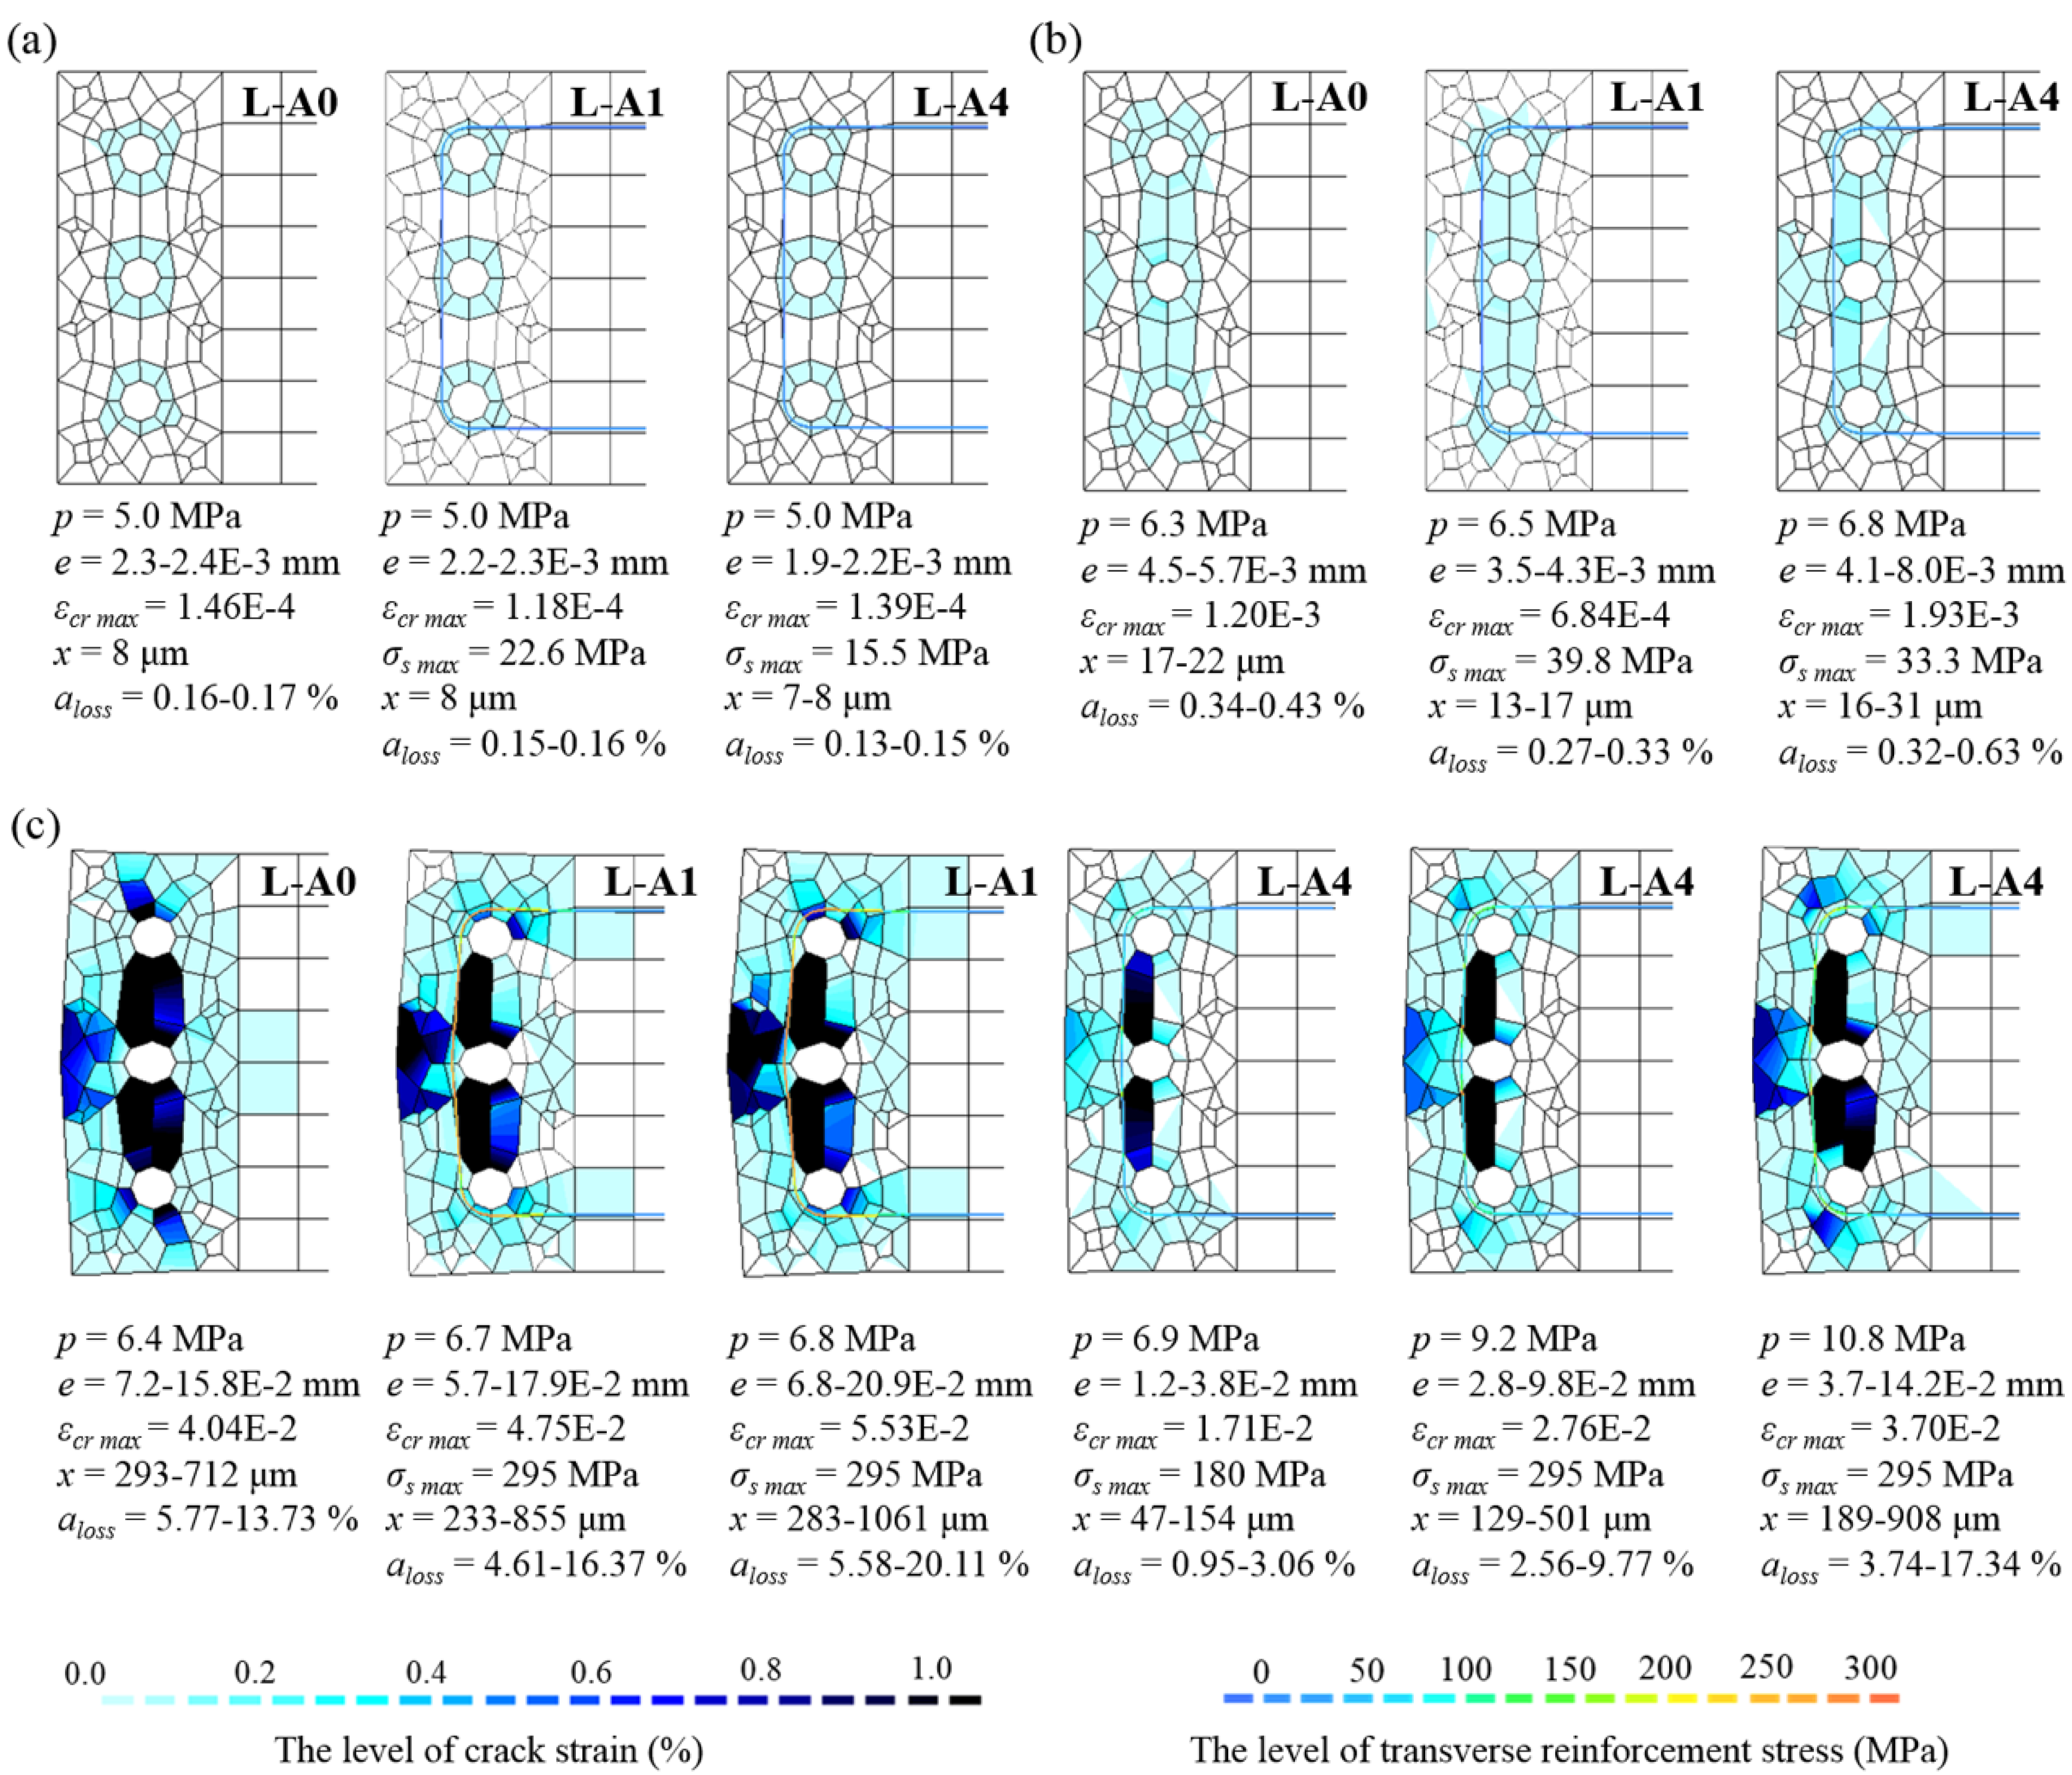
6.1. Cracking Behavior Due to Corrosion Expansion
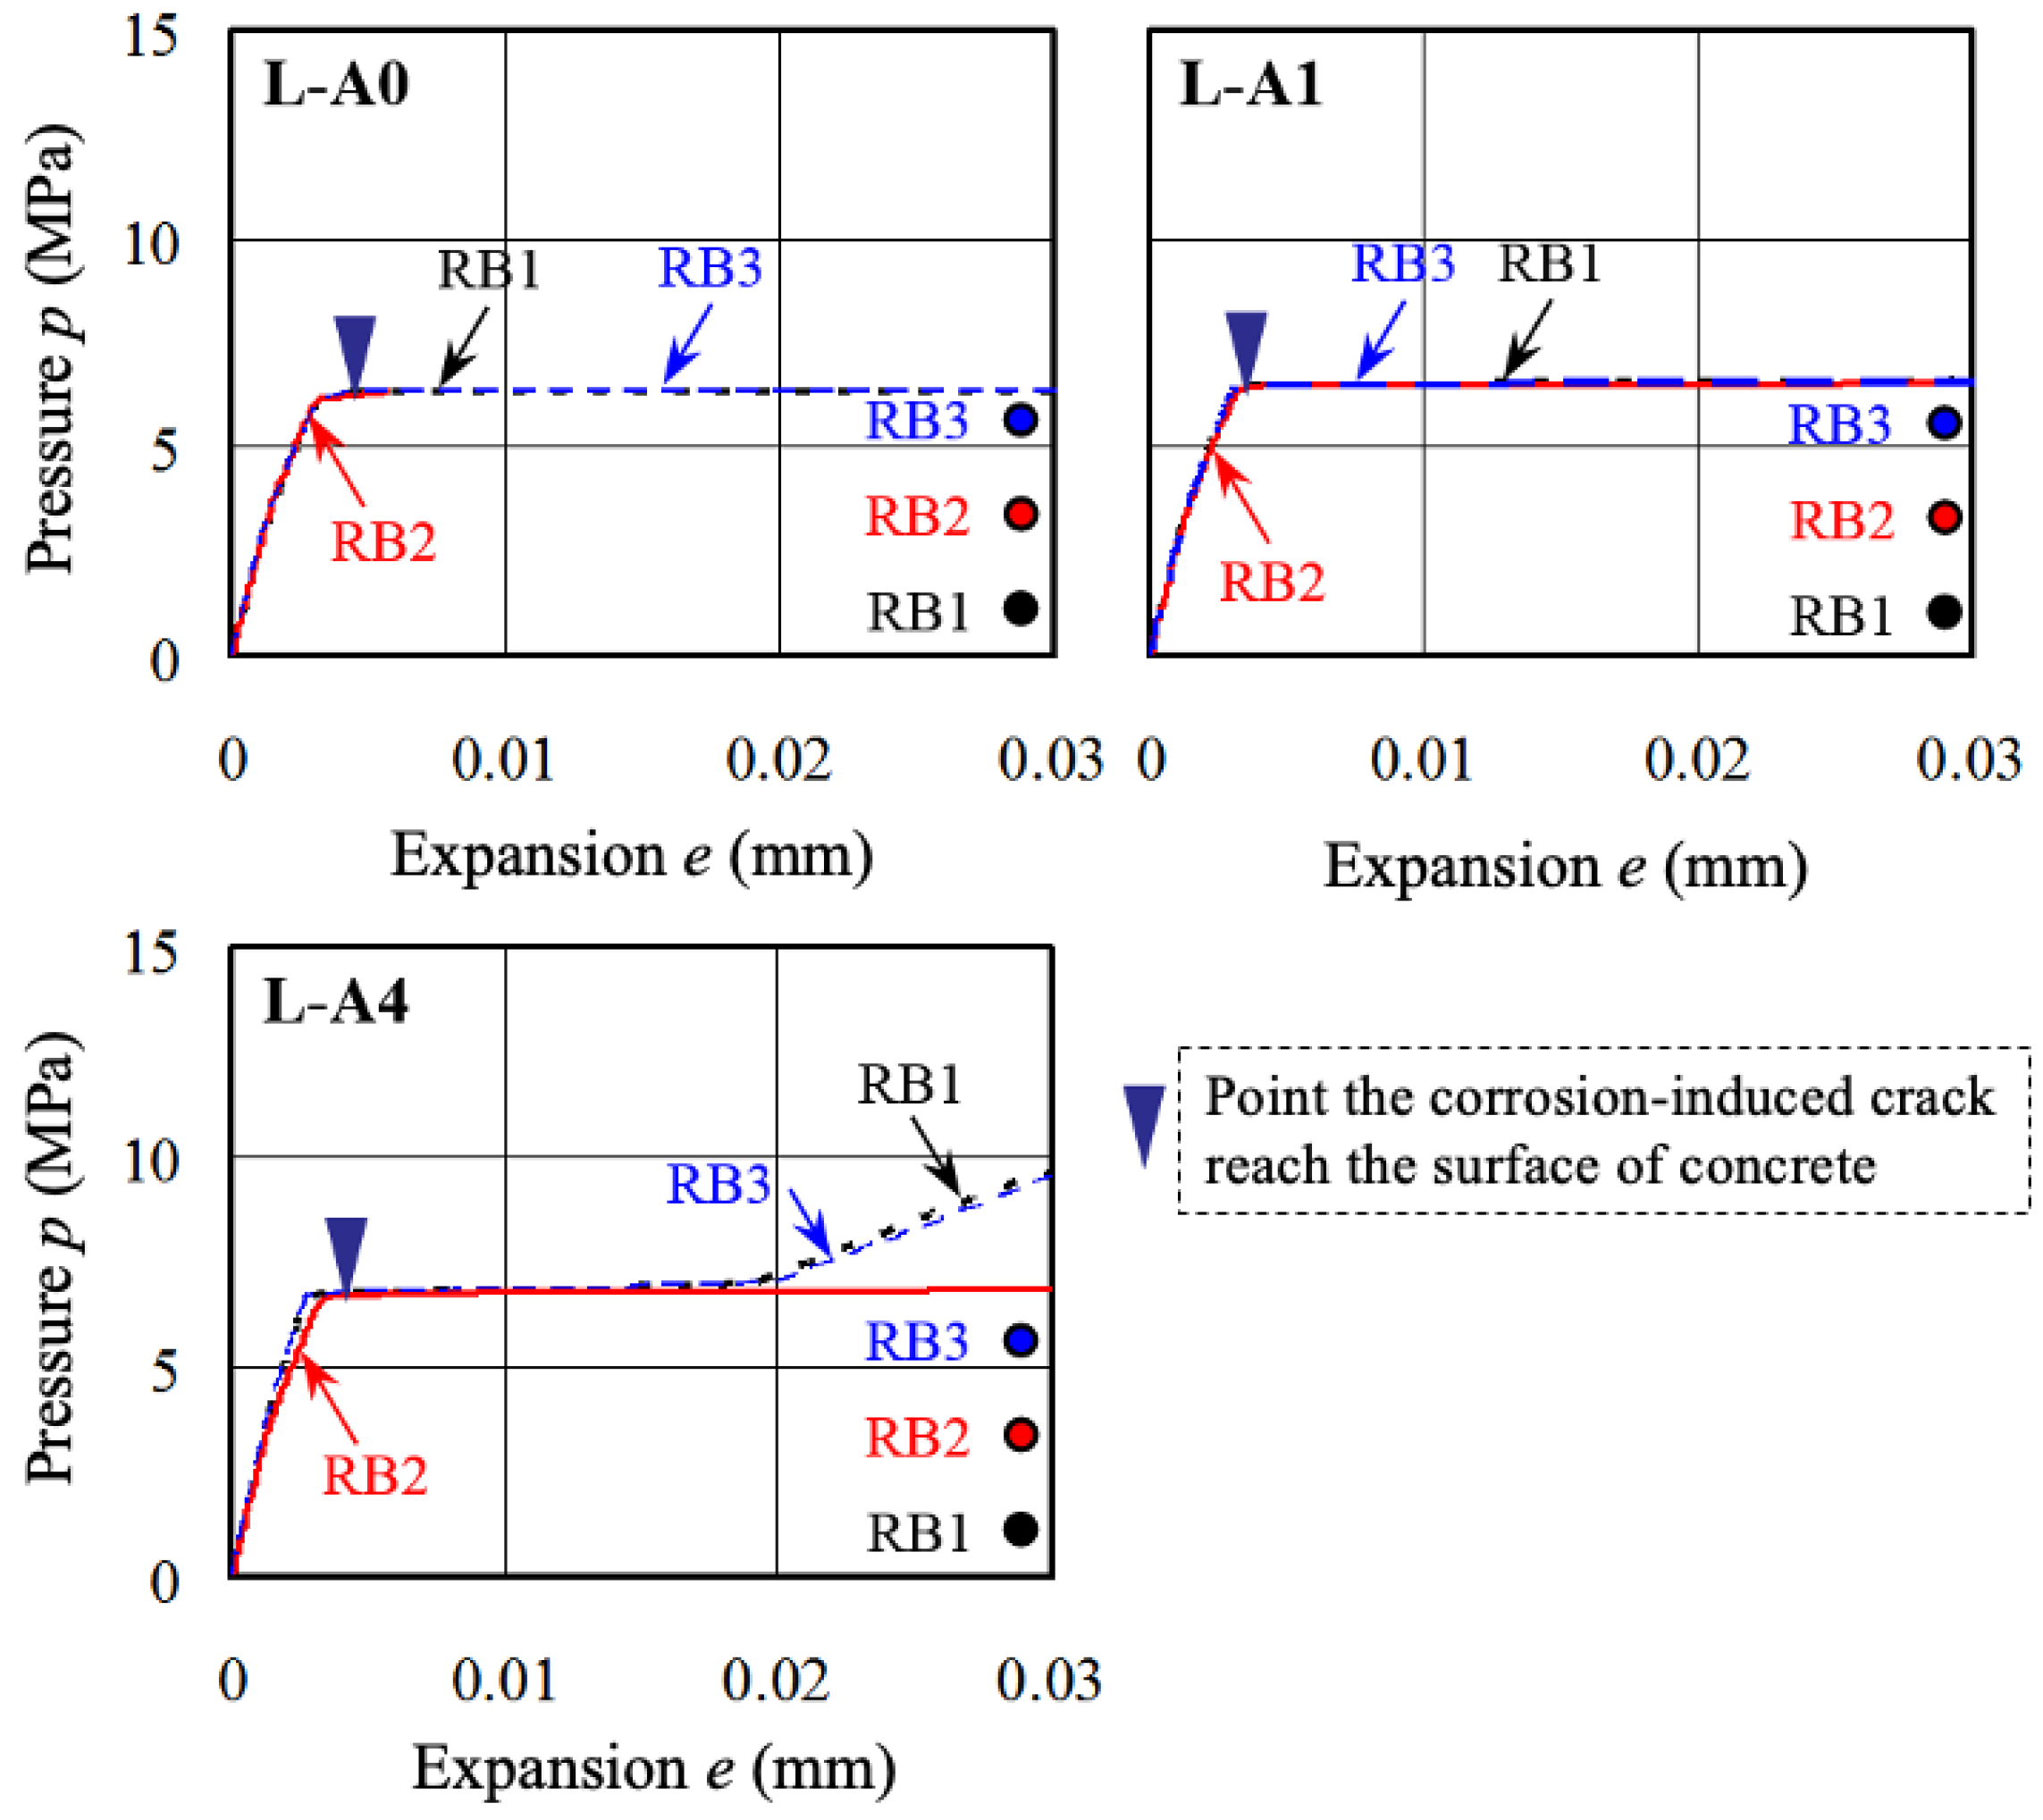
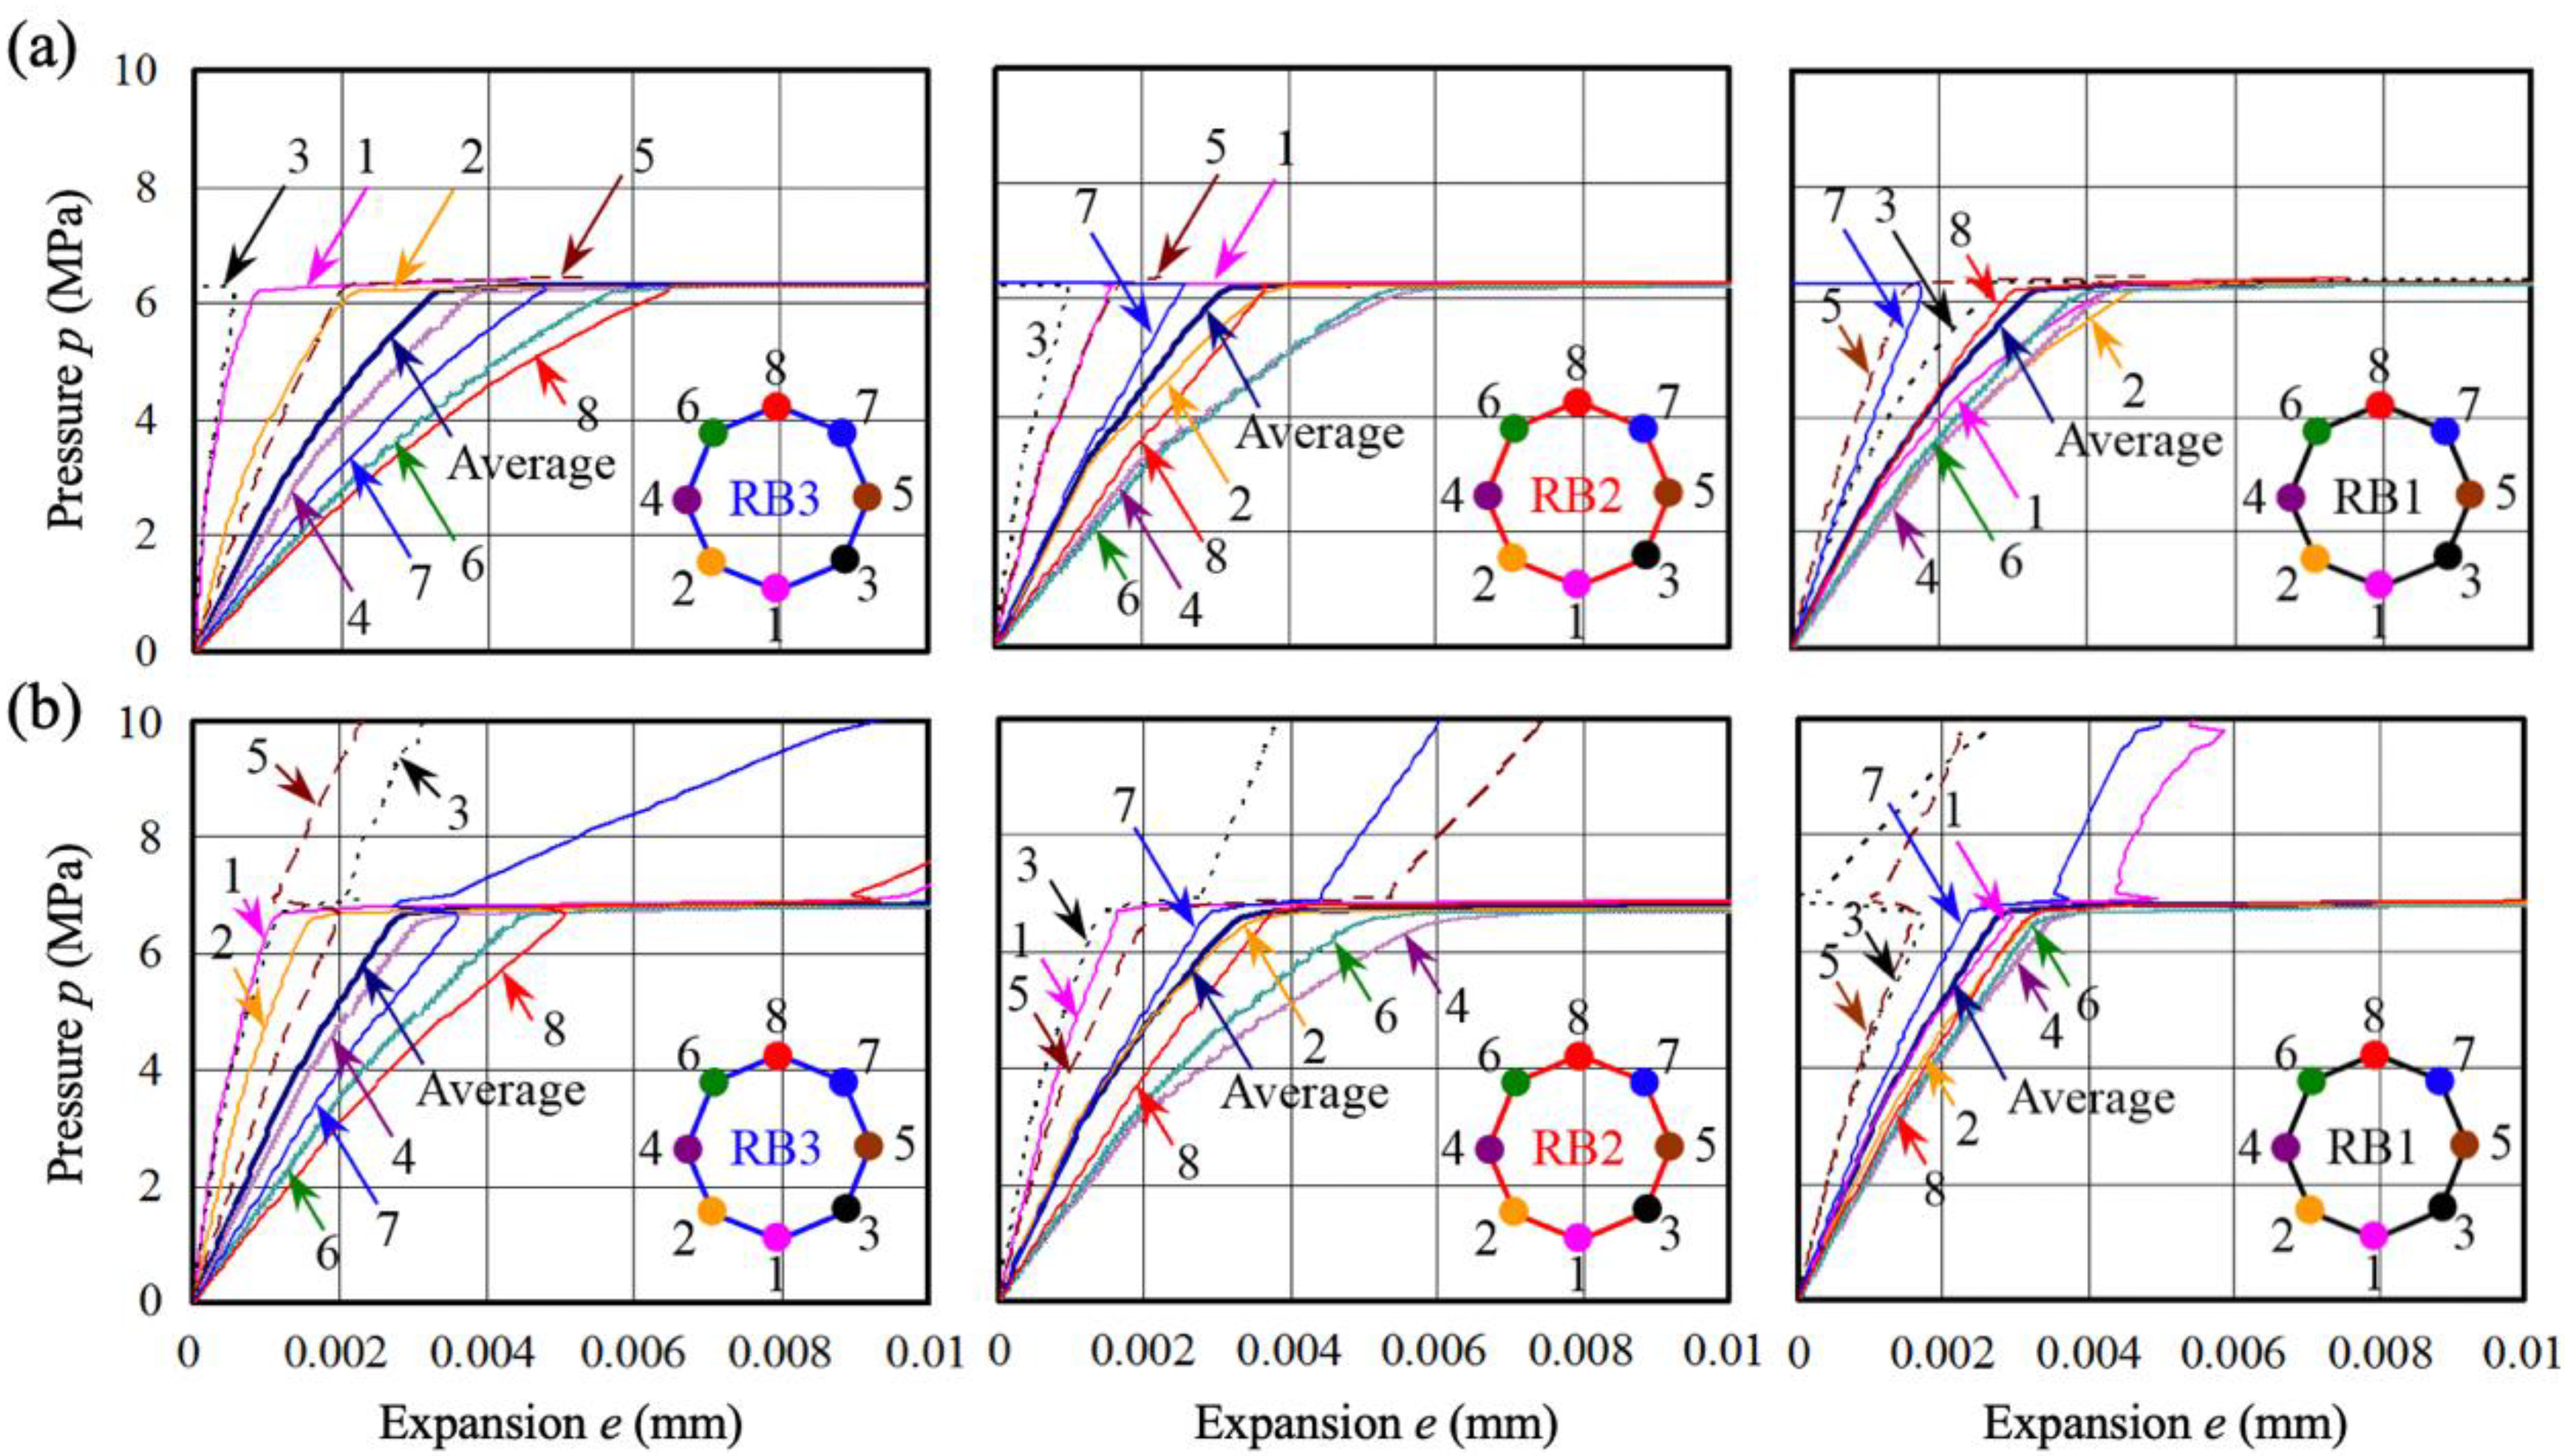
6.2. Internal Pressure and Expansion by Corrosion of Steel Bar
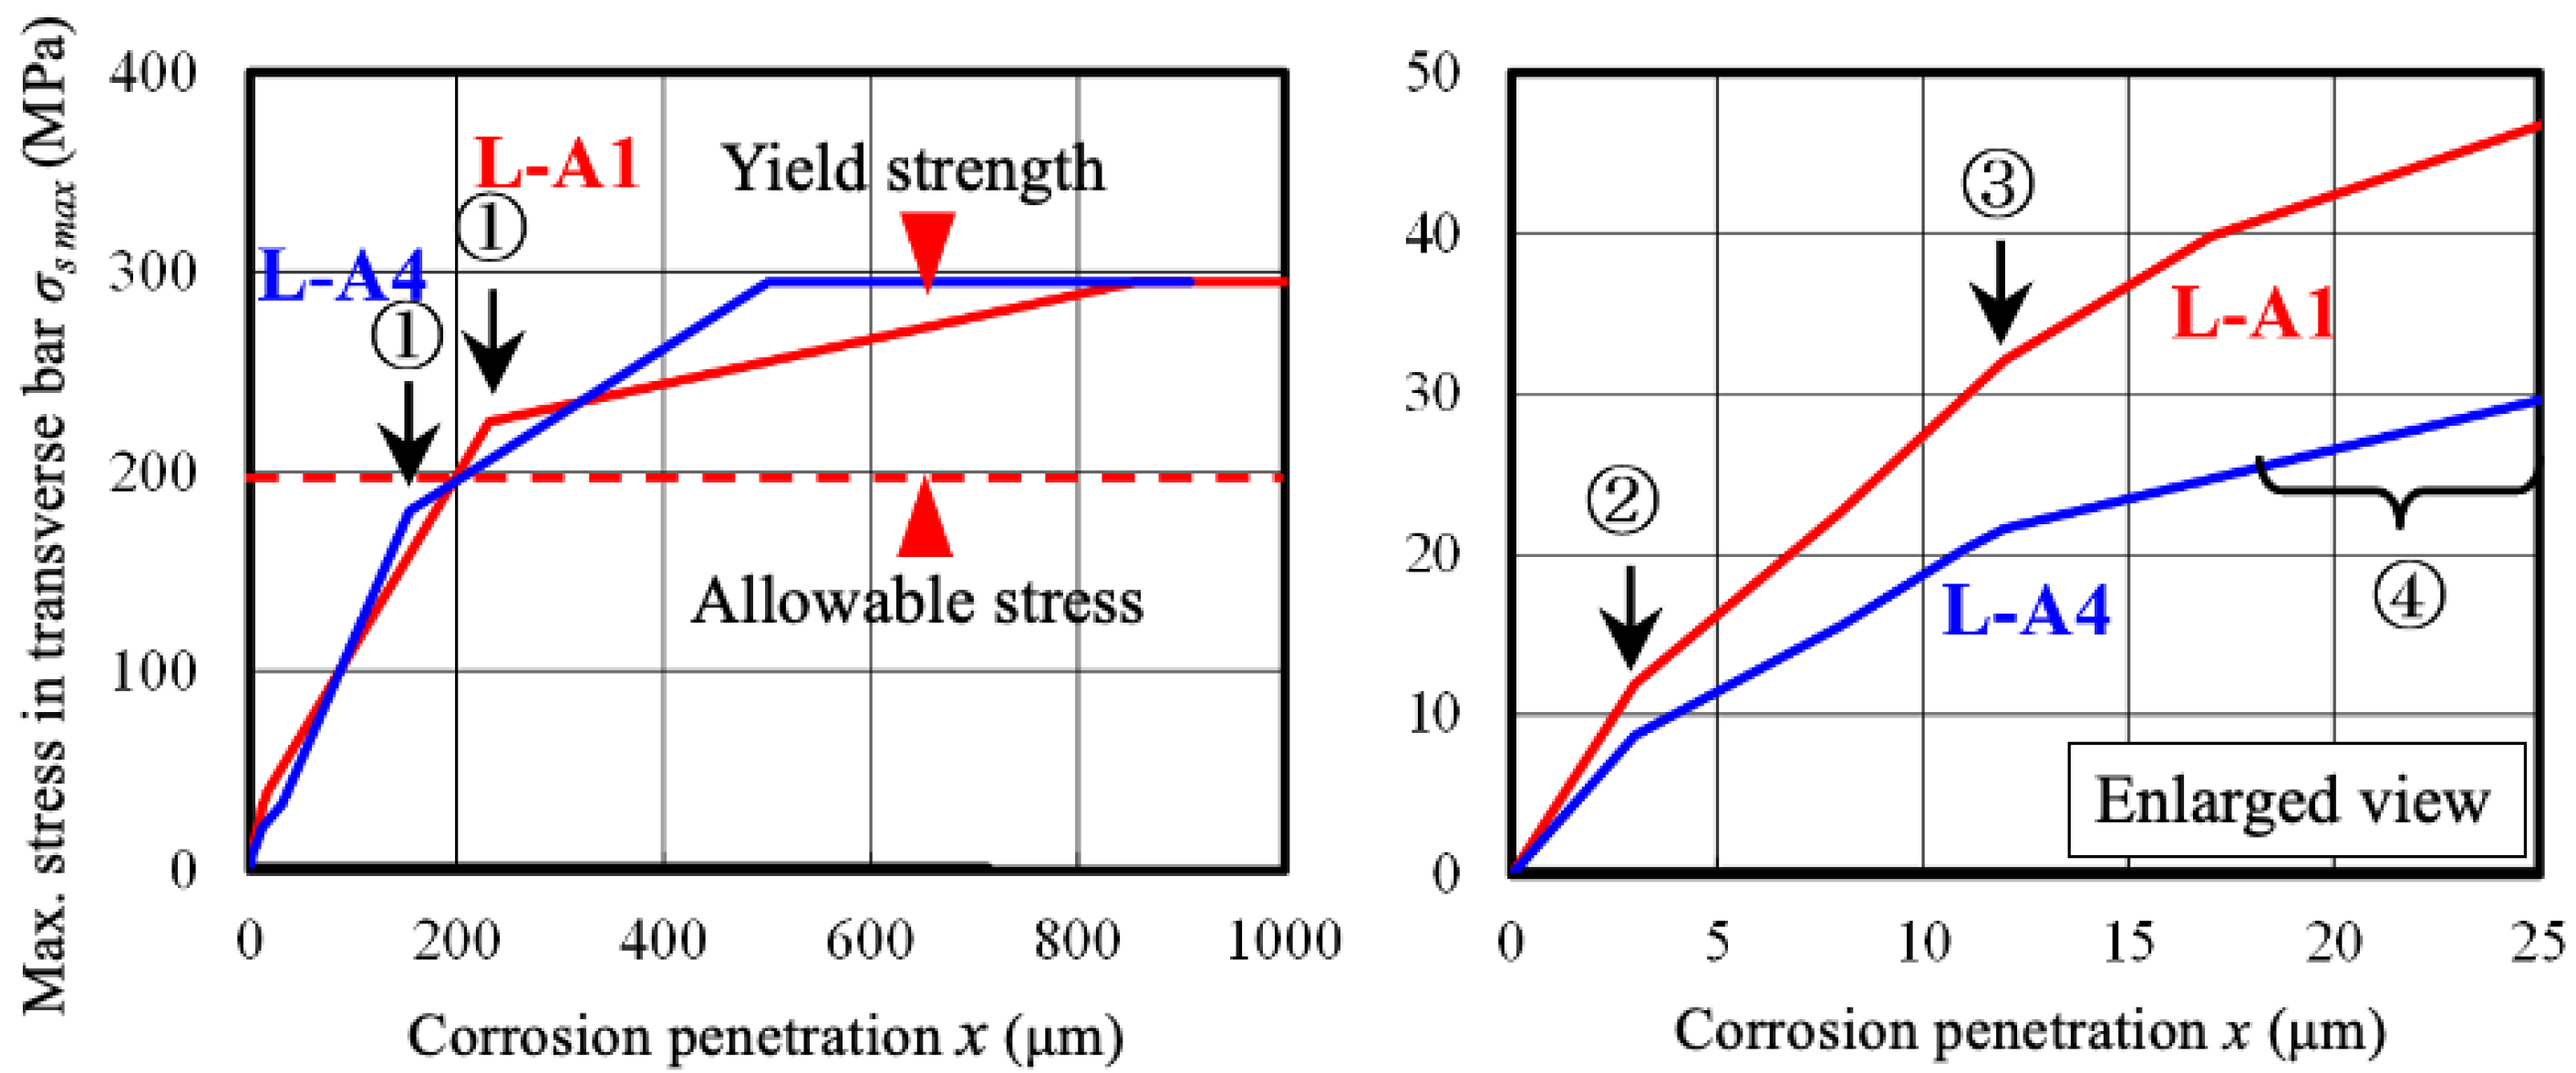
6.3. Maximum Stress in Transverse Bar and Corrosion Penetration
7. Conclusions
- (1)
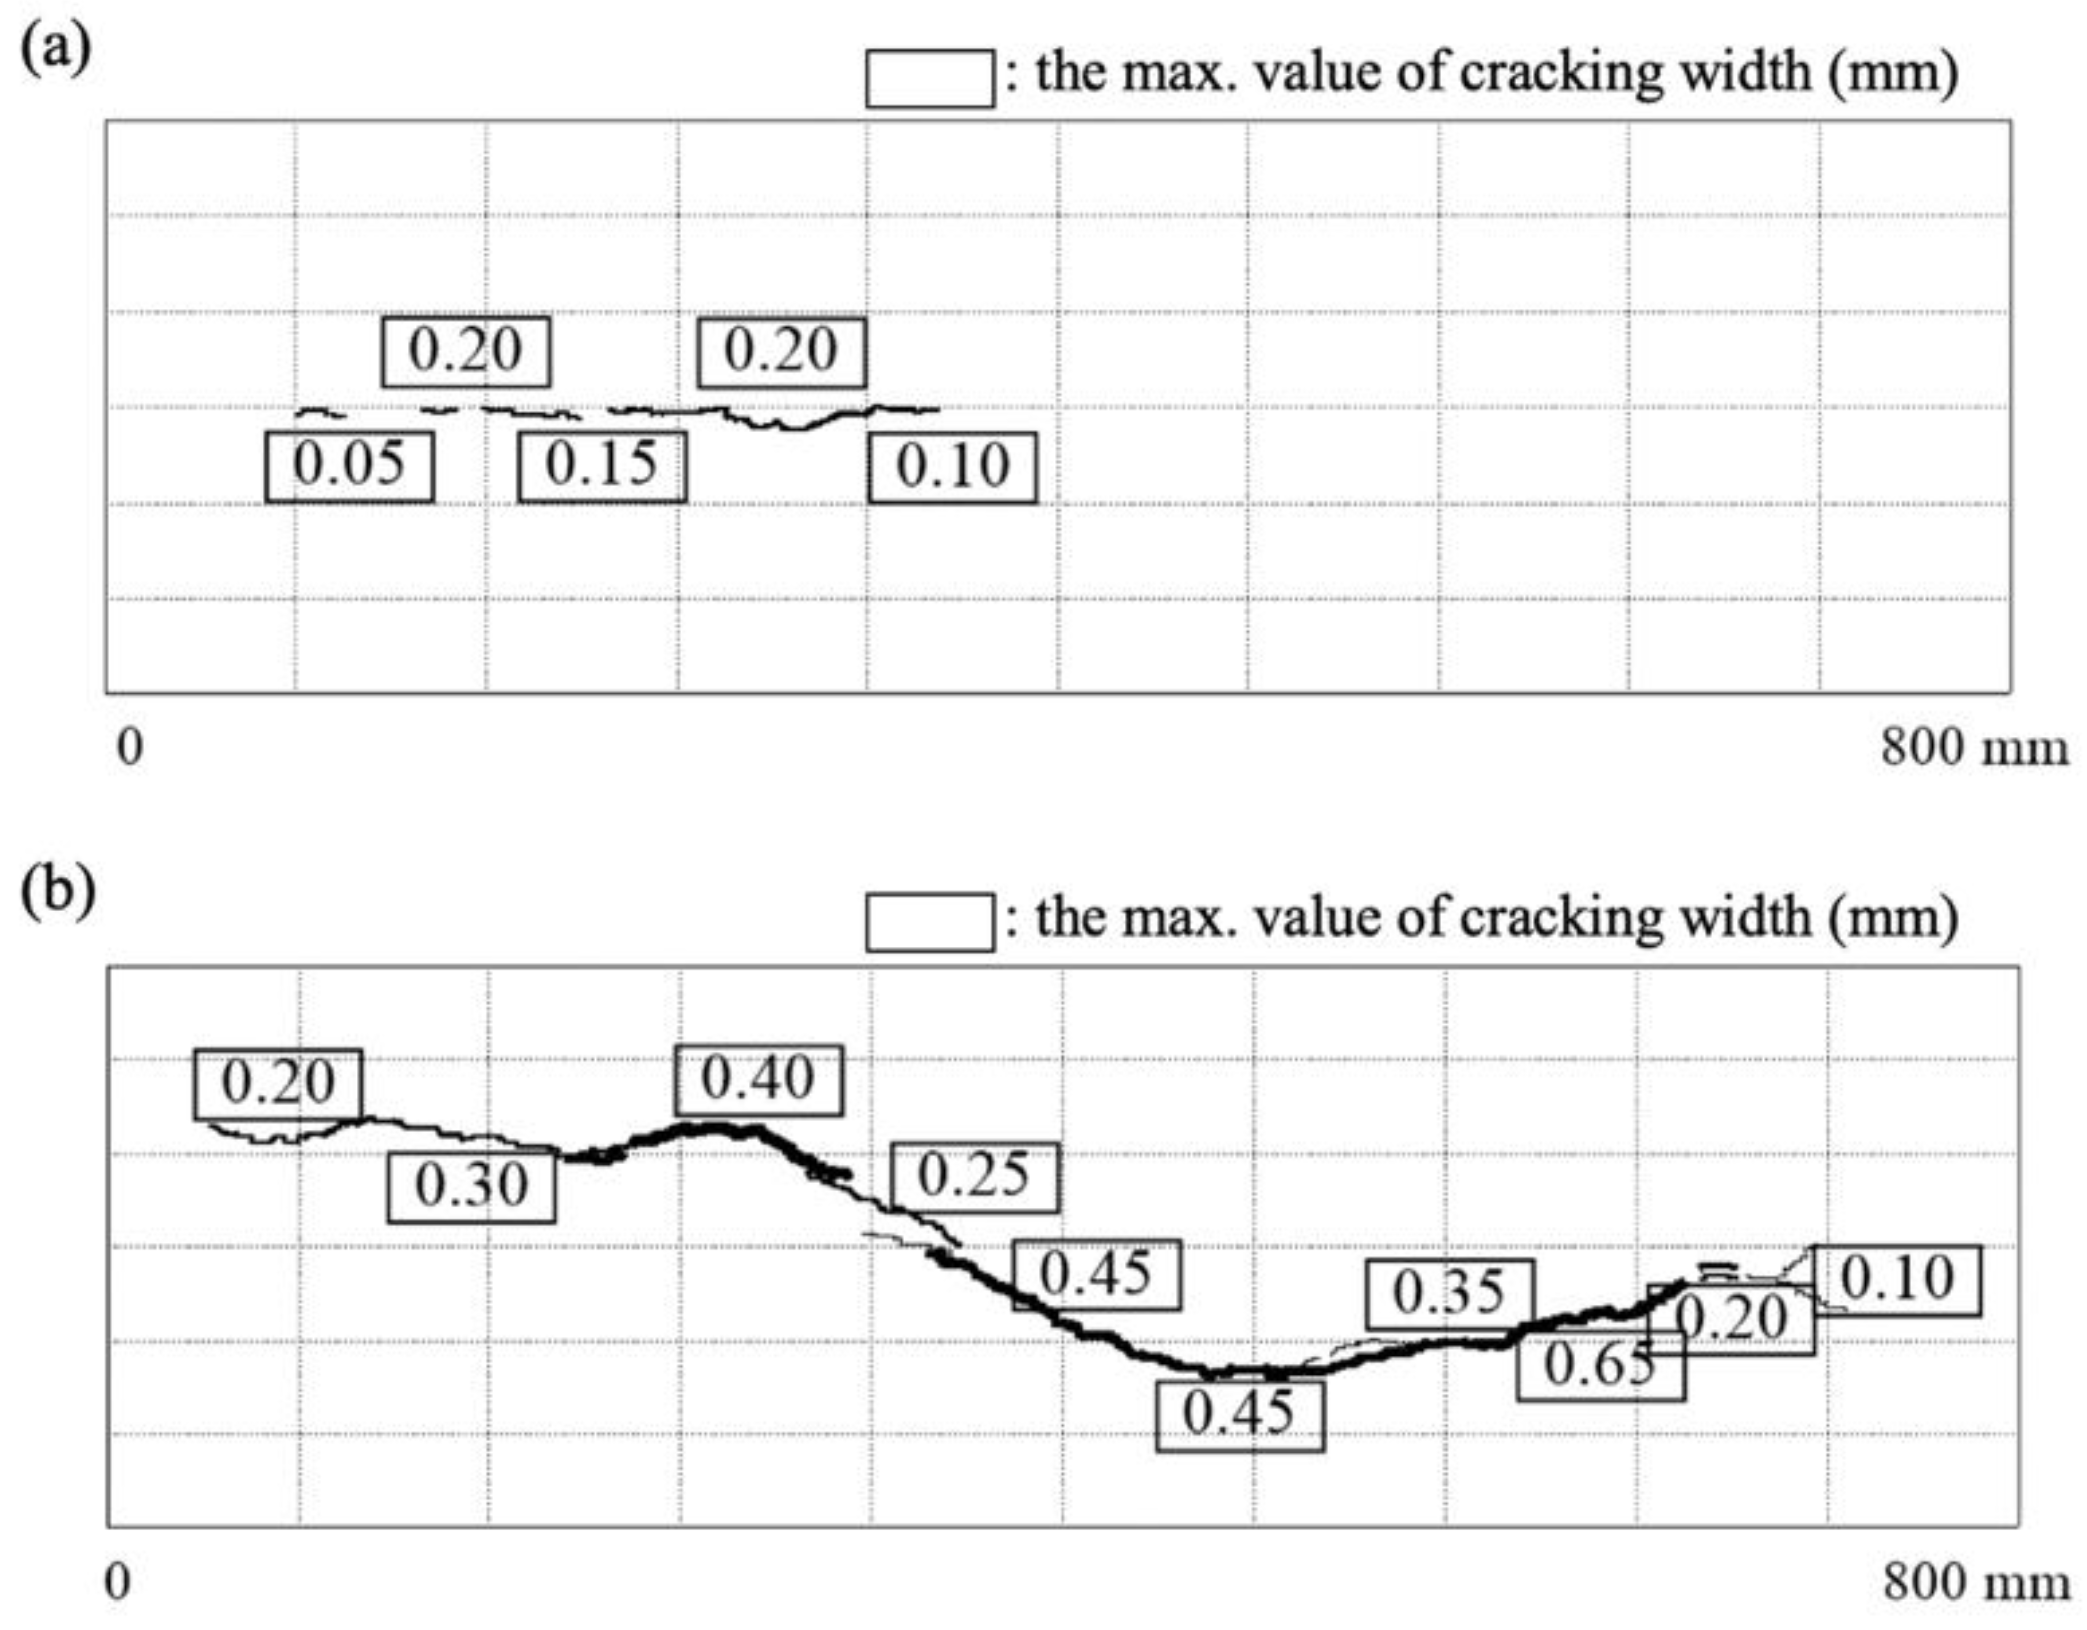
- In order to estimate the corrosion expansion rate of reinforcing bars, accelerated corrosion tests and finite element analysis using the corrosion expansion model by Lundgren for reinforced concrete specimens were conducted and compared. When the corrosion expansion rate of the reinforcing bar was set to 2, the analysis results (0.05–0.2 mm) approximately met the relationship between the crack width of concrete and corrosion rate of reinforcing bars (0.12 mm).
- (2)
- In the range of 3–8 μm of corrosion depth, cracks developed independently in the concrete around the rebar, and the mechanical behavior of the bars, such as the corrosion–expansion relationship, were similar regardless of the position of the main reinforcement or the amount of transverse bars. However, above 10 μm of corrosion depth, the cracks became connected, and the crack behavior differed for each bar according to the position of the main reinforcement or the amount of transverse bars.
- (3)
- For 2% corrosion rate of rebars, cracks exceeded the permissible width on the concrete surface, but they did not significantly affect the limit strength. Nevertheless, repair and reinforcement measures against cracks would be necessary because the promoting factors of neutralization or salting can reach the reinforcing bars through the connected cracks.
- (4)
- Overall, the shear capacity of the reinforced concrete members will be affected by steel corrosion because the stress of the transverse bars reaches the yield strength at corrosion depths of 100–200 μm. However, a wider set of experimental data is required for accurate prediction because, as with the Berra model, the amount of corrosion particles flowing into the cracks increases and corrosion expansion pressure decreases with increasing crack width.
Author Contributions
Funding
Conflicts of Interest
References
- Fu, X.; Chung, D.D.L. Effect of corrosion on the bond between concrete and steel rebar. Cem. Concr. Res. 1997, 27, 1811–1815. [Google Scholar] [CrossRef]
- Bažant, Z.P. Physical model for steel corrosion in concrete sea structures—Application. J. Struct. Div. 1979, 105, 1155–1166. [Google Scholar]
- Liu, Y.; Weyers, R.W. Modeling the time-to-corrosion cracking in chloride contaminated reinforced concrete structures. ACI Mater. J. 1998, 95, 675–680. [Google Scholar]
- Kashani, M.M.; Crewe, A.J.; Alexander, N.A. Use of a 3D optical measurement technique for stochastic corrosion pattern analysis of reinforcing bars subjected to accelerated corrosion. Corros. Sci. 2013, 73, 208–221. [Google Scholar] [CrossRef]
- Suda, K.; Misra, S.; Motohashi, K. Corrosion products of reinforcing bars embedded in concrete. Corros. Sci. 1993, 35, 1543–1549. [Google Scholar] [CrossRef]
- Cabrera, J.G. Deterioration of concrete due to reinforcement steel corrosion. Cem. Concr. Compos. 1996, 18, 47–59. [Google Scholar] [CrossRef]
- Bhargava, K.; Ghosh, A.K.; Mori, Y.; Ramanujam, S. Model for cover cracking due to rebar corrosion in RC structures. Eng. Struct. 2006, 28, 1093–1109. [Google Scholar] [CrossRef]
- Zhao, Y.; Ren, H.; Dai, H.; Jin, W. Composition and expansion coefficient of rust based on X-ray diffraction and thermal analysis. Corros. Sci. 2011, 53, 1646–1658. [Google Scholar] [CrossRef]
- Zhao, Y.; Yu, J.; Hu, B.; Jin, W. Crack shape and rust distribution in corrosion-induced cracking concrete. Corros. Sci. 2012, 55, 385–393. [Google Scholar] [CrossRef]
- Bhargava, K.; Ghosh, A.K.; Mori, Y.; Ramanujam, S. Modeling of time to corrosion-induced cover cracking in reinforced concrete structures. Cem. Concr. Res. 2005, 35, 2203–2218. [Google Scholar] [CrossRef]
- Bhargava, K.; Ghosh, A.K.; Mori, Y.; Ramanujam, S. Analytical model for time to cover cracking in RC structures due to rebar corrosion. Nucl. Eng. Des. 2006, 236, 1123–1139. [Google Scholar] [CrossRef]
- Zhao, Y.X.; Jin, W.L. Modeling the Amount of Steel Corrosion at the Cracking of Concrete Cover. Adv. Struct. Eng. 2006, 9, 687–696. [Google Scholar] [CrossRef]
- Aveldaño, R.R.; Ortega, N.F. Characterization of concrete cracking due to corrosion of reinforcements in different environments. Constr. Build. Mater. 2011, 25, 630–637. [Google Scholar] [CrossRef]
- Pantazopoulou, S.J.; Papoulia, K.D. Modeling Cover-Cracking due to Reinforcement Corrosion in RC Structures. J. Eng. Mech. 2001, 127, 342–351. [Google Scholar] [CrossRef]
- Bossio, A.; Monetta, T.; Bellucci, F.; Lignola, G.P.; Prota, A. Modeling of concrete cracking due to corrosion process of reinforcement bars. Cem. Concr. Res. 2015, 71, 78–92. [Google Scholar] [CrossRef]
- Jamali, A.; Angst, U.; Adey, B.; Elsener, B. Modeling of corrosion-induced concrete cover cracking: A critical analysis. Constr. Build. Mater. 2013, 42, 225–237. [Google Scholar] [CrossRef]
- Du, X.; Jin, L.; Zhang, R. Modeling the cracking of cover concrete due to non-uniform corrosion of reinforcement. Corros. Sci. 2014, 89, 189–202. [Google Scholar] [CrossRef]
- Lundgren, K. Modelling the effect of corrosion on bond in reinforced concrete. Mag. Concr. Res. 2002, 54, 165–173. [Google Scholar] [CrossRef]
- Cao, C.; Cheung, M.M.S.; Chan, B.Y.B. Modelling of interaction between corrosion-induced concrete cover crack and steel corrosion rate. Corros. Sci. 2013, 69, 97–109. [Google Scholar] [CrossRef]
- Marcotte, T.D. Characterization of Chloride-Induced Corrosion Products that Form in Steel-Reinforced Cementitious Materials. Ph.D. Thesis, Mechanical Engineering, University of Waterloo, Waterloo, ON, Canada, 2001. [Google Scholar]
- Marcotte, T.D.; Hansson, C.M. The influence of silica fume on the corrosion resistance of steel in high performance concrete exposed to simulated sea water. J. Mater. Sci. 2003, 38, 4765–4776. [Google Scholar] [CrossRef]
- Zhao, Y.; Dong, J.; Wu, Y.; Jin, W. Corrosion-induced concrete cracking model considering corrosion product-filled paste at the concrete/steel interface. Constr. Build. Mater. 2016, 116, 273–280. [Google Scholar] [CrossRef]
- Wang, X.; Liu, X. Bond strength modeling for corroded reinforcements. Constr. Build. Mater. 2006, 20, 177–186. [Google Scholar] [CrossRef]
- Jaffer, S.J.; Hansson, C.M. Chloride-induced corrosion products of steel in cracked-concrete subjected to different loading conditions. Cem. Concr. Res. 2009, 39, 116–125. [Google Scholar] [CrossRef]
- Vu, K.; Stewart, M.G.; Mullard, J. Corrosion-induced cracking: Experimental data and predictive models. ACI Struct. J. 2005, 102, 719–726. [Google Scholar]
- Tran, K.K.; Nakamura, H.; Kawamura, K.; Kunieda, M. Analysis of crack propagation due to rebar corrosion using RBSM. Cem. Concr. Compos. 2011, 33, 906–917. [Google Scholar] [CrossRef]
- Ormellese, M.; Berra, M.; Bolzoni, F.; Pastore, T. Corrosion inhibitors for chlorides induced corrosion in reinforced concrete structures. Cem. Concr. Res. 2006, 36, 536–547. [Google Scholar] [CrossRef]
- Köliö, A.; Honkanen, M.; Lahdensivu, J.; Vippola, M.; Pentti, M. Corrosion products of carbonation induced corrosion in existing reinforced concrete facades. Cem. Concr. Res. 2015, 78, 200–207. [Google Scholar] [CrossRef]
- Andrade, C.; Alonso, C.; Molina, F.J. Cover cracking as a function of bar corrosion: Part I-Experimental test. Mater. Struct. 1993, 26, 453–464. [Google Scholar] [CrossRef]
- Qiao, D.; Nakamura, H.; Yamamoto, Y.; Miura, T. Crack patterns of concrete with a single rebar subjected to non-uniform and localized corrosion. Constr. Build. Mater. 2016, 116, 366–377. [Google Scholar] [CrossRef]
- Šavija, B.; Luković, M.; Pacheco, J.; Schlangen, E. Cracking of the concrete cover due to reinforcement corrosion: A two-dimensional lattice model study. Constr. Build. Mater. 2013, 44, 626–638. [Google Scholar] [CrossRef]
- Zhao, Y.; Yu, J.; Wu, Y.; Jin, W. Critical thickness of rust layer at inner and out surface cracking of concrete cover in reinforced concrete structures. Corros. Sci. 2012, 59, 316–323. [Google Scholar] [CrossRef]
- Zhao, Y.; Yu, J.; Jin, W. Damage analysis and cracking model of reinforced concrete structures with rebar corrosion. Corros. Sci. 2011, 53, 3388–3397. [Google Scholar] [CrossRef]
- Val, D.V.; Chernin, L.; Stewart, M.G. Experimental and Numerical Investigation of Corrosion-Induced Cover Cracking in Reinforced Concrete Structures. J. Struct. Eng. 2009, 135, 376–385. [Google Scholar] [CrossRef]
- Jin, L.; Zhang, R.; Du, X.; Li, Y. Investigation on the cracking behavior of concrete cover induced by corner located rebar corrosion. Eng. Fail. Anal. 2015, 52, 129–143. [Google Scholar] [CrossRef]
- Ji, Y.; Hu, Y.; Zhang, L.; Bao, Z. Laboratory studies on influence of transverse cracking on chloride-induced corrosion rate in concrete. Cem. Concr. Compos. 2016, 69, 28–37. [Google Scholar] [CrossRef]
- Wong, H.S.; Zhao, Y.X.; Karimi, A.R.; Buenfeld, N.R.; Jin, W.L. On the penetration of corrosion products from reinforcing steel into concrete due to chloride-induced corrosion. Corros. Sci. 2010, 52, 2469–2480. [Google Scholar] [CrossRef]
- Lu, C.; Jin, W.; Liu, R. Reinforcement corrosion-induced cover cracking and its time prediction for reinforced concrete structures. Corros. Sci. 2011, 53, 1337–1347. [Google Scholar] [CrossRef]
- Torres-Acosta, A.A.; Martnez-Madrid, M. Residual Life of Corroding Reinforced Concrete Structures in Marine Environment. J. Mater. Civ. Eng. 2003, 15, 344–353. [Google Scholar] [CrossRef]
- Zhao, Y.; Dong, J.; Wu, Y.; Wang, H.; Li, X.; Xu, Q. Steel corrosion and corrosion-induced cracking in recycled aggregate concrete. Corros. Sci. 2014, 85, 241–250. [Google Scholar] [CrossRef]
- Lin, H.; Zhao, Y. Effects of confinements on the bond strength between concrete and corroded steel bars. Constr. Build. Mater. 2016, 118, 127–138. [Google Scholar] [CrossRef]
- Fang, C.; Lundgren, K.; Chen, L.; Zhu, C. Corrosion influence on bond in reinforced concrete. Cem. Concr. Res. 2004, 34, 2159–2167. [Google Scholar] [CrossRef]
- Fang, C.; Lundgren, K.; Plos, M.; Gylltoft, K. Bond behaviour of corroded reinforcing steel bars in concrete. Cem. Concr. Res. 2006, 36, 1931–1938. [Google Scholar] [CrossRef]
- Fang, C.; Gylltoft, K.; Lundgren, K.; Plos, M. Effect of corrosion on bond in reinforced concrete under cyclic loading. Cem. Concr. Res. 2006, 36, 548–555. [Google Scholar] [CrossRef]
- Wang, L.; Zhang, X.; Zhang, J.; Ma, Y.; Liu, Y. Effects of stirrup and inclined bar corrosion on shear behavior of RC beams. Constr. Build. Mater. 2015, 98, 537–546. [Google Scholar] [CrossRef]
- Du, Y.G.; Chan, A.H.C.; Clark, L.A.; Wang, X.T.; Gurkalo, F.; Bartos, S. Finite element analysis of cracking and delamination of concrete beam due to steel corrosion. Eng. Struct. 2013, 56, 8–21. [Google Scholar] [CrossRef]
- Berra, M.; Castellani, A.; Coronelli, D.; Zanni, S.; Zhang, G. Steel–concrete bond deterioration due to corrosion: Finite-element analysis for different confinement levels. Mag. Concr. Res. 2003, 55, 237–247. [Google Scholar] [CrossRef]
- ASTM C39/39M Standard Test Method for Compressive Strength of Cylindrical Concrete Specimens; Annual Book of ASTM Strandards; ASTM International: West Conshohocken, PA, USA, 2015.
- DIANA User’s Manual—Release 9.2; TNO DIANA BV: Delft, The Netherlands, 2007.
- Chen, W.F. Plasticity in Reinforced Concrete; J. Ross Publishing: New York, NY, USA, 2007. [Google Scholar]


| Component Materials (kg/m3) | |
|---|---|
| Water | 175 |
| Ordinary Portland cement (Type II) | 350 |
| Fine aggregate | 780 |
| Coarse aggregate (Maximum size: 20 mm) | 968 |
| Water/cement ratio (W/C) | 0.5 |
| Water reducer/cement (wt % by cement) | 0.8 |
| Average slump a (mm) | 20.0 |
| Average air content a (%) | 4.6 |
| Average compressive strength a (MPa) | 42.5 |
| Average splitting tensile strength a (MPa) | 2.8 |
| (performed 28 days after casting) |
| Step | Expansion Pressure p (MPa) | Corrosion Expansion e (×10−3 mm) | Max. Crack Strain εcr max (×10−4) | Corrosion Penetration x (×10−3 mm) | Cross-Section Loss aloss (%) |
|---|---|---|---|---|---|
| 8 | 4.0 | 1.66 | 0.03 | 5.3 | 0.11 |
| 19 | 9.5 | 6.00 | 0.27 | 27.3 | 0.53 |
| 27 | 11.5 | 8.95 | 4.74 | 45.5 | 0.95 |
| 29 | 11.7 | 10.00 | 5.52 | 51.4 | 1.07 |
| 30 | 11.8 | 26.60 | 18.30 | 141.0 | 2.94 |
| ID | Loading Method | Cross-Sectional Area of Transverse Reinforcement |
|---|---|---|
| L-A0 | Internal pressure control | 0 mm2 (pw = 0) |
| L-A1 | Internal pressure control | 28 mm2 (pw = 0.47%) |
| L-A4 | Internal pressure control | 112 mm2 (pw = 1.87%) |
© 2020 by the authors. Licensee MDPI, Basel, Switzerland. This article is an open access article distributed under the terms and conditions of the Creative Commons Attribution (CC BY) license (http://creativecommons.org/licenses/by/4.0/).
Share and Cite
Choe, G.; Shinohara, Y.; Kim, G.; Nam, J. Numerical Investigation on Lateral Confinement Effects on Concrete Cracking Induced by Rebar Corrosion. Materials 2020, 13, 1156. https://doi.org/10.3390/ma13051156
Choe G, Shinohara Y, Kim G, Nam J. Numerical Investigation on Lateral Confinement Effects on Concrete Cracking Induced by Rebar Corrosion. Materials. 2020; 13(5):1156. https://doi.org/10.3390/ma13051156
Chicago/Turabian StyleChoe, Gyeongcheol, Yasuji Shinohara, Gyuyong Kim, and Jeongsoo Nam. 2020. "Numerical Investigation on Lateral Confinement Effects on Concrete Cracking Induced by Rebar Corrosion" Materials 13, no. 5: 1156. https://doi.org/10.3390/ma13051156
APA StyleChoe, G., Shinohara, Y., Kim, G., & Nam, J. (2020). Numerical Investigation on Lateral Confinement Effects on Concrete Cracking Induced by Rebar Corrosion. Materials, 13(5), 1156. https://doi.org/10.3390/ma13051156