Self-Assembly Processes in Hydrated Montmorillonite by FTIR Investigations

 ,
,  ,
,  and
and 
Abstract
1. Introduction
2. Materials and Methods
3. Analysis and Discussion
4. Conclusions
Author Contributions
Funding
Acknowledgments
Conflicts of Interest
References
- Kloprogge, J.T.; Komarneni, S.; Amonette, J.E. Synthesis of smectite Clay mineral: A critical review. Clays Clay Miner. 1999, 47, 529–554. [Google Scholar] [CrossRef]
- Kalo, H.; Milius, W.; Breu, J. Single crystal structure refinement of one- and two-layer hydrates of sodium fluorohectorite. RSC Adv. 2012, 2, 8452–8459. [Google Scholar] [CrossRef]
- Dor, M.; Levi-Kalisman, Y.; Day-Stirrat, R.J.; Mishael, Y.; Emmanuel, S. Assembly of clay mineral platelets, tactoids, and aggregates: Effect of mineral structure and solution salinity. J. Colloid Interface Sci. 2020, 566, 163–170. [Google Scholar] [CrossRef] [PubMed]
- Zhou, T.; Wang, Y.; Huang, S.; Zhao, Y. Synthesis composite hydrogels from inorganic-organic hybrids based on leftover rice for environment-friendly controlled-release urea fertilizers. Sci. Total Environ. 2018, 15, 422–430. [Google Scholar] [CrossRef] [PubMed]
- Bhattacharyya, K.G.; Sen Gupta, S. Adsorption of a few heavy metals on natural and modified kaolinite and montmorillonite: A review. Adv. Colloid Interface Sci. 2008, 40, 114–131. [Google Scholar] [CrossRef] [PubMed]
- Kumar, P.; Jasra, R.V.; Bhat, T.S.G. Evolution of porosity and surface acidity in montmorillonite clay on acid activation. Ind. Eng. Chem. Res. 1995, 34, 1440–1448. [Google Scholar] [CrossRef]
- He, H.; Guo, J.; Xie, X.; Lin, H.; Li, L. A microstructural study of acid-activated montmorillonite from Choushan, China. Clay Miner. 2002, 37, 337–344. [Google Scholar] [CrossRef]
- Leite, F.L.; Bueno, C.C.; Da Róz, A.L.; Ziemath, E.C.; Oliveira, O.N., Jr. Theoretical models for surface forces and adhesion and their measurement using atomic force microscopy. Int. J. Mol. Sci. 2012, 13, 12773–12856. [Google Scholar] [CrossRef]
- Cecilia, J.A.; García-Sancho, C.; Franco, F. Montmorillonite based porous clay heterostructures: Influence of Zr in the structure and acidic properties. Microporous Mesoporous Mater. 2013, 176, 95–102. [Google Scholar] [CrossRef]
- Li, S.; Wu, P.; Li, H.; Zhu, N.; Dang, Z. Synthesis and characterization of organo-montmorillonite supported iron nanoparticles. Appl. Clay Sci. 2010, 3, 330–336. [Google Scholar] [CrossRef]
- Hosseini, M.G.; Jafari, M.; Najjar, R. Effect of polyaniline–montmorillonite nanocomposite powders addition on corrosion performance of epoxy coatings on Al 5000. Surf. Coat. Int. 2011, 206, 280–286. [Google Scholar] [CrossRef]
- Komatsu, L.G.H.; Oliani, W.L.; Lugao, A.B.; Parra, D.F. Environmental ageing of irradiated polypropylene/montmorillonite nanocomposites obtained in molten state. Radiat. Phys. Chem. 2014, 97, 233–238. [Google Scholar] [CrossRef]
- Kang, M.K.; Cha, E.J.; Song, H.H.; Na, Y.H. Interlayer structure and magnetic field-induced orientation of modified nanoclays in polymer aqueous solution. Heliyon 2019, 5, e02421. [Google Scholar] [CrossRef]
- Chen, Q.; Zhu, R.; Ma, L.; Zhou, Q.; He, H. Influence of interlayer species on the thermal characteristics of montmorillonite. Appl. Clay Sci. 2017, 135, 129–135. [Google Scholar] [CrossRef]
- Andronescu, C.; Gârea, S.A.; Deleanu, C.; Nicolescu, A.; Iovu, H. The influence of montmorillonite concentration and solvent polarity on the synthesis of benzoxazine monomers in the presence of montmorillonite. Appl. Clay Sci. 2013, 86, 99–105. [Google Scholar] [CrossRef]
- Fernández, M.; Alba, M.D.; Torres Sánchez, R.M. Effects of thermal and mechanical treatments on montmorillonite homoionized with mono- and polyvalent cations: Insight into the surface and structural changes. Colloids Surf. A 2013, 423, 1–10. [Google Scholar] [CrossRef]
- Fan, M.; Yuan, P.; Zhu, J.; Chen, T.; Liu, D. Core–shell structured iron nanoparticles well dispersed on montmorillonite. J. Magn. Magn. Mater. 2009, 321, 3515–3519. [Google Scholar] [CrossRef]
- Tunç, S.; Duman, O. Preparation and characterization of biodegradable methyl cellulose/montmorillonite nanocomposite films. Appl. Clay Sci. 2010, 48, 414–424. [Google Scholar] [CrossRef]
- Savelyev, Y.V.; Gonchar, A.N. Exfoliation of Montmorillonite in polymer matrix and its influence on the nanocomposites properties. Polym. J. 2019, 41, 149–158. [Google Scholar] [CrossRef]
- Santos, K.S.; Bischoff, E.; Liberman, S.A.; Oviedo, M.A.; Mauler, R.S. The effects of ultrasound on organoclay dispersion in the pp matrix. Ultrason. Sonochem. 2011, 18, 997–1001. [Google Scholar] [CrossRef]
- Nicolosi, V.; Chhowalla, M.; Kanatzidis, M.G.; Strano, M.S.; Coleman, J.N. Liquid exfoliation of layered materials. Science 2013, 340, 1–18. [Google Scholar] [CrossRef]
- Chaudhary, D.; Liu, H. Ultrasonic treatment and synthesis of sugar alcohol modified Na+-montmorillonite clay. Ultrason. Sonochem. 2013, 20, 63–68. [Google Scholar] [CrossRef] [PubMed]
- Martinez-Colunga, J.G.; Sanchez-Valdes, S.; Blanco-Cardenas, A.; Ramírez-Vargas, E.; Ramos-De Valle, L.F.; Benavides-Cantu, R.; Espinoza-Martinez, A.B.; Sanchez-Lopez, S.; Lafleur, P.G.; Karami, S.; et al. Dispersion and exfoliation of nanoclays in itaconic acid funcionalized LDPE by ultrasound treatment. J. Appl. Polym. Sci. 2018, 46260, 1–10. [Google Scholar] [CrossRef]
- Li, Z.; Su, G.; Zheng, Q.; Nguyen, T.S. A dual-porosity model for the study of chemical effects on the swelling behaviour of MX-80 bentonite. Acta Geotech. 2019. [Google Scholar] [CrossRef]
- Murad, M.A.; Moyne, C. A dual-porosity model for ionic solute transport in expansive clays. Comput. Geosci. 2008, 12, 47–82. [Google Scholar] [CrossRef]
- Musso, G.; Romero, E.; della Vecchia, G. Double-structure effects on the chemo-hydro-mechanical behaviour of a compacted active clay. Geotechnique 2013, 63, 206–220. [Google Scholar] [CrossRef]
- Emiel, J.M.; Hensen, S.B. Why clay swell. J. Phys. Chem. B 2002, 106, 12664–12667. [Google Scholar]
- Tyagi, B.; Chudasama, C.D.; Jasra, R.V. Determination of structural modification in acid activated montmorillonite clay by FT-IR spectroscopy. Spectrochim. Acta A 2006, 64, 273–278. [Google Scholar] [CrossRef]
- Zheng, Y.; Zaoui, A. Mechanical behavior in hydrated Na-montmorillonite clay. Physica A 2018, 582–590. [Google Scholar] [CrossRef]
- Wan, Y.; Zhao, D. On the controllable soft-templating approach to mesoporous silicates. Chem. Rev. 2007, 107, 2821–2860. [Google Scholar] [CrossRef]
- Bonaccorsi, L.; Calandra, P.; Kiselev, M.A.; Amenitsch, H.; Proverbio, E.; Lombardo, D. Self-assembly in poly(dimethylsiloxane)-poly(ethylene oxide) block copolymer template directed synthesis of linde type A zeolite. Langmuir 2013, 29, 7079–7086. [Google Scholar] [CrossRef]
- Stein, A.; Rudisill, S.G.; Petkovich, N.D. Perspective on the influence of interactions between hard and soft templates and precursors on morphology of hierarchically structured porous materials. Chem. Mater. 2013, 26, 259–276. [Google Scholar] [CrossRef]
- Bonaccorsi, L.; Lombardo, D.; Longo, A.; Proverbio, E.; Triolo, A. Dendrimer template directed self-assembly during zeolite formation. Macromolecules 2009, 42, 1239–1243. [Google Scholar] [CrossRef]
- Bonaccorsi, L.; Calandra, P.; Amenitsch, H.; Proverbio, E.; Lombardo, D. Growth of fractal aggregates during template directed SAPO-34 zeolite formation. Microporous Mesoporous Mater. 2013, 167, 3–9. [Google Scholar] [CrossRef]
- Strangman, G.; Boas, D.A.; Sutton, J.P. Non-invasive neuroimaging using near-infrared light. Biol. Psych. 2002, 52, 679–693. [Google Scholar] [CrossRef]
- Villringer, A.; Chance, B. Non-invasive optical spectroscopy and imaging of human brain function. Trends Neurosci. 1997, 20, 435–442. [Google Scholar] [CrossRef]
- Doménech Carbó, M.T.; Bosch Reig, F.; Gimeno Adelantado, J.V.; Periz Martínez, V. Fourier transform infrared spectroscopy and the analytical study of works of art for purposes of diagnosis and conservation. Anal. Chim. Acta 1996, 330, 207–215. [Google Scholar] [CrossRef]
- Rohman, A.; Che Man, Y.B. Analysis of cod-liver oil adulteration using Fourier transform infrared (FTIR) spectroscopy. J. Am. Oil Chem. Soc. 2009, 86, 1149–1153. [Google Scholar] [CrossRef]
- Coates, J. Interpretation of infrared spectra, a practical approach. Encycl. Anal. Chem. 2006, 10815–10837. [Google Scholar]
- Caccamo, M.T.; Cannuli, A. PEG acoustic levitation treatment for historic wood preservation investigated by means of FTIR spectroscopy and wavelets. Curr. Chem. Biol. 2019, 13, 60–72. [Google Scholar] [CrossRef]
- Deepa, M.; Sharma, N.; Agnihotory, S.A.; Chandra, R. FTIR investigation on iondion interactionin liquid and gel polymeric electrolytes-LiCF3SO3-PC-PMMA. J. Mater. Sci. 2001, 37, 1759–1765. [Google Scholar] [CrossRef]
- Suthanthiraraj, S.A.; Kumar, R.J.; Paul, B. Vibrational spectroscopic and electrochemical characteristics of Poly (Propylene Glycol)-silver triflate polymerelectrolyte system. Ionics 2009, 16, 145–151. [Google Scholar] [CrossRef]
- Winie, T.; Arof, A.K. FT-IR studies on interactions among components in hexanoyl chitosan-based polymer electrolytes. Spectrochim. Acta A 2006, 63, 677–684. [Google Scholar] [CrossRef]
- Migliardo, F.; Magazù, S.; Caccamo, M.T. Infrared, Raman and INS studies of poly-ethylene oxide oligomers. J. Mol. Struct. 2013, 1048, 261–266. [Google Scholar] [CrossRef]
- Duval, M.; Gross, E. Degradation of poly (ethylene oxide) in aqueous solutions by ultrasonic waves. Macromolecules 2013, 46, 4972–4977. [Google Scholar] [CrossRef]
- Magazù, S. NMR, static and dynamic light and neutron scattering investigations on polymeric aqueous solutions. J. Mol. Struct. 2000, 523, 47–59. [Google Scholar] [CrossRef]
- Polik, W.F.; Burchard, W. Static light scattering from aqueous poly (ethylene oxide) solutions in the temperature range 20–90 °C. Macromolecules 1983, 16, 978–982. [Google Scholar] [CrossRef]
- Iguchi, C.Y.; dos Santos, W.N.; Gregorio, R., Jr. Determination of thermal properties of pyroelectric polymers, copolymers and blends by the laser flash technique. Polym. Test. 2007, 26, 788–792. [Google Scholar] [CrossRef]
- Magazù, S.; Migliardo, F.; Gonzalez, M.A.; Mondelli, C.; Parker, S.F.; Vértessy, B.G. Molecular mechanisms of survival strategies in extreme conditions. Life 2012, 2, 364–376. [Google Scholar] [CrossRef]
- Bukowski, R.; Szalewicz, K.; Groenenboom, G.C.; van der Avoird, A. Predictions of the properties of water from first principles. Science 2007, 315, 1249–1252. [Google Scholar] [CrossRef]
- Cesaro, A.; Magazu, S.; Migliardo, F.; Sussich, F.; Vadalà, M. Comparative study of structural properties of trehalose water solutions by neutron diffraction, synchrotron radiation and simulation. Physica B 2004, 350, E367–E370. [Google Scholar] [CrossRef]
- Magazu, S.; Migliardo, F.; Ramirez-Cuesta, A.J. Changes in vibrational modes of water and bioprotectants in solution. Biophys. Chem. 2007, 125, 138–142. [Google Scholar] [CrossRef]
- Uchida, T.; Nagayama, M.; Shibayama, T.; Gohara, K. Morphological investigations of disaccharide molecules for growth inhibition of ice crystals. J. Cryst. Growth. 2007, 299, 125–135. [Google Scholar] [CrossRef]
- Blazhnov, I.V.; Magazù, S.; Maisano, G.; Malomuzh, N.P.; Migliardo, F. Macro- and microdefinitions of fragility of hydrogen-bonded glass-forming liquids. Phys. Rev. E 2006, 73, 031201. [Google Scholar] [CrossRef]
- Magazu, S.; Migliardo, F.; Telling, M.T.F. Study of the dynamical properties of water in disaccharide solutions. Eur. Biophys. J. 2007, 36, 163–171. [Google Scholar] [CrossRef]
- Errington, J.R.; Debenedetti, P.G. Relationship between structural order and the anomalies of liquid water. Nature 2001, 409, 318–321. [Google Scholar] [CrossRef]
- Magazu, S.; Migliardo, F.; Telling, M.T.F. alpha,alpha-Trehalose-water solutions. VIII. Study of the diffusive dynamics of water by high-resolution quasi elastic neutron scattering. J. Phys. Chem. B 2006, 110, 1020–1025. [Google Scholar] [CrossRef]
- Magazu, S.; Migliardo, F.; Mondelli, C.; Vadalà, M. Correlation between bioprotective effectiveness and dynamic properties of trehalose-water, maltose-water and sucrose-water mixtures. Carbohydr. Res. 2005, 340, 2796–2801. [Google Scholar] [CrossRef]
- Mahoney, M.W.; Jorgensen, W.L. Quantum, intramolecular flexibility, and polarizability effects on the reproduction of the density anomaly of liquid water by simple potential functions. J. Chem. Phys. 2001, 115, 10758. [Google Scholar] [CrossRef]
- Branca, C.; Maccarrone, S.; Magazu, S.; Maisano, G.; Bennington, S.M.; Taylor, J. Tetrahedral order in homologous disaccharide-water mixtures. J. Chem. Phys. 2005, 122, 174513. [Google Scholar] [CrossRef]
- Stone, A.J. Water from first principles. Science 2007, 315, 1228–1229. [Google Scholar] [CrossRef] [PubMed]
- Caccamo, M.T.; Magazù, S. Intramolecular OH stretching analysis of hydrated lysozyme in presence of trehalose by IR spectroscopy. Atti Accad. Pelorit. Pericol. Cl. Sci. Fisiche Mat. Nat. 2019, 97, A2. [Google Scholar] [CrossRef]
- Gerstein, M.; Levitt, M. Simulating water and the molecules of life. Sci. Am. 1998, 279, 100–105. [Google Scholar] [CrossRef] [PubMed]
- Rahman, A.; Stillinger, F. Molecular dynamics study of liquid water. J. Chem. Phys. 1971, 55, 3336–3359. [Google Scholar] [CrossRef]
- Sharp, K. Water: Structure and properties. Encycl. Life Sci. 2001, 1–7. [Google Scholar] [CrossRef]
- Liu, J.H.; Xiao, Z.; John, Z.H. Structure of liquid water—A dynamical mixture of tetrahedral and ‘ring-and-chain’ like structures. Phys. Chem. Chem. Phys. 2017, 19, 11931–11936. [Google Scholar] [CrossRef]
- Cipcigan, F.S.; Sokhan, V.P.; Jones, A.P.; Crain, J.; Martyna, G.J. Hydrogen bonding and molecular orientation at the liquid-vapour interface of water. Phys. Chem. Chem. Phys. 2015, 17, 8660–8669. [Google Scholar] [CrossRef]
- Soper, A.K. The radial distribution functions of water as derived from radiation total scattering experiments: Is there anything we can say for sure? ISRN Phys. Chem. 2013, 2013, 279463. [Google Scholar] [CrossRef]
- Stillinger, F.H.; Rahman, A. Improved simulation of liquid water by molecular dynamics. J. Chem. Phys. 1974, 60, 1545–1557. [Google Scholar] [CrossRef]
- Magazu, S.; Migliardo, F.; Ramirez-Cuesta, A.J. Inelastic neutron scattering study on bioprotectant systems. J. Royal Soc. Interface 2005, 2, 527–532. [Google Scholar] [CrossRef]
- Magazu, S.; Migliardo, F.; Telling, M.T.F. Structural and dynamical properties of water in sugar mixtures. Food Chem. 2008, 106, 1460–1466. [Google Scholar] [CrossRef]
- Magazù, S.; Migliardo, F.; Caccamo, M.T. Innovative wavelet protocols in analyzing elastic incoherent neutron scattering. J. Phys. Chem. B 2012, 116, 9417–9423. [Google Scholar] [CrossRef]
- Sweldens, W. The lifting scheme: A construction of second generation wavelets. SIAM J. Math. Anal. 1998, 29, 511–546. [Google Scholar] [CrossRef]
- Magazù, S.; Migliardo, F.; Vertessy, B.G.; Caccamo, M.T. Investigations of homologous disaccharides by elastic incoherent neutron scattering and wavelet multiresolution analysis. Chem. Phys. 2013, 424, 56–61. [Google Scholar] [CrossRef]
- Machado, J.A.; Costa, A.C.; Quelhas, M.D. Wavelet analysis of human DNA. Genomics 2011, 98, 155–163. [Google Scholar] [CrossRef]
- Migliardo, F.; Caccamo, M.T.; Magazù, S. Elastic incoherent neutron scatterings wavevector and thermal analysis on glass-forming homologous disaccharides. J. Non Crys. Solids 2013, 378, 144–151. [Google Scholar] [CrossRef]
- Benson, N.C.; Daggett, V. Wavelet analysis of protein motion. Int. J. Wavel. Multiresolut. Inf. Process 2012, 10, 1250040. [Google Scholar] [CrossRef]
- Caccamo, M.T.; Magazù, S. Variable mass pendulum behaviour processed by wavelet analysis. Eur. J. Phys. 2017, 38, 015804. [Google Scholar] [CrossRef]
- Liu, J.; Moulin, P. Information-theoretic analysis of interscale and intrascale dependencies between image wavelet coefficients. IEEE Trans. Image Process 2001, 10, 1647–1658. [Google Scholar]
- Caccamo, M.T.; Magazù, S. Variable length pendulum analyzed by a comparative fourier and wavelet approach. Rev. Mex. Fisica E 2018, 64, 81–86. [Google Scholar]
- Magazù, S.; Caccamo, M.T. Wavelets approach in physics education. In Wavelets: Principles, Analysis and Applications; Nova Science Publishers, Inc.: Hauppauge, NY, USA, 2018; pp. 1–20. [Google Scholar]
- Lio, P. Wavelets in bioinformatics and computational biology: State of art and perspectives. Bioinformatics 2003, 19, 2–9. [Google Scholar] [CrossRef] [PubMed]
- Colombo, F.; Caccamo, M.T.; Magazù, S. Wavelet analysis as a tool for characterizing trends in climatic data. In Wavelets: Principles, Analysis and Applications; Nova Science Publishers, Inc.: Hauppauge, NY, USA, 2018; pp. 55–76. [Google Scholar]
- Hsua, W.Y.; Lin, C.C.; Ju, M.S.; Suna, Y.N. Wavelet-based fractal features with active segment selection: Application to single-trial EEG data. J. Neur. Methods 2007, 163, 145–160. [Google Scholar] [CrossRef] [PubMed]
- Caccamo, M.T.; Magazù, S. Applications of wavelet analyses on spectroscopic experiments. In Wavelets: Principles, Analysis and Applications; Nova Science Publishers, Inc.: Hauppauge, NY, USA, 2018; pp. 77–90. [Google Scholar]
- Torrence, C.; Compo, G.P. A Practical Guide to Wavelet Analysis. Bull. Am. Meteorol. Soc. 1998, 79, 61–78. [Google Scholar] [CrossRef]
- Martin, R.L.; Gardiner, E.J.; Senger, S.; Gillet, V.J. Compression of molecular interaction fields using wavelet thumbnails: Application to molecular alignment. J. Chem. Inf. Model. 2012, 52, 757–769. [Google Scholar] [CrossRef]
- Otsuka, T.; Nakai, H. Wavelet transform analysis of ab initio molecular dynamics simulation: Application to core-excitation dynamics of BF3. J. Comput. Chem. 2007, 28, 1137–1144. [Google Scholar] [CrossRef]
- Caccamo, M.T.; Magazù, S. EG-PEG mixtures: IR spectra wavelet cross-correlation analysis. Appl. Spectrosc. 2017, 71, 401–409. [Google Scholar] [CrossRef]
- Caccamo, M.T.; Magazù, S. Multiscaling wavelet analysis of infrared and raman data on polyethylene glycol 1000 aqueous solutions. Spectrosc. Lett. 2017, 50, 130–136. [Google Scholar] [CrossRef]
- Li, H.; Nozaki, T. Wavelet cross-correlation analysis and its application to a plane turbulent jet. JSME Int. J. Ser. B 1997, 40, 58–66. [Google Scholar] [CrossRef]
- Caccamo, M.T.; Cannuli, A.; Magazù, S. Wavelet analysis of near-resonant series RLC circuit with time-dependent forcing frequency. Eur. J. Phys. 2018, 39, aaae77. [Google Scholar] [CrossRef]
- Grinsted, A.; Moore, J.C.; Jevrejeva, S. Application of the cross wavelet transform and wavelet coherence to geophysical time series. Nonlin. Processes Geophys. 2004, 11, 561–566. [Google Scholar] [CrossRef]
- Caccamo, M.T.; Magazù, S. A Conic Pendulum of Variable Length Analysed by wavelets. In New Trends in Physics Education Research; Nova Science Publishers, Inc.: Hauppauge, NY, USA, 2018; pp. 117–131. ISBN 978-1-53613-893-1. [Google Scholar]
- Veleda, D.; Montagne, R.; Araujo, M. Cross-wavelet bias corrected by normalizing scales. J. Atmos. Ocean. Technol. 2012, 29, 1401–1408. [Google Scholar] [CrossRef]
- Razdan, A. Wavelet correlation coefficient of ‘strongly correlated’ financial time series. Physica A 2004, 333, 335–342. [Google Scholar] [CrossRef]
- Brito, A.A.; Rodrigues Santos, F.; de Castro, A.P.N.; da Cunha Lima, A.T.; Zebende, G.F.; da Cunha Lima, I.C. Cross-correlation in a turbulent flow: Analysis of the velocity field using the ρDCCA coefficient. EPL 2018, 123, 20011. [Google Scholar] [CrossRef]
- Magazù, S.; Caccamo, M.T. Fourier and wavelet analyses of climate data. In New Trends in Physics Education Research; Nova Science Publishers, Inc.: Hauppauge, NY, USA, 2018; pp. 226–241. ISBN 978-1-53613-893-1. [Google Scholar]
- Caccamo, M.T.; Magazù, S. Tagging the oligomer-to-polymer crossover on EG and PEGs by infrared and Raman spectroscopies and by wavelet cross-correlation spectral analysis. Vib. Spectr. 2016, 85, 222–227. [Google Scholar] [CrossRef]
- Migliardo, F.; Caccamo, M.T.; Magazù, S. Thermal analysis on bioprotectant disaccharides by elastic incoherent neutron scattering. Food Biophys. 2014, 9, 99–104. [Google Scholar] [CrossRef]
- Caccamo, M.T.; Magazù, S. Thermal restraint on PEG-EG mixtures by FTIR investigations and wavelet cross-correlation analysis. Polym. Test. 2017, 62, 311–318. [Google Scholar] [CrossRef]
- Cannuli, A.; Caccamo, M.T.; Castorina, G.; Colombo, F.; Magazù, S. Laser techniques on acoustically levitated droplets. EPJ Web Conf. 2018, 167, 05010. [Google Scholar] [CrossRef][Green Version]
- Magazù, S.; Calabrò, E.; Caccamo, M.T. Experimental study of thermal restraint in bio-protectant disaccharides by FTIR spectroscopy. Open Biotechnol. 2018, 12, 123–133. [Google Scholar] [CrossRef]
- Caccamo, M.T.; Zammuto, V.; Gugliandolo, C.; Madeleine-Perdrillat, C.; Spanò, A.; Magazù, S. Thermal restraint of a bacterial exopolysaccharide of shallow vent origin. Int. J. Biol. Macromol. 2018, 114, 649–655. [Google Scholar] [CrossRef]
- Caccamo, M.T.; Gugliandolo, C.; Zammuto, V.; Magazù, S. Thermal properties of an exopolysaccharide produced by a marine thermotolerant Bacillus licheniformis by ATR-FTIR spectroscopy. Int. J. Biol. Macromol. 2020, 145, 77–83. [Google Scholar] [CrossRef]
- Ritz, M.; Vaculíkovác, L.; Kupkováe, J.; Plevovác, E.; Bartonová, L. Different level of fluorescence in Raman spectra of montmorillonites. Vib. Spectr. 2016, 84, 7–15. [Google Scholar] [CrossRef]


| Mineral | Specific Surface (m2 g−1) | C.E.C. (meq/100 g) |
|---|---|---|
| kaolinite | 10 ÷ 20 | 3 ÷ 10 |
| illite | 80 ÷ 100 | 20 ÷ 30 |
| montmorillonite | 250 ÷ 800 | 80 ÷ 120 |
| chlorite | 80 | 20 ÷ 30 |
| Property Name | Specific Surface (m2/g) |
|---|---|
| Density | 2–3 g/cm3 (measured) |
| Molecular weight | 36,031 g/mol |
| Crystal system | Monoclinic |
| Hardness | 1–2 on Mohs scale |
| Transparency | Translucent |
| Color | White, green, yellow, pink, red |
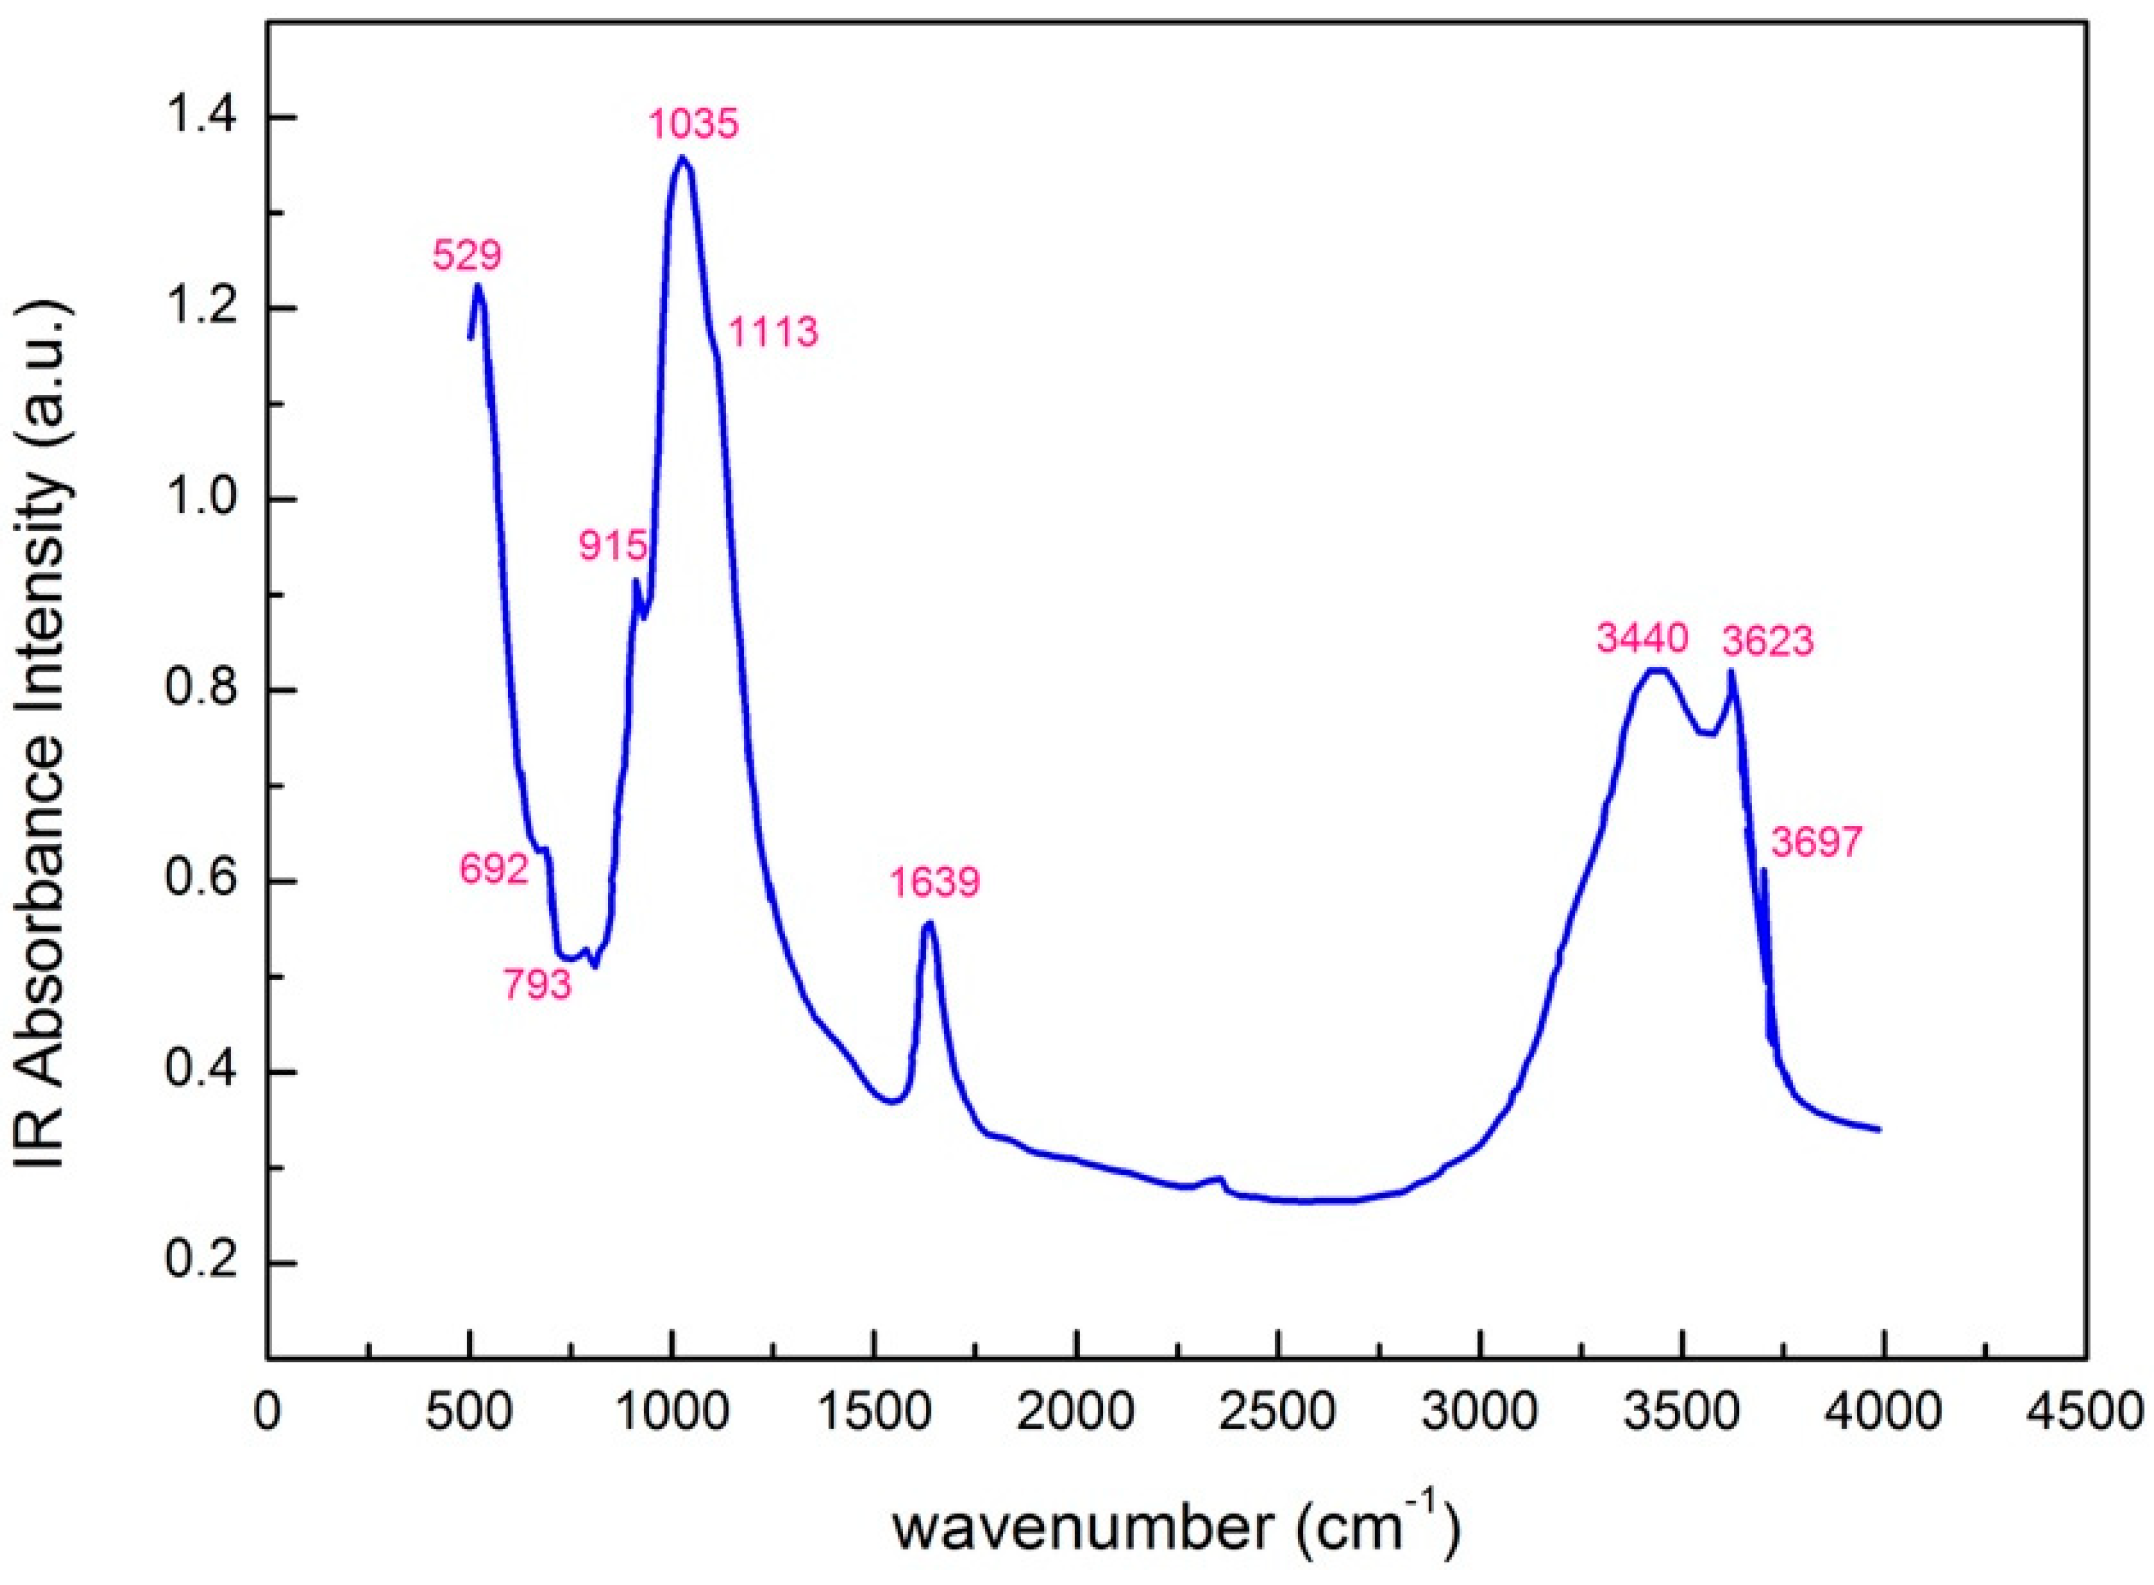
| Wavenumber (cm−1) | Assignments |
|---|---|
| 3697 | O–H stretching |
| 3623 | O–H stretching |
| 3440 | O–H stretching, hydration |
| 1639 | O–H bending, hydration |
| 1113 | Si–O stretching, out-of-plane |
| 1035 | Si−O stretching, in-plane |
| 915 | AlAlOH bending |
| 793 | Tridymite (platy forms) |
| 692 | SiO2 (Quartz) |
| 529 | Si–O bending |
| 3620 cm−1 | υ(OH) structural OH groups |
| 1110 cm−1 | υ(SiO) asymmetric mode of SiO4 tetrahedron |
| 915 cm−1 | δ(OH) bonded with octahedral cations; AlOH; wagging mode |
| 840 cm−1 | δ(OH) bonded with octahedral cations; MgAlOH; wagging mode |
| 785 cm−1 | δ(OH) bonded with octahedral cations; AlOH; wagging mode |
| 710 cm−1 | δ(SiO) symmetric mode (A1) of SiO4 tetrahedron |
| 430 cm−1 | δ(OH) libration of OH |
© 2020 by the authors. Licensee MDPI, Basel, Switzerland. This article is an open access article distributed under the terms and conditions of the Creative Commons Attribution (CC BY) license (http://creativecommons.org/licenses/by/4.0/).
Share and Cite
Caccamo, M.T.; Mavilia, G.; Mavilia, L.; Lombardo, D.; Magazù, S. Self-Assembly Processes in Hydrated Montmorillonite by FTIR Investigations. Materials 2020, 13, 1100. https://doi.org/10.3390/ma13051100
Caccamo MT, Mavilia G, Mavilia L, Lombardo D, Magazù S. Self-Assembly Processes in Hydrated Montmorillonite by FTIR Investigations. Materials. 2020; 13(5):1100. https://doi.org/10.3390/ma13051100
Chicago/Turabian StyleCaccamo, Maria Teresa, Giuseppe Mavilia, Letterio Mavilia, Domenico Lombardo, and Salvatore Magazù. 2020. "Self-Assembly Processes in Hydrated Montmorillonite by FTIR Investigations" Materials 13, no. 5: 1100. https://doi.org/10.3390/ma13051100
APA StyleCaccamo, M. T., Mavilia, G., Mavilia, L., Lombardo, D., & Magazù, S. (2020). Self-Assembly Processes in Hydrated Montmorillonite by FTIR Investigations. Materials, 13(5), 1100. https://doi.org/10.3390/ma13051100