Synthesis of Fe/Mg-Biochar Nanocomposites for Phosphate Removal

Abstract
1. Introduction
2. Materials and Methods
2.1. Materials
2.2. Synthesis of WBC and WBC1x
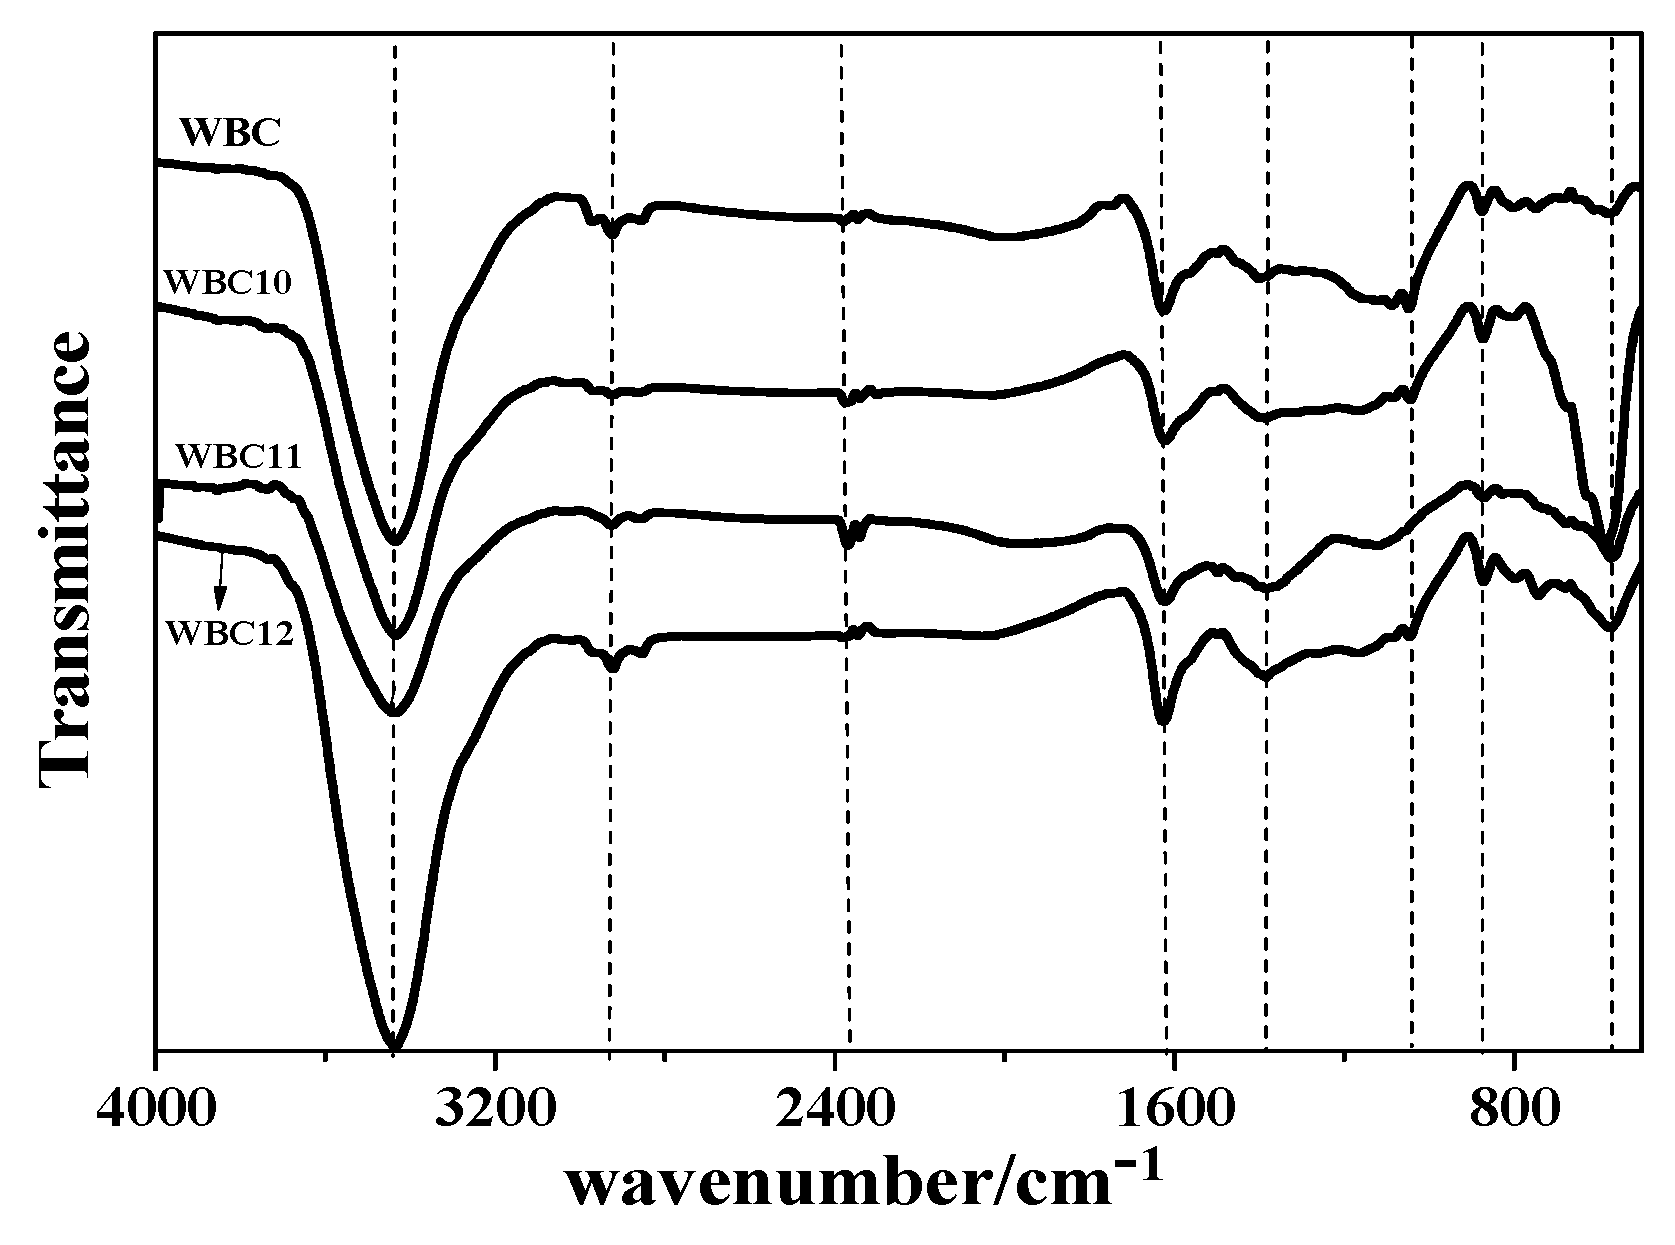
2.3. WBC and WBC1x Characterization
2.4. Batch Experiment
- (1)
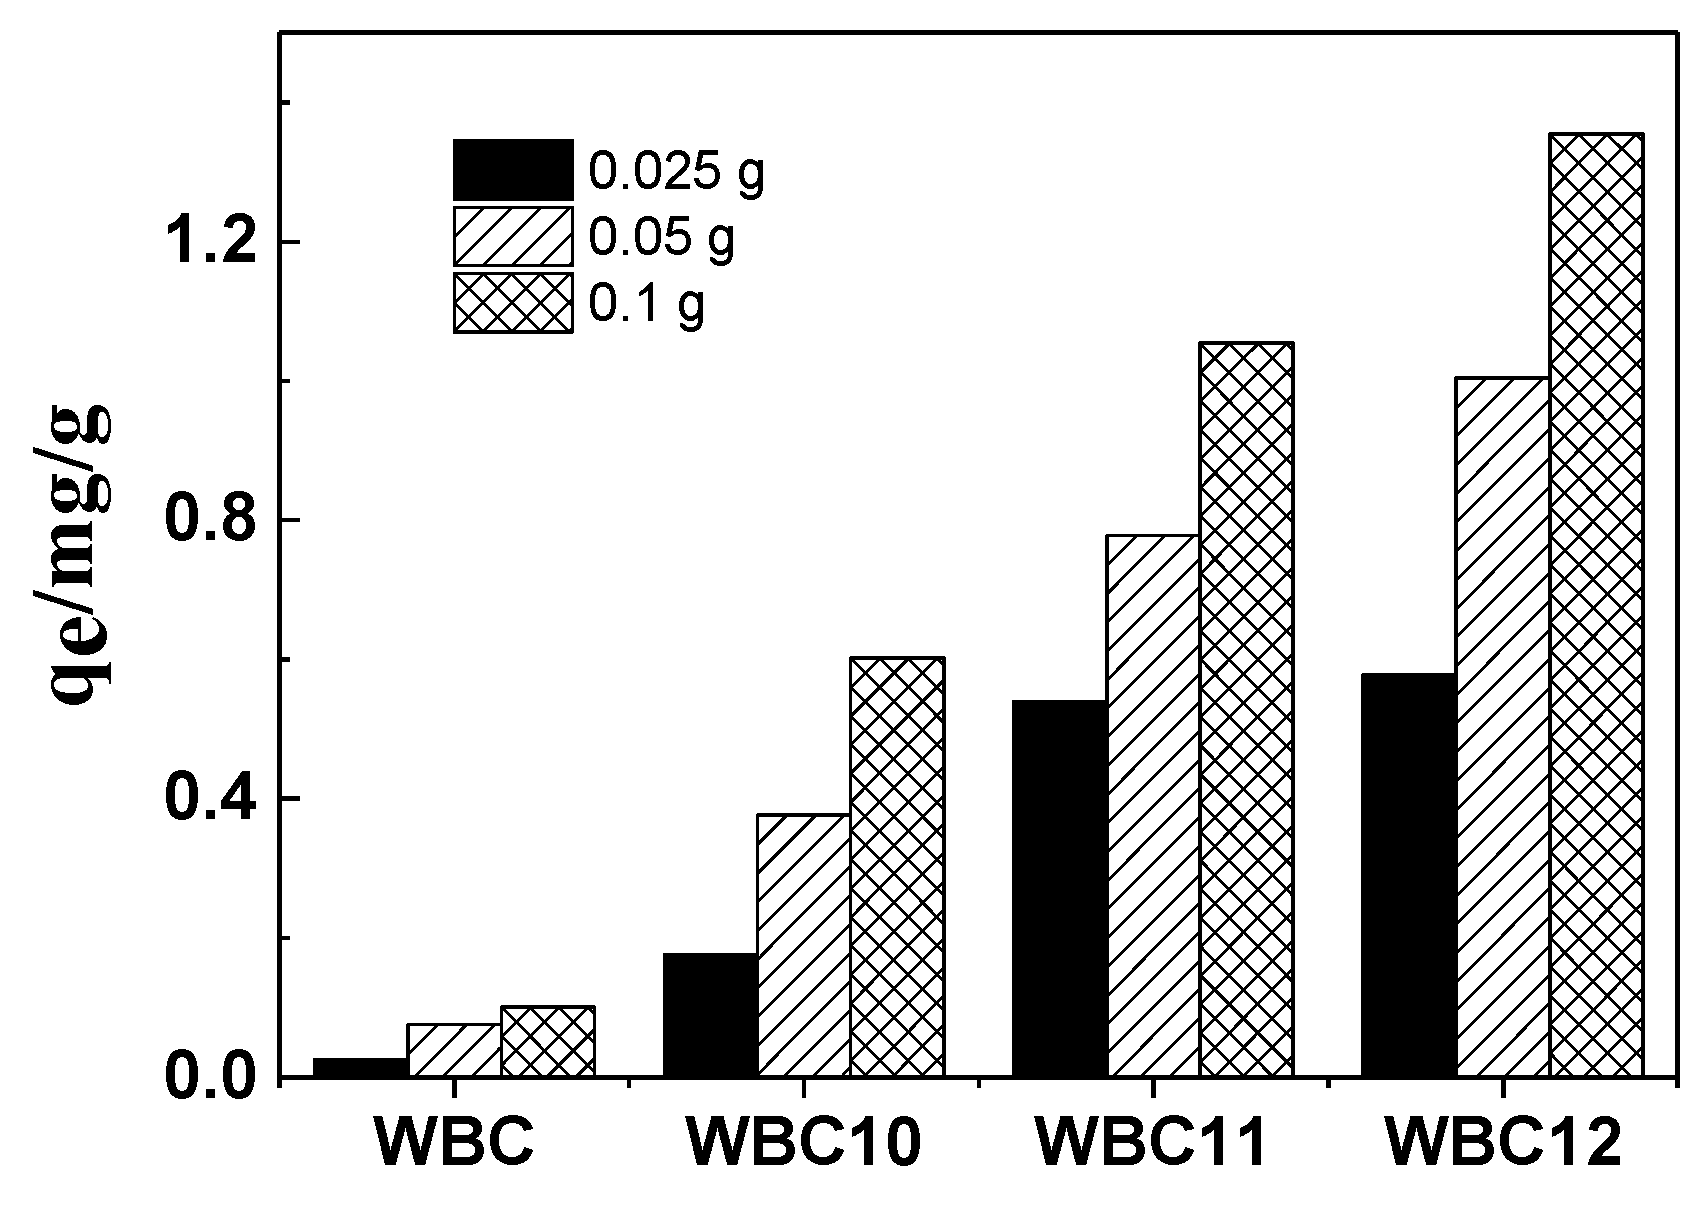
- To investigate the effect of adsorbent amounts on phosphate adsorption, 0.025, 0.050 and 0.100 g of WBC and WBC1x were added to 25 mL phosphate stock solution in a 50 mL beaker, respectively. The beakers were sealed in plastic wrap and shaken in a temperature-controlled gas bath at 120 rpm and 30 °C, and samples were taken at a preset time;
- (2)
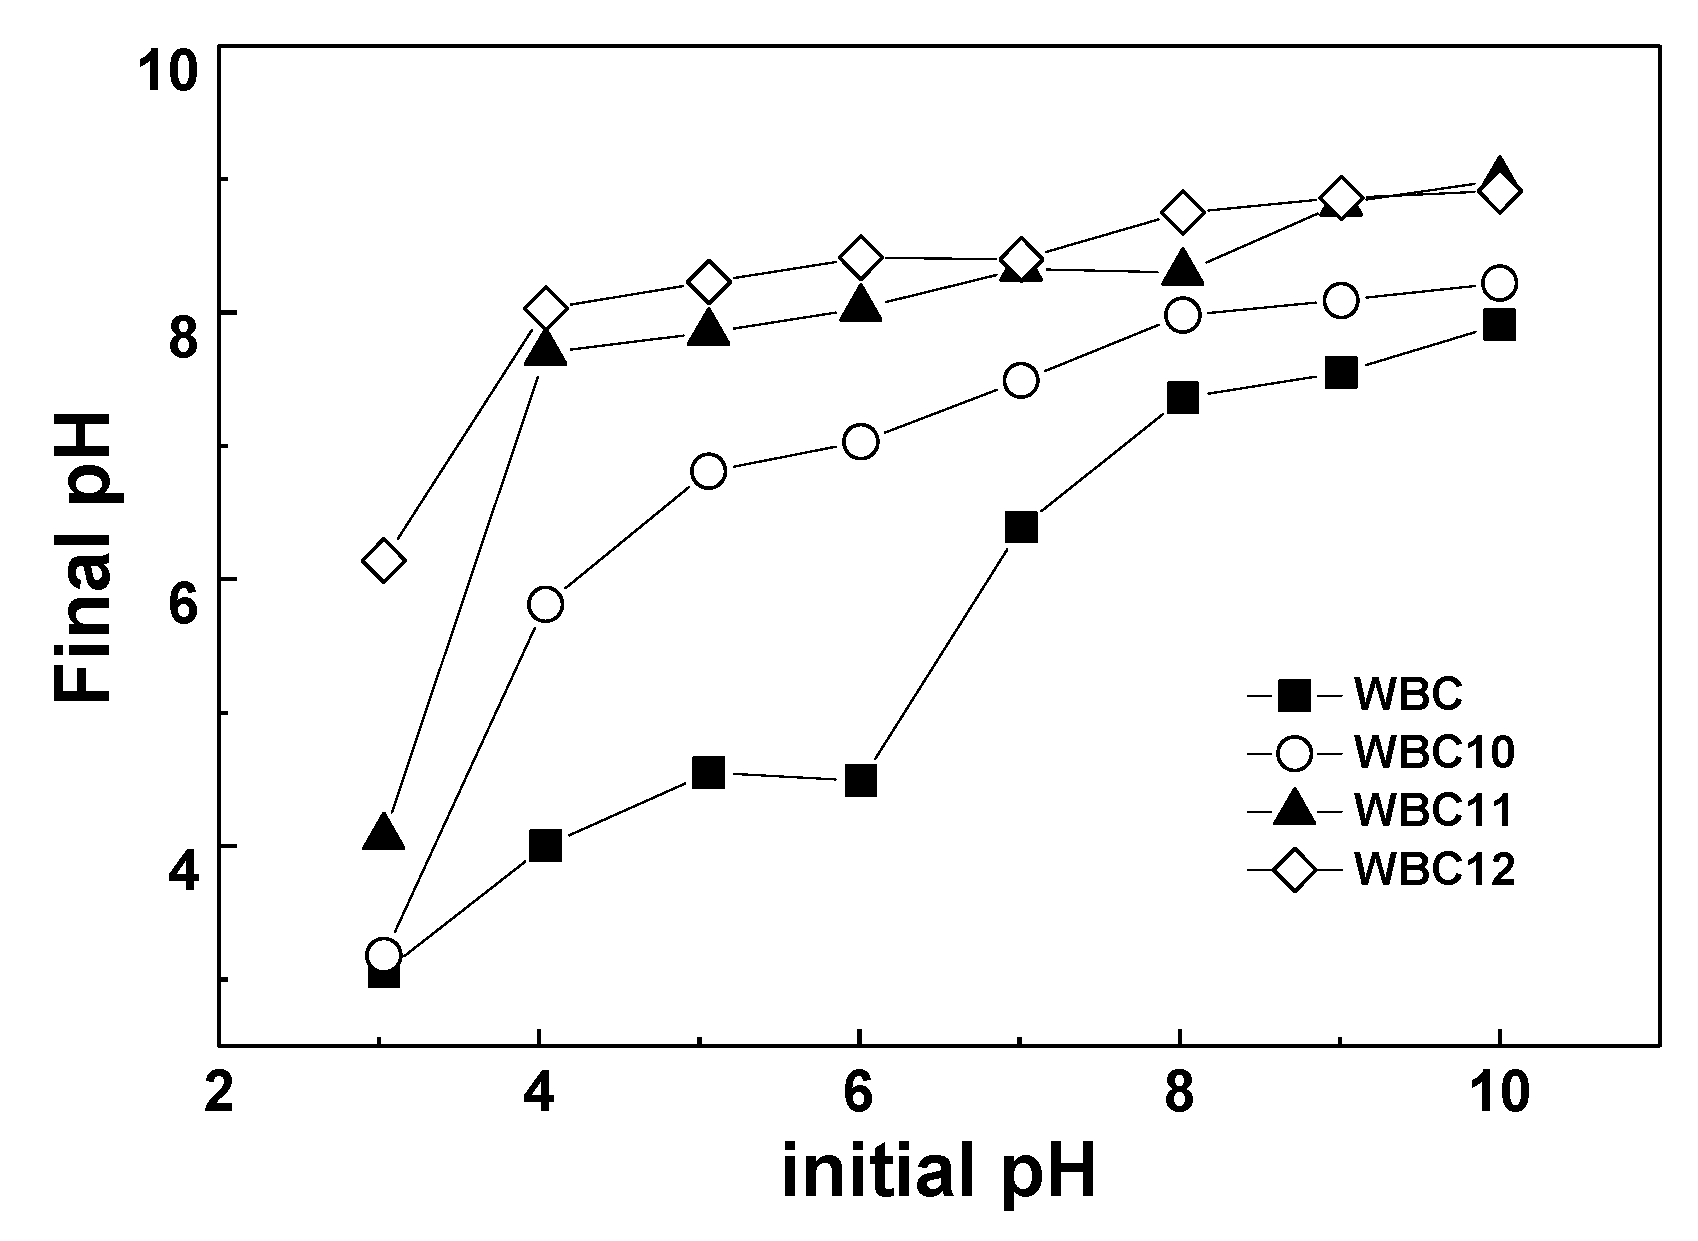
- To study the effect of pH, the pH of the KH2PO4 solution was adjusted in a range between 3 and 10 by using 1.00 mol/L NaOH or 1.00 mol/L HNO3 0.05 g WBC1x was added to 25 mL adjusted phosphate solution in a 50 mL beaker, respectively. The beakers were sealed in plastic wrap and shaken in a temperature-controlled gas bath at 120 rpm and 30 °C, and samples were taken at preset time;
- (3)
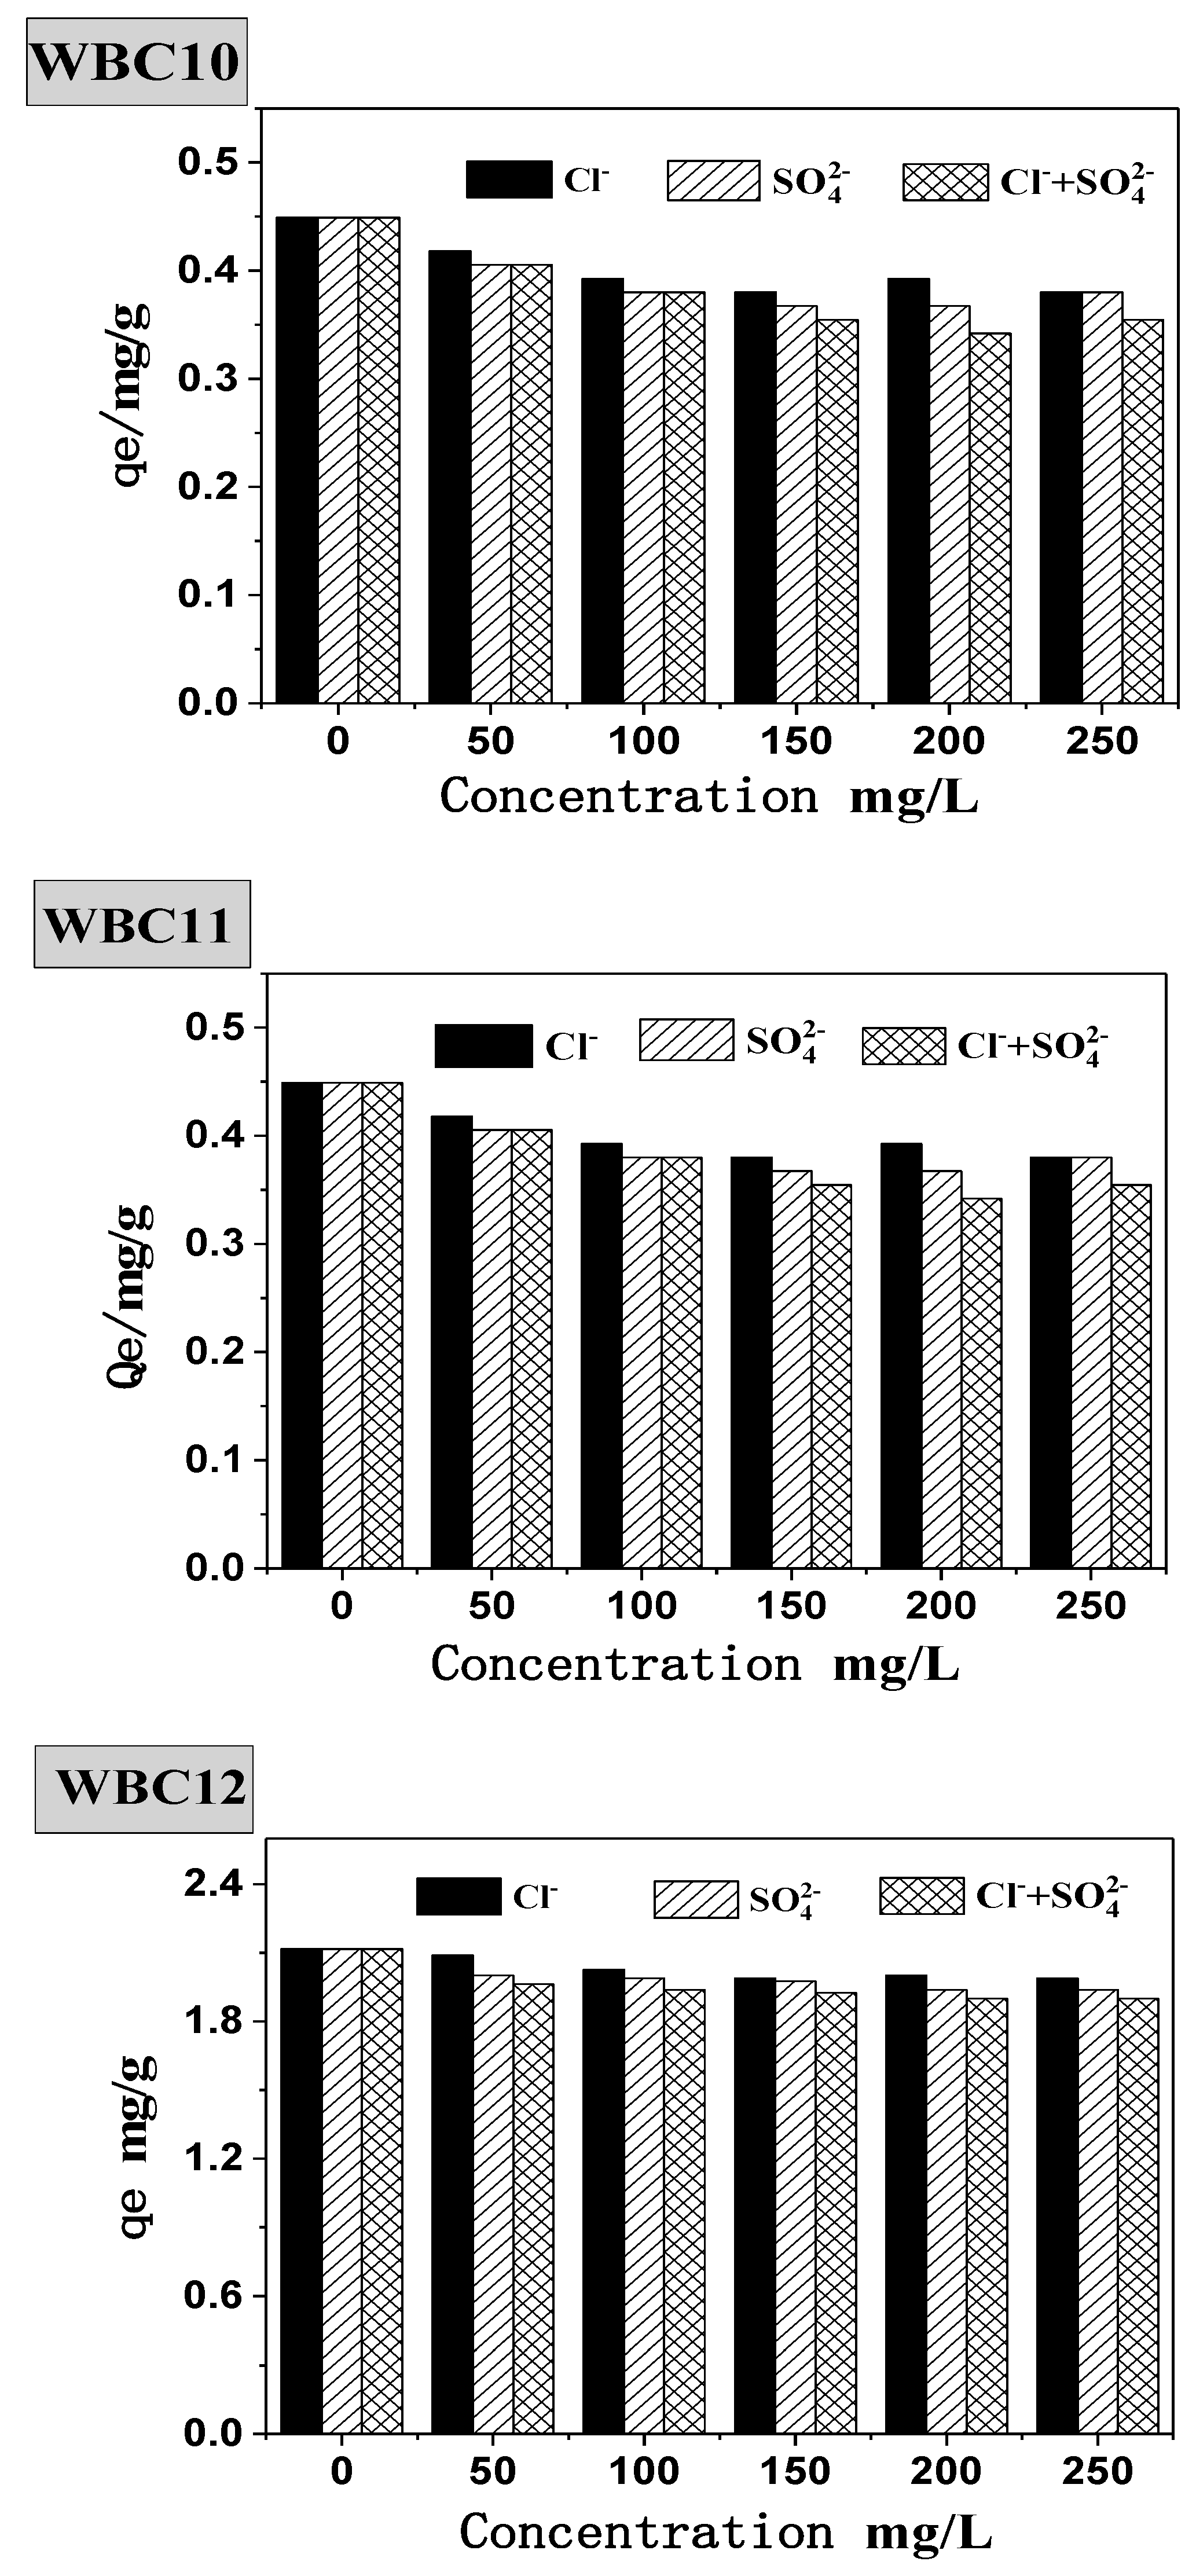
- To investigate the effect of anions (Cl−, SO42− and Cl− + SO42−), mixing a series of effective concentrations of anions (50, 100, 150, 200 and 250 mg/L) with 50 mg/L of KH2PO4. Then, 0.05 g WBC1x was added to 25 mL adjusted phosphate solution in a 50 mL beaker, respectively. The beakers were sealed in plastic wrap and shaken in a temperature-controlled gas bath at 120 rpm and 30 °C, and samples were taken at preset time;
- (4)
- In the batch sorption experiments, 0.05 g WBC, WBC10, WBC11, and WBC20 were added to 25 mL phosphate stock solution in a 50 mL beaker, respectively. The beakers were sealed in plastic wrap and shaken in a temperature-controlled gas bath at 120 rpm and 30 °C, and samples were taken at preset time;
- (5)
- n the isothermal adsorption experiments, 0.05 g of WBC, WBC10, WBC11, and WBC20 were added to 25 mL KH2PO4 solution with a concentration ranging from 5 to 400 mg·L−1, in a 50 mL beaker, respectively. The beakers were sealed in plastic wrap and shaken in a temperature-controlled gas bath at 120 rpm and 30 °C for 12 h, and samples were taken at preset time.
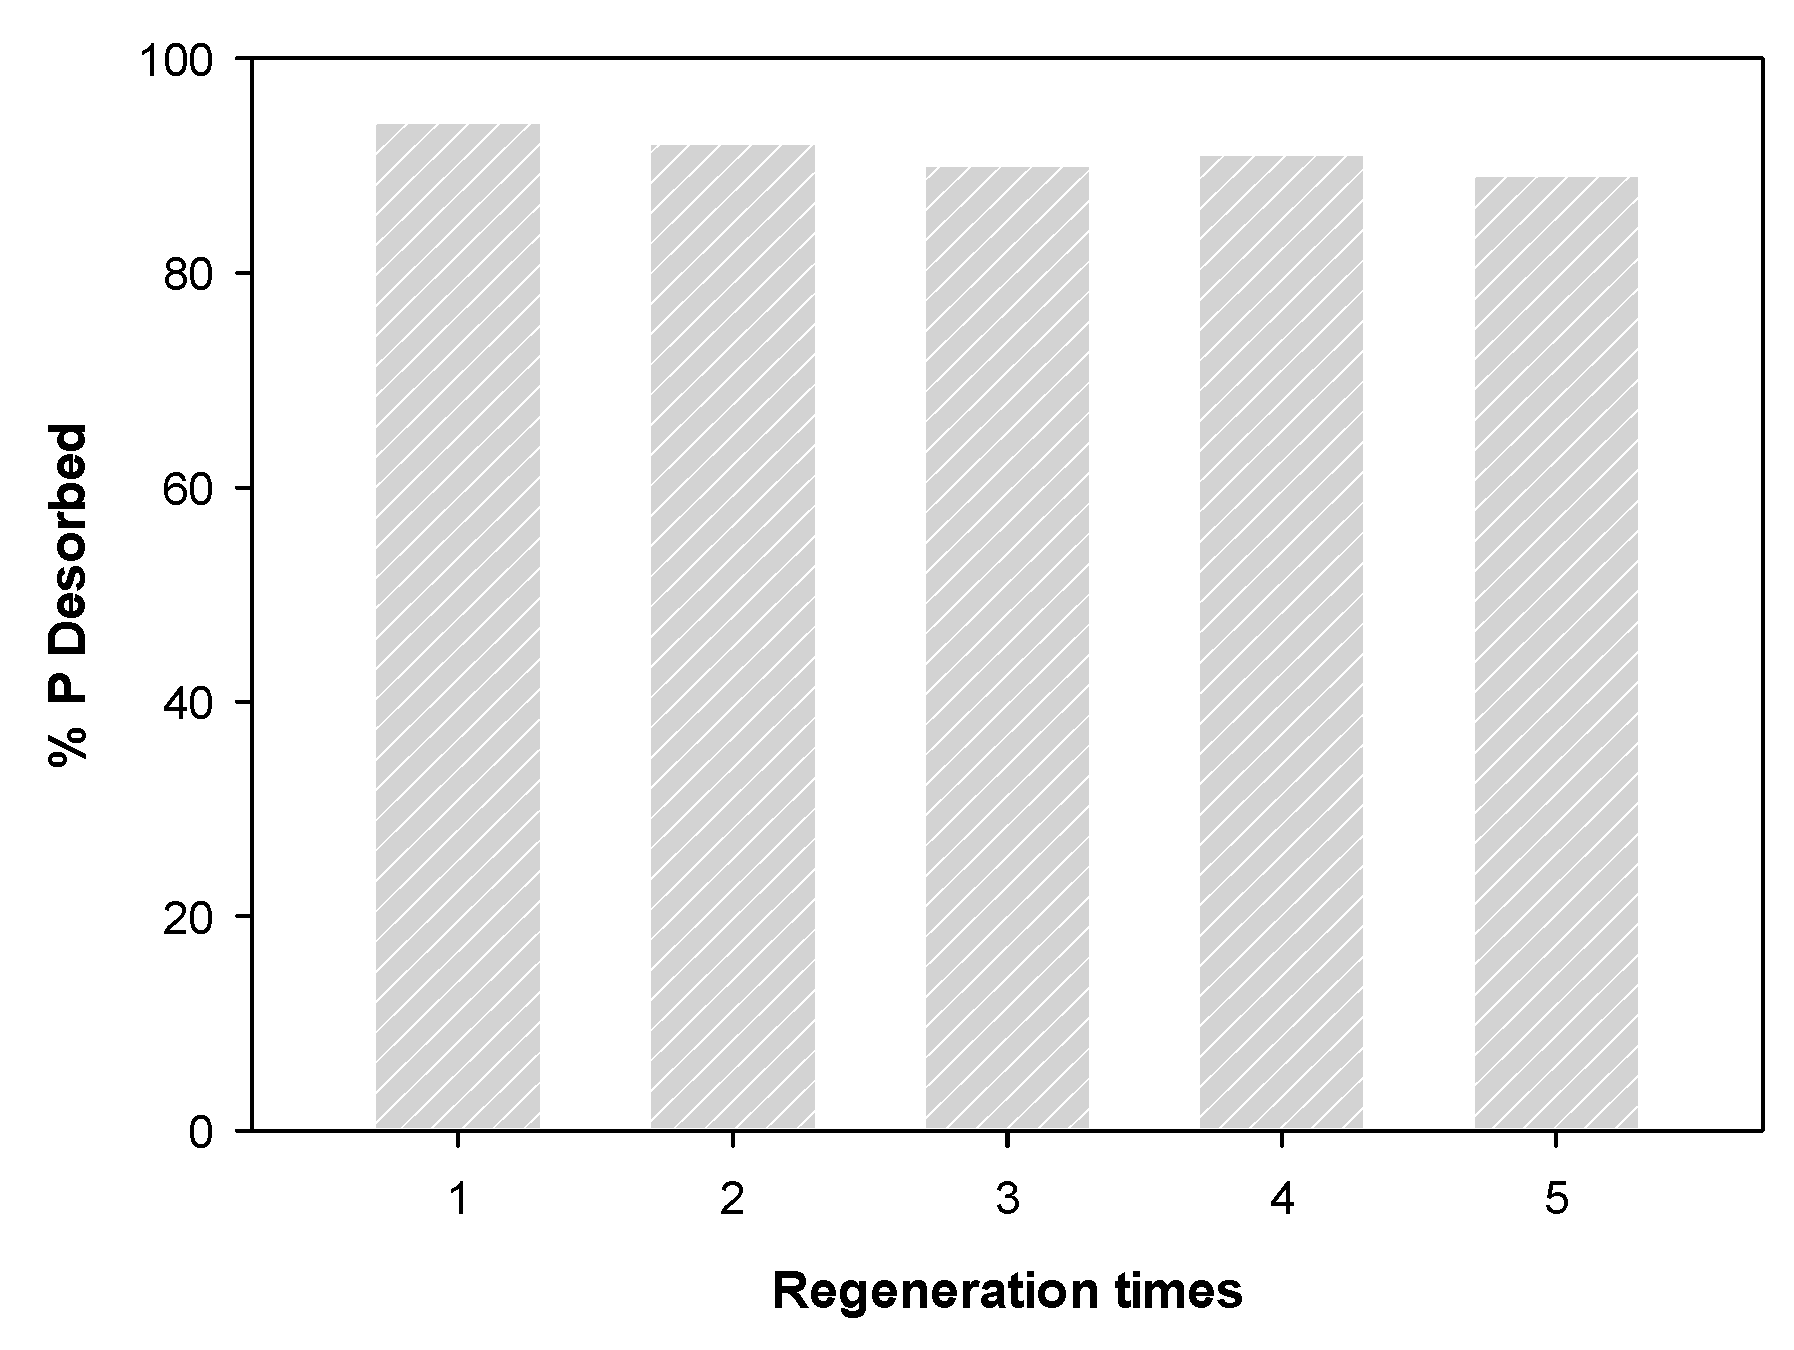
2.5. Regeneration of Spent WBC1x
2.6. Analysis of Phosphate
3. Results and Discussion
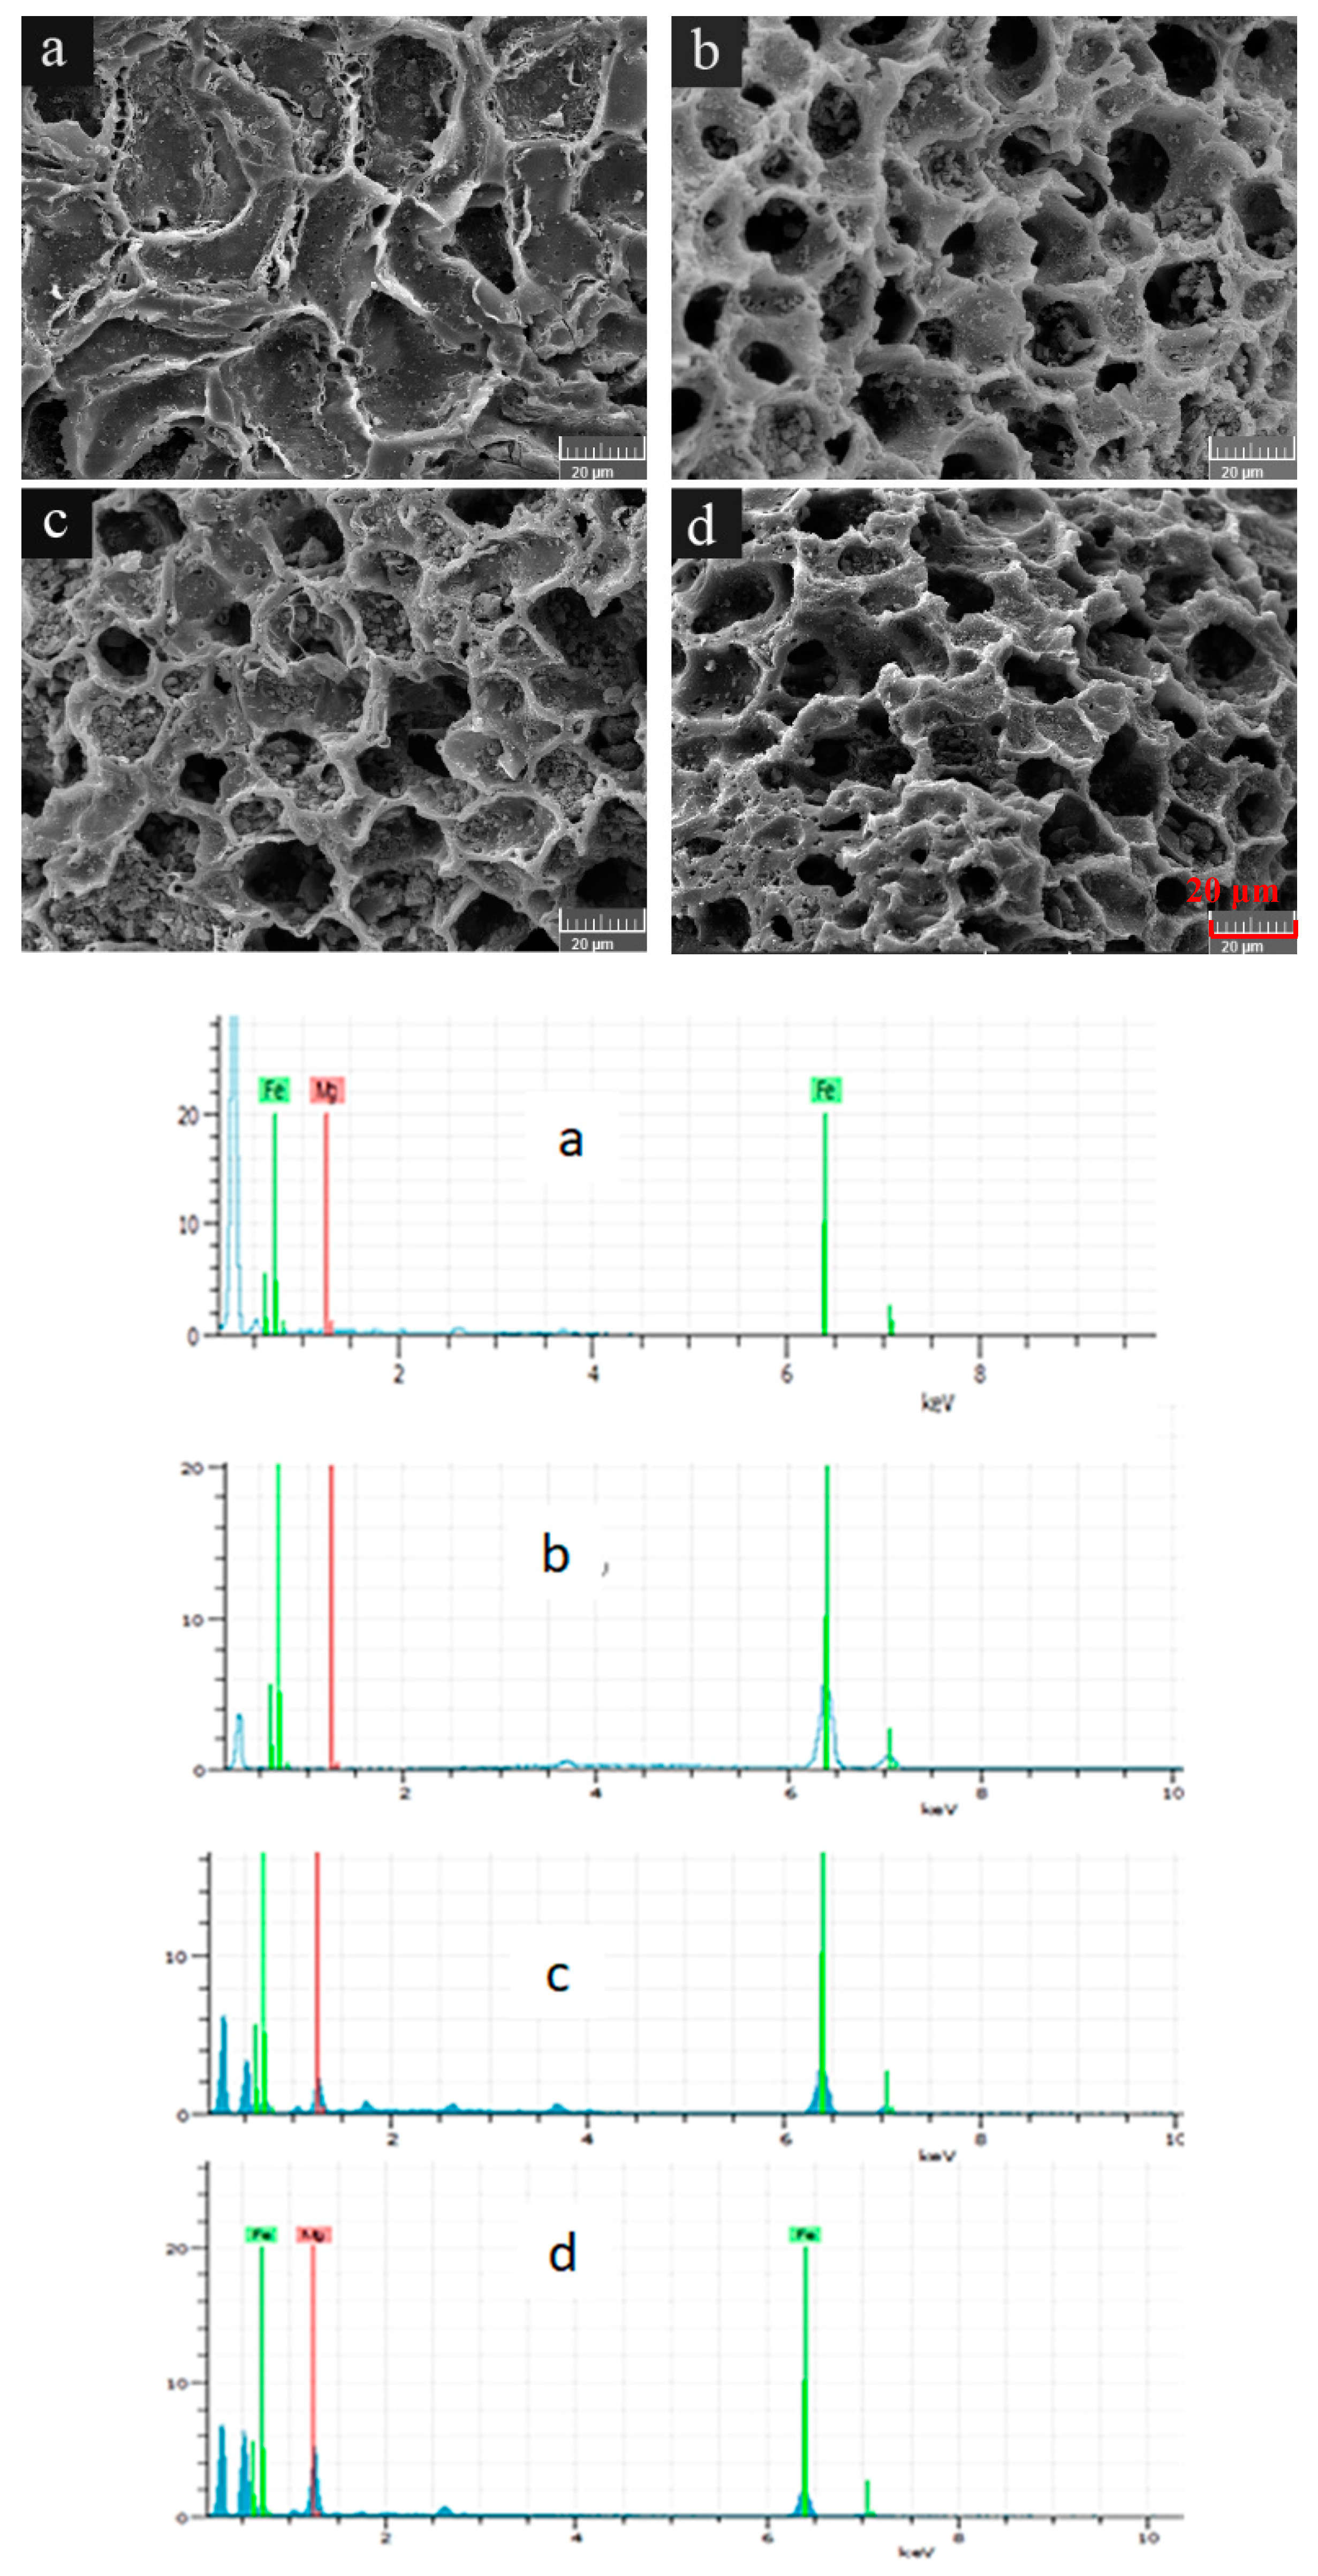
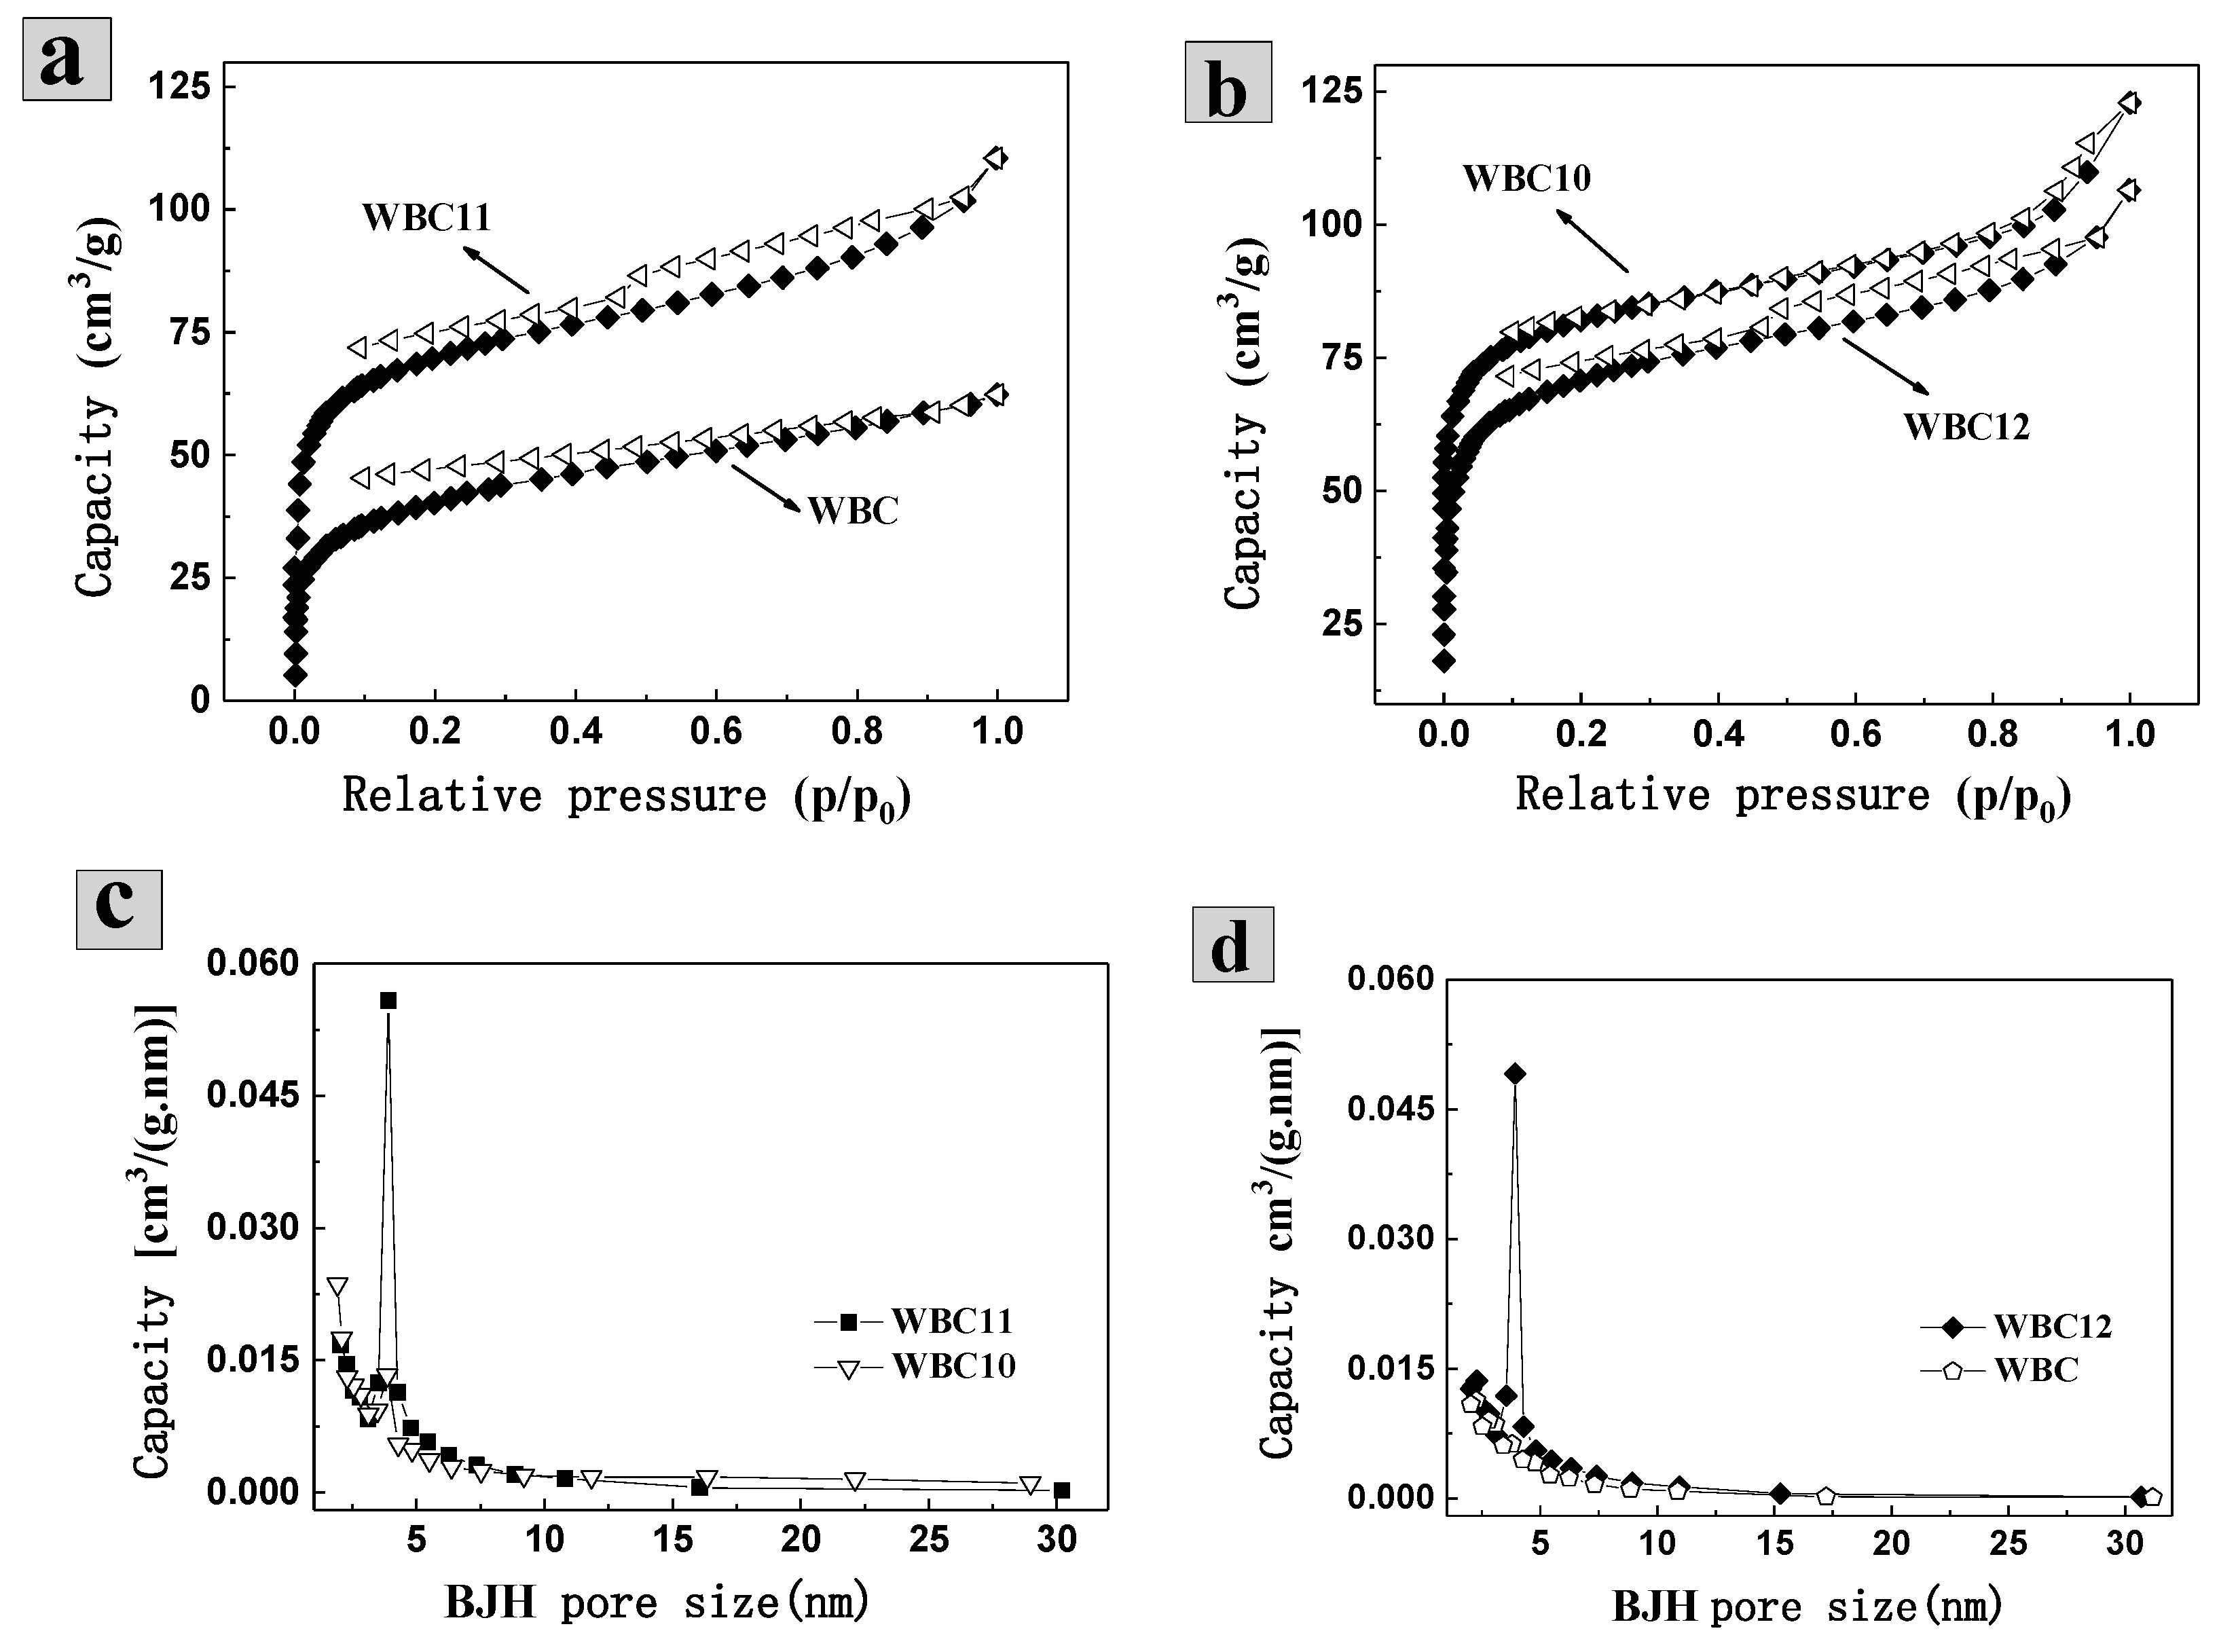
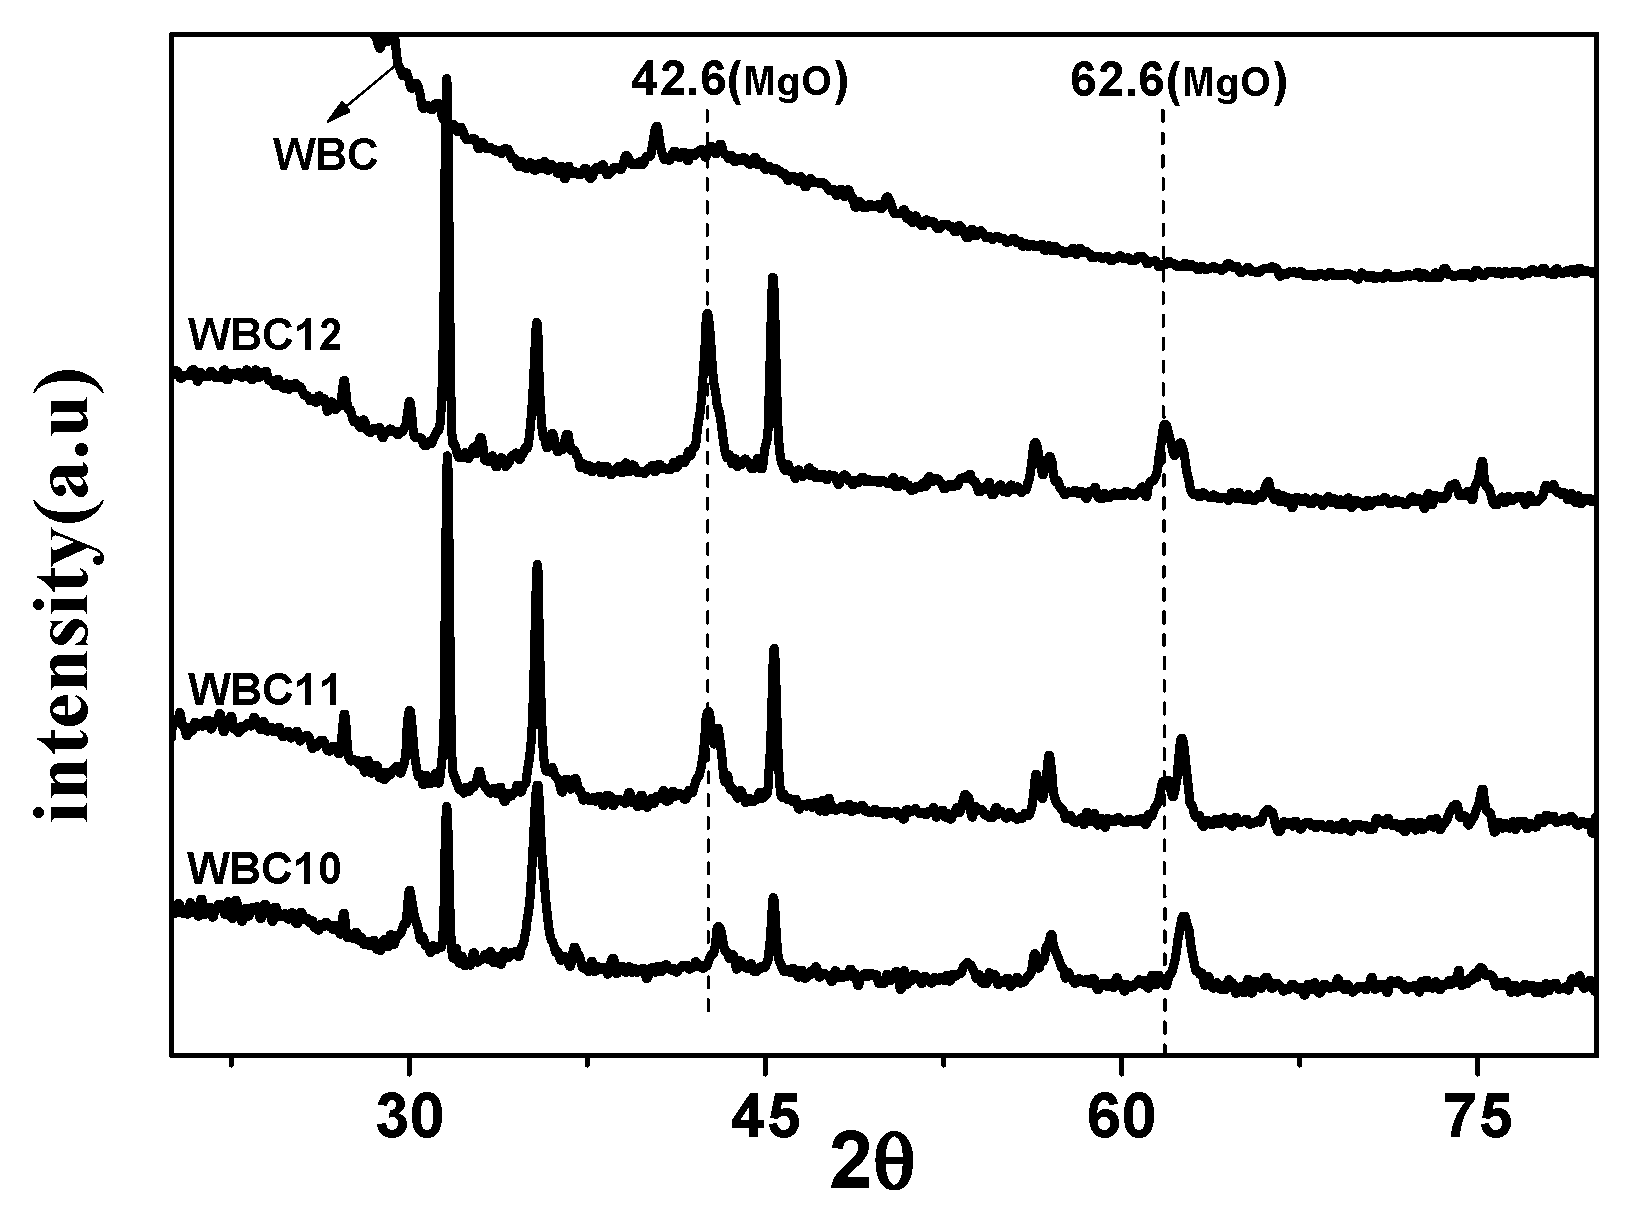
3.1. Physico-Chemical Properties of WBC1x
3.2. Effect of Adsorbent Amount, Fe2+/Mg2+ Ratio, pH and Anions on Phosphate Adsorption
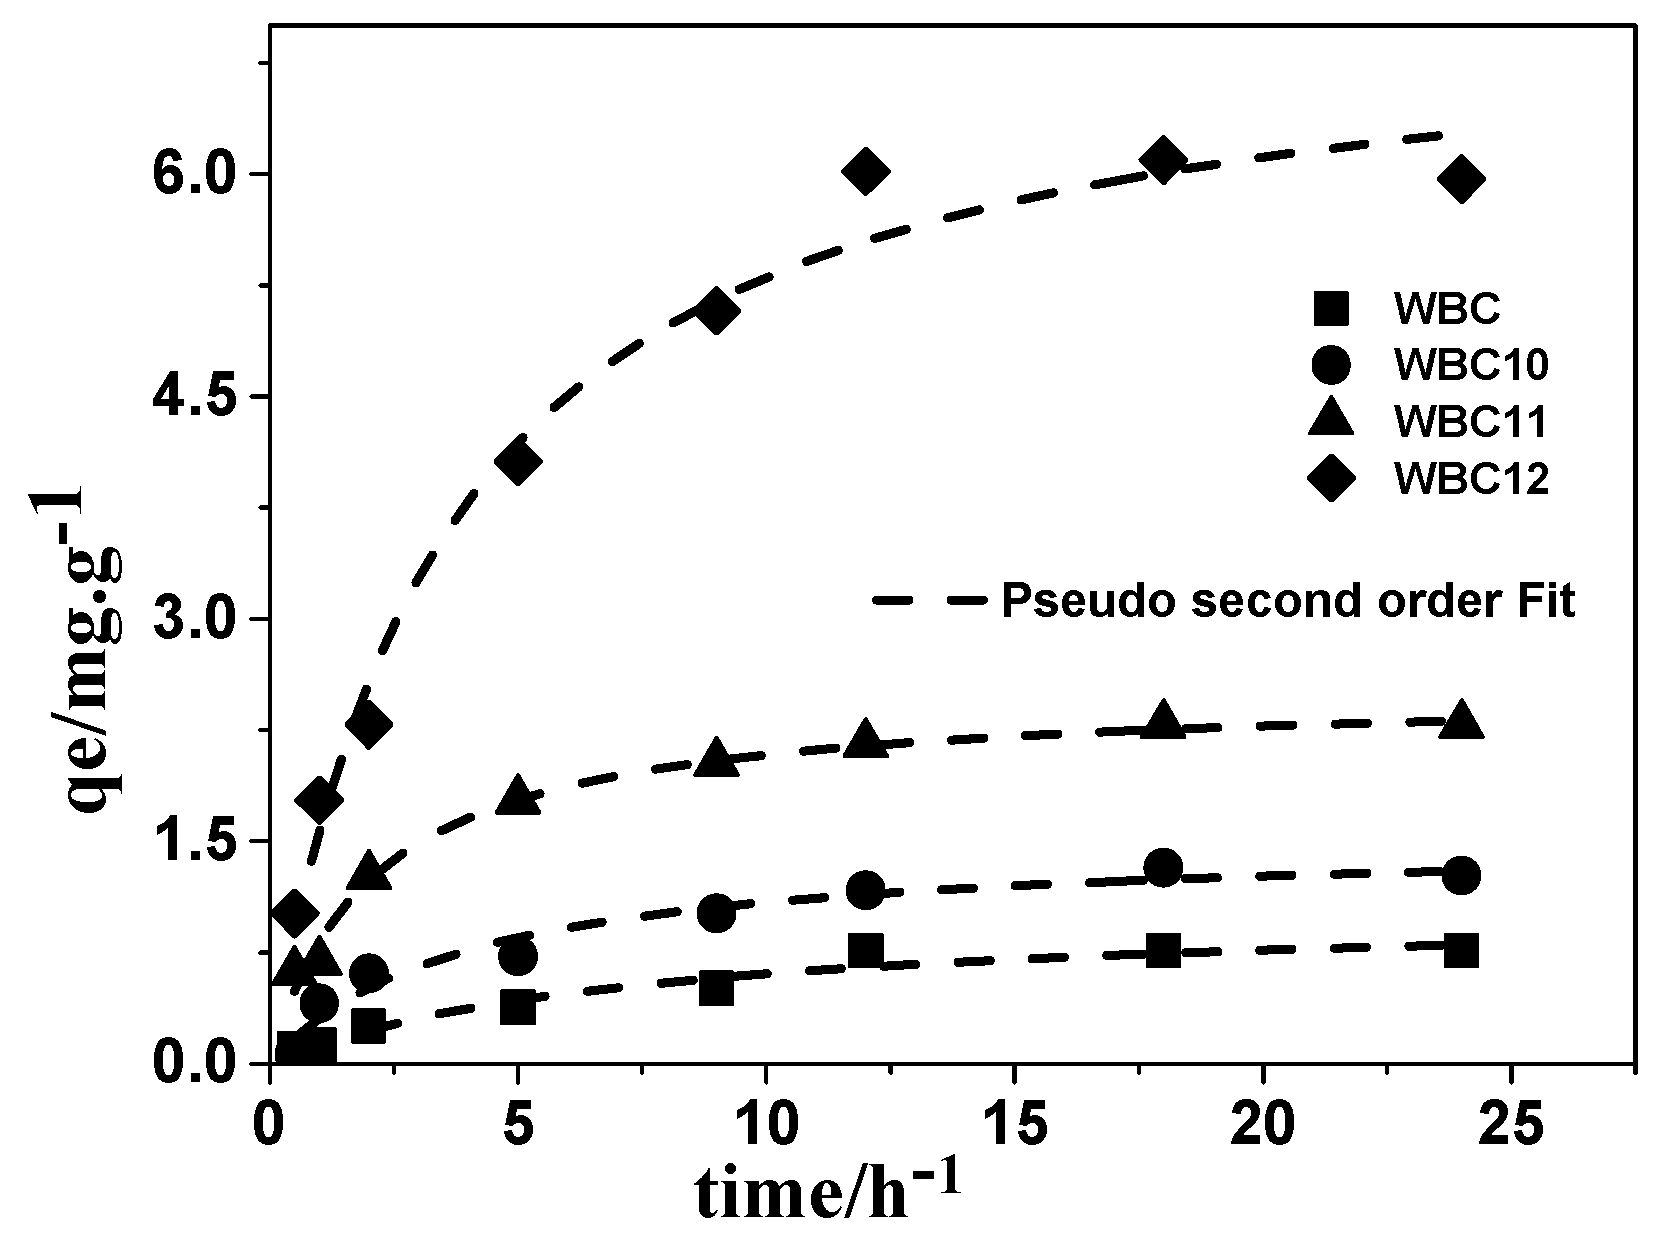
3.3. Adsorption Kinetics
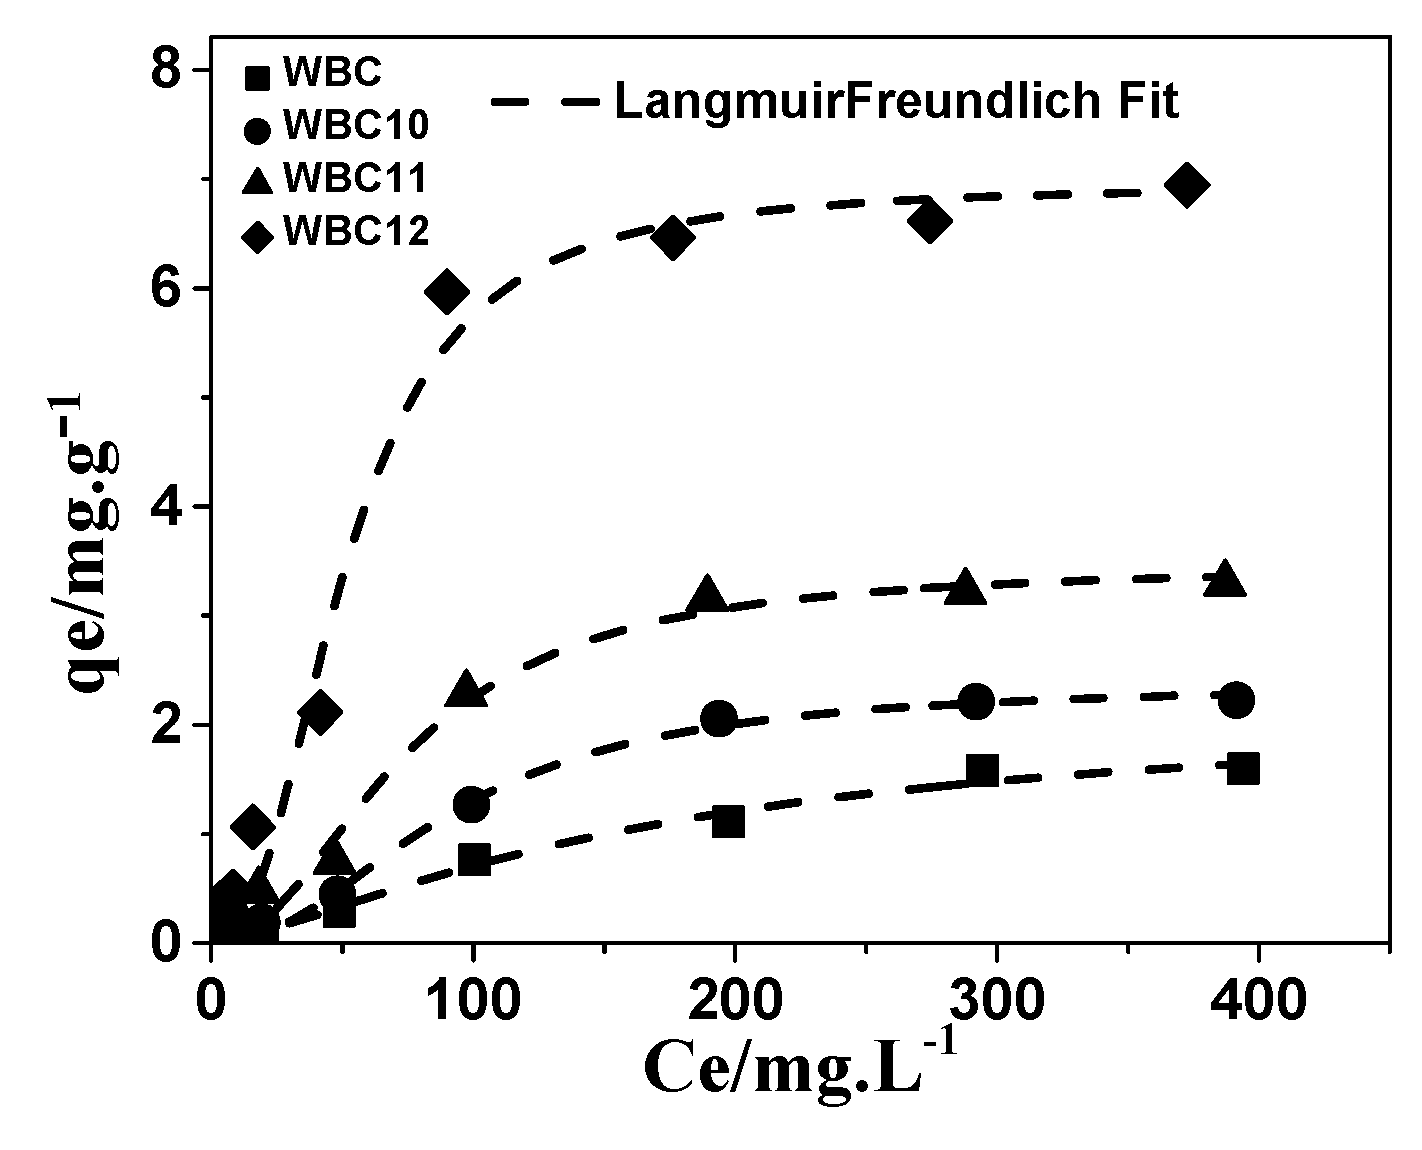
3.4. Adsorption Isotherm
3.5. Regeneration of Spent WBC1x
4. Conclusions
- (1)
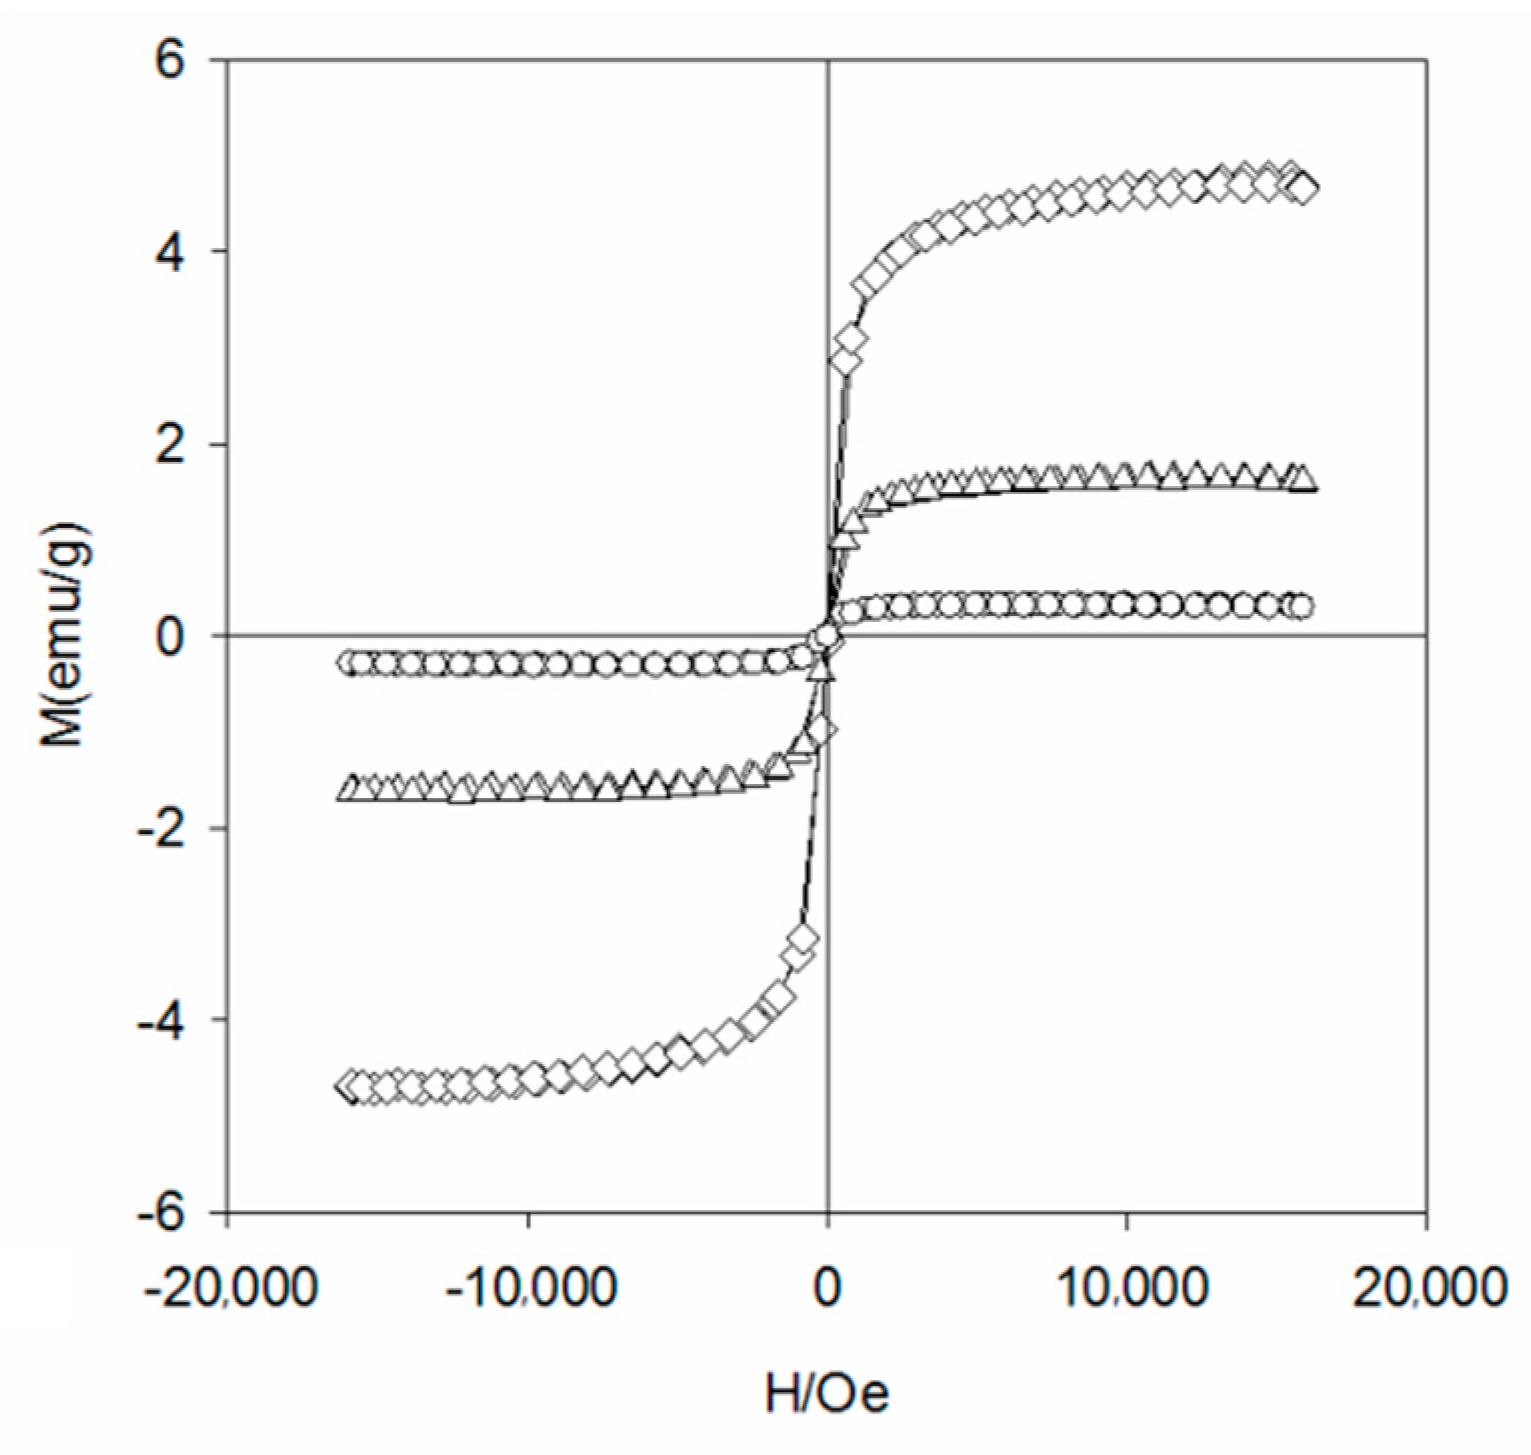
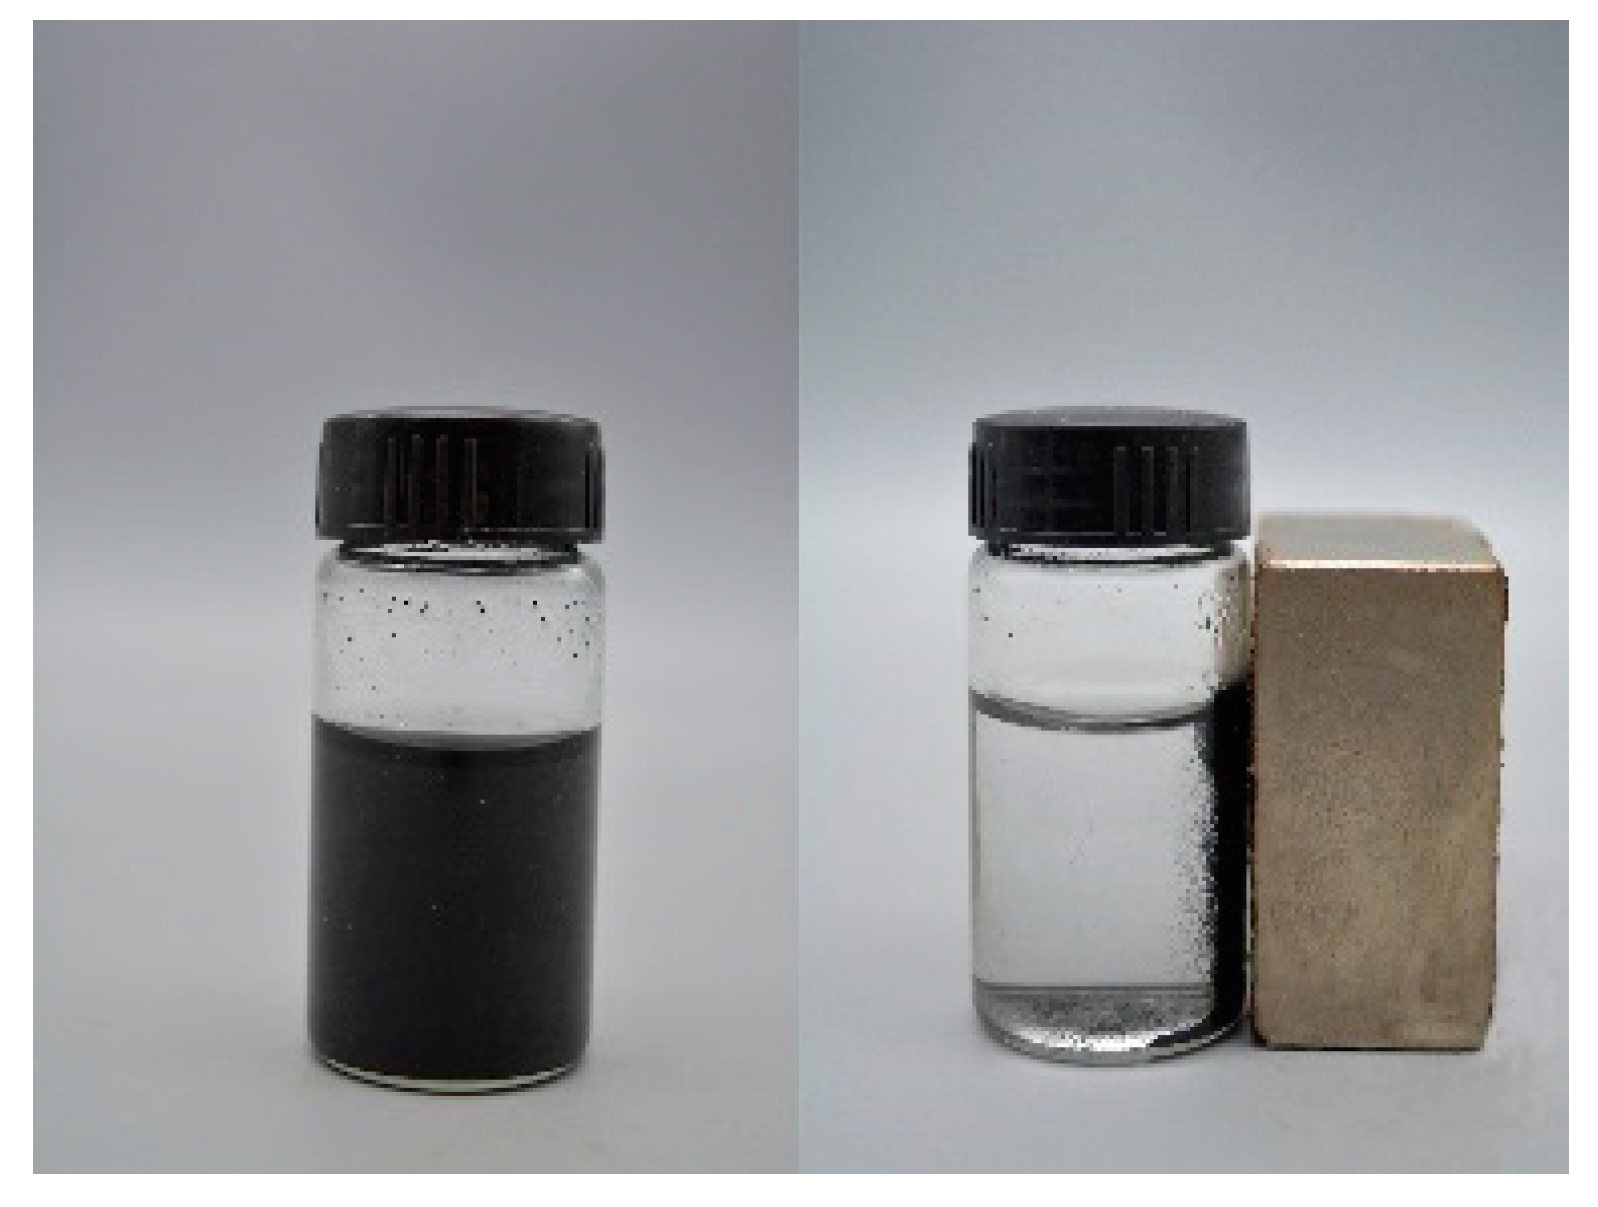
- WBC1x was prepared through a combination of impregnation and slow pyrolysis at a temperature of 600 °C, which successfully loaded MgO and Fe3O4 onto WBC. As a consequence, all WBC1x have magnetic separation characteristics;
- (2)
- The introduction of Fe2+ and Mg2+ greatly increased the specific surface area and pHpzc of WBC1x, wherein the value of pHpzc positively correlated with the amount of Mg2+ addition;
- (3)
- Phosphate sorption onto WBC and WBC1x was mainly determined by chemisorption. The sorption of phosphate onto WBC1x, which was greater than onto WBC, was highly Mg2+ addition-dependent, wherein a higher Mg2+ addition was more favorable than a low Mg2+ addition.
Author Contributions
Funding
Conflicts of Interest
References
- Zach-Maor, A.; Semiat, R.; Shemer, H. Synthesis, performance, and modeling of immobilized nano-sized magnetite layer for phosphate removal. J. Colloid Inter. Sci. 2011, 357, 440–446. [Google Scholar] [CrossRef] [PubMed]
- Singh, D.M.; Srivastava, D.R. Sequencing Batch Reactor Technology for Biological Wastewater Treatment: A Review. Asia Pac. J. Chem. Eng. 2011, 6, 3–13. [Google Scholar] [CrossRef]
- Yu, Y.; Chen, J.P. Key factors for optimum performance in phosphate removal from contaminated water by a Fe–Mg–La tri-metal composite sorbent. J. Colloid Inter. Sci. 2015, 445, 303–311. [Google Scholar] [CrossRef] [PubMed]
- Altundogan, H.; Tumen, F. Removal of phosphates from aqueous solutions by using bauxite. I: Effect of pH on the adsorption of various phosphates. J. Chem. Technol. Biotechnol. 2001, 77, 77–85. [Google Scholar] [CrossRef]
- Yao, Y.; Gao, B.; Inyang, M.; Zimmerman, A.R.; Cao, X.; Pullammanappallil, P.; Yang, L. Removal of phosphate from aqueous solution by biochar derived from anaerobically digested sugar beet tailings. J. Hazard. Mater. 2011, 190, 501–507. [Google Scholar] [CrossRef] [PubMed]
- Cavallaro, G.; Lazzara, G.; Rozhina, E.; Konnova, S.; Kryuchkova, M.; Khaertdinov, N.; Fakhrullin, R. Organic-nanoclay composite materials as removal agents for environmental decontamination. RSC Adv. 2019, 9, 40553–40564. [Google Scholar] [CrossRef]
- Yao, Y.; Gao, B.; Zhang, M.; Inyang, M.; Zimmerman, A.R. Effect of biochar amendment on sorption and leaching of nitrate, ammonium, and phosphate in a sandy soil. Chemosphere 2012, 89, 1467–1471. [Google Scholar] [CrossRef]
- Mohan, D.; Kumar, H.; Sarswat, A.; Alexandre-Franco, M.; Pittman, C.U. Cadmium and lead remediation using magnetic oak wood and oak bark fast pyrolysis bio-chars. Chem. Eng. J. 2014, 236, 513–528. [Google Scholar] [CrossRef]
- Yan, L.; Kong, L.; Qu, Z.; Li, L.; Shen, G. Magnetic Biochar Decorated with ZnS Nanocrytals for Pb (II) Removal. ACS Sustain. Chem. Eng. 2015, 3, 125–132. [Google Scholar] [CrossRef]
- Chen, B.; Chen, Z.; Lv, S. A novel magnetic biochar efficiently sorbs organic pollutants and phosphate. Bioresour. Technol. 2011, 102, 716–723. [Google Scholar] [CrossRef]
- Zhang, M.; Gao, B.; Yao, Y.; Xue, Y.; Inyang, M. Synthesis of porous MgO-biochar nanocomposites for removal of phosphate and nitrate from aqueous solutions. Chem. Eng. J. 2012, 210, 26–32. [Google Scholar] [CrossRef]
- Li, R.; Wang, J.J.; Zhou, B.; Awasthi, M.K.; Ali, A.; Zhang, Z.; Lahori, A.H.; Mahar, A. Recovery of phosphate from aqueous solution by magnesium oxide decorated magnetic biochar and its potential as phosphate-based fertilizer substitute. Bioresour. Technol. 2016, 215, 209–214. [Google Scholar] [CrossRef] [PubMed]
- Liu, Y.; Zhao, X.; Li, J.; Ma, D.; Han, R. Characterization of bio-char from pyrolysis of wheat straw and its evaluation on methylene blue adsorption. Desalin. Water Treat. 2012, 46, 115–123. [Google Scholar] [CrossRef]
- Wang, Z.; Guo, H.; Shen, F.; Yang, G.; Zhang, Y.; Zeng, Y.; Wang, L.; Xiao, H.; Deng, S. Biochar produced from oak sawdust by Lanthanum (La)-involved pyrolysis for adsorption of ammonium (NH4+), nitrate (NO3−), and phosphate (PO43−). Chemosphere 2015, 119, 646–653. [Google Scholar] [CrossRef] [PubMed]
- Ahmad, M.; Lee, S.S.; Dou, X.; Mohan, D.; Sung, J.-K.; Yang, J.E.; Ok, Y.S. Effects of pyrolysis temperature on soybean stover- and peanut shell-derived biochar properties and TCE adsorption in water. Bioresour. Technol. 2012, 118, 536–544. [Google Scholar] [CrossRef]
- Kameyama, K.; Miyamoto, T.; Shiono, T.; Shinogi, Y. Influence of Sugarcane Bagasse-derived Biochar Application on Nitrate Leaching in Calcaric Dark Red Soil. J. Environ. Qual. 2012, 41, 1131–1137. [Google Scholar] [CrossRef]
- Álvarez-Merino, M.A.; Fontecha-Cámara, M.A.; López-Ramón, M.V.; Moreno-Castilla, C. Temperature dependence of the point of zero charge of oxidized and non-oxidized activated carbons. Carbon 2008, 46, 778–787. [Google Scholar] [CrossRef]
- Kosmulski, M. The pH dependent surface charging and points of zero charge. VIII. Update. Adv. Colloid Int. Sci. 2020, 275, 102064. [Google Scholar] [CrossRef]
- Verma, R.; Asthana, A.; Singh, A.K.; Prasad, S.; Susan, M.A.B.H. Novel glycine-functionalized magnetic nanoparticles entrapped calcium alginate beads for effective removal of lead. Microchem. J. 2017, 130, 168–178. [Google Scholar] [CrossRef]
- Chen, B.; Zhou, D.; Zhu, L. Transitional Adsorption and Partition of Non-Polar and Polar Aromatic Contaminants by Biochars of Pine Needles with Different Pyrolytic Temperatures. Environ. Sci. Technol. 2008, 42, 5137–5143. [Google Scholar] [CrossRef]
- Lim, S.-F.; Zheng, Y.-M.; Chen, J.P. Organic Arsenic Adsorption onto a Magnetic Sorbent. Langmuir 2009, 25, 4973–4978. [Google Scholar] [CrossRef]
- Chen, D.; Yu, X.; Song, C.; Pang, X.; Huang, J.; Li, Y. Effect of pyrolysis temperature on the chemical oxidation stability of bamboo biochar. Bioresour. Technol. 2016, 218, 1303–1306. [Google Scholar] [CrossRef] [PubMed]
- Fang, C.; Zhang, T.; Li, P.; Jiang, R.-F.; Wang, Y. Application of Magnesium Modified Corn Biochar for Phosphorus Removal and Recovery from Swine Wastewater. Int. J. Environ. Res. Public Health 2014, 11, 9217–9237. [Google Scholar] [CrossRef]
- Jung, K.-W.; Hwang, M.-J.; Jeong, T.-U.; Ahn, K.-H. A novel approach for preparation of modified-biochar derived from marine macroalgae: Dual purpose electro-modification for improvement of surface area and metal impregnation. Bioresour. Technol. 2015, 191, 342–345. [Google Scholar] [CrossRef]


| Adsorbent | C% | H% | O% | N% | H/C | O/C | BET Surface Area (m2.g−1) | Average Pore Diameter (nm) | pHPZC |
|---|---|---|---|---|---|---|---|---|---|
| WBC | 84.23 | 2.96 | 11.66 | 0.15 | 0.04 | 0.14 | 138.09 | 2.79 | 4.80 |
| WBC10 | 76.59 | 2.77 | 12.73 | 0.14 | 0.04 | 0.17 | 263.58 | 2.88 | 8.00 |
| WBC11 | 76.50 | 2.74 | 13.10 | 0.13 | 0.04 | 0.17 | 229.71 | 2.98 | 8.90 |
| WBC12 | 51.79 | 3.09 | 20.73 | 0.06 | 0.06 | 0.40 | 231.10 | 2.85 | 9.10 |
| Adsorbent | Pseudo-First Order | Pseudo-Second Order | Intra-Particle Diffusion | ||||||
|---|---|---|---|---|---|---|---|---|---|
| qe (mg.g−1) | K1 (h−1) | R2 | qe (mg.g−1) | K2 (g.mg−1.h−1) | R2 | K (g.mg−1.h−1/2) | C | R2 | |
| WBC | 0.809 ± 0.002 | 0.146 ± 0.003 | 0.954 | 1.041 ± 0.001 | 0.134 ± 0.005 | 0.952 | 0.178 ± 0.001 | −0.010 ± 0.001 | 0.924 |
| WBC10 | 1.265 ± 0.005 | 0.224 ± 0.001 | 0.933 | 1.511 ± 0.002 | 0.170 ± 0.001 | 0.954 | 0.278 ± 0.005 | 0.093 ± 0.006 | 0.897 |
| WBC11 | 2.196 ± 0.001 | 0.403 ± 0.003 | 0.966 | 2.512 ± 0.005 | 0.193 ± 0.001 | 0.987 | 0.422 ± 0.002 | 0.534 ± 0.005 | 0.859 |
| WBC12 | 6.050 ± 0.010 | 0.246 ± 0.002 | 0.979 | 7.217 ± 0.008 | 0.038 ± 0.002 | 0.981 | 1.288 ± 0.009 | 0.661 ± 0.002 | 0.893 |
| Isotherm Model | Langmuir | Freundlich | Langmuir-Freundlich | ||||||
|---|---|---|---|---|---|---|---|---|---|
| Parameters | qmax (mg.g−1) | KL | R2 | KF (L.mg−1) | 1/n | R2 | qmax (mg.g−1) | K (L.mg−1) | R2 |
| WBC | 3.198 ± 0.002 | 0.003 ± 0.001 | 0.984 | 0.025 ± 0.001 | 0.712 ± 0.002 | 0.967 | 2.136 ± 0.010 | 8.400 ± 0.011 | 0.988 |
| WBC10 | 3.661 ± 0.006 | 0.005 ± 0.001 | 0.965 | 0.061 ± 0.002 | 0.624 ± 0.002 | 0.922 | 2.376 ± 0.06 | 5.799 ± 0.007 | 0.995 |
| WBC11 | 4.725 ± 0.003 | 0.008 ± 0.001 | 0.957 | 0.154 ± 0.001 | 0.535 ± 0.001 | 0.904 | 3.464 ± 0.005 | 1.227 ± 0.009 | 0.975 |
| WBC12 | 8.871 ± 0.011 | 0.013 ± 0.002 | 0.943 | 0.489 ± 0.001 | 0.469 ± 0.001 | 0.862 | 6.945 ± 0.012 | 8.996 ± 0.013 | 0.972 |
© 2020 by the authors. Licensee MDPI, Basel, Switzerland. This article is an open access article distributed under the terms and conditions of the Creative Commons Attribution (CC BY) license (http://creativecommons.org/licenses/by/4.0/).
Share and Cite
Tao, X.; Huang, T.; Lv, B. Synthesis of Fe/Mg-Biochar Nanocomposites for Phosphate Removal. Materials 2020, 13, 816. https://doi.org/10.3390/ma13040816
Tao X, Huang T, Lv B. Synthesis of Fe/Mg-Biochar Nanocomposites for Phosphate Removal. Materials. 2020; 13(4):816. https://doi.org/10.3390/ma13040816
Chicago/Turabian StyleTao, Xuefeng, Tao Huang, and Bo Lv. 2020. "Synthesis of Fe/Mg-Biochar Nanocomposites for Phosphate Removal" Materials 13, no. 4: 816. https://doi.org/10.3390/ma13040816
APA StyleTao, X., Huang, T., & Lv, B. (2020). Synthesis of Fe/Mg-Biochar Nanocomposites for Phosphate Removal. Materials, 13(4), 816. https://doi.org/10.3390/ma13040816