Relationship between Microstructure and Properties of Cu–Cr–Ag Alloy

 and
and 
Abstract
1. Introduction
2. Materials and Methods
3. Results and Discussion
3.1. Microstructure Observation
3.2. Physical Properties
4. Conclusions
- (1)
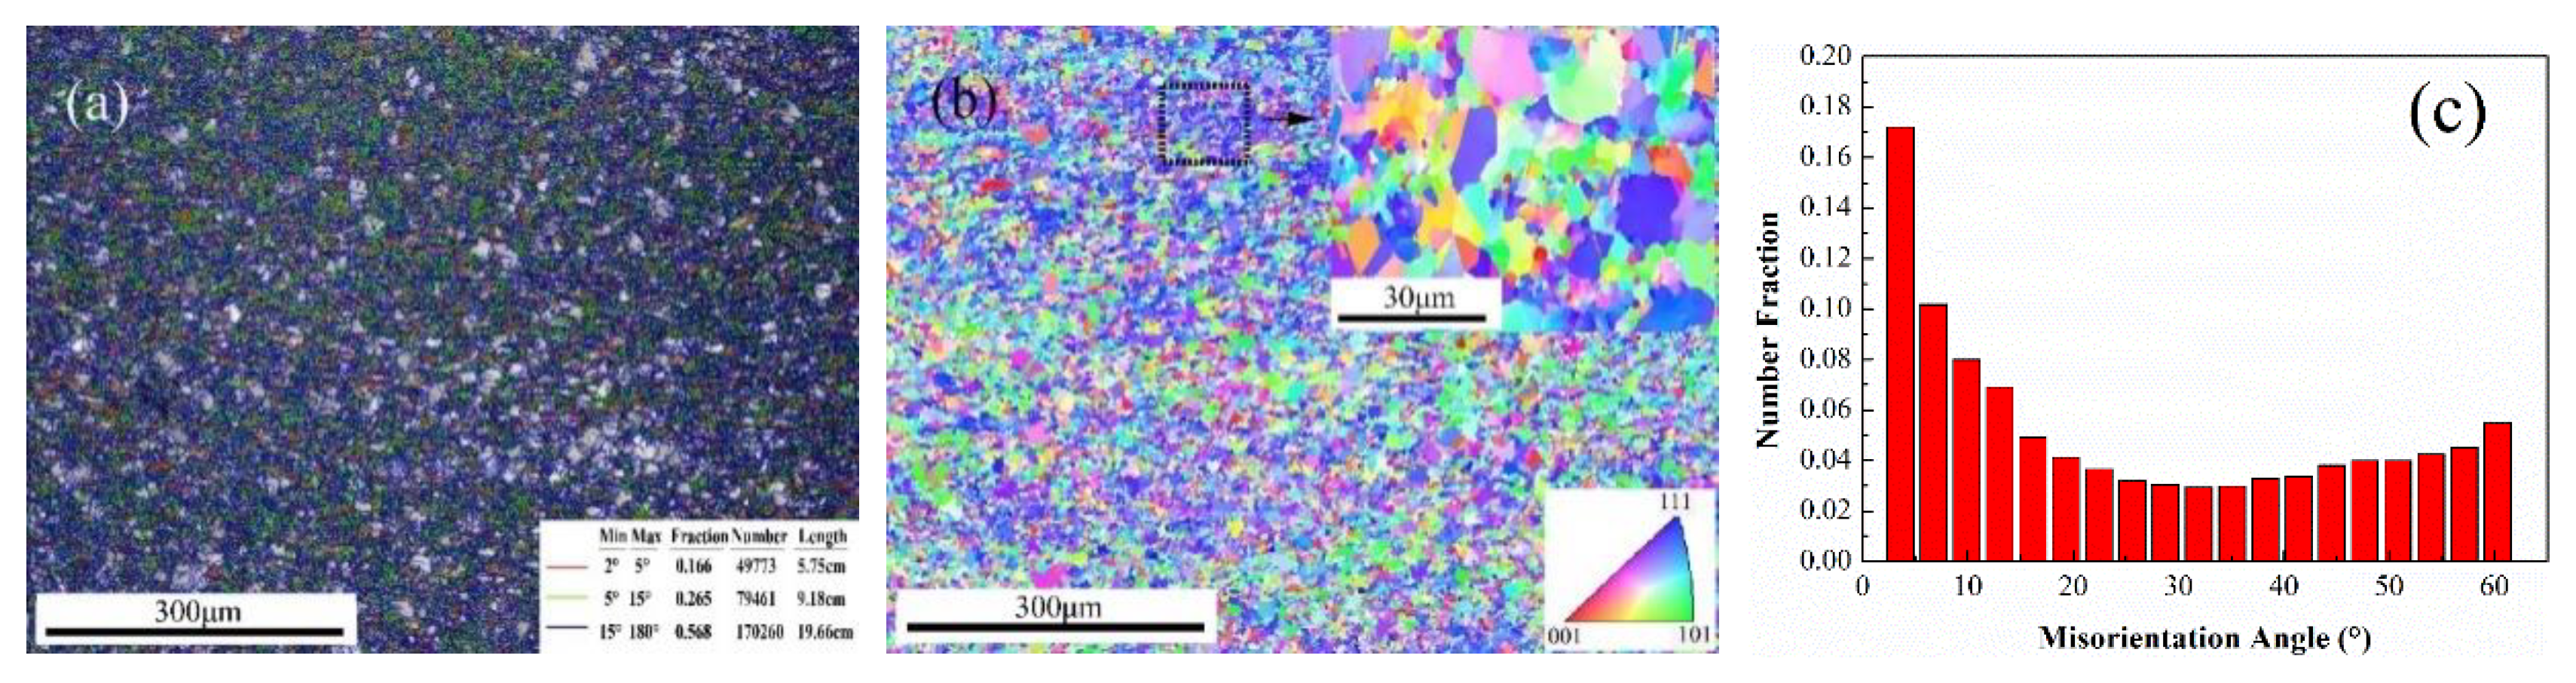
- With the combination of strong shear deformation and working temperature, the crystal grains of the updrawn cast Cu–Cr–Ag alloy were obviously broken with an average grain size of 4–5 μm during continuous extrusion.
- (2)
- A large number of nanoscale coffee-bean-shaped and Moire fringe Cr phases were observed aged at 450 °C for 2 h. The Moire fringe Cr phases had an N–W relationship with the matrix.
- (3)
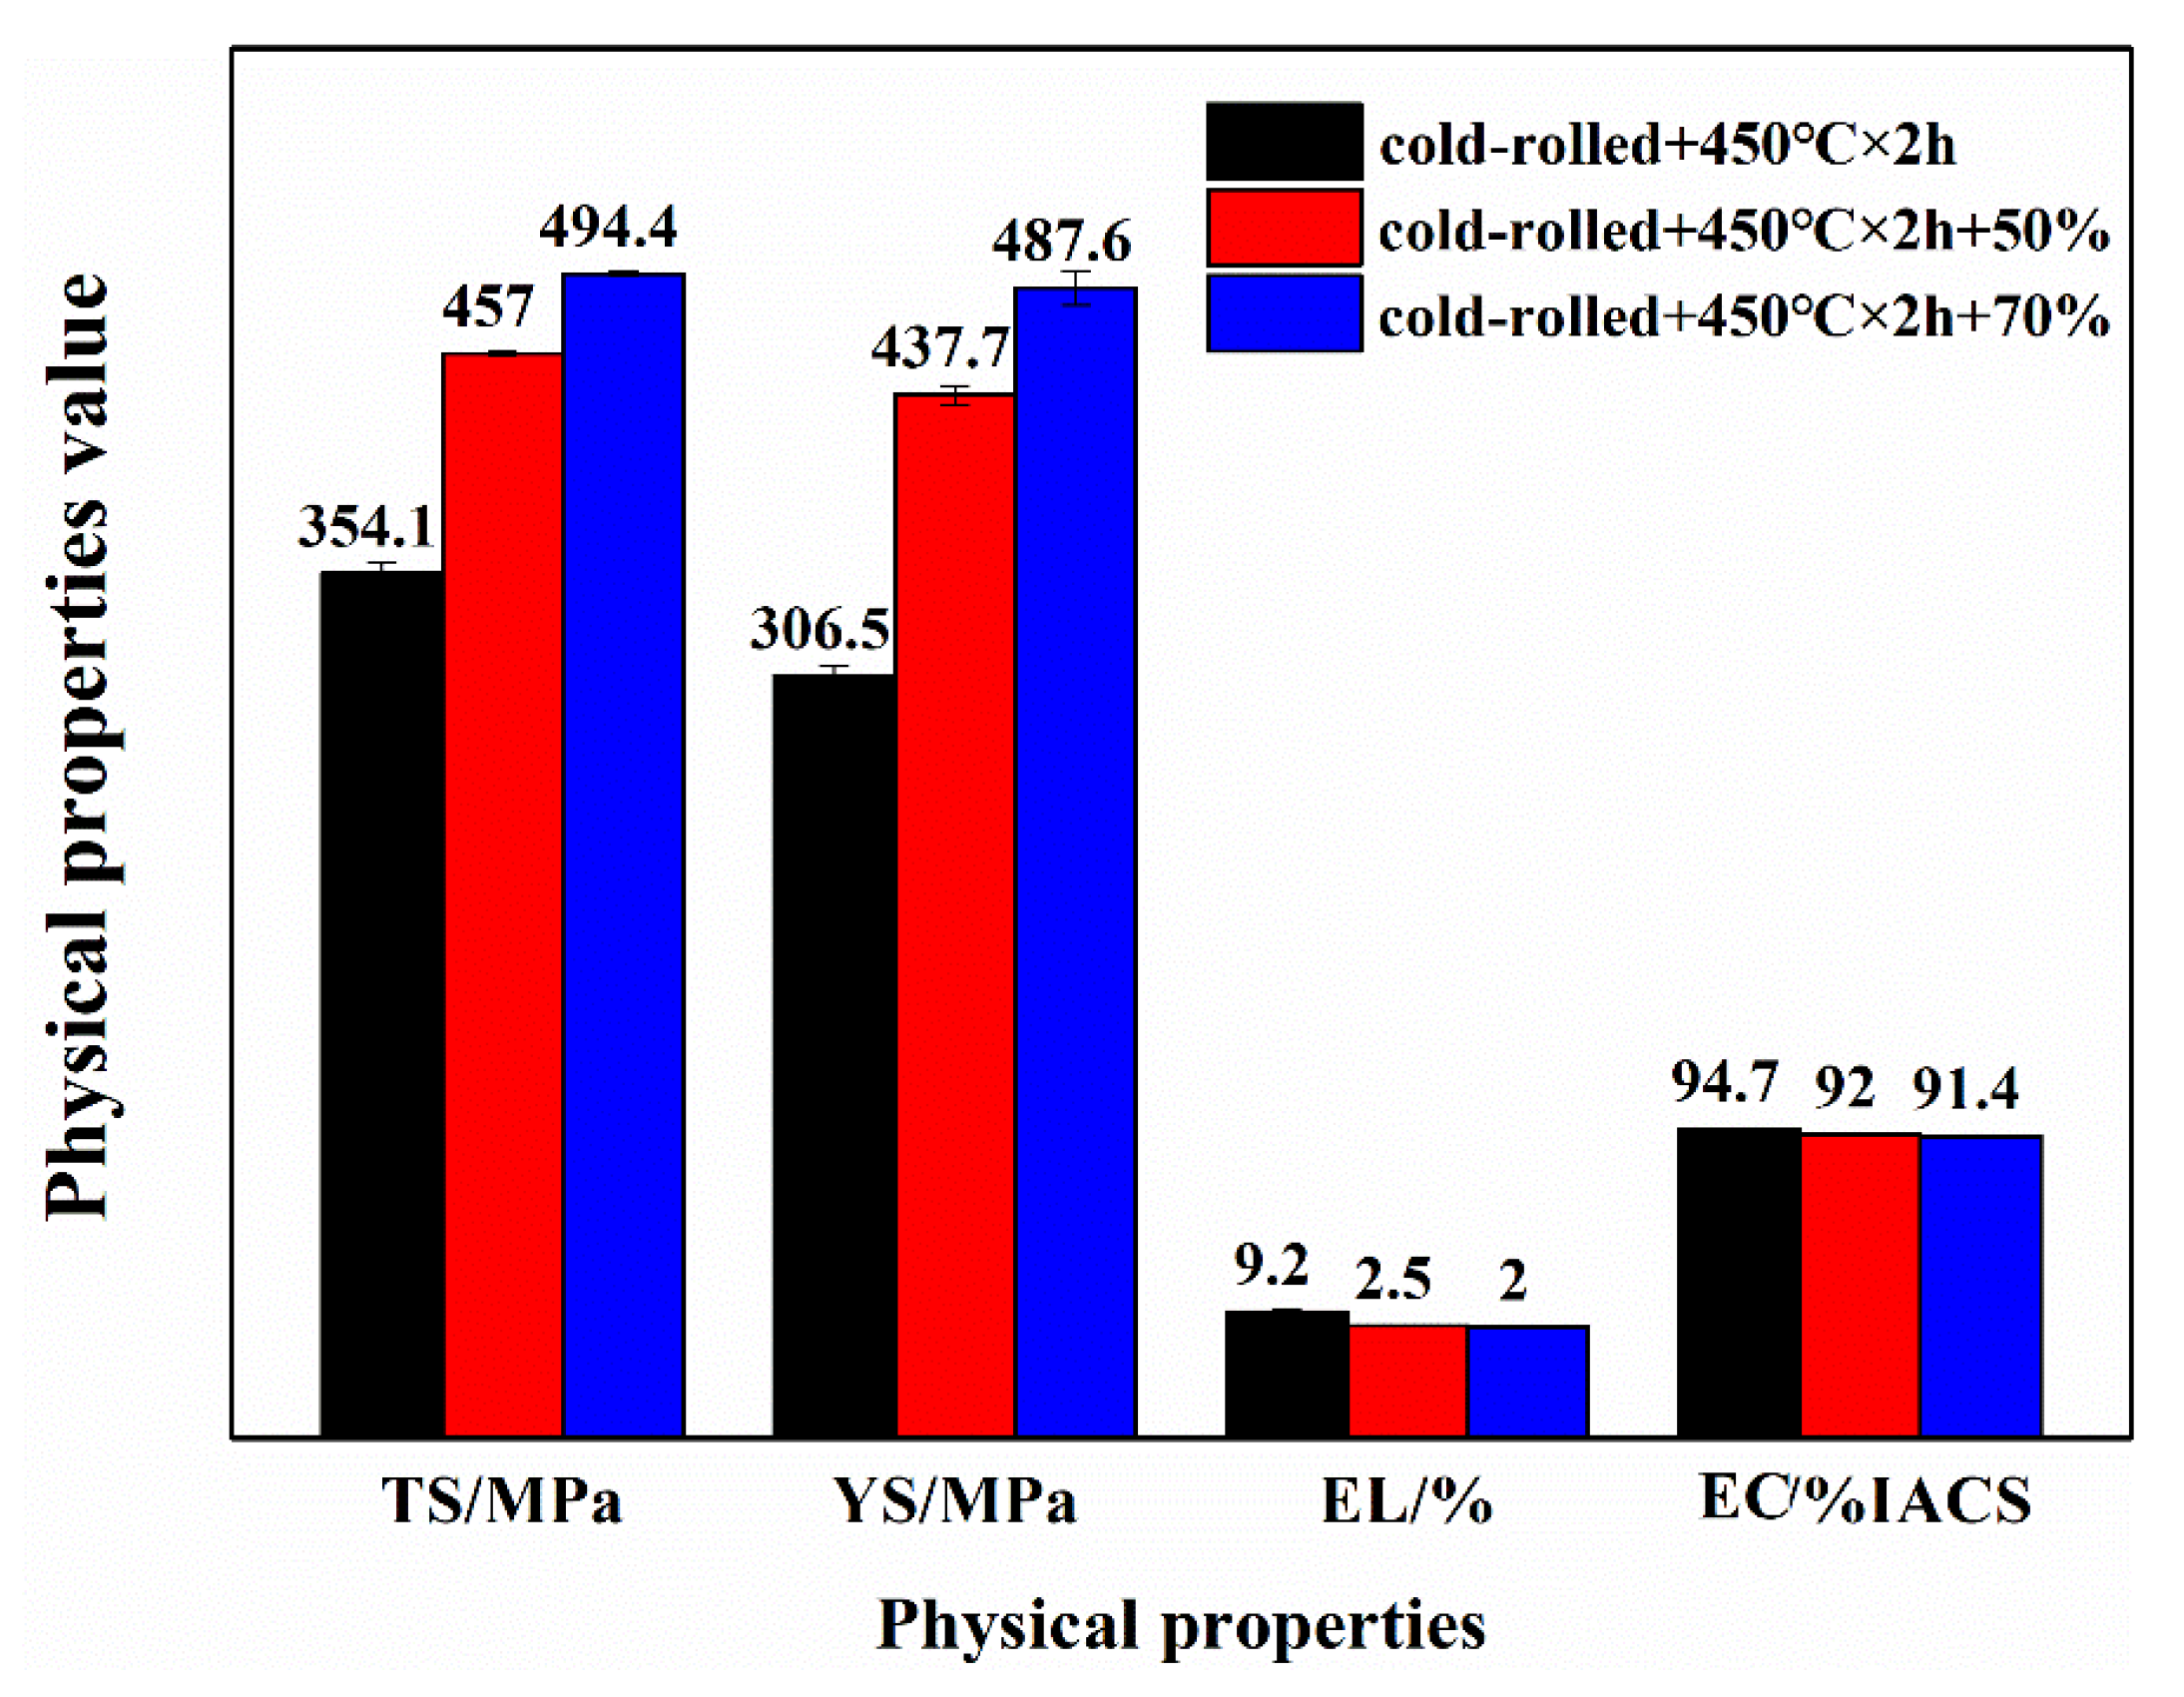
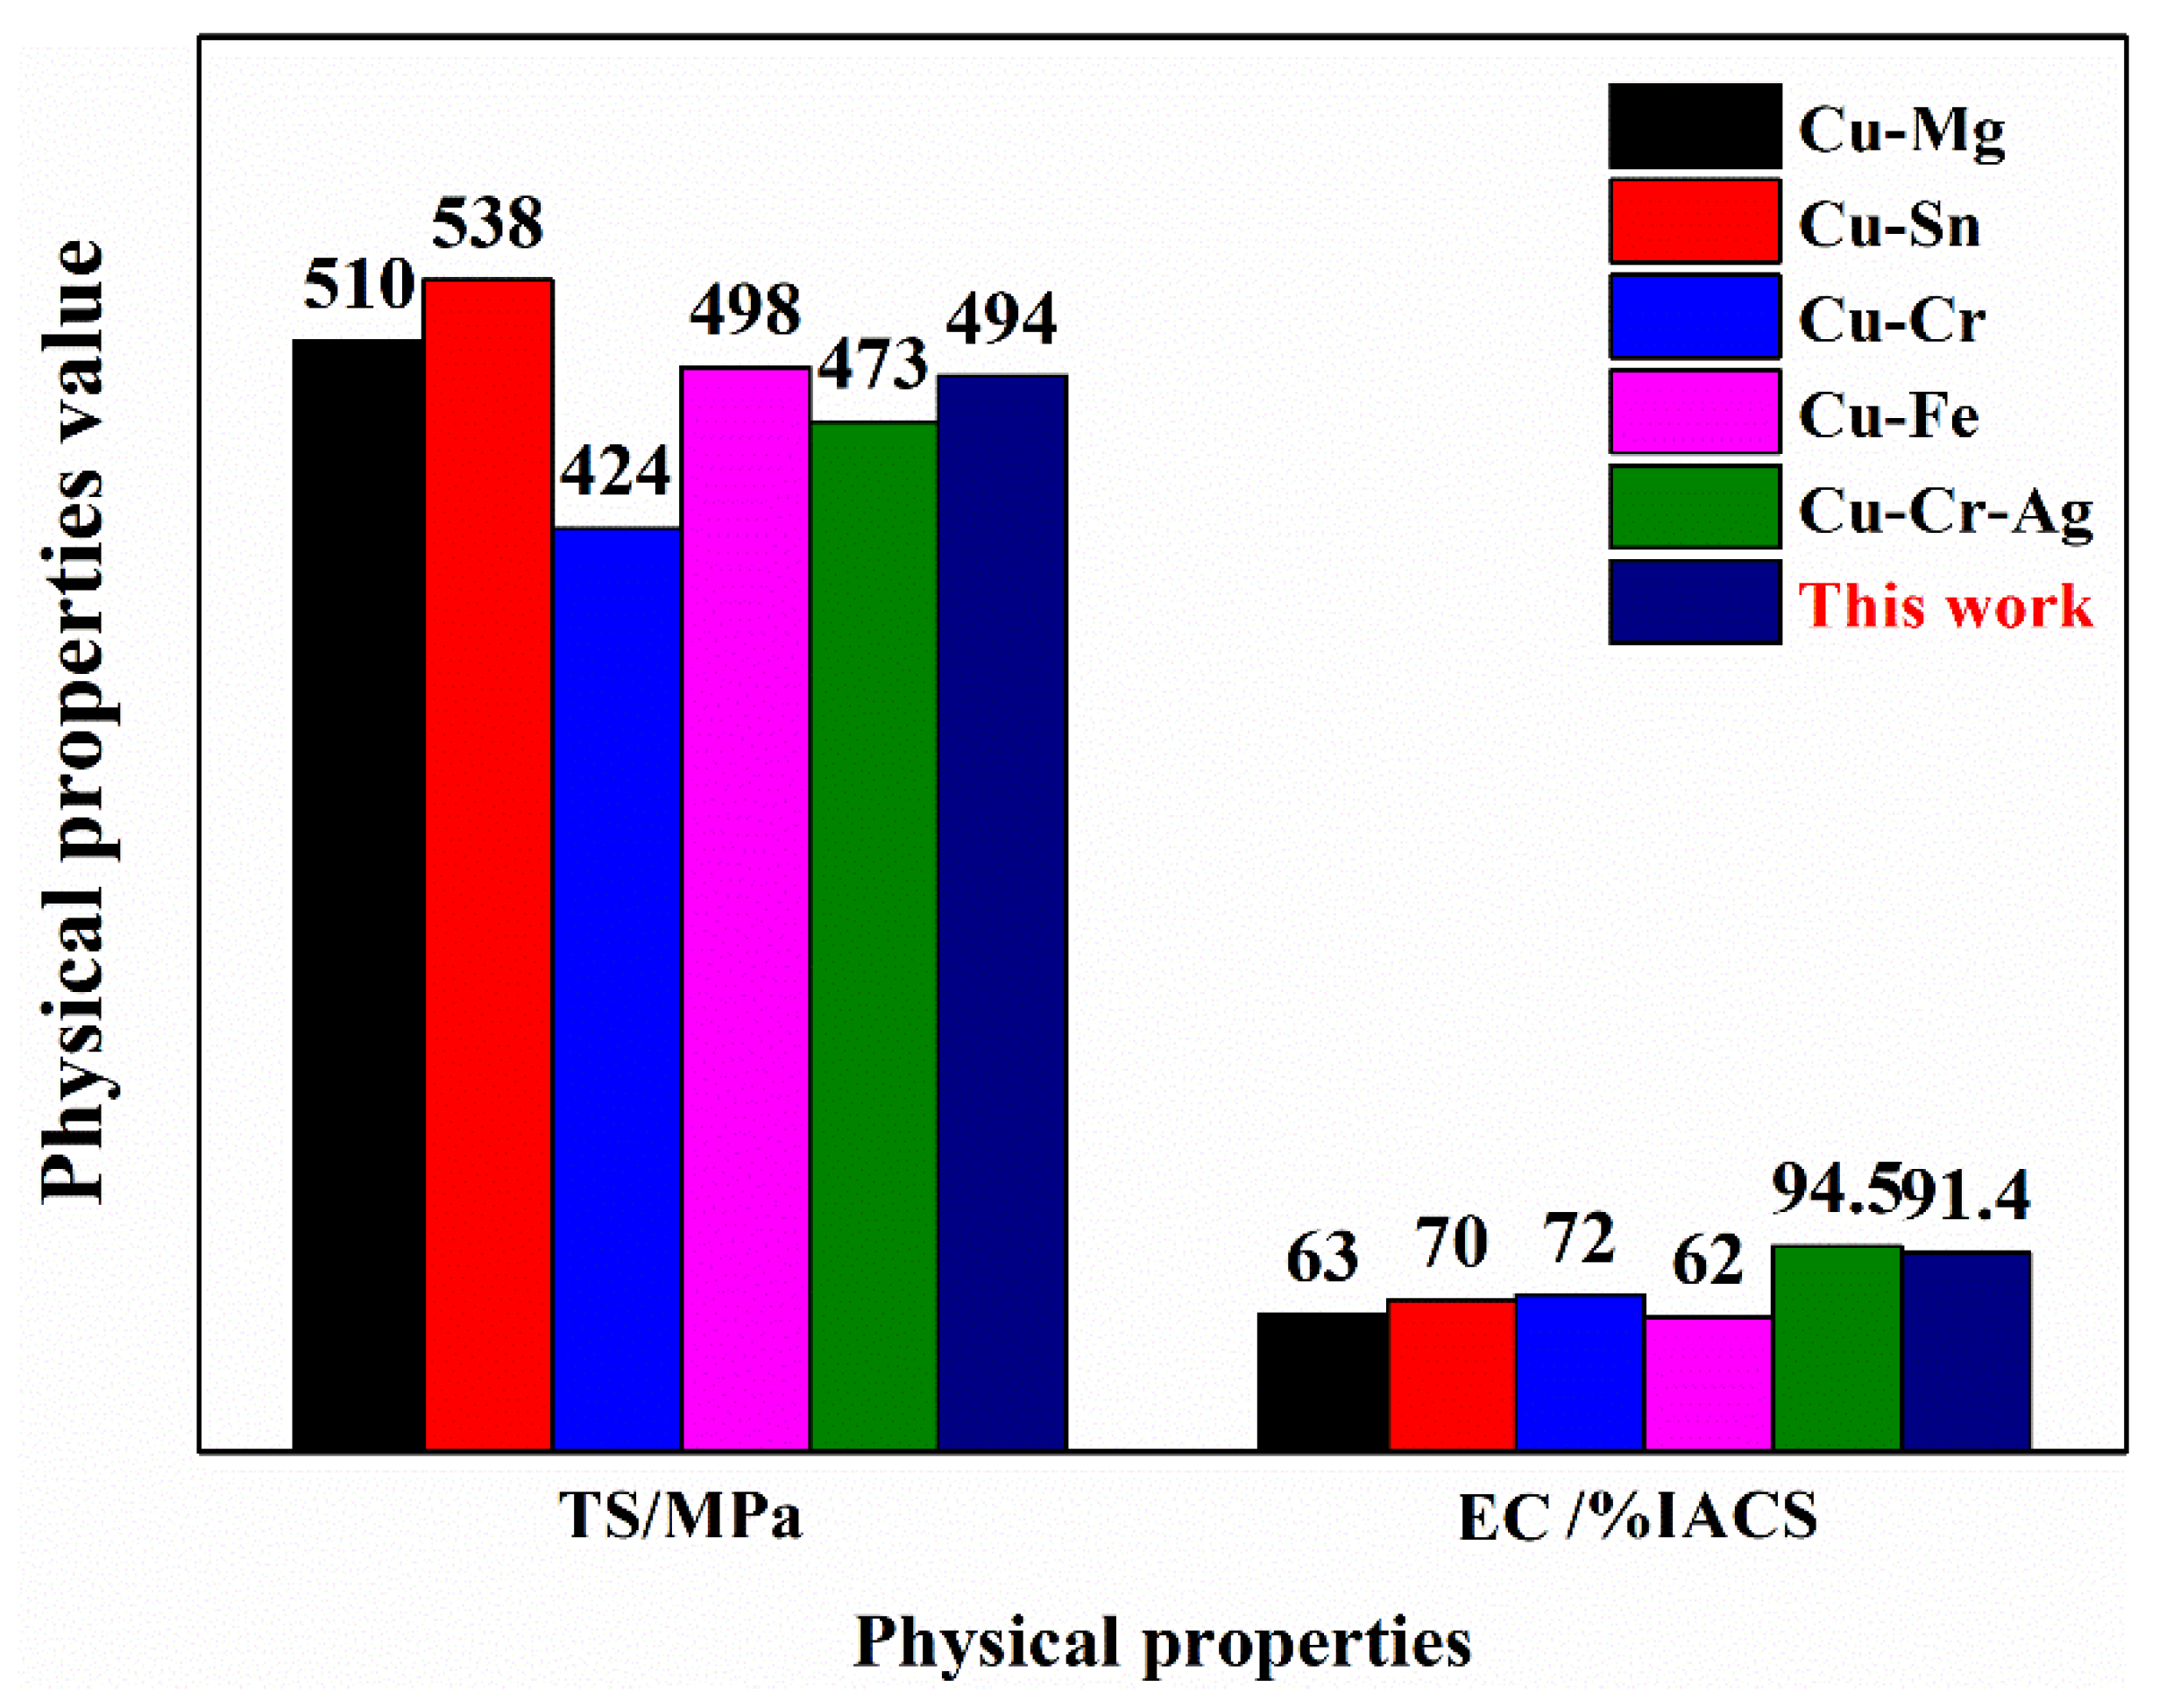
- After continuous extrusion, 60% cold deformation, 875 °C × 1 h solid solution treatment, 60% cold deformation, 450 °C × 2 h aging treatment, and 70% cold deformation, the updrawn cast Cu–Cr–Ag alloy acquired excellent comprehensive properties represented by tensile strength of 494.4 MPa, yield strength of 487.6 MPa, and electrical conductivity of 91.4 % IACS.
Author Contributions
Funding
Conflicts of Interest
References
- Hatakeyama, M.; Toyama, T.; Nagai, Y.; Hasegawa, M.; Eldrup, M.; Singh, B.N. Nanostructural evolution of Cr-rich precipitates in a Cu-Cr-Zr alloy during heat treatment studied by 3 dimensional atom probe. Mater. Trans. 2008, 49, 518–521. [Google Scholar] [CrossRef]
- Cheng, J.; Shen, B.; Yu, F. Precipitation in a Cu–Cr–Zr–Mg alloy during aging. Mater. Character. 2013, 81, 68–75. [Google Scholar] [CrossRef]
- Zhou, J.; Zhu, D.; Tang, L.; Jiang, X.; Chen, S.; Peng, X.; Hu, C. Microstructure and properties of powder metallurgy Cu–1% Cr–0.65% Zr alloy prepared by hot pressing. Vacuum 2016, 131, 156–163. [Google Scholar] [CrossRef]
- Liu, Q.; Zhang, X.; Ge, Y.; Wang, J.; Cui, J.-Z. Effect of processing and heat treatment on behavior of Cu-Cr-Zr alloys to railway contact wire. Metall. Mater. Trans. A 2006, 37, 3233–3238. [Google Scholar] [CrossRef]
- Pang, Y.; Xia, C.; Wang, M.; Li, Z.; Xiao, Z.; Wei, H.; Sheng, X.; Jia, Y.; Chen, C. Effects of Zr and (Ni, Si) additions on properties and microstructure of Cu–Cralloy. J. Alloys Compd. 2014, 582, 786–792. [Google Scholar] [CrossRef]
- Xia, C.; Zhang, W.; Kang, Z.; Jia, Y.; Wu, Y.; Zhang, R.; Xu, G.; Wang, M. High strength and high electrical conductivity Cu–Cr system alloys manufactured by hot rolling–quenching process and thermomechanical treatments. Mater. Sci. Eng. A 2012, 538, 295–301. [Google Scholar] [CrossRef]
- Wang, Z.; Zhong, Y.; Cao, G.; Wang, C.; Wang, J.; Ren, W.; Lei, Z.; Ren, Z. Influence of dc electric current on the hardness of thermally aged Cu–Cr–Zr alloy. J. Alloys Compd. 2009, 479, 303–306. [Google Scholar] [CrossRef]
- Fuxiang, H.; Jusheng, M.; Honglong, N.; Zhiting, G.; Chao, L.; Shumei, G.; Xuetao, Y.; Tao, W.; Hong, L.; Huafen, L. Analysis of phases in a Cu-Cr-Zr alloy. Scr. Mater. 2003, 48, 97–102. [Google Scholar] [CrossRef]
- Cheng, J.; Yu, F.; Shen, B. Solute clusters and chemistry in a Cu–Cr–Zr–Mg alloy during the early stage of aging. Mater. Lett. 2014, 115, 201–204. [Google Scholar] [CrossRef]
- Zhang, Y.; Volinsky, A.A.; Tran, H.T.; Chai, Z.; Liu, P.; Tian, B.; Liu, Y. Aging behavior and precipitates analysis of the Cu–Cr–Zr–Ce alloy. J. Mater. Sci. Technol. 2007, 23, 795–800. [Google Scholar] [CrossRef]
- Correia, J.; Davies, H.; Sellars, C. Sellars. Strengthening in rapidly solidified age hardened Cu–Cr and Cu–Cr–Zr alloys. Acta Mater. 1997, 45, S1359–S6454. [Google Scholar] [CrossRef]
- Chbihi, A.; Sauvage, X.; Blavette, D. Atomic scale investigation of Cr precipitation in copper. Acta. Mater. 2012, 60, 4575–4585. [Google Scholar] [CrossRef]
- Hatakeyama, M.; Toyama, T.; Yang, J.; Nagai, Y.; Hasegawa, M.; Ohkubo, T.; Eldrup, M.; Singh, B.N. 3D-AP and positron annihilation study of precipitation behavior in Cu-Cr-Zr alloy. Nucl. Mater. 2009, 386–388, 852–855. [Google Scholar] [CrossRef]
- Jin, Y.; Adachi, K.; Takeuchi, T.; Suzuki, H. Ageing characteristics of Cu–Cr in-situ composite. Mater. Sci. 1998, 33, 1333–1341. [Google Scholar] [CrossRef]
- Peng, L.; Xie, H.; Huang, G.; Xu, G.; Yin, X.; Feng, X.; Mi, X.; Yang, Z. The phase transformation and strengthening of a Cu-0.71 wt% Cr alloy. J. Alloys Compd. 2017, 708, 1096–1102. [Google Scholar] [CrossRef]
- Batra, I.; Dey, G.; Kulkarni, U.; Banerjee, S. Precipitation in a Cu–Cr–Zr alloy. Mater. Sci. Eng. A 2002, 356, 32–36. [Google Scholar] [CrossRef]
- Zhao, Z.; Xiao, Z.; Li, Z.; Ma, M.; Dai, J. Effect of magnesium on microstructure and properties of Cu-Cr alloy. J. Alloys Compd. 2018, 752, 191–197. [Google Scholar] [CrossRef]
- Watanabe, C.; Monzen, R.; Tazaki, K. Mechanical properties of Cu–Cr system alloys with and without Zr and Ag. J. Mate. Sci. 2008, 43, 813–819. [Google Scholar] [CrossRef]
- Huaqing, L.; Shuisheng, X.; Xujun, M.; Yong, L.; Pengyue, W.; Lei, C. Influence of Cerium and Yttrium on Cu-Cr-Zr Alloys. J. Rare Earths. 2006, 24, 367–371. [Google Scholar] [CrossRef]
- Liu, Q.; Cui, Z.; Xu, G.; Liu, X. Experimental study of Cu-Ag alloy contact wire manufactured through upward-casting process. J. Northeast. Uni. 2004, 25, 844–847. [Google Scholar]
- Zhang, Z. Study on High Conductivity and High strength Copper-silver Alloy wire and New Continuously Manufacturing Techniques. Master’s Thesis, Zhengzhou University, Zhengzhou, Henan, China, 2013. [Google Scholar]
- Yuan, Y.; Li, Z.; Xiao, Z.; Zhao, Z.; Yang, Z. Microstructure evolution and properties of Cu-Cr alloy during continuous extrusion process. J. Alloys Compd. 2017, 703, 454–460. [Google Scholar] [CrossRef]
- Sun, J.; Liu, P.; Liu, X.; Chen, X.; He, D.; Ma, F.; Li, W. Microstructure evolution and properties of Cu-Ni-Si alloy during continuous extrusion process CHIN. J. Nonferrous. Met. 2014, 24, 944–949. [Google Scholar]
- Thomas, B.; Derguti, F.; Jackson, M. Continuous extrusion of a commercially pure titanium powder via the Conform process. Mater. Sci. Technol. 2017, 33, 899–903. [Google Scholar] [CrossRef]
- Yuan, Y.; Li, Z.; Xiao, Z.; Zhao, Z. Investigations on voids formation in Cu–Mg alloy during continuous extrusion. JOM 2017, 69, 1696–1700. [Google Scholar] [CrossRef]
- Holzwarth, U.; Stamm, H. The precipitation behaviour of ITER-grade Cu–Cr–Zr alloy after simulating the thermal cycle of hot isostatic pressing. J. Nucl. Mater. 2000, 279, 31–45. [Google Scholar] [CrossRef]
- Xie, H.; Mi, X.; Huang, G.; Gao, B.; Yin, X.; Li, Y. Effect of thermomechanical treatment on microstructure and properties of Cu-Cr-Zr-Ag alloy. Rare Met. 2011, 30, 650–656. [Google Scholar] [CrossRef]
- Krishna, S.C.; Gangwar, N.K.; Jha, A.K.; Pant, B.; George, K.M. Properties and Strengthening Mechanisms in Cold-Rolled and Aged Cu–3Ag–0.5Zr Alloy. Metal. Micro. Analy 2014, 3, 323–327. [Google Scholar] [CrossRef]
- Freudenberger, J.; Lyubimova, J.; Gaganov, A.; Klauß, H.; Schultz, L. Mechanical behaviour of heavily deformed CuAgZr conductor materials. J. Phys. Confer 2010, 240, 012112. [Google Scholar] [CrossRef]
- Ma, M.; Li, Z.; Qiu, W.; Xiao, Z.; Zhao, Z.; Jiang, Y. Microstructure and properties of cu–mg-ca alloy processed by equal channel angular pressing. J. Alloys Compd. 2019, 788, 50–60. [Google Scholar] [CrossRef]
- Chen, L.; Zhou, B.; Han, J.; Xue, Y.Y.; Jia, F.; Zhang, X.G. Effects of alloying and deformation on microstructures and properties of Cu–Mg–Te–Y alloys. Trans. Nonferrous Met. Soc. China 2013, 23, 3697–3703. [Google Scholar] [CrossRef]
- Yan, M.; Wu, Y.; Chen, J.; Zhou, X. Microstructure Evolution in Preparation of Cu-Sn Contact Wire for High-speed Railway. Adv. Mater. Res. 2011, 415–417, 446–451. [Google Scholar] [CrossRef]
- Dong, Q.; Shen, L.; Cao, F.; Jia, Y.; Liao, K.; Wang, M. Effect of thermomechanical processing on the microstructure and properties of a Cu–Fe–P alloy. J. Mater. Eng. Perform. 2015, 24, 1531–1539. [Google Scholar] [CrossRef]
- Shangina, D.; Maksimenkova, Y.; Bochvar, N.; Serebryany, V. Influence of alloying with hafnium on the microstructure, texture, and properties of Cu–Cr alloy after equal channel angular pressing. J. Mater. Sci. 2016, 51, 5493–5501. [Google Scholar] [CrossRef]
- Liu, Y.; Li, Z.; Jiang, Y.; Zhang, Y.; Zhou, Z. The microstructure evolution and properties of a Cu-Cr-Ag alloy during thermal-mechanical treatment. J. Mater. Res. 2017, 32, 1–9. [Google Scholar] [CrossRef]


© 2020 by the authors. Licensee MDPI, Basel, Switzerland. This article is an open access article distributed under the terms and conditions of the Creative Commons Attribution (CC BY) license (http://creativecommons.org/licenses/by/4.0/).
Share and Cite
Liang, D.; Mi, X.; Peng, L.; Xie, H.; Huang, G.; Yang, Z. Relationship between Microstructure and Properties of Cu–Cr–Ag Alloy. Materials 2020, 13, 732. https://doi.org/10.3390/ma13030732
Liang D, Mi X, Peng L, Xie H, Huang G, Yang Z. Relationship between Microstructure and Properties of Cu–Cr–Ag Alloy. Materials. 2020; 13(3):732. https://doi.org/10.3390/ma13030732
Chicago/Turabian StyleLiang, Dong, Xujun Mi, Lijun Peng, Haofeng Xie, Guojie Huang, and Zhen Yang. 2020. "Relationship between Microstructure and Properties of Cu–Cr–Ag Alloy" Materials 13, no. 3: 732. https://doi.org/10.3390/ma13030732
APA StyleLiang, D., Mi, X., Peng, L., Xie, H., Huang, G., & Yang, Z. (2020). Relationship between Microstructure and Properties of Cu–Cr–Ag Alloy. Materials, 13(3), 732. https://doi.org/10.3390/ma13030732