Article

On the Microstructure and Isothermal Oxidation at 800 and 1200 °C of the Nb-24Ti-18Si-5Al-5Cr-5Ge-5Sn (at.%) Silicide-Based Alloy

by
Ofelia Hernández-Negrete
and
Panos Tsakiropoulos
*
Department of Materials Science and Engineering, Sir Robert Hadfield Building, The University of Sheffield, Mappin Street, Sheffield S1 3JD, UK
*
Author to whom correspondence should be addressed.
Materials 2020, 13(3), 722; https://doi.org/10.3390/ma13030722
Submission received: 9 January 2020 / Revised: 28 January 2020 / Accepted: 2 February 2020 / Published: 5 February 2020

Abstract

:
The research presented in this paper aspired to understand how the simultaneous addition of Ge and Sn in an Hf-free Nb-silicide-based alloy affected its oxidation resistance. Results are presented for the Nb-24Ti-18Si-5Al-5Cr-5Ge-5Sn alloy (at.%) which was studied in the as-cast and heat-treated (1400 °C/100 h) conditions and after isothermal oxidation in air at 800 and 1200 °C. There was macrosegregation in the cast alloy, in which the Nbss formed at a low volume fraction and was not stable after heat treatment at 1400 °C. The βNb5Si3, A15-Nb3Sn, and C14-NbCr2 were stable phases. The alloy did not undergo pest oxidation at 800 °C, and there was no spallation of its scale at 1200 °C. There was enrichment in Ge and Sn in the substrate below the scale/substrate interface, where the compounds Nb3Sn, Nb5Sn2Si, (Ti,Nb)6Sn5, and Nb5Ge3 were formed. After the oxidation at 1200 °C, the solid solution in the bulk of the alloy was very Ti-rich (Ti,Nb)ss. Improvement of oxidation resistance at both temperatures was accompanied by a decrease and increase, respectively, of the alloy parameters VEC (valence electron concentration) and δ, in agreement with the alloy design methodology NICE (Niobium Intermetallic Composite Elaboration). The elimination of scale spallation at 1200 °C was attributed (a) to the formation of Ti-rich (Ti,Nb)ss solid solution and (Ti,Nb)6Sn5, respectively, in the bulk and below the scale, (b) to the low concentration of Cr in the scale, (c) to the absence of GeO2 in the scale, (d) to the formation of αAl2O3 in the scale, and (e) to the presence (i) of Nb5Ge3 below the scale/substrate interface and (ii) of oxides in the scale, namely, SiO2, Al2O3, TiO2, and SnO2, and Ti2Nb10O29,TiNb2O7, and AlNbO4, respectively, with a range of intrinsic thermal shock resistances and coefficient of thermal expansion (CTE) values that reduced stresses in the scale and the substrate below it.

1. Introduction

Refractory metal intermetallic composites (RMICs) are considered to be potential replacements for Ni-based superalloys in future aero-engines owing to their higher solidus temperatures compared with Ni, and their promise of meeting property goals [1,2,3]. Nb-silicide-based alloys (also known as Nb-silicide in situ composites, Nb-silicide-based composites, or Nb in situ composites) can be cast and can offer low densities with outstanding balance of mechanical properties at temperatures between 1000 and 1400 °C coupled with oxidation resistance [1,4,5,6,7]. The latter was improved significantly to meet industry requirements for oxidation behavior at intermediate and high temperatures [2,3,8]. These new materials could be considered for practical applications provided they offer an optimum balance of mechanical and oxidation properties.
In multicomponent Nb-silicide-based alloys, the most common phases are alloyed Nbss (cI2-W), Nb3Si (tP32-Ti3P), αNb5Si3 (tI32-Cr5B3), βNb5Si3 (tI32-W5Si3), and C14-NbCr2 (hP12-MgZn2) [2,9,10]. In the alloys that were studied to date, as many as 18 elements (Al, B, Ce, Cr, Fe, Ga, Ge, Hf, Ho, Mo, Si, Sn, Ta, Ti, V, W, Y, Zr) were used, albeit not all 18 in the same alloy. Some of these additions are believed to be essential for specific roles, i.e., some for oxidation resistance, others for high temperature strength and creep, and others for fracture toughness while some are thought to be required for more than one of these properties. Alloy chemistry and processing history are important for the type, volume fraction, size, and spatial distribution of phases in the microstructure, as well as for their properties [10]. For example, the alloying of the Nbss can improve high-temperature oxidation resistance without compromising other high-temperature mechanical properties [11,12,13], and the alloying of Nb5Si3 and C14-NbCr2 Laves phase can change the hardness and creep properties of these compounds [9,14,15].
It is well known that specific alloying additions in Nb enhance its oxidation resistance [11,16,17]. The latter increases with additions of Al, B, Cr, Ge, Hf, Mo, Si, Sn, and Ti in Nb-silicide-based alloys [5,10,18,19,20,21,22,23,24,25,26], in which Si is the key addition needed to form silicide(s) and for oxidation. Silica can be stable to higher temperatures than alumina, has a lower activation energy for oxygen diffusion, and could be more effective than alumina at higher temperatures [27]. Amorphous silica has some fluidity to heal cracks in the scale. Alumina is crystalline with virtually no fluidity. The oxides of the alloying elements Al, Hf, and Ti are even more thermodynamically stable than silica. The latter has virtually no solubility with Nb2O5 in the solid state. B2O3 or GeO2 in silica gives (a) a glass with lower viscosity at low temperatures where the resulting higher fluidity can improve the self-healing of the scale, and (b) a higher coefficient of thermal expansion (CTE) than pure silica [28]. The Nb-silicide-based alloys form complex oxide scales during oxidation [10,18,22,23,25,26,29]. The binary phase diagrams for these oxides with Nb2O5, which has a lower (about 1550 °C) melting point than Nb (2477 °C), indicate eutectic formation [30], which requires that the maximum useful application temperature should be lower that the eutectic temperatures.
The ability to cast Nb-silicide-based alloys is a great advantage over other RMICs [4]. However, owing to their very high liquidus temperatures, cold hearth processing is required, and macrosegregation can be severe in these materials depending on alloying additions [31]. Tin, Ge, or B have a strong effect on macrosegregation [32,33,34,35,36]. The additions of Sn or Ge, which can play a key role in the suppression of pest oxidation [2,20,21,22,32,33,37,38], can also reduce the alloy liquidus temperature, depending on their concentration and other alloying elements, for example, Al, Cr, Hf, Mo, and Ti. It is believed that their role in the alloy to achieve a balance of mechanical and oxidation properties depends on their concentration in the alloy. For example, it was suggested [2,37] that Sn can be effective at concentrations up to 2 at.% and that, at this “low” content, the A15-Nb3Sn compound is not stable. This was recently shown not to be the case [32].
Research on the oxidation of Nb-silicide-based alloys considered alloys where Sn or Ge was individually or simultaneously in synergy with Al, Cr, Si, and Ti, plus Hf and other transition and refractory metals. For example, Menon et al. [18] studied the alloys Nb-19.9Ti-19.7Si-4.2Ge-3.3Al-4.2Hf-9.9Cr, Nb-26Ti-12.6Si-4.9Ge-1.9Al-1.9Hf-6.7Cr-0.4Sn, and Nb-25.5Ti-14.9Si-4.5Ge-6.1Cr-1.6Hf-1.9Al-1.6Sn, Chan [19] studied the Nb-(21.5–26.6)Ti-(1–17.3)Si-(2.5–15.6)Cr-(2–4.7)Hf-(3–5.1)Ge alloys, Geng et al. [20] studied the alloy Nb-24Ti-18Si-5Al-5Cr-2Mo-5Hf-5Sn, Vellios [21] studied the alloys Nb-23Ti-5Si-5Al-5Hf-5V-2Cr-2Sn and Nb-30Ti-10Si-5Cr-5Sn-3Fe-2Al-2Hf, and Knittel et al. [22] studied the alloys Nb-25Ti-16Si-8Hf-2Al-2Cr-xSn (x = 0, 2, 4, 5, 6, 8) (all concentrations in at.%). More simple alloys were studied by Xu et al. [32,33] and Li and Tsakiropoulos [34,38], who sought to advance current understanding about how the synergy of Sn or Ge with Al and/or Cr improves the oxidation of Nb-24Ti-18Si-based alloys.
In Nb-silicide-based alloys the solubility of Sn in the solid solution is higher than in the Nb5Si3, and the opposite is the case for Ge [14,34,35]. In the Nb5Si3, the solubilities of Ge or Sn increase with the Ti concentration in the silicide [14]. Furthermore, the solubility of Si plus the elements that substitute it in Nb5Si3 decreases below the stoichiometric Si concentration in binary Nb5Si3 when Ge or Sn is in the solution as an individual addition [14]. The alloying of Nb5Si3 with Ge or Sn respectively increases and decreases the hardness compared with the binary silicide [14]. Tin in synergy with Al and Cr in Nb-24Ti-18Si-based alloys without Hf and other transition and refractory metals promotes the βNb5Si3→αNb5Si3 transformation [32,33]. The same is the case when Ge is in synergy with Al, Cr, and Hf without transition and refractory metals [34], but not the case without Hf and other transition and refractory metals [34]. The type of Nb5Si3 in the microstructure is important owing to the different properties and CTE of the binary and alloyed βNb5Si3 and αNb5Si3 silicides [14,39].
The studied concentration ranges of Sn and Ge additions in Nb-silicide-based alloys were wider for the former (2 to 8 at.%), compared with the latter [18,19,20,21,22,32,33,34,35]. The replacement of Si with 5 at.% Ge in the alloys studied by Menon et al. [18] appeared to have a remarkably favorable influence on the onset of breakaway oxidation, which was delayed by at least one order of magnitude in time. The addition of 5 at.% Ge in Nb-24Ti-18Si-5Cr-5Al-5Ge (alloy ZF6 in Reference [34]) suppressed the pest oxidation but not the oxide scale spallation at high temperature [38]. The same was the case in the Nb-24Ti-18Si-5Al-5Cr-2Sn (alloy ZX7 in Reference [32]) and Nb-24Ti-18Si-5Al-5Cr-5Sn (alloy ZX8 in Reference [33]. In other words, alloying with Sn suppresses pest oxidation at low (2 at.%) and higher concentrations but not the spallation of the scale at high temperatures [22,32,33]. The addition of Ge has the same effect as Sn [19,38]. Spallation of the scale occurred in the alloys that were studied by Menon et al. [18].
The Nbss is the Achilles’ heel in the oxidation of Nb-silicide-based alloys. The literature suggests that Sn can affect the stability of the Nbss in Nb-silicide-based alloys [33,35]. For example, alloying with Sn destabilized the Nbss in the alloy ZX6 (Nb-24Ti-18Si-5Al-5Sn) [33] and in Nb-18Si-5Al-5Sn (alloy EZ7 in Reference [35]) but Ge did not have a similar effect on the Nbss in Nb-24Ti-18Si-based alloys where Al or Cr was present individually or simultaneously or where Ge was in synergy with Al, Cr, and Hf in the alloy [34,40,41]. The Nbss was stable in the alloys Nb-23Ti-5Si-5Al-5Hf-5V-2Cr-2Sn and Nb-30Ti-10Si-5Cr-5Sn-3Fe-2Al-2Hf [21]. No solid solution was observed in the as-cast Nb-22.5Ti-17.3Si-15.6Cr-4Hf-4.8Ge, but the Nbss was stable (22 vol.%) after heat treatment (HT) at 1350 °C/100 h [19]. The Nbss was present in the cast alloys Nb-19.9Ti-19.7Si-4.2Ge-3.3Al-4.2Hf-9.9Cr and Nb-26Ti-12.6Si-4.9Ge-1.9Al-1.9Hf-6.7Cr-0.4Sn that were studied by Menon et al. [18].
The research on the oxidation of Nb-silicide-based alloys would suggest (a) that Ge and/or Sn are needed to suppress pest oxidation, and (b) that, when these alloying additions were present individually or simultaneously in the alloys, the spallation of their scales at high temperatures was not suppressed. It is now well established that Ge or Sn has an effect on macrosegregation and can also reduce the liquidus temperature of the alloy. Alloying with Sn can affect the stability of the Nbss but not the alloying with Ge, which can, however, significantly reduce the cracking of the substrate below the scale/substrate interface [38]. Unfortunately, from the oxidation research on multicomponent Nb-silicide-based alloys, it is not clear whether it was the synergy of Sn or Ge individually or simultaneously with Al, Cr, Si, and Ti that improved oxidation resistance, or whether the presence of oxygen scavenging Hf with/without transition and refractory metals and with some or all of the aforementioned elements was essential for increasing the oxidation resistance.
There is a significant cost difference for Ge and Sn; for example, the cost of the former is in the range $1550 to $1750 per kg compared with about $80 per kg for the latter. Do we need both these elements in Nb-silicide-based alloys to improve their oxidation resistance? What would be the effect of the simultaneous presence of Ge and Sn and the Ge/Sn ratio in Nb-silicide-based alloys on (i) macrosegregation, (ii) pest oxidation, (iii) scale spallation, (iv) Nbss stability, (v) the βNb5Si3 → αNb5Si3 transformation, and (vi) the microstructure of the substrate below the scale/substrate interface?
The motivation for the research presented in this paper was to answer these questions. We selected a model alloy based on the (reference) alloy Nb-24Ti-18Si-5Al-5Cr (alloy KZ5 in Reference [42]) with Ge/Sn = 1 and equal concentrations of Ge and Sn, each at 5 at.%, guided by the research reported in References [10,33,38], to assist us to understand how Ge and Sn “work together”. The nominal composition (at.%) of the alloy was Nb-24Ti-18Si-5Al-5Cr-5Ge-5Sn (alloy OHS1), and it was compared with the reference alloy KZ5 and the equivalent alloys with only Sn (Nb-14Ti-18Si-5Al-5Cr-5Sn, alloy ZX8 in Reference [33]) or Ge (Nb-24Ti-18Si-5Al-5Cr-5Ge, alloy ZF6 in Reference [34]) addition. The alloy was prepared using arc melting, the same as for the alloys KZ5, ZX8, and ZF6.
The structure of the paper is as follows: firstly, the microstructures of the cast and heat-treated alloy are discussed, followed by the results for its isothermal oxidation at 800 °C and 1200 °C. The discussion firstly considers the macrosegregation in the cast alloy, then its microstructure and the stability of phases, followed by the discussion of oxidation and the structures of the scales. The research breakthrough presented in this paper is the prevention of scale spallation at 1200 °C by the synergy of Ge and Sn with Al, Cr, Si, and Ti in the alloy OHS1.

2. Experimental

The alloy was prepared in the form of small buttons in a Ti-gettered Ar atmosphere using arc melting with a non-consumable tungsten electrode. The charge of pure elements (≥ 99.9 wt.% purity) was placed in a water-cooled copper crucible and was melted five times. For the heat treatment (1400 °C/100 h, consistent with the conditions used for the alloys KZ5, ZX8, and ZF6 [33,34,42]), the alloy was wrapped in Ta foil and placed in an alumina crucible in a calibrated alumina tube furnace where it was heat-treated under a constant flow of Ti-gettered Ar.
The microstructures were characterized using scanning electron microscopy (SEM) and powder X-ray diffraction (XRD). For the former, Jeol JSM 6400 SEM and Inspect F FEG SEM were used. The microstructures were studied in back-scattered electron (BSE) mode with EDS (energy dispersive spectrometry) microanalysis of the alloy and phases. EDS standardization was performed using, as standards, specimens of high-purity Nb, Ti, Cr, Si, Al, Ge, Sn, Co, and Al2O3 that were polished to 1-μm finish. The EDS was calibrated prior to analysis with the Co standard. At least five large-area analyses were performed in the top, bulk, and bottom of the button, and at least 10 analyses were obtained from each phase with size ≥5 μm to determine actual compositions.
For the identification of phases in the bulk of the alloy, a Siemens D500 diffractometer with CuKα radiation (λ = 1.540562 Å), 2θ from 20°–120°, and a step size of 0.02° was used. For the characterization of the surfaces of the oxidized alloy, we used glancing-angle XRD (GXRD) with a Siemens D5000 diffractometer with Cu Kα1 and Kα2 radiation (λ = 1.54178 Å), 2θ from 10°–100°, and a step size of 0.02°. Peaks in the diffractograms were identified by correlating data from the experiments with that from the JCPDS data (International Center for Diffraction Data). The scan type used for GXRD was detector scan, while that for bulk specimens was locked coupled. Prior to GXRD experiments, the glancing angle γ was selected with the aid of the AbsorbDX software, which evaluates the X-ray penetration depth for particular glancing-angle conditions.
The isothermal oxidation of the alloys was studied at 800 and 1200 °C for 100 h using a Netzsch STA F3 TG/DSC analyzer with an SiC furnace, with air flow rate of 20 mL/min, and with heating and cooling rates of 3 °C/min. Cubic specimens of size 3 × 3 × 3 mm3 and polished to 800-grit SiC finish were used for the thermogravimetry (TG) experiments. Weight change data such as those reported here were analyzed by using the equation ln(Δw) = lnK + nlnt, where Δw = Δm/A is the weight change per unit area, K is the reaction rate constant that embodies the sum of reaction rates, Δm is the weight change, A is the surface area before exposure, t is the oxidation time, and n is a constant. The oxidation reaction kinetics was then characterized as linear or parabolic depending on the value of n. If there was more than one mechanism involved, the corresponding section was evaluated to determine the oxidation kinetics from the equation Δ w   =   k l · t for linear oxidation and Δ w 2   =   k p · t for parabolic oxidation, where kl is the linear rate constant and kp is the parabolic rate constant [43].

3. Results

3.1. As-Cast Alloy

The actual composition (at.%) of the as-cast alloy (OHS1-AC) was Nb-23Ti-18.5Si-4.4Cr-4.7Al-5Ge-4Sn. This was the average of all the analyses taken from the top, center, and bottom of the button. The average Sn concentration was lower than the nominal one owing to loss of Sn via evaporation during melting. The macrosegregation of Si was stronger than that of Ti. There was also weak macrosegregation of Al, Cr, and Sn. The typical microstructures are shown in Figure 1.
According to the XRD data (Figure 2), the phases present in the microstructure were the Nbss, C14-NbCr2, Nb3Sn, βNb5Si3, and γNb5Si3. The primary Nb5Si3 had Ti segregation at its boundaries (Ti-rich Nb5Si3). The Nb3Sn exhibited bright contrast, was observed in the inter-dendritic areas, and also had Ti-rich regions that exhibited dark-gray contrast. The C14-NbCr2 Laves phase exhibited the darkest contrast. The chemical compositions of the phases are given in the Table 1. These are the averages of all the analyses taken from the top, center, and bottom of the button.
The Nbss and C14-NbCr2 Laves phase were present at low volume fractions and were observed in the areas of dark contrast, where it was not possible to observe grain or phase boundaries. The analysis data for the Laves phase is in agreement with that from previous research [15,44]. It is likely that the analysis data of the Nbss is not accurate owing to the size of this phase. The Nbss was rich in Ti, with the concentrations of the latter in agreement with previous research [42,45,46], but unusually rich in Cr, the concentration of which was higher than the maximum solid solubility of Cr in Nb (about 24 at.%). According to previously published data about the Nbss, for the Ti concentration given in the Table 1, the Cr content should be about 15 at.% [45]. The high Si concentration in the Nbss was out of step with most of the data in the literature but in agreement with the data for the Nbss in Ta containing Nb-24Ti-18Si-5Al-xCr-6Ta alloys (x = 5, 8) [46]. The solid solubility of Si in Nbss is, in general, higher in Sn- or Ge-containing Nb-24Ti-18Si-based alloys [32,33,34], compared with alloys without these two elements. The solubility for Ge or Sn in the Laves phase was very low and slightly lower than that in alloys with only Sn [32,33] or Ge [34,40] additions.
The microstructure in the top of the button was finer than that in the bulk, and it was more homogeneous in the bottom compared with the bulk and top. In the bottom, the same phases were present (Figure 1b), but with a higher volume fraction of the dark-contrast regions compared with the top and bulk of the button. In addition, a eutectic was observed in areas of black contrast. The average composition of the eutectic was 23.5Nb-33.5Ti-5.2Si-25.1Cr-7.7Al-1.8Ge-3.2Sn with Si + Al + Ge + Sn = 17.9 at.%, a value that is close to that of the Nb + Nb3Si eutectic in the Nb–Si binary [47].
The scrutiny of the eutectic was not easy owing to its fine structure. It is not possible to exclude the presence of the eutectic in the dark contrast areas in the top and bulk, where the average composition of the “eutectic” was 23.2Nb-27.5Ti-6.8Si-32Cr-6.7Al-1.3Ge-2.5Sn, considerably richer and poorer in Cr and Ti respectively, compared with the eutectic in the bottom, but with essentially the same Al + Si + Ge + Sn content (17.3 at.%). In the bottom of the button, the concentrations of elements in the eutectic were in the ranges (22.7–24)Nb-(30.6–35.9)Ti-(4.6–5.8)Si-(22.3–26.9)Cr-(7.2–8.3)Al-(1.5–2)Ge-(2.7–3.5)Sn, with the highest values giving Al + Si + Ge + Sn ≈ 20 at.%. The latter is close to the composition of the metastable Nbss + βNb5Si3 eutectic [48].

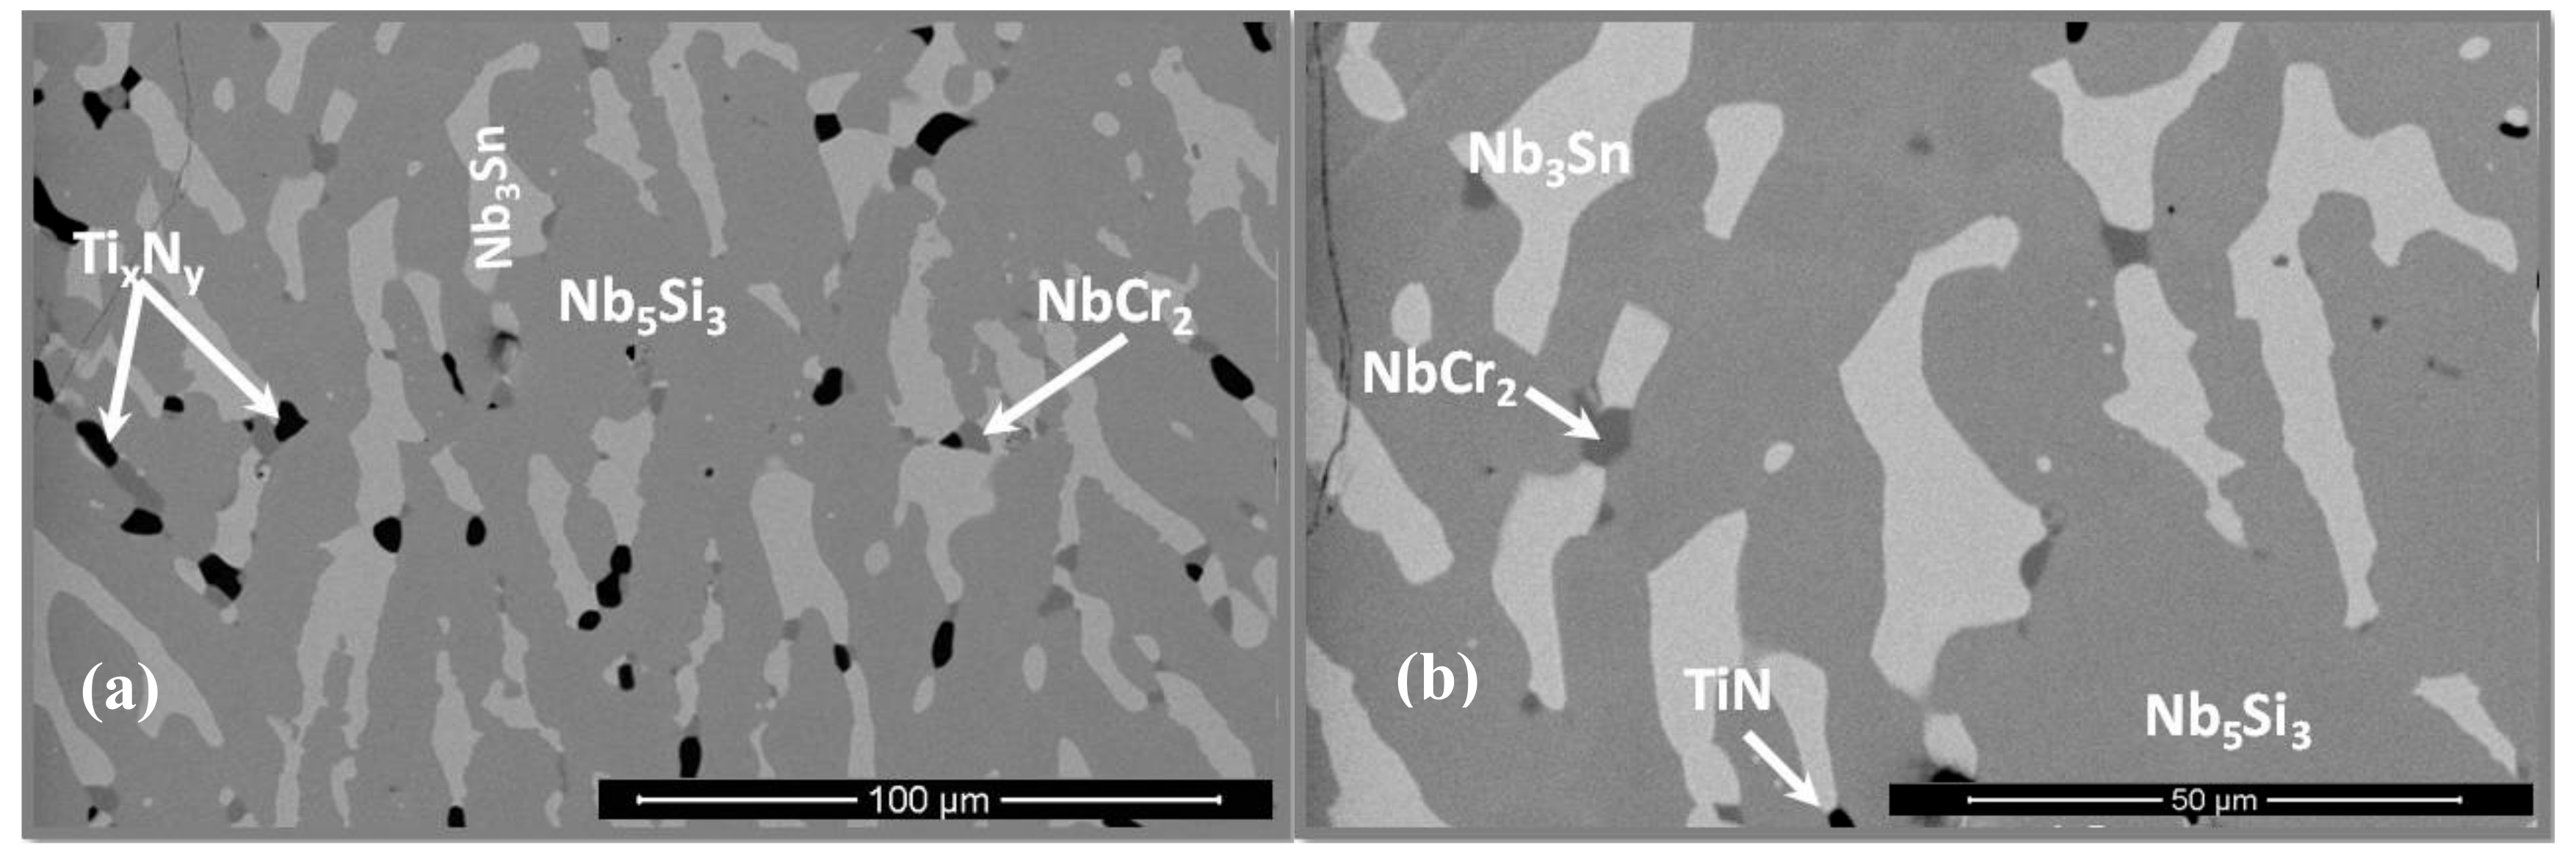
3.2. Heat-Treated Microstructure

The actual composition of the heat-treated alloy (OHS1-HT) was Nb-24Ti-18Si-4.4Cr-4.7Al-5.1Ge-4.2Sn. The same phases were present as in the as-cast alloy with the exception of the solid solution (Figure 2). The microanalysis data are given in Table 2. These are the averages of all the analyses taken from the top, center, and bottom of the button. Weak chemical inhomogeneity of Si was still present. Figure 3 shows the typical microstructure. Detailed study of OHS1-HT in the SEM using microanalysis did not confirm the presence of Nbss, in agreement with XRD (Figure 2). In the Nb5Si3 matrix, there were coarsened and elongated grains of Nb3Sn that in some areas were connected with the Laves phase. Contamination of the alloy by nitrogen resulted in the formation of TiN that exhibited black contrast. The Ti content in the Nb3Sn was essentially unchanged, but the Si + Al + Ge + Sn concentration increased to 23.4 at.%. In the Nb5Si3, the Ti concentration increased and the Si + Al + Ge + Sn concentration decreased slightly compared with the as-cast alloy (Table 1 and Table 2). No evidence of the prior eutectic microstructure was found in OHS1-HT.

3.3. Oxidation

The alloy did not pest at 800 °C and formed an uneven thin adherent scale. There was no spallation of the scale at 1200 °C, where the specimen was completely covered by a light-brown scale. The isothermal oxidation data are shown in Figure 4, and the oxidation kinetics data are given in Table 3. For the isothermal oxidation at 800 °C, the n value was 0.46, meaning that the oxidation was parabolic. The decrease and increase in weight shown by the TG data in Figure 4a would suggest that the scale that formed at 800 °C was not stable. The alloy showed improved oxidation at 800 °C compared with linear oxidation of the alloy KZ5 which gained 30 mg/cm2 in weight after 85 h at 800 °C [23]. The oxidation at 1200 °C was described by a parabolic mechanism during the first 3.1 h, followed by a linear mechanism until 76.7 h, when the experiment stopped. The n = 0.83 value would suggest that overall the oxidation was linear.

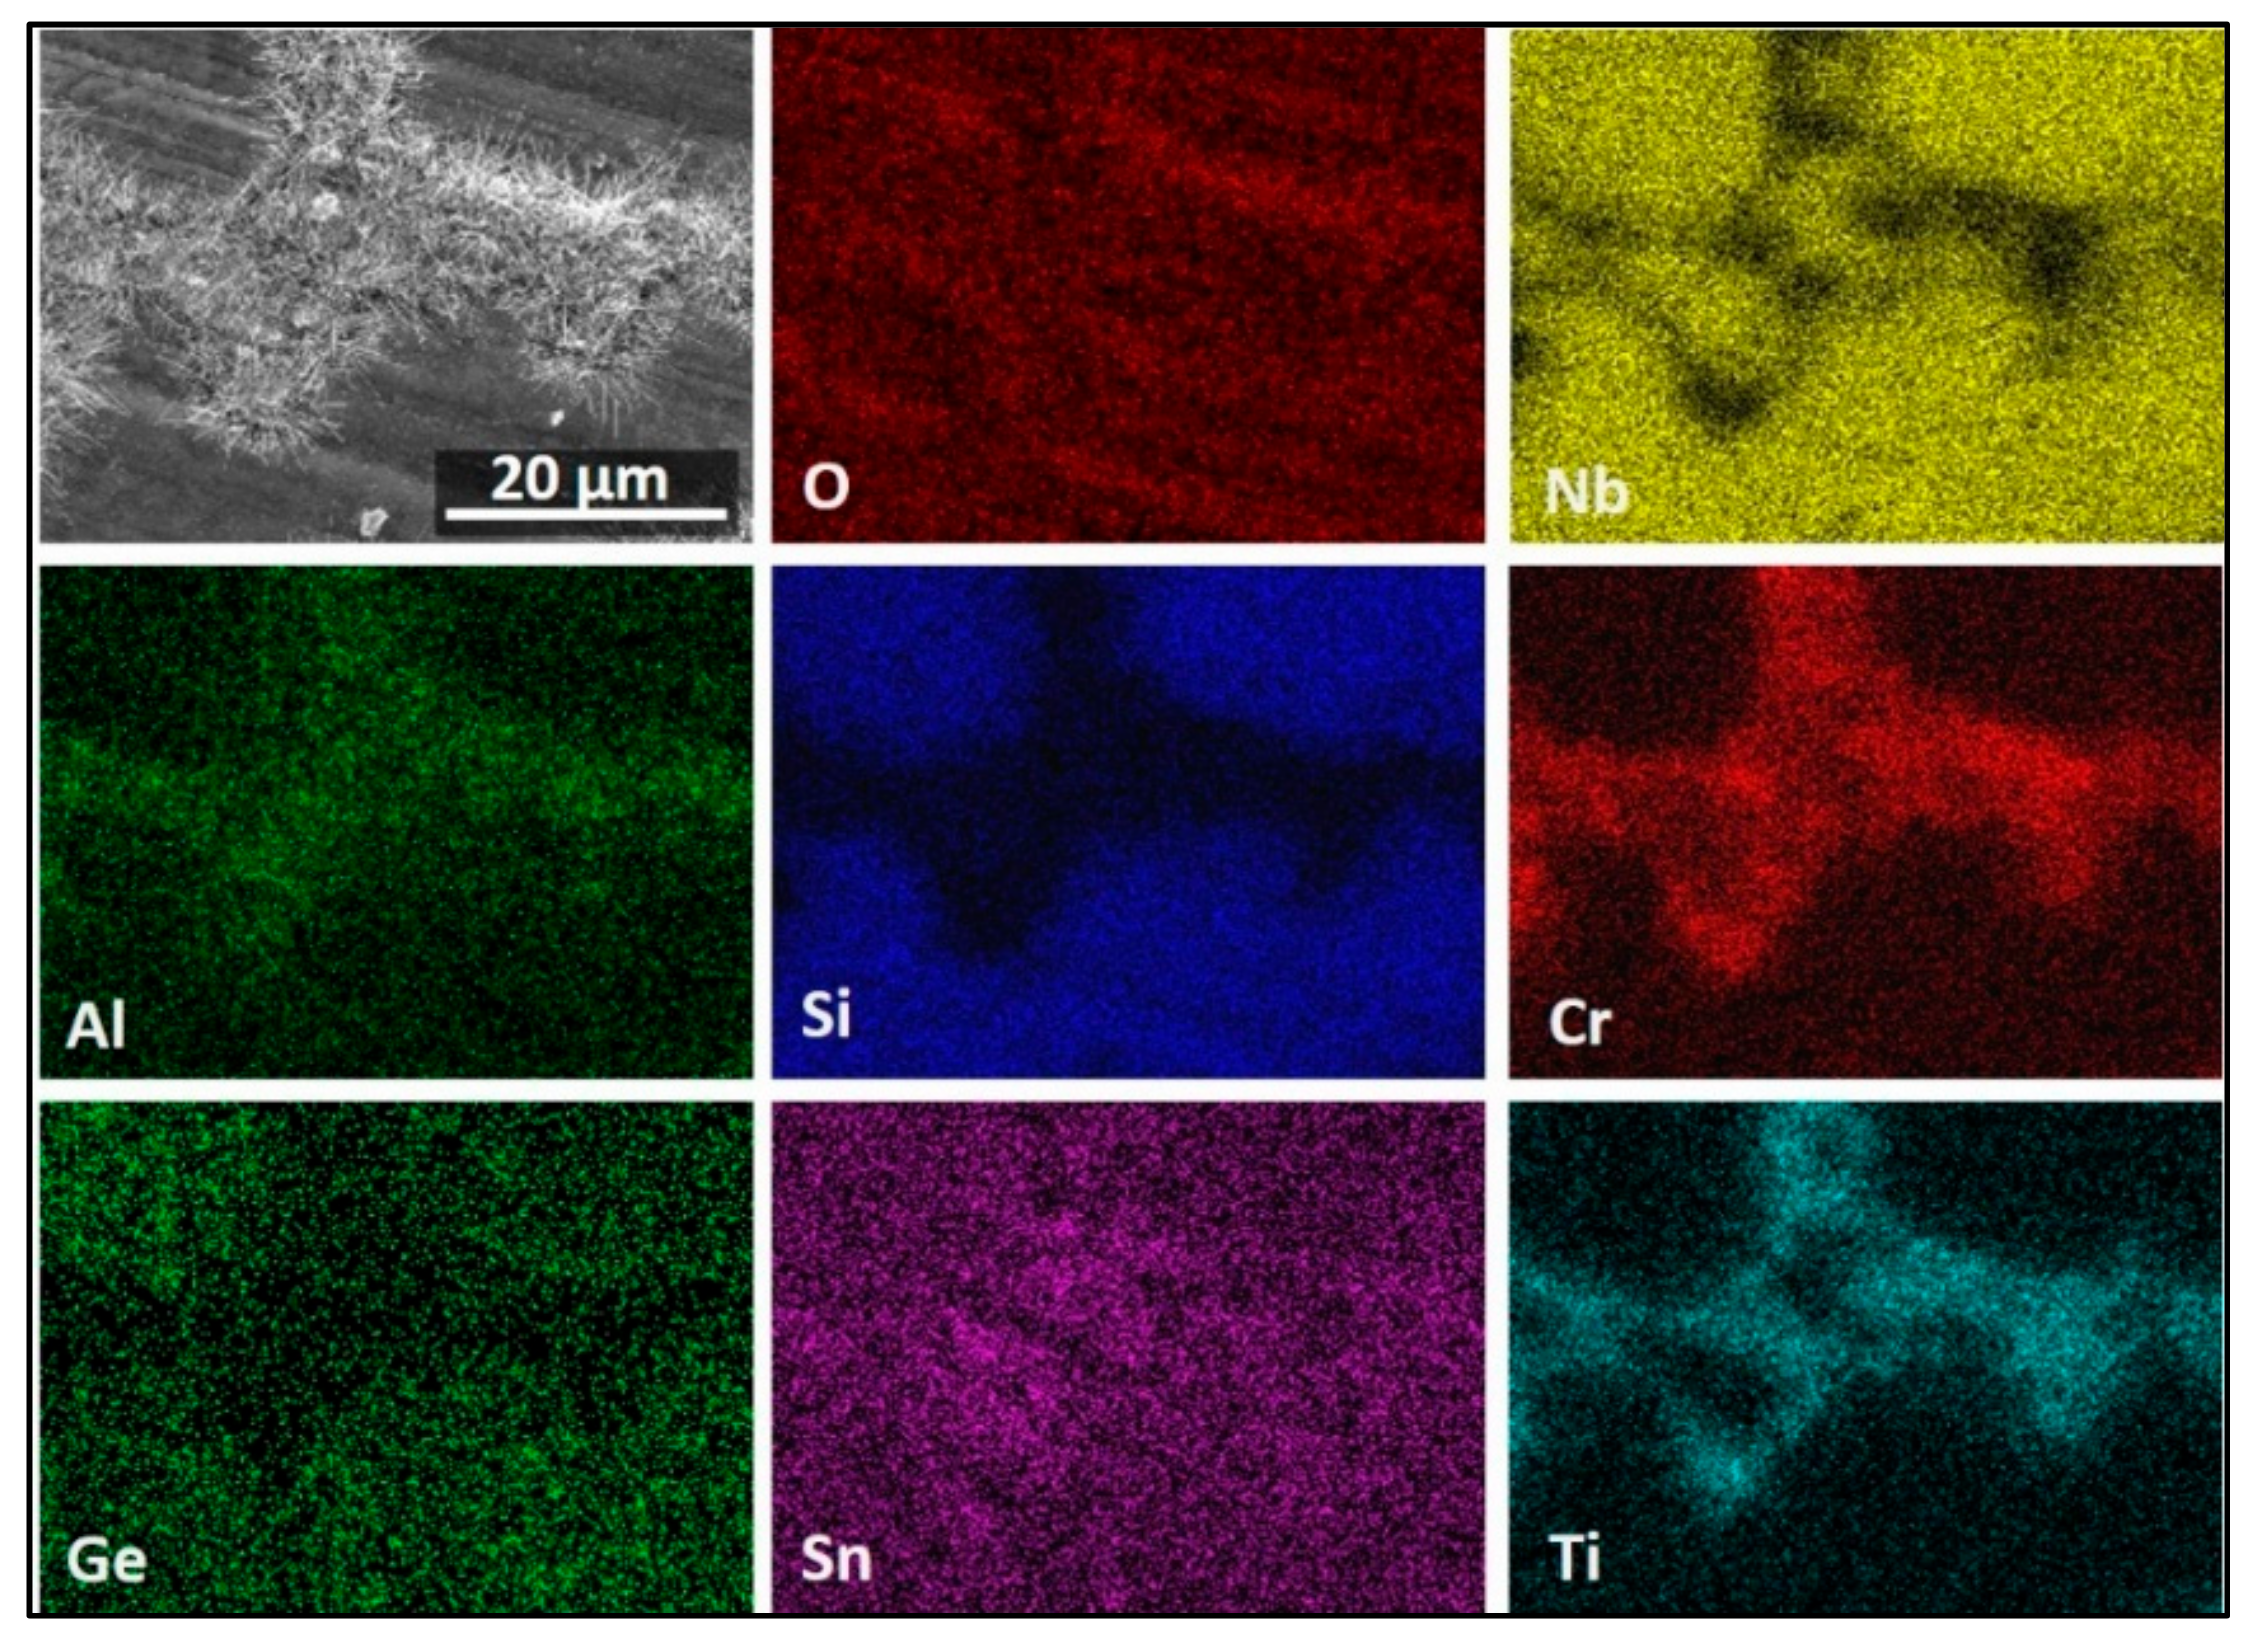
3.4. The Scale at 800 °C

Three main features were observed in the scale surface, namely, a flat oxide with small round oxide particles that mostly formed in the polishing marks, oxide whiskers, and bright lumps that developed around the oxide whiskers (Figure 5). Figure 5a,b show the scale surface under secondary electron (SE) and BSE imaging conditions, respectively. The scale on top of the Nb5Si3 silicide was thin. However, the apparently adherent scale presented some buckling near the grain or phase boundaries (Figure 5b). The length of the oxide whiskers was about 10 µm.
The GXRD data indicated (a) that the scale was composed of TiO2 (tetragonal, P42/mnm) TiNbO4 (tetragonal, I-4m2), Nb2O5.GeO2 (pseudo orthorhombic), SiO2 (tetragonal, P41212), CrNbO4 (tetragonal, P42/mnm), SnGeO3 (monoclinic, P2/c), Ti2Nb10O29 (orthorhombic, Amma), and TiNb2O7 (monoclinic, C2/m) (Figure 6a), (b) that there were different titanium niobates formed as a result of the reaction of TiO2 with niobium oxides depending on their availability in different regions, and (c) that peaks from the Nb3Sn and βNb5Si3 phases were present in the substrate. The X-ray elemental maps (Figure 7) confirmed that the flat oxide grew on top of Nb5Si3 while the whiskers and the bright oxide lumps were formed over the area in between the Nb5Si3 grains, which consisted of Nb3Sn, NbCr2, and Nbss. The oxide grown on top of Nb5Si3 was rich in Ge and Sn.
The cross-section of the oxidized specimen in Figure 8 shows a scale about 2–5 µm thick, and an internal oxidation zone (IOZ) up to 3 µm deep. Some areas of the edge of the specimen presented large cracks parallel to the scale surface suggesting embrittlement; however, this was not common in the specimen. Figure 8 also shows that the microstructure of the scale depended on the oxidized phase. The microanalysis of the oxidized Ti-rich areas (composed of C14-NbCr2 and Nbss) was strongly affected by the oxidation of the Nb3Sn, which was present in the same regions at a higher volume fraction. Apparently, the crisscrossed oxide whiskers were grown from the Ti-rich areas covering some oxide lumps. In the scale, the inter-granular areas presented very particular microstructures. The Nb5Si3 presented a very compact oxide layer in the outermost part of its scale (Figure 8 and Figure 9). According to the chemical analysis, the oxide was rich in Ge and Sn, suggesting that it could be the SnGeO3 oxide whose presence was suggested by the GXRD. The inner part of the scale in these areas was composed of SiO2 and different TixNbyOz compounds, with TiNb2O7 being the most common. The GXRD and qualitative chemical analyses also suggested the presence of the Ti2Nb10O29 compound and a decrease in Nb content toward the scale surface.
The microanalyses confirmed that the Nb3Sn formed a multi-layered complex oxide that consisted of at least three oxide layers; the outermost part contained TiO2 whiskers and (Sn,Ti)O2 lumps, then underneath was a Ti-, Cr-, and Al-rich oxide layer, and just below another oxide layer that was mainly composed of TiNbO4. Some areas of this layer also contained CrNbO4, SiO2, and perhaps some AlNbO4 resulting from the oxidation of the Al-containing Laves phase that was present in the vicinity (Figure 8b). The substrate/scale interface was characterized by the internal oxidation of the Nb3Sn and the formation of (Sn,Ti)O2 precipitates. The average composition (at.%) of these areas was 45O-27Nb-9Ti-10Sn-2Si-1Cr-4Al-2Ge. Just below the IOZ the composition of the Nb3Sn was 44.6Nb-27.2Ti-9.7Sn-3Si-6.9Cr-6.6Al-2Ge.
The scale that formed over the areas where the microstructure consisted of the Nbss, C14-NbCr2 Laves, and Nb3Sn phases was composed of mixed oxides and a convoluted oxide with a very irregular microstructure and dark-contrast grain boundaries (Figure 8a,c), which would suggest that these areas served as the path for the diffusion of oxygen. Around the dark contrast inter-granular areas, multiple micro-cracks were formed on the Nb5Si3, which were parallel to the oxide surface (Figure 8a,c).
In the IOZ, the Ti-rich Nb5Si3 presented very small cracks parallel to the specimen surface. These cracked regions extended up to about 3 µm depth. The concentrations of Nb and Ti in Nb3Sn were reduced, and this compound was oxidized with dark oxide particles dispersed within some of its grains indicating that its oxidation depended on a critical Ti concentration, as the Ti-rich Nb3Sn was not contaminated by oxygen (Figure 8c). Oxygen could have diffused faster through the Nbss that was in the inter-dendritic areas, as dark-contrast particles were observed at different depths. The oxygen penetration depth was mostly associated with the extension of the cracked Nb5Si3 regions, with the cracking of the latter caused by the stresses generated by the oxidation of the Nbss. The Laves phase in the IOZ was not oxidized.
The surface of the scale that formed on top of the Nb5Si3 phase was enriched in Ge and Sn in the outermost part, which is consistent with the high Ge and Sn contents observed in the elemental maps in Figure 7. Toward the inner part of the scale, the main components were the O, Nb, and Ti from titanium niobates. The oxide formed on top of the Nb5Si3 was rich in Si. The oxide formed on top of the three-phase region was rich in Ti and O. In these areas, the whiskers formed. The oxide below the whiskers was rich in Cr, Al, and Ti, followed by an oxide layer rich in O, Nb, and Ti with minimal presence of Ge (Figure 9). The Nb3Sn at the substrate/scale interface was richer in Sn compared with the rest of the alloy.

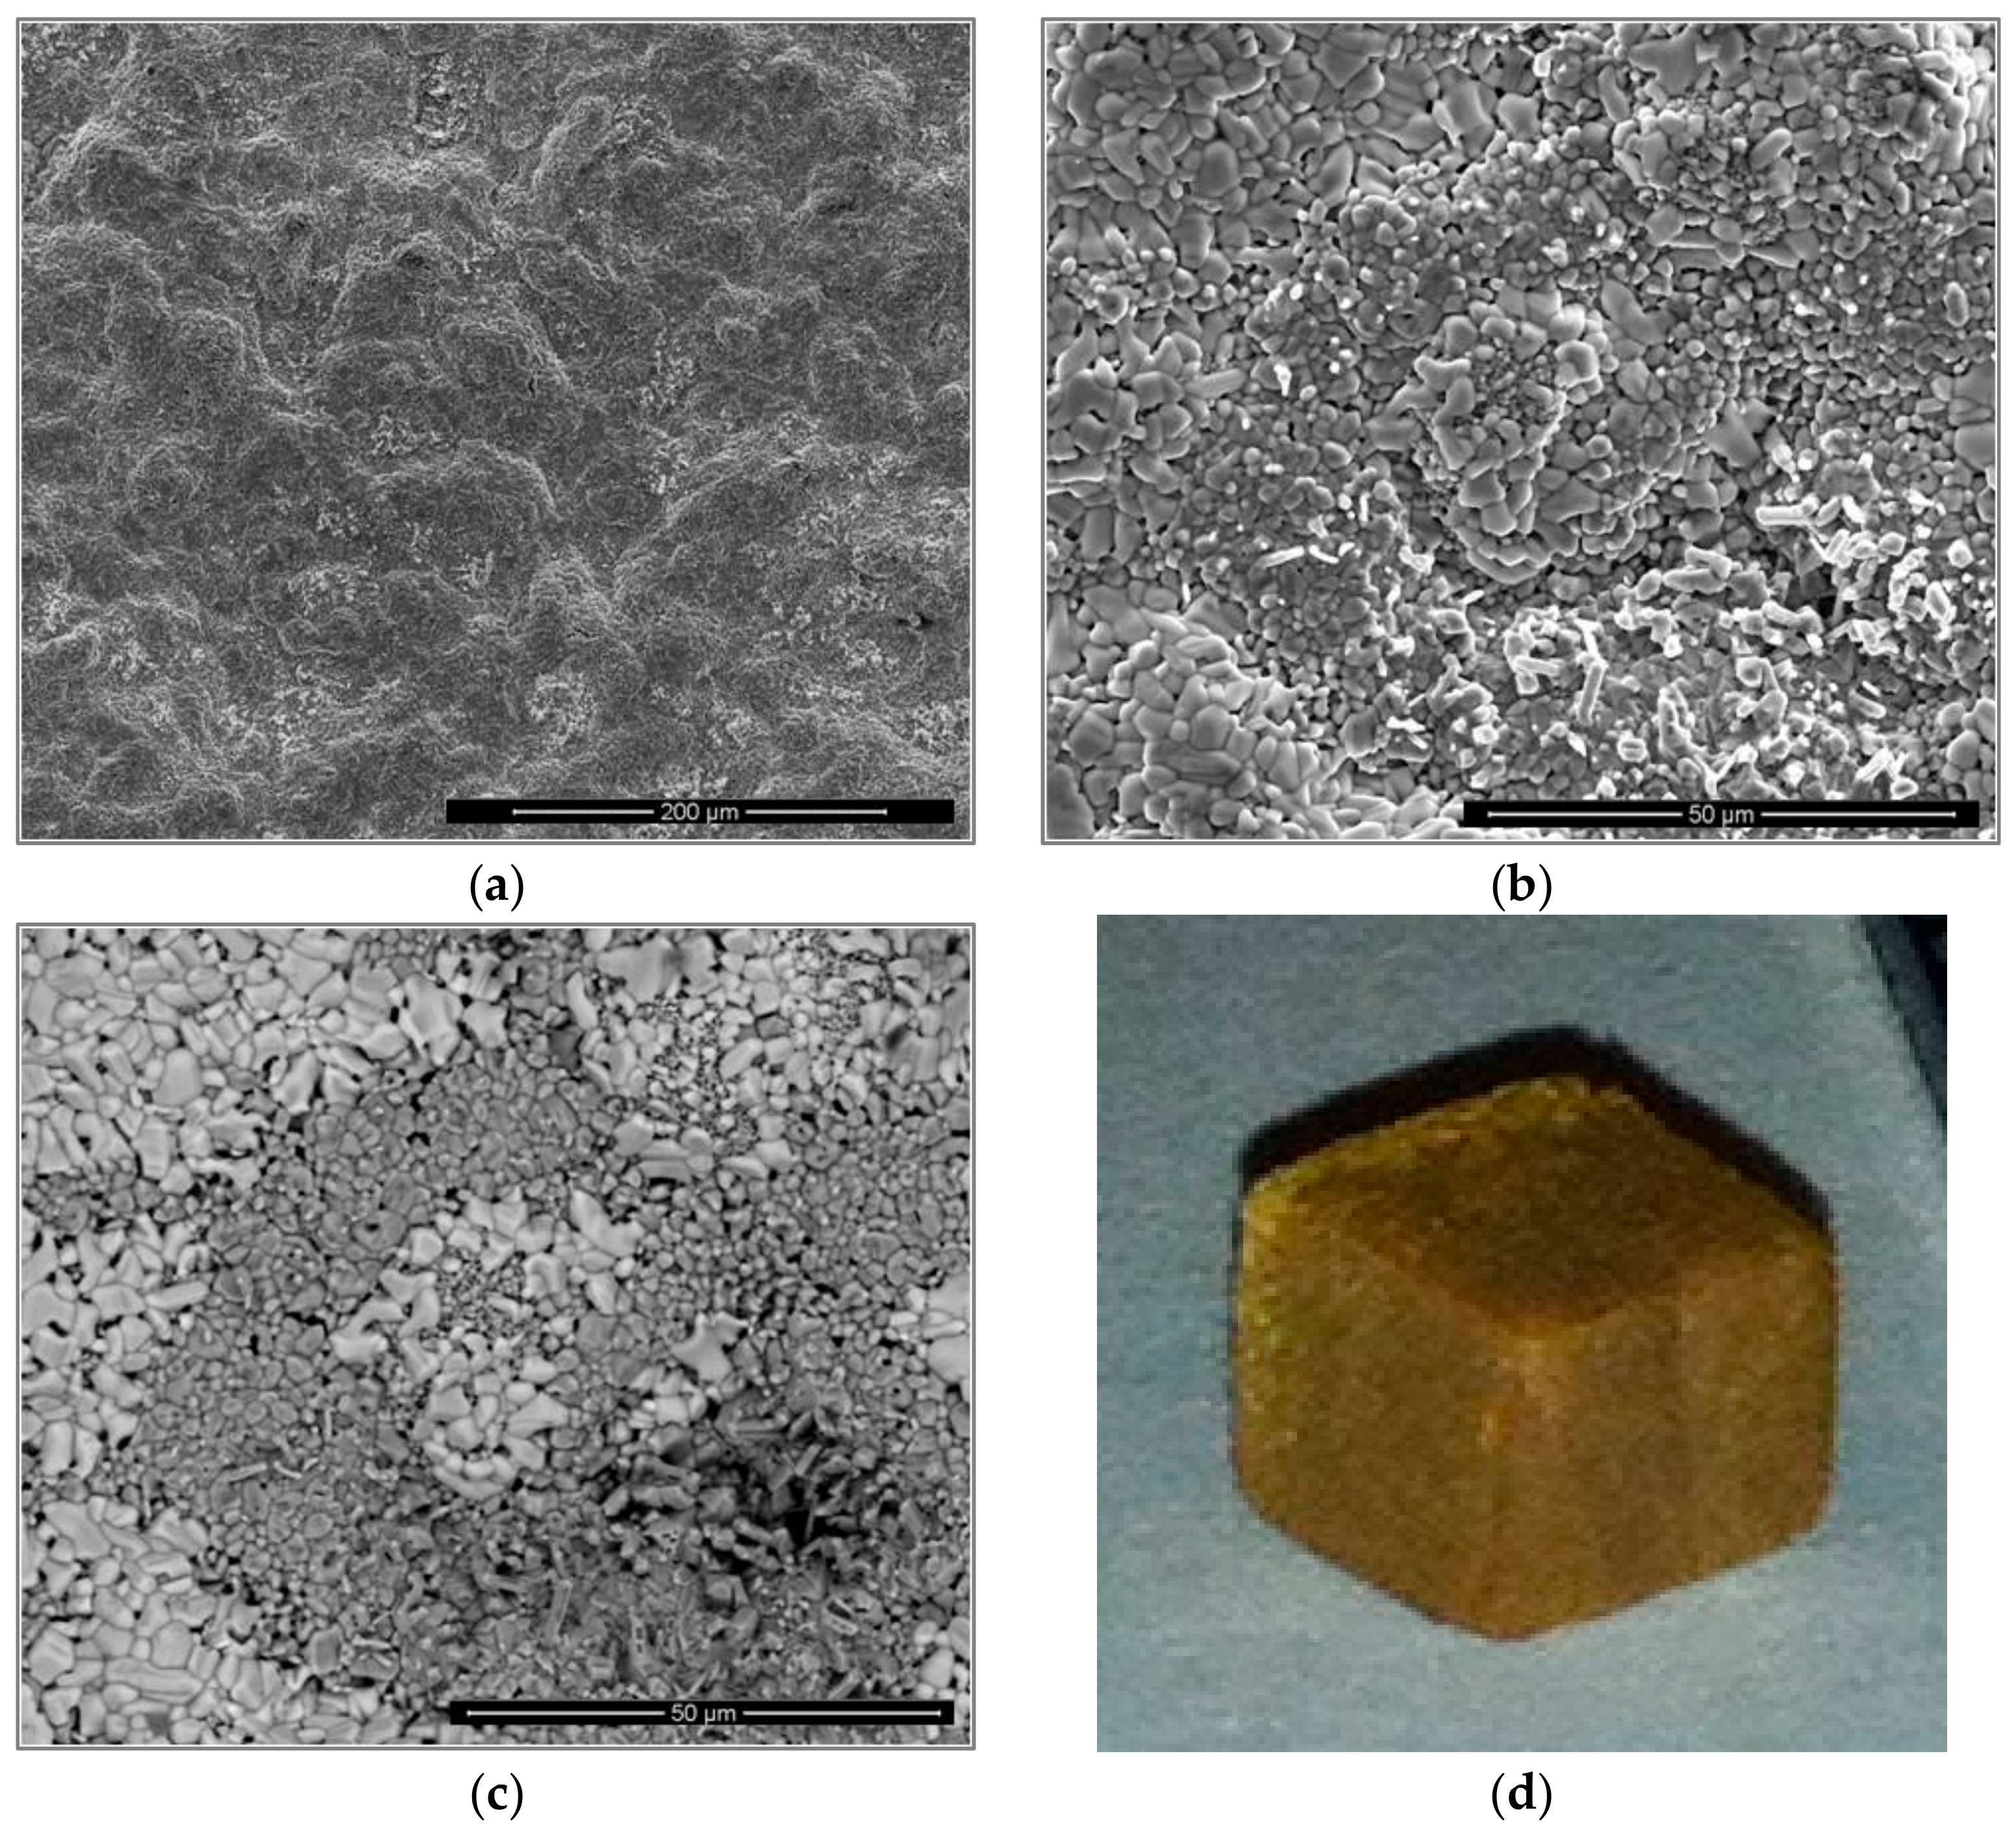
3.5. The Scale at 1200 °C

After the isothermal oxidation in air at 1200 °C, there was no scale spallation; instead, the specimen was covered by a light-brown scale with well-defined edges and some long cracks in the scale (Figure 10d). Typical images of the surface of the scale are shown in Figure 10. The SE image (Figure 10a) shows a continuous and bulged scale with some small cracks. The images in Figure 10b,c show the surface at higher magnification and it is possible to observe particles with different morphology and some porosity. The scale consisted of different oxides (Figure 10c). There were coarse and bright oxide particles, small and dense gray oxide particles, and gray protruding rods.
The GXRD data in Figure 6b indicated that the scale consisted of binary and ternary oxides, namely, TiO2 (tetragonal, P42/mnm), SiO2 (tetragonal, P41212), Ti2Nb10O29 (orthorhombic, Amma), TiNb2O7 (monoclinic, C2/m), TiNbO4 (tetragonal, P42/mnm), AlNbO4 (monoclinic, C2/m), Nb2O5 (pseudo hexagonal, P6/mmm), and αAl2O3 (trigonal, R3c). The GXRD data were compared with microanalysis data taken from the oxidized specimen, and the agreement was good. The highest selected glancing angle was sufficient to detect phases to 200 µm depth. It is likely that some phases at the substrate/scale interface and in the IOZ were undetected because of the thick scale.
The X-ray elemental maps in Figure 11 show an uneven elemental distribution in the scale surface. There was no Ge in the scale surface. The scale over the three-phase areas (NbCr2, Nbss, and Nb3Sn) was rich in Cr, Ti, Al, and Sn. Figure 11 also shows TiO2 in the form of coarse whiskers or rods on top of the three-phase region where there was also Nb, Cr, Al, and Sn. However, the latter could be from oxides formed right below the oxide rods, as it was observed in the scale that formed at 800 °C. There were Nb oxides on top of the Nb5Si3 with low Si on the surface of the oxide. There was high Nb content in all the oxides, but the Nb concentration decreased when the oxides were rich in Ti, Cr, Al, and Sn.
The X-ray elemental maps from a cross-section of the specimen are shown in Figure 12, showing the elemental distribution in the scale, the diffusion zone (DZ), and the substrate. The diffusion zone (DZ) includes the internal oxidation zone (IOZ). We refer to IOZ only when referring to regions where oxygen or nitrogen was present below the scale; otherwise, the term DZ is used.
Figure 12 shows a high Nb, Si, and Ti presence in the scale. The Nb was mostly found in the Ti2Nb10O29 and (Cr,Ti)NbO4 oxides, in agreement with the GXRD data. Low-Nb-content regions near the scale/substrate interface were rich in TiO2 or SiO2. Chromium was found mostly dissolved in the TiNbO4 oxide with higher content at the scale surface. The IOZ was depleted in Cr. There was Si present all over the scale in glassy SiO2 and dissolved in (Ti,Cr)NbO4. The Al content was practically the same in most of the scale and in the substrate; however, in some parts of the scale, the AlNbO4, (Cr,Al)NbO4 and Al2O3 around Ti-rich oxides presented a higher Al content. The scale did not contain Ge but had some Sn in it, and the IOZ presented a considerable enrichment of these two elements, particularly Sn, with a considerable reduction of Cr and Ti contents in these areas.
Microanalyses revealed that the Ge- and Sn-rich regions at the IOZ were the Nb5Ge3, (Ti,Nb)6Sn5, and Nb5Sn2Si phases, although peaks of these compounds were not recorded in GXRD. These compounds were found in areas with strong enrichment (segregation) of Si and Sn. The composition of the (Ti,Nb)6Sn5 was 17.8Nb-33.0Ti-0.3Si-2.5Cr-3.1Al-1.8Ge-41.5Sn. The Nb5Sn2Si had fixed values for Nb and Ti, and its composition was Nb-20Ti-(11.6–17.9)Si-(2.6–3.4)Cr-(1.5–3.3)Al-(5.4–6.3)Ge-(11.8–18.1)Sn. The Nb5Ge3 presented a wide solubility range for Ti, Si, Ge, and Al. When its Ge content was 24.3 at.%, the Ti, Si, and Al contents were 11.3, 13.4, and 0.2 at.%, respectively, and the Nb concentration was 45.8 at.%. When the Ge content was 13.5 at.%, the Ti, Si, and Al concentrations were 34.1, 16.0, and 2.2 at.%, respectively, and the Nb content was 29.1 at.%.
The cross-section images in Figure 13 show a very complex scale. Its thickness was about 300 µm, with a ~150-µm-thick diffusion zone (DZ) in which the IOZ was about 100 µm thick. The scale had porosity, voids, and cracks (Figure 13a). The latter were perpendicular to the surface and extended from the top of the scale to about 100 µm deep into the scale. There were also cracks parallel to the scale surface, but these were mostly found at the substrate/scale interface and did not affect the scale adherence. In the corners and regions near the corners of the specimen, the scale presented better adherence with no cracks.
The data in Figure 13 are consistent with the GXRD. There were at least three main contrasts related to the oxidation of the Nb5Si3 in the scale and, according to the microanalyses, SiO2 (black contrast), Ti2Nb10O29 (bright contrast), and TiNbO4 (dark-gray contrast). The TiNbO4 showed solubility for other elements; it had 2.1 to 5.05 at.% Cr and 1.85 to 4.58 at.% Al, while, in the Ti2Nb10O29, there was some Si solubility. However, the latter could be from its close proximity to SiO2. The oxidation of the Ti-rich areas presented oxides with the rutile crystal structure. The Al2O3, SiO2, and TiO2 oxides were also detected. They were dispersed in some regions within the scale and did not form a continuous scale. The internal oxidation of the alloy was observed along the grain boundaries of the Ti-rich areas.
The numbered BSE images in Figure 13 show the scale microstructure in more detail. The phases were identified with microanalysis and were labeled accordingly. Images with numbers 1–6 correspond only to the scale, while images from 7–11 correspond to the DZ. Image 12 is from an area in the bulk of the alloy and shows that the bulk of the alloy was not oxidized. Figure 14 shows the elemental distribution in the selected area in Figure 13b (within the yellow rectangle). The maps revealed that TixNy and TiO2 formed close to each other at the substrate/scale interface. Apparently, Al2O3, SiO2, and TiO2 were around the TixNy compounds.
The compositions of the phases in the bulk of the alloy were as follows: Nb-20Ti-21.8Si-2Cr-5.5Al-7.8Ge-3.2Sn for the Nb5Si3, Nb-22.8Ti-21.8Si-1.7Cr-4.4Al-6.9Ge-3.3Sn for the Ti-rich Nb5Si3, Nb-21.3Ti-1.8Si-4.4Cr-8.4Al-1.9Ge-10.8Sn for the Nb3Sn, and Nb-58.7Ti-7.8Si-12.1Cr-5.6Al-4.1Ge-1.6Sn for the solid solution, while the Laves phase was Nb-11.6Ti-8.1Si-47.5Cr-4.0Al-1.8Ge. The solid solution was very rich in Ti.

4. Discussion

4.1. Macrosegregation

In OHS1-AC, there was strong macrosegregation of Si and Ti, and weak macrosegregation of Al, Cr, and Sn. For Nb-silicide-based alloys, the macrosegregation of an element i is defined as Cmaxi − Cmini, i.e., as the difference between the maximum and minimum concentrations of element i in the alloy. Macrosegregation of an element i is considered to occur when MACi = Cmaxi − Cmini > 2 at.% [49].
Tsakiropoulos [31] discussed the macrosegregation of elements in cast Nb-silicide-based alloys and linked the macrosegregation of Si with the partitioning of solutes between the key phases, namely, the Nbss, Nb5Si3, C14-NbCr2 Laves, and Nbss + Nb5Si3 eutectic. Tin and Ge are two of the alloying additions that were found to have a strong effect on the macrosegregation of Si [32,33,34,40,41]. The ranking of Nb-silicide-based alloys in terms of increasing Si macrosegregation (MACSi) indicated that the latter tended to increase when the parameters ΔHm/Tm (“alloy entropy of fusion”), Tmsp (melting temperature of sp electronic configuration elements), and [ΔHm/Tm][ΔHmsd/ΔHmsp]−1 increased, and when the ratios ΔHmsd/ΔHmsp and Tmsd/ Tmsp and the parameters ΔHm (“alloy enthalpy of melting”), Tm (alloy melting temperature), and Tmsd (melting temperature of the sd electronic configuration elements) decreased [31].
In Table 4, the alloys KZ5, ZF6, OHS1, and ZX8 are ranked according to their MACSi values. The rational for using these data is as follows: the alloys (nominal compositions) KZ5 (Nb-18Si-24Ti-5Al-5Cr [42]), ZF6 (Nb-18Si-24Ti-5Al-5Cr-5Ge [34]), OHS1 (this work), and ZX8 (Nb-18Si-24Ti-5Al-5Cr-5Sn [33]) show the effects of Ge or Sn added individually and simultaneously in the alloy KZ5. The data for the parameters given in the Table 4 were calculated using the actual compositions of the as-cast alloys from References [33,34,42]. The data in Table 4 show no obvious trends between the parameters mentioned in the previous paragraph, when all four alloys were considered. However, if only the data for the alloys KZ5, ZF6, and OHS1 were considered, then the trends were clear (indicated by arrows), excluding the parameter ΔHm.
We can scrutinize how Al or Cr affects the macrosegregation of Si when they are in synergy with Sn or Ge individually and simultaneously, by considering the data in Table 5 and Table 6. In Table 5, the alloys (nominal compositions) KZ7 (Nb-18Si-24Ti-5Al [42]), ZF5 (Nb-18Si-24Ti-5Al-5Ge [41]), and ZX6 (Nb-18Si-24Ti-5Al-5Sn [33]) are compared with the alloy OHS1 in order to consider what the effects of Ge and Sn are when these elements are added individually or simultaneously in the “basis” alloy KZ7. The data for the parameters were calculated using the actual compositions of the cast alloys from References [33,41,42]. The data in Table 5 show that the aforementioned trends between the parameters were followed, with the exception of the parameter ΔHm, which would suggest (i) that Al, in synergy with Ge or Sn individually, increases the macrosegregation of Si, (ii) that Sn has a stronger effect than Ge, and (iii) that their combined effect is enhanced when Al, Ge, and Sn are present simultaneously in the alloy. What is the role of Cr? To answer this question, we need to consider Table 6.
In Table 6, the alloys (nominal compositions) KZ4 (Nb-18Si-24Ti-5Cr [42]), ZF4 (Nb-18Si-24Ti-5Cr-5Ge [40]), and ZX4 (Nb-18Si-24Ti-5Cr-5Sn [33]) are compared with the alloy OHS1 to consider what the effects of Ge and Sn are when these elements are added individually or simultaneously in the “basis” alloy KZ4. The data for the parameters were calculated using the actual compositions of the cast alloys from References [33,40,42]. The data in Table 6 show that the aforementioned trends between the parameters were followed for the alloys in which Ge or Sn were in synergy with Cr individually (red numbers and arrows in the table), again with the exception of the parameter ΔHm.
The data in Table 6 show that the synergy of Cr with Sn has a stronger effect on (increases) MACSi than that of Cr with Ge (compare KZ4 and ZX4 with KZ4 and ZF4). Furthermore, when the data for the alloy OHS1 were considered, the values of its parameters were “minimum” or “maximum” in the trends established by the synergy of Cr with Ge or Sn individually in the alloys. Table 5 and Table 6 confirm that, compared with Ge, Sn has a stronger effect on MACSi when it is in synergy with Al or Cr individually and that the strong effect of the synergy of Sn with Cr can be “controlled” by adding Ge to the alloy. Thus, the synergy of the alloying additions of Al, Cr, Ge, and Sn in Nb-silicide-based alloys is beneficial not only in terms of oxidation behavior, but also because it reduces the macrosegregation of Si.

4.2. Microstructure

Niobium can form the A15 Nb3Al, Nb3Ge, Nb3Sn, and Nb3Si compounds that have Cr3Si as a prototype [50]; thus, Al, Ge, Sn, and Si would be expected to stabilize the A15 structure. Vellios and Tsakiropoulos [51] showed that the Nb3Sn was stable in as-cast Nb-silicide-based alloys with 5 at.% Sn. This was confirmed by Xu et al. [33] and Knittel et al. [22]. In alloys with up to 5 at.% Ge addition, an A15 phase was not observed [34,40,41,52,53].
The Nb5Ge3 with prototype W5Si3 (i.e., isomorphous with βNb5Si3) is stable at all temperatures, and the Nb5Ge3 with prototype Cr5B3 (i.e., isomorphous with αNb5Si3) is not a stable phase in the Nb–Ge binary [54]. The Nbss + βNb5Si3 eutectic is metastable in the Nb–Si binary. In binary alloys, this eutectic is promoted by solidification at high cooling rates and/or high melt undercoolings (i.e., under RS (rapid solidification) conditions [55]), while, in ternary and higher-order alloys, it is also promoted by additions that can suppress the Nb3Si silicide [48]. Tin and Ge are such additions, as is Al, but not Cr when added to Nb-24Ti-18Si [32,33,34,40,41,42,52,53]. When Al and Cr were present simultaneously in Nb-24Ti-18Si-5Al-5Cr (alloy KZ5 in Reference [42]), the Nbss + βNb5Si3 was formed instead of the Nbss + Nb3Si eutectic. In the Nb–Si binary, the Si content of the metastable eutectic was suggested to be about 20 at.% [55] (although this value depends on which version of the Nb–Si binary phase diagram is used [48]). In ternary and higher-order alloys, the concentration of Si plus other element(s) (like Al, Sn, Ge) in the eutectic is about 21 at.% [48].
The microstructure of OHS1-AC would suggest that the primary phase was the βNb5Si3, which is also consistent with the higher melting temperature of this phase compared with the A15-Nb3Sn, the Nbss, and the C14-NbCr2 Laves phase. The “architecture” of the microstructures of the as-cast alloys KZ5 [42], ZF6 [34], ZX8 [33] (see above for nominal compositions), and OHS1-AC was the same in that it consisted of primary βNb5Si3 with the other phases formed in between the primary silicide grains. In the alloy KZ5 (no Ge and Sn), the other phases were Nbss and Nbss + βNb5Si3 eutectic; in ZF6 (Ge present), the other phases were the Nbss and C14-NbCr2 Laves phase, and, in ZX8 (Sn present), the other phases were the A15-Nb3Sn and C14-NbCr2 Laves phase. This would suggest (i) that, in OHS1, the solidification path of the inter-dendritic melt “was defined” by the synergy of Sn with the other alloying elements, and (ii) that the partitioning of Ge to Nb5Si3 stabilized the βNb5Si3. In OHS1-AC, the eutectic was too fine to be characterized; it was rich in Cr and its average Al + Ge + Si + Sn content was about 17.9 at.% and about 20 at.% when the highest analysis values were considered. The Nb3Si silicide was not observed in OHS1-AC. The phases Nbss and βNb5Si3 participated in the eutectic; however, because of the high Cr content of the latter and evidence for the presence of NbCr2 in the eutectic (see insert in Figure 1b), it is suggested that the eutectic was a ternary one formed by the Nbss, βNb5Si3, and the C14-NbCr2 Laves phase. As the primary βNb5Si3 formed, the surrounding liquid became richer in Ti, Cr, Al, and Sn and poorer in Si and Ge. In the latter liquid, the A15-Nb3Sn, the Nbss, and the C14-NbCr2 Laves phase, as well as the eutectic, were formed. It is proposed that the solidification path of OHS1-AC was L → L + βNb5Si3 → L + βNb5Si3 + Nb3Sn → L + βNb5Si3 + Nb3Sn + Nbss → L + βNb5Si3 + Nb3Sn + Nbss + NbCr2 → βNb5Si3 + Nb3Sn + Nbss + NbCr2 + (Nbss + βNb5Si3 + NbCr2)eutectic.
In addition to the Nb5Si3 silicide, in the heat-treated alloys KZ5 [42] and ZF6 [34], the other “stable” phase was the Nbss; in the alloy ZX8 [33], the other phases were the A15-Nb3Sn and the Nbss, and, in OHS1-HT, the other phases were the A15-Nb3Sn and the C14-NbCr2 Laves phase. In the heat-treated alloys KZ7 (Nb-18Si-24Ti-5Al [42]) and ZX8 [33], the βNb5Si3 transformed to αNb5Si3; however, in the heat-treated KZ5, both silicides were present and, in ZF6-HT, there was weak evidence for αNb5Si3, although most of the XRD peaks corresponded to βNb5Si3, while, in the OHS1-HT, the βNb5Si3 was stable after the heat treatment. This would suggest that, in OHS1, the synergy of Ge and Sn with the other elements (i) stabilized the C14-NbCr2 Laves phase, (ii) destabilized the Nbss, and (iii) stabilized the βNb5Si3 or made the βNb5Si3→αNb5Si3 transformation promoted by Al [42] or Sn [51] more sluggish.

4.3. Oxidation

4.3.1. Oxidation at 800 °C

There were differences and similarities in the oxidation behavior at 800 °C of the alloys OHS1, ZX8, and ZF6. There was no pest oxidation, and all three alloys formed a thin adherent scale (about 8 and 5 μm thick in ZF6 and ZX8, respectively), which was slightly uneven in OHS1 (2–5 µm thick). The DZ in the latter was less deep (3 µm) compared with that in ZX8 (10 µm), and there was no DZ in ZF6 (i.e., the Nbss and Nb5Si3 below the scale/substrate interface were not contaminated by oxygen). Compared with the parabolic rate constants of the alloys ZX8 [33] and ZF6 [38], that of OHS1 was one order of magnitude higher, and the weight change was similar to the former but about three times that of the latter. The above data would suggest that, in the pest regime, the synergy of Ge with Al, Cr, and Ti was more efficient than that of Ge and Sn together.
At 800 °C, the substrate below the scale/substrate interface was richer in Sn in OHS1 and ZX8, and, in the former, the Laves phase in the IOZ was not oxidized. Comparison of the oxides that were determined by GXRD in the alloys ZF6 and OHS1 shows that CrNbO4 and TiNb2O7 were present in both alloys, the AlNbO4, Nb2O5, and GeO2 (hexagonal, P3221) were present only in ZF6, and the TiO2, TiNbO4, SiO2, SnGeO3, Ti2Nb10O29 and Nb2O5·GeO2 were present only in OHS1.
In OHS1, the scale that formed on top of Nb5Si3 was thin and compact with some oxide buckling in areas of the surface that were above the microstructure between the βNb5Si3 grains (Figure 5) where thicker oxide was formed (Figure 8). Scale buckling is produced by the rise of internal stresses in the oxides forming the scale. The growth of voluminous oxide particles could cause scale buckling and cracking of the Nb5Si3 near the substrate/scale interface. Deeper oxygen penetration was found at the phase boundaries, which would suggest that they played a very important role in the inward transport of oxygen and the outward transport of reactants. The inter-granular areas were rich in Ti and would be expected to be more reactive than the Ti-poor areas. Brittle phases unable to cope with the fast rise of stresses induced by the growth of oxide particles cracked for relief, allowing further oxygen diffusion into the alloy. The high solubility of Ti, Cr, Si, Sn, and Al in the Nbss and oxygen anion diffusion in the alloy would embrittle the solid solution. It was not possible to confirm this using micro or nano-hardness testing because the areas with Nbss were too small.
The inherent brittleness of the Laves and Nb3Sn phases could also have contributed to cracking of the scale and could explain the cracks parallel to the oxide surface observed in some areas near to the substrate/scale interface. Oxide transformations also change the growth rate of oxide, whereby the growth of different oxides in some small areas could lead to stresses and cracks, particularly in the Nb5Si3 and Nb3Sn compounds. Keeping the above in mind, it was encouraging to see that there was no oxide spallation or specimen disintegration. The TiO2 whiskers seen in Figure 5 could have formed as a result of the oxidation of the Nbss which was very rich in Ti (also observed by Menon et al. [18]). According to Kofstad and Kjöllesdal [56], whiskers may form through a plastic flow mechanism caused from the growth of stresses in the oxide scale. At the substrate/scale interface, submicron (Sn,Ti)O2 rutile type oxide particles were observed within the Nb3Sn. These features were also observed in Nb-24Ti-18Si-5Cr-5Al-2Mo-5Hf-5Sn (alloy JG6 in Reference [20]).
Menon et al. [18] reported that the surfaces of alloys with Ge or Ge and Sn additions that were oxidized at T ≤ 900 °C were characterized by cracks parallel to the surfaces just below the oxide layer. They called this “a phenomenon of progressive failure” of Nb-silicide-based alloys during low-temperature oxidation, which they claimed to be distinct from pest oxidation. The formation of cracks in the substrate just below the substrate/scale interface and parallel to it was observed in oxidation in the pest regime in Nb-24Ti-18Si-based alloys without Sn or Ge additions [23,24], and with Sn addition [20,32,33] or Ge addition [38], in the alloys Nb-23Ti-5Si-5Al-5Hf-5V-2Cr-2Sn and Nb-30Ti-10Si-5Cr-5Sn-3Fe-2Al-2Hf [21] and in the alloys studied by Knittel et al. [22]. However, this “phenomenon” was essentially suppressed in the alloy ZF6 (Nb-24Ti-18Si-5Al-5Cr-5Ge) [38]. As oxidation progresses, the substrate below the scale/substrate interface becomes contaminated by oxygen, with the Nbss more severely affected than the Nb5Si3 [20,22,32,33,38,57] and other phases that might be present, for example, A15-Nb3Sn [15,33]. The volume changes and accompanying stresses that arise from the oxidation of the substrate below the said interface cause the low-toughness Nb5Si3 to crack. The data for alloys with/without stable Nbss would suggest that suppression of the contamination of the substrate by oxygen limits the “phenomenon of progressive failure”.

4.3.2. Oxidation at 1200 °C

Spallation of the oxide scales that are formed on Nb-silicide-based alloys at T ≥ 1000 °C is common [18,22,23,24,25]. Different volumes of oxidation products cause internal stresses in the scale. Furthermore, internal stresses in the scale can arise from the anisotropy of the coefficients of thermal expansion (CTE) of oxides in the scale. Internal stresses contribute to the cracking of the latter and its separation from the substrate. Such stresses can be significant. For example, the internal stresses along the crystallographic directions a, b, and c of Nb2O5 during cooling from 1000 to 400 °C were estimated by Manning et al. [58] to be σa = 276 MPa, σb = −165 MPa, and σc = 283 MPa.
Compared with the alloys ZX8 [33] and ZF6 [38] that exhibited scale spallation at 1200 °C, the discovery that the specimen of OHS1 was covered by a continuous adherent scale at 1200 °C was exciting. Considering the parabolic and linear rate constants of the alloys ZX8 [33] and ZF6 [38], the former was lower by one order of magnitude for OHS1 and the latter was essentially the same for all three alloys. The weight change of OHS1 was the smallest, and that of ZF6 was the highest (but not very different from that of ZX8). The scale thickness of ZF6 was the highest, and those of ZX8 and OHS1 were the same. The above data would suggest that, in the high-temperature regime, the simultaneous presence of Ge and Sn with Al, Cr, and Ti in OHS1 was more effective than that of Ge or Sn individually with the same elements in the alloys ZX8 and ZF6.
The same Sn-rich compounds were formed in the IOZ below the scale/substrate interface in OHS1, as was the case in ZX8, plus (Ti,Nb)6Sn5. There was no evidence of the recrystallized structures that were observed in ZX8 [33], which would suggest that the strain energy in the substrate below the said interface was lower in OHS1 compared with ZX8. In the substrate below the scale formed on ZX8, there was an Sn rich phase (analysis number 12 in Table 13 in Reference [33]) that could be (Nb,Ti)6Sn5. This compound had a lower Ti concentration (14.2 at.%) than the (Ti,Nb)6Sn5 (33 at.%) that was observed in OHS1. The Ti6Sn5 compound is isomorphous with Nb6Sn5 [50], but has a significantly higher melting temperature (1490 °C) than the latter (916 °C). Thus, melting of the (Ti,Nb)6Sn5 compound in the substrate below the scale was not possible. In the IOZ in OHS1, there was also Nb5Ge3 alloyed with Al, Si, and Ti with wide solubility ranges of these elements and Ge. The latter was not observed in ZF6. The Nb5Ge3 has lower shear (G) and Young’s (E) moduli and higher Poisson’s ratio (ν) than βNb5Si3 [54,59], as well as G, E, and ν values closer to the values of Ti-alloyed βNb5Si3, particularly as the Ti concentration in the silicide increases [39]. Furthermore, in the IOZ of OHS1, the concentrations of Cr and Ti were reduced significantly in the areas that were enriched in Ge and Sn below the said interface.

4.3.3. Oxide Scales

Nb oxide(s), rutile, and niobates are the typical oxides in the scales of Nb-silicide-based alloys [10]. Amorphous silicates were reported in MASC alloy scale during the early stages of oxidation at 1200 °C [60]. In Nb oxides and TiO2, crystallographic shear and point defects produce (assist) stoichiometry changes. The former can accommodate large oxygen deficiencies, keeping the metal ion coordination, while the latter cannot account for high variations in stoichiometry and can even be eliminated in the process of crystallographic shear [61].
The structure of rutile is slightly more open, parallel to the c axis. The diffusivity of O parallel to the c axis is larger than perpendicular to it [62]. Also, the thermal conductivity of rutile is fastest parallel to the c axis [63]. The Ti–O bond lengths and strengths are independent of crystallographic direction [64]. The diffusion mechanisms of both Ti and O in rutile are controlled largely by defects, and the O diffusion depends on the environment in which TiO2 grows [62]. The defect structure in rutile is dominated by O vacancies at low temperatures and high O pressures, and by Ti interstitials at high temperatures and low O pressures [65].
The scale that formed on OHS1 was rich in Nb, Si, and Ti, and it contained some Sn and Cr but no Ge. Comparison of the oxides that were determined by GXRD in the alloys ZF6 and OHS1 shows that the oxides Nb2O5, SiO2, TiNb2O7, and AlNbO4 were present in both alloys, the AlNbO4 and GeO2 were present only in ZF6 (as was the case at 800 °C), and the oxides TiO2, TiNbO4, and Ti2Nb10O29 were present only in OHS1 (as the case at 800 °C), while αAl2O3 was observed only in OHS1 at 1200 °C. In OHS1, some Cr was in solution in (Al,Cr)NbO4 and (Ti,Cr)NbO4. In some areas of the scale surface, there was a coarse and compact oxide with no Ge and Si content. This oxide was not continuous and was surrounded by different Ti niobates and SiO2.
In the substrate below the scale, the oxygen solubility in the Nb5Ge3 was higher compared with Nb5Si3, and TiO2 and SiO2 surrounded the former. The substrate below the scale/substrate interface was richer in Ge and Sn and poorer in Cr and Ti. Furthermore, compared with the chemical composition of the solid solution in the microstructure of the specimen used for isothermal oxidation, which was Nb-based and Ti-rich (Nb/Ti > 1), the solid solution in the bulk of the oxidized specimen was Ti-based, meaning that it was very rich in Ti with Nb/Ti < 1. This enrichment of the solid solution in Ti would have significantly improved its oxidation resistance [11].
Most of the Cr was found in MNbO4 oxide(s) in the surface of the scale. The Cr content in the scale increased from the substrate/scale interface toward the surface of the scale. No Cr oxide particles were found in the scale and no Cr solute in Al2O3. Ti and Cr probably affected the oxygen solubility in Nb and, thus, the formation of Nb2O5 was dramatically reduced allowing the formation of MNbO4 oxide(s). Indeed, as discussed by Hurlen [66] and Kofstad and Kjollesdal [56], the oxidation resistance of Nb at high temperatures is strongly influenced by its oxygen solubility, which could increase above saturation values under particular conditions. The starting microstructure of the oxidized specimen contained a low vol.% of the Nbss with Al, Cr, Ge, Sn, and Ti in solution. The oxidation of the Nbss depends on the concentration of these solutes [18,20,22,24]. For example, Ti is known to significantly improve the oxidation of Nb–Ti solid solutions [11,67].
The microstructures of the specimens of the alloys OHS1, ZX8, and ZF6 at the start of the oxidation experiments were different, with no Nbss in ZX8, no A15 compound in ZF6, and the βNb5Si3 and the C14-NbCr2 Laves phase present in all three alloys. In the heat-treated alloys, the Laves phase was stable in all three alloys, and the Nbss was stable in the alloys ZX8 and ZF6 but not in OHS1. At 800 °C, the alloys OHS1, ZX8, and ZF6 did not pest and formed thin adherent scales, compared with the alloys KZ5 (Nb-24Ti-18Si-5Cr-5Al, no pest, Maltese cross formation [23]) and KZ2 (Nb-24Ti-18Si-8Cr-4Al, no pest, spallation of thin scale [23]), the starting microstructures of which consisted of Nbss, βNb5Si3, and αNb5Si3 in both alloys, plus the C14-NbCr2 Laves phase in the latter [23,42]. This would suggest that individually or simultaneously alloying with Ge or Sn is essential for the suppression of pest oxidation but not the presence of the A15-Nb3Sn in the bulk microstructure.
It is challenging to answer with certainty why the adhesion of the scale that formed on OHS1 at 1200 °C improved dramatically compared with the alloys ZX8 and ZF6. Similar to ZX8, in OHS1, there was enrichment in Sn in the substrate below the scale/substrate interface and formation of Sn-rich compounds (Nb5Sn2Si, Nb3Sn) with Ti nitride(s) and no Laves phase; however, unlike ZX8, in the OHS1, the (Ti,Nb)6Sn5 was also formed. In the latter alloy, there was also enrichment with Ge of the substrate below the said interface and formation of Nb5Ge3 with wide solubility ranges for Al, Ge, Si, and Ti. This was not observed in the alloy ZF6. Furthermore, the typical oxides that form in the scales of Nb-silicide-based alloys [10] were also observed in the scales of OHS1, ZX8, and ZF6; however, there were differences between individual scales (see above).
In the alloy ZF6, both AlNbO4 and CrNbO4 were formed, while only the former was formed with Cr in solution in OHS1, which means that more Cr was present in the scale of ZF6 because there is incomplete solid solubility between AlNbO4 and CrNbO4 [68]. Indeed, up to some critical Cr content, the (Al,Cr)NbO4 is one phase with the structure of AlNbO4 (monoclinic, C2/m space group) compared with two phases AlNbO4 plus CrNbO4 (tetragonal (rutile type structure), P42/mnm) when the critical Cr concentration is exceeded, in which there is no structural relaxation [68].
The ranking of MO2 oxides in the scales of the alloys OHS1 and ZF6 in decreasing order of thermal conductivity (κ) and Young’s modulus (E) is SiO2, GeO2, TiO2, and SnO2, and the ranking in increasing order of linear coefficient of thermal expansion (α) is SiO2, TiO2, GeO2, and SnO2 [69] (the SnO2 oxide was not confirmed by GXRD, but the microanalysis suggested the presence of Sn in the scale; see Section 3.3 where the SnO2 has the same crystal structure as TiO2). A rapid temperature decrease is accompanied by temperature and stress gradients that could cause cracking and damage. The properties α, E, and κ are crucial for the response of oxides to rapid changes in temperature, which are described by the intrinsic thermal shock parameter (units W∙m−1∙MPa−1). The ranking of MO2 oxides and alumina in terms of decreasing intrinsic thermal shock parameter is SiO2, Al2O3, TiO2, GeO2, and SnO2 [69]. The scale of ZF6 contained MO2 oxides at the extremes of the aforementioned ranking for thermal shock, namely, SiO2 and GeO2, compared with the scale of OHS1 where the presence of Al2O3, TiO2, and SnO2 may have contributed to a more “measured” response to stresses.
Another possible source of reduced stress could be the presence of the Ti2Nb10O29 oxide in the scale of OHS1. This oxide was not found in the scale of ZF6, and the TiNb2O7 and AlNbO4 oxides were present in the scales of both alloys. The presence of Ti2Nb10O29 and TiNb2O7 in the scale that formed on Nb-39Ti (at.%) (Nb-25 wt.% Ti) after extended (≥100 h) oxidation between 750 and 780 °C was reported by Felten [70]. The CTE values of oxides in scales of Nb-silicide-based alloys were given in Reference [71]. The Ti2Nb10O29 has a negative CTE (−3.1 × 10⁻⁷/°C) compared with the CTE values of TiNb2O7 (4.5 × 10⁻⁷/°C) and AlNbO4 (39.7 × 10⁻⁷/°C) [72]. Furthermore, Nb2O5 and mixed (Nb2O5)1−x(TiO2)x oxides (x = 0.05, 0.08, 0.11) that have negative CTE below 500 °C [73] could form owing to stoichiometric changes in oxides in the scale (see above). Even though GXRD did not provide evidence for the latter mixed oxides, it is suggested that the presence in the scale of OHS1 of oxide(s) with negative CTE decreased thermal expansion-related stresses in the scale and improved its adherence to the substrate.
In the Nb2O5–GeO2 system, partial melting was observed for 85 mol.% Nb2O5–15 mol.% GeO2 above 1090 ± 10 °C [74]. This would suggest that some liquation might have occurred in the scale of ZF6 that contained both these oxides, which were not present in the scale of OHS1. Thus, it is proposed that the simultaneous addition of Ge and Sn in the alloy OHS1 resulted in non-spallation of the scale that formed at 1200 °C because (a) the scale was able (i) to relax structurally owing to it containing AlNbO4 with low Cr concentration, and (ii) to respond in a “measured” way to stresses arising for temperature gradients owing to it containing SiO2, Al2O3, TiO2 and SnO2, and Ti2Nb10O29 with TiNb2O7, and AlNbO4, and (b) there was no liquation in the scale.

4.4. Alloy OHS1: High-Entropy Alloy (HEA) or Complex Concentrated Alloy (CCA)?

The concentrations of elements in a multicomponent high-entropy alloy (HEA) should be between 35 and 5 at.%. Some alloys that were studied recently do not adhere to this “definition” because they have an element with a concentration that exceeds 35 at.%, and other element(s) with concentration less than 5 at.%; for example, “HEAs” Fe(64−x)MnxNi27.7±1.3Co5.6±0.3Cr2.3±0.1 (x = 21, 24, 27) were studied in Reference [75]. Such alloys “satisfy the general intent to explore complex phase space” [76], and they are currently also referred to as HEAs [75] or as complex concentrated alloys (CCAs) [76].
The alloy OHS1 does not meet the currently accepted definition of HEA, but it is a CCA with ΔHmix = −41.24 kJ∙mol−1, ΔSmix = 10.06 J·mol−1·K−1, VEC = 4.445, δ = 9.25, Δχ = 0.166, and Ω = 0.51 (parameters calculated for the actual composition of the cast alloy, see Section 3.1). The parameters VEC, δ, and Δχ are in the ranges of the parameters of a bcc solid solution and intermetallic HEAs [77]. For OHS1 the alloy design methodology NICE [10] predicts average weight gains of 3.5 and 36 mg/cm2, respectively, for 800 and 1200 °C, and creep rate 1.25 × 10⁻⁵ s−1 at 1200 °C and 170 MPa. The predicted weight gains are in good agreement with the measured ones (Table 3), and the creep rate does not meet the creep goal for Nb-silicide-based alloys [2,10], which is not surprising when the above parameters of OHS1 and the ratio sd/sp (= 2.1) are compared with the data in Figures 6 and 7 in Reference [77]. OHS1 could be a good “basis alloy” for alloy design to develop Nb-silicide-based alloys with a balance of oxidation and creep properties.
Figure 15a shows a map of the parameters δ (related to atomic size) and VEC (number of valence electrons per atom filled into the valence band) for the alloys OHS1, ZX8, ZF6, and KZ5. These parameters, together with the parameter Δχ (related to electronegativity), describe the alloying behavior of Nb-silicide-based alloys [77], and they were calculated using the actual alloy compositions [33,34,44]. Figure 15b shows the weight change per unit area (ΔW/A) of the alloy OHS1 at 800 °C versus its parameter VEC. According to the alloy design methodology NICE [10], (a) the trends of VEC and δ should be opposite for oxidation resistance, and (b) alloy design should aim to decrease the former and increase the latter. Indeed, this is the case for the parameters VEC and δ (Figure 15).
In Figure 15a, with KZ5 as the “basis” (reference) alloy, the blue arrows show changes of parameters with the addition of Ge and (Ge and) Sn in the alloys ZF6 and OHS1, the orange arrows show changes of parameters with the addition of Sn and (Sn and) Ge in the alloys ZX8 and OHS1, and the R2 value corresponds to the linear fit of the data for the alloys KZ5, ZX8, and OHS1, which is very good (R2 > 0.975) and better than that between the alloys KZ5, ZF6, and OHS1. Figure 15a shows “a direction of travel” for future alloy design for balance of properties that can be pursued within the framework of the alloy design methodology NICE [10].
Figure 15a shows (i) that the additions of Ge or Sn individually or simultaneously resulted in a decrease or increase, respectively, of the parameters VEC and δ, in agreement with NICE [10], (ii) that the addition of Ge in ZF6 resulted in a significant decrease in VEC with a small increase in δ, and (iii) that the addition of Sn in OHS1 resulted in a small decrease in VEC and a significant increase in δ. Figure 15b shows that the additions of Ge or Sn individually or simultaneously resulted in lower VEC values and lower weight changes compared with the alloy KZ5, in agreement with NICE [10].

5. Summary and Concluding Remarks

This research sought to understand how the simultaneous addition of Ge and Sn in Nb-silicide-based alloys affects their oxidation resistance. We presented the results for the Hf-free Nb-24Ti-18Si-5Al-5Cr-5Ge-5Sn alloy that was selected to provide answers to the questions that were asked in the introduction of this paper. The alloy exhibited macrosegregation of Si which was reduced owing to the addition of both Ge and Sn. The Nbss was present in the cast alloy at a low volume fraction and was not stable after the heat treatment at 1400 °C. The A15-Nb3Sn and C14-NbCr2 Laves were stable phases. The primary βNb5Si3 did not transform to αNb5Si3 after the heat treatment. The additions of Ge and Sn suppressed pest oxidation at 800 °C. There was no spallation of the scale that formed at 1200 °C. There was enrichment in Ge and Sn in the substrate below the scale/substrate interface where the compounds Nb3Sn, Nb5Sn2Si, (Ti,Nb)6Sn5, and Nb5Ge3 were formed. In the bulk of the alloy, after the oxidation at 1200 °C, the solid solution was very rich in Ti. Improvement of oxidation resistance at both temperatures was accompanied by a decrease and increase, respectively, of the alloy parameters VEC and δ, in agreement with the alloy design methodology NICE.
The interesting finding of this piece of experimental work was the elimination of scale spallation at 1200 °C in the alloy OHS1. This was attributed (a) to the formation of a Ti-rich (Ti,Nb)ss solid solution and (Ti,Nb)6Sn5, respectively, in the bulk and below the scale, (b) to the low concentration of Cr in the scale, (c) to the absence of GeO2 in the scale, (d) to the formation of αAl2O3 in the scale, and (e) to the presence (i) of Nb5Ge3 below the scale/substrate interface and (ii) of oxides in the scale, namely, SiO2, Al2O3, TiO2, and SnO2, and Ti2Nb10O29,TiNb2O7, and AlNbO4, respectively, with a range of intrinsic thermal shock resistances and CTE values that reduced stresses in the scale and the substrate below it.

Author Contributions

Experimental work O.H.-N., Formal analysis of data O.H.-N., P.T., Original draft preparation O.H.-N., Writing, final submission, review and editing O.H.-N., P.T., Supervision P.T., Funding P.T. All authors have read and agreed to the published version of the manuscript.

Funding

This research was funded by the EPSRC (EP/H500405/1, EP/L026678/1).

Acknowledgments

The support of this work by the University of Sheffield, Rolls-Royce Plc, and EPSRC (EP/H500405/1, EP/L026678/1) is gratefully acknowledged. Financial support to O.H.N. by the National Research and Technology Council of Mexico (CONACyT) and the Robert Rocca Education Program is also gratefully acknowledged.

Conflicts of Interest

The authors declare no conflict of interest.

References

  1. Dimiduk, D.M.; Subramanian, P.R.; Mendiratta, M.G. Exploration of Nb-based advanced intermetallic materials. Acta Metall. Sin. Engl. Lett. 1995, 8, 519–530. [Google Scholar]
  2. Bewlay, B.P.; Jackson, M.R.; Zhao, J.; Subramanian, P.R. A Review of Very-High-Temperature Nb-silicide–Based Composites. Metall. Mater. Trans. A 2003, 34, 2043–2052. [Google Scholar] [CrossRef]
  3. Tsakiropoulos, P.; Superalloys, B.N.B. Encyclopedia of Aerospace Engineering; Ckley, R.B., Shyy, W., Eds.; John Wiley & Sons Ltd.: Hoboken, NJ, USA, 2010. [Google Scholar]
  4. Bewlay, B.P.; Lipsitt, H.A.; Jackson, M.R.; Reeder, W.J.; Sutcliff, J.A. Solidification pr Cessing of high temperature intermetallic eutectic-based alloys. Mater. Sci. Eng. A 1995, 192, 534–543. [Google Scholar] [CrossRef]
  5. Jackson, M.R.; Bewlay, B.P.; Zhao, J. Niobium-Silicide Based Composites Resistant to High Temperature Oxidation. U.S. Patent US 6913655, 29 December 2004. [Google Scholar]
  6. Fujikara, M.; Kasama, A.; Tanaka, R.; Hanada, S. Effect of alloy chemistry on the high temperature strengths and room temperature fracture toughness of advanced Nb-based alloys. Mater. Trans. 2004, 45, 493–501. [Google Scholar] [CrossRef] [Green Version]
  7. Kim, Y.; Menon, S.; Woodward, C. NbTiSiMo-X Alloys: Composition, Microstructure, Refinement and Properties; Report AFRL-RX-WP-TP-2009–4122; PN Publications: New Delhi, India, 2009. [Google Scholar]
  8. Drawin, S.; Justin, J.F. Advanced lightweight silicide and nitride based materials for turbo-engine applications. J. Aerosp. Lab. 2011, AL03-06, 1–13. [Google Scholar]
  9. Subramanian, P.R.; Mendiratta, M.G.; Dimiduk, D.M. High temperature silicides and refractory alloys. Mater. Res. S Ciety Symp. Pr Ceed. 1994, 322, 491–502. [Google Scholar] [CrossRef]
  10. Tsakiropoulos, P. On Nb silicide based alloys: Alloy design and selection. Materials 2018, 11, 844. [Google Scholar] [CrossRef] [Green Version]
  11. Prokoshkin, D.A.; Vasileva, E.V. Alloys of Niobium; Samarin, A.M., Ed.; translated from Russian by Kaner, N.; translation edited by Molly Gleiser; Israel Program for Scientific Translations: Jerusalem, Israel, 1965. [Google Scholar]
  12. Subramanian, P.R.; Mendiratta, M.G.; Dimiduk, D.M. Development approaches for advanced intermetallic materials—Historical perspective and selected successes. In Structural Intermetallics; Darolia, R., Lewandowski, J.J., Liu, C.T., Martin, P.L., Miracle, D.B., Nathal, M.V., Eds.; Springer: Singapore, 1993; pp. 619–630. [Google Scholar]
  13. Subramanian, P.R.; Mendiratta, M.G.; Dimiduk, D.M.; Stucke, M.A. Advanced intermetallic alloys—beyond gamma titanium aluminides. Mater. Sci. Eng. 1997, 240, 1–13. [Google Scholar] [CrossRef] [Green Version]
  14. Tsakiropoulos, P. On the alloying and properties of tetragonal Nb5Si3 in Nb-silicide based alloys. Materials 2018, 11, 69. [Google Scholar] [CrossRef] [Green Version]
  15. Tsakiropoulos, P. Alloying and properties of C14-NbCr2 and A15-Nb3X X=Al,Ge,Si,Sn in Nb-silicide based alloys. Materials 2018, 11, 395. [Google Scholar] [CrossRef] [Green Version]
  16. Perkins, R.A.; Chiang, K.T.; Meier, G.H. Formation of alumina on Nb-Al alloys. Scripta Metall. 1988, 22, 419–424. [Google Scholar] [CrossRef]
  17. Svedberg, R.C.; Ammon, R.L. Oxidation Resistant Niobium Alloy—Mechanically Alloying Niobium Intermetallic and Niobium Alloy. U.S. Patent #4,836,849, 6 June 1989. [Google Scholar]
  18. Menon, E.S.K.; Mendiratta, M.G.; Dimiduk, D.M. Oxidation behavior of complex niobium based alloys. In Proceedings of the International Symposium Niobium 2001, Orlando, FL, USA, 2–5 December 2001; pp. 121–145, ISBN 0971206805. [Google Scholar]
  19. Chan, K.S. Cyclic oxidation response of multiphase niobium-based alloys. Metal. Mater. Trans. 2004, 35, 589–597. [Google Scholar] [CrossRef]
  20. Geng, J.; Tsakiropoulos, P.; Shao, G. A Thermo-gravimetric and microstructural study of the oxidation of Nbss/Nb5Si3 based in situ composites with Sn addition. Intermetallics 2007, 15, 270–281. [Google Scholar] [CrossRef]
  21. Vellios, N. Design of Niobium Silicide Based Alloys. Ph.D. Thesis, University of Surrey, Guildford, UK, 2008. [Google Scholar]
  22. Knittel, S.; Mathieu, S.; Portebois, L.; Vilasi, M. Effect of tin addition on Nb-Si based in situ composites. Part II: Oxidation behaviour. Intermetallics 2014, 47, 43–52. [Google Scholar] [CrossRef]
  23. Zelenitsas, K.; Tsakiropoulos, P. Effect of Al, Cr and Ta additions on the oxidation behaviour of Nb–Ti–Si in situ composites at 800 C. Mater. Sci. Eng. 2006, 416, 269–280. [Google Scholar] [CrossRef]
  24. Geng, J.; Tsakiropoulos, P.; Shao, G. Oxidation of Nb–Si–Cr–Al in situ composites with Mo,Ti and Hf additions. Mater. Sci. Eng. 2006, 441, 26–38. [Google Scholar] [CrossRef]
  25. Portillo, B.I.; Varma, S.K. Oxidation behaviour of Nb-20Mo-15Si-5B-20Ti alloy in air from 700 to 1300. Alloys Compd. 2010, 497, 68–73. [Google Scholar] [CrossRef]
  26. Jun, W.; Xiping, G.; Jinming, G. Effects of B on the microstructure and oxidation resistance of Nb-Ti-Si based ultrahigh-temperature alloy. Chin. J. Aeronaut. 2009, 22, 544–550. [Google Scholar] [CrossRef] [Green Version]
  27. Perkins, R.A.; Chiang, K.T.; Meier, G.H. Effect of Alloying, Rapid Solidification, and Surface Kinetics on the High-Temperature Environmental Resistance of Niobium; AFOSR report, LMSC-F195926; PN Publications: New Delhi, India, 1987. [Google Scholar]
  28. Mitra, R. Mechanical behaviour and oxidation resistance of structural silicides. Int. Mater. Rev. 2006, 51, 13–64. [Google Scholar] [CrossRef]
  29. Yao, D.; Zhou, C.; Yang, J.; Chen, H. Experimental studies and modelling of the oxidation of multiphase Nb-base alloys. Corros. Sci. 2009, 51, 2619–2627. [Google Scholar] [CrossRef]
  30. Levin, E.M.; Robbins, C.R.; McMurdie, H.F. Phase Diagrams for Ceramists; American Ceramic Society: Columbus, OH, USA, 1964; pp. 142–363. [Google Scholar]
  31. Tsakiropoulos, P. On the macrosegregation of silicon in niobium silicide based alloys. Intermetallics 2014, 55, 95–101. [Google Scholar] [CrossRef]
  32. Xu, Z.; Utton, C.; Tsakiropoulos, P. A study of the effect of 2 at.% Sn on the microstructure and isothermal oxidation at 800 and 1200 C of Nb-24Ti-18Si based alloys with Al and/or Cr additions. Materials 2018, 11, 1826. [Google Scholar] [CrossRef] [PubMed] [Green Version]
  33. Xu, Z.; Utton, C.; Tsakiropoulos, P. A study of the Phase diagram for ceramics. effect of 5 at.% Sn on the microstructure and isothermal oxidation at 800 and 1200 C of Nb-24Ti-18Si based alloys with Al and/or Cr additions. Materials 2020, 13, 245. [Google Scholar] [CrossRef] [PubMed] [Green Version]
  34. Li, Z.; Tsakiropoulos, P. On the microstructure and hardness of the Nb-24Ti-18Si-5Al-5Cr-5Ge and Nb-24Ti-18Si-5Al-5Cr-5Ge-5Hf at.% silicide based alloys. Materials 2019, 12, 2655. [Google Scholar] [CrossRef] [PubMed] [Green Version]
  35. Zacharis, E.; Utton, C.; Tsakiropoulos, P. A study of the effects of Hf and Sn on the microstructure, hardness and oxidation of Nb-18Si silicide based alloys without Ti addition. Materials 2018, 11, 2247. [Google Scholar] [CrossRef] [PubMed] [Green Version]
  36. Thandorn, T.; Tsakiropoulos, P. Study of the role of B addition on the microstructure of the Nb-24Ti-18Si-8B alloy. Intermetallics 2010, 18, 1033–1038. [Google Scholar] [CrossRef]
  37. Jackson, M.R.; Bewlay, B.P.; Zhao, J. Niobium Silicide Based Composites Resistant to Low Temperature Pesting. U.S. Patent 6,419,765, 16 July 2002. [Google Scholar]
  38. Li, Z.; Tsakiropoulos, P. The effect of Ge addition on the oxidation of Nb-24Ti-18Si silicide based alloys. Materials 2019, 12, 3120. [Google Scholar] [CrossRef] [Green Version]
  39. Papadimitriou, I.; Utton, C.; Tsakiropoulos, P. The impact of Ti and temperature on the stability of Nb5Si3 phases: A first principles study. Sci. Technol. Adv. Mater. 2017, 18, 467–469. [Google Scholar] [CrossRef] [Green Version]
  40. Li, Z.; Tsakiropoulos, P. Study of the effect of Cr and Ti additions in the microstructure of Nb-18Si-5Ge based in situ composites. Intermetallics 2012, 26, 18–25. [Google Scholar] [CrossRef]
  41. Li, Z.; Tsakiropoulos, P. The microstructures of Nb-18Si-5Al-5Ge and Nb-24Ti-18Si-5Al-5Ge in situ composites. J. Alloys Compd. 2013, 550, 553–560. [Google Scholar] [CrossRef]
  42. Zelenitsas, K.; Tsakiropoulos, P. Study of the role of Cr and Al additions in the microstructure of Nb-Ti-Si in situ composites. Intermetallics 2005, 13, 1079–1095. [Google Scholar] [CrossRef]
  43. Kofstad, P. Chapter: Formation of Compact Scales at High Temperatures. In High Temperature Oxidation of Metals; Corrosion Monographs Series; IntechOpen: Oslo, Norway, 1966. [Google Scholar]
  44. Geng, J.; Tsakiropoulos, P. A study of the microstructure and oxidation of Nb-Si-Cr-Al-Mo in situ composites alloyed with Ti, Hf and Sn. Intermetallics 2007, 15, 382–395. [Google Scholar] [CrossRef]
  45. Tsakiropoulos, P.; Zelenitsas, K.; Vellios, N. Study of the effect of Al, Cr and Sn additions on the microstructure and properties of Nb silicide based alloys. Mater. Res. S C. Symp. Proc. C 2011, 1295. [Google Scholar] [CrossRef]
  46. Zelenitsas, K.; Tsakiropoulos, P. Study of the role of Ta and Cr additions in the microstructure of Nb-Ti-Si-Al in situ composites. Intermetallics 2006, 14, 639–659. [Google Scholar] [CrossRef]
  47. Schlesinger, M.E.; Okamoto, H.; Gokhale, A.B.; Abbaschian, R. The Nb-Si Niobium-silicon system. J. Phase Equilibria 1993, 14, 502–509. [Google Scholar] [CrossRef]
  48. Tsakiropoulos, P. Alloying and hardness of eutectics with Nbss and Nb5Si3 in Nb-silicide based alloys. Materials 2018, 11, 592. [Google Scholar] [CrossRef] [Green Version]
  49. Vellios, N.; Tsakiropoulos, P. A study of the role of Fe and Sn additions in the microstructure of Nb-24Ti-18Si-5Cr silicide based alloys. Intermetallics 2010, 18, 1729–1736. [Google Scholar] [CrossRef]
  50. Okamoto, H. Phase Diagrams for Binary Alloys: Desk Handbook; ASM International: Metals Park, OH, USA, 2000. [Google Scholar]
  51. Vellios, N.; Tsakiropoulos, P. The role of Sn and Ti additions in the microstructure of Nb-18Si base alloys. Intermetallics 2007, 15, 1518–1528. [Google Scholar] [CrossRef]
  52. Li, Z.; Tsakiropoulos, P. Study of the effects of Ge addition on the microstructure of Nb–18Si in situ composites. Intermetallics 2010, 18, 1072–1078. [Google Scholar]
  53. Li, Z.; Tsakiropoulos, P. Study of the effect of Ti and Ge in the microstructure of Nb-24Ti-18Si-5Ge in situ composite. Intermetallics 2011, 19, 1291–1297. [Google Scholar] [CrossRef]
  54. Papadimitiou, C.; Utton, P. Tsakiropoulos. On the Nb-Ge binary system. Metall. Mater. Trans. 2015, 46, 5526–5536. [Google Scholar] [CrossRef]
  55. Bendersky, L.; Biancaniello, F.S.; Boettinger, W.J.; Perepezko, J.H. Microstructural characterization of rapidly solidified Nb-Si alloys. Mater. Sci. Eng. 1987, 89, 151–159. [Google Scholar] [CrossRef]
  56. Kofstad, P.; Kjollesdal, H. Oxidation of Niobium columbium in the temperature range 500 to 1200 C. Trans. Metall. S Ciety AIME 1961, 221, 285–294. [Google Scholar]
  57. Nelson, J.; Ghadyani, M.; Utton, C.; Tsakiropoulos, P. A study of the effects of Al, Cr, Hf and Ti additions on the microstructure and oxidation of Nb-24Ti-18Si silicide based alloys. Materials 2018, 11, 1579. [Google Scholar] [CrossRef] [Green Version]
  58. Manning, W.R.; Hunter, O.; Calderwood, F.W.; Stacy, D.W. Thermal expansion of Nb2O5. J. Am. Ceram. S Ciety 1972, 55, 342–347. [Google Scholar] [CrossRef]
  59. Papadimitriou, C.; Utton, C.; Scott, A.; Tsakiropoulos, P. Ab initio study of the intermetallics in Nb-Si binary system. Intermetallics 2014, 54, 125–132. [Google Scholar] [CrossRef]
  60. Lefez, B.; Jouen, S.; Hannoyer, B.; Bacos, M.; Beucher, E. Oxidation behaviour of the 47Nb-16Si-25Ti-8Hf-2Al-2Cr alloy sheet and vibrational spectroscopy. Mater. High Temp. 2009, 26, 15–20. [Google Scholar] [CrossRef]
  61. Nico, C.; Monteiro, T.; Graca, M.P.F. Niobium oxides and niobates physical properties: Review and prospects. Prog. Mater. Sci. 2016, 80, 1–37. [Google Scholar] [CrossRef]
  62. Moore, D.K.; Cherniak, D.J.; Watson, E.B. Oxygen diffusion in rutile from 750 to 1000 C and 0.1 to 1000 Mpa. Am. Mineral. 1998, 83, 700–711. [Google Scholar] [CrossRef]
  63. McCarthy, K.A.; Ballard, S.S.; Doerner, E.C. Thermal conductivity of sapphire and rutile as a function of temperature. Phys. Rev. 1952, 88, 153. [Google Scholar]
  64. Grant, F.A. Properties of rutile titanium dioxide. Rev. Mod. Phys. 1959, 31, 646–674. [Google Scholar] [CrossRef]
  65. Kofstad, P. Note on the defect structure of rutile TiO2. J. Less Common Met. 1967, 13, 635–638. [Google Scholar] [CrossRef]
  66. Hurlen, T. Oxidation of Niobium; Technical Scientific Note no.1 Norwegian Report; Central Institute for Industrial Research: Oslo, Norway, 1959. [Google Scholar]
  67. Argent, B.B.; Phelps, B. The oxidation of Niobium-Titanium and Niobium-Molybdenum alloys. J. Less Common Met. 1960, 2, 181–190. [Google Scholar] [CrossRef]
  68. Ardit, M.; Dondi, M.; Cruciani, G. Structural stability, cation ordering, and l Cal relaxation along the AlNbO4-Al0.5Cr0.5NbO4 join. Am. Mineral. 2012, 97, 910–917. [Google Scholar] [CrossRef]
  69. Music, D.; Stelzer, B. Intrinsic thermal shock behaviour of common rutile oxides. Physics 2019, 1, 22. [Google Scholar] [CrossRef] [Green Version]
  70. Felten, E.J. The interaction of the alloy Nb-25Ti with air, oxygen and nitrogen. II The reaction of Nb-25Ti in air and oxygen between 650 and 1000 C. J. Less Common Metals 1969, 17, 199–206. [Google Scholar] [CrossRef]
  71. Ghadyani, M.; Utton, C.; Tsakiropoulos, P. Microstructures and isothermal oxidation of the alumina scale forming Nb1.7Si2.4Ti2.4Al3Hf0.5 and Nb1.3Si2.4Ti2.4Al3.5Hf0.4 alloys. Materials 2019, 12, 222. [Google Scholar] [CrossRef] [Green Version]
  72. Dejneka, M.J.; Chapman, C.L.; Misture, S.T. Strong, low thermal expansion niobate ceramics. J. Am. Ceram. 2011, 48, 2249–2261. [Google Scholar] [CrossRef]
  73. Choosuwan, H.; Guo, R.; Bhalla, A.S.; Balachandran, U. Negative thermal expansion behaviour in single crystal and ceramic of Nb2O5 based compositions. J. Appl. Phys. 2002, 91, 5051. [Google Scholar] [CrossRef]
  74. Levin, E.M. Phase equilibria in the system niobium pentoxide-germanium dioxide, Journal of Research of the National Bureau of Standards-A. Phys. Chem. 1966, 70, 5–10. [Google Scholar]
  75. Pradep, K.G.; Tasan, C.C.; Yao, M.J.; Deng, Y.; Springer, H.; Raabe, D. Non-equiatomic high entropy alloys: Approach towards rapid alloy screening and property-oriented design. Mater. Sci. Eng. A 2015, 648, 183–192. [Google Scholar] [CrossRef]
  76. Senkov, O.N.; Miracle, D.B.; Chaput, K.J. Development and exploration of refractory high entropy alloys—A review. J. Mater. Res. 2018, 33, 3092–3128. [Google Scholar] [CrossRef] [Green Version]
  77. Tsakiropoulos, P. On Nb silicide based alloys. Part II. J. Alloys Compd. 2018, 748, 569–576. [Google Scholar] [CrossRef] [Green Version]
Figure 1. Back-scattered electron (BSE) images of the microstructure of OHS1-AC (as-cast): (a) bulk and (b) bottom.
Materials 13 00722 g001
Figure 2. X-ray diffractograms (XRD) of the alloy OHS1 in the as-cast (AC) and heat-treated (HT) conditions. The XRD data agreed with the data from the following JCPDS (International Center for Diffraction Data) cards: (34-370) for Nbss, (30-0875) for βNb5Si3, (65-4327) for Ti-rich Nbi5Si3, (19-875) for the Nb3Sn, (47-1637) for the NbCr2 Laves phase, and (38-1420) for the TiN.
Materials 13 00722 g002
Figure 3. BSE images of the microstructure of OHS1-HT: (a) bulk and (b) bottom.
Materials 13 00722 g003
Figure 4. Thermogravimetry (TG) plots of the alloy OHS1 for isothermal oxidation in air at (a) 800 and (b) 1200 °C.
Materials 13 00722 g004
Figure 5. Images of scale surface of the alloy OHS1 after isothermal oxidation in air at 800 °C: (a) secondary electron (SE) image, (b) BSE image of the same region, and (c) SE image at higher magnification.
Materials 13 00722 g005aMaterials 13 00722 g005b
Figure 6. Glancing-angle XRD (GXRD) data of the scales formed on the alloy OHS1 at (a) 800 and (b) 1200 °C in air, in (a) γ = 2° and (b) γ = 10°. (a) TiO2 (JCPDS 21-1276), TiNbO4 (JCPDS 81-911), Nb2O5.GeO2 (JCPDS 19-0908), SiO2 (JCPDS 39-1425), CrNbO4 (JCPDS 81-909), SnGeO3 (32-0413), Ti2Nb10O29 (JCPDS 73-0242), and TiNb2O7 (JCPDS 77-1374); (b) TiO2 (JCPDS 21-1276), SiO2 (JCPDS 39-1425),Ti2Nb10O29 (JCPDS 73-0242), TiNb2O7 (JCPDS 77-1374), rutile type TiNbO4 (JCPDS 81-911) and AlNbO4 (JCPDS 41-0347), Nb2O5 (JCPDS 28-0317), and Al2O3 (JCPDS 70-3319).
Materials 13 00722 g006
Figure 7. SE image and X-ray elemental maps of the scale surface of the alloy OHS1 after isothermal oxidation in air at 800 °C.
Materials 13 00722 g007
Figure 8. BSE images of a cross section of the alloy OHS1 after isothermal oxidation at 800 °C showing the microstructure (a) of the substrate and scale, (b) of the scale formed on top of the Nb3Sn phase, and (c) of the three-phase region after oxidation.
Materials 13 00722 g008
Figure 9. BSE image and X-ray elemental maps of a cross-section of the alloy OHS1 after isothermal oxidation in air at 800 °C.
Materials 13 00722 g009
Figure 10. (ac) Images of the surface of the scale formed on the alloy OHS1 after isothermal oxidation in air at 1200 °C and (d) the oxidized specimen. (a) and (b) are SE images, and (c) is a BSE image.
Materials 13 00722 g010
Figure 11. SE image and X-ray elemental maps of the scale surface of the alloy OHS1 after isothermal oxidation in air at 1200 °C.
Materials 13 00722 g011
Figure 12. BSE image and X-ray elemental maps of a cross-section of the alloy OHS1 after isothermal oxidation in air at 1200 °C.
Materials 13 00722 g012
Figure 13. Images of cross-sections of the alloy OHS1 after isothermal oxidation in air at 1200 °C: (a) SE, (b) BSE. The red numbers are related to the following BSE images: (c) #1 oxide scale (OS), (d) #2 OS, (e) #3 OS, (f) #4 OS, (g) #5 OS, (h) #6 OS, (i) #7 diffusion zone (DZ), (j) #8 DZ, (k) #9 DZ, (l) #10 DZ, (m) #11 DZ, and (n) #12 bulk of the alloy after oxidation. For yellow box in (b), see Figure 14.
Materials 13 00722 g013aMaterials 13 00722 g013bMaterials 13 00722 g013c
Figure 14. BSE image and X-ray elemental maps of a cross-section of the scale/substrate interface of the alloy OHS1 alloy after isothermal oxidation in air at 1200 °C. The selected area corresponds to the yellow box in Figure 13.
Materials 13 00722 g014
Figure 15. Plots (a) of the parameters δ and VEC and (b) of weight change per unit area at 800 °C versus VEC.
Materials 13 00722 g015
Table 1. Microanalysis data (at.%) of OHS1-AC.
Area/PhaseNb (at.%)Ti (at.%)Si (at.%)Cr (at.%)Al (at.%)Ge (at.%)Sn (at.%)
Top40.0 ± 1.123.2 ± 1.418.8 ± 1.64.3 ± 0.64.6 ± 0.45.2 ± 0.43.9 ± 0.5
42.5–38.525.0–20.422.3–15.95.1–3.35.3–3.95.6–4.54.8–3.1
Center41.6 ± 1.722.1 ± 1.718.7 ± 1.64.1 ± 0.54.7 ± 0.54.7 ± 0.54.1 ± 0.4
43.6–38.025.4–20.121.2–15.55.3–3.25.6–3.45.7–3.75.1–3.2
Bottom39.2 ± 0.624.2 ± 0.817.9 ± 0.84.8 ± 0.44.8 ± 0.45.2 ± 0.33.9 ± 0.4
40.7–38.025.8–22.819.1–16.75.4–4.25.6–4.05.6–4.74.5–3.4
Nbss23.3 ± 0.730.6 ± 1.05.3 ± 1.029.4 ± 1.67.2 ± 0.71.5 ± 0.52.7 ± 0.2
24.3–22.232.1–29.56.8–3.931.9–27.48.4–6.32.2–0.73.1–2.4
NbCr223.1 ± 1.117.6 ± 1.27.3 ± 0.445.3 ± 2.65.1 ± 0.40.9 ± 0.10.7 ± 0.4
24.9–21.719.6–16.28.0–7.048.2–42.05.8–4.51.1–0.91.4–0.3
Nb3Sn49.0 ± 0.924.9 ± 0.52.9 ± 0.14.4 ± 0.35.8 ± 0.31.6 ± 0.211.4 ± 0.4
50.3–47.825.7–24.33.1–2.74.6–3.86.2–5.31.9–1.412.1–11.0
Ti-rich Nb3Sn41.9 ± 0.929.4 ± 1.02.8 ± 0.27.4 ± 0.77.3 ± 0.31.5 ± 0.19.7 ± 0.5
43.2–40.431.2–27.73.2–2.48.2–6.47.8–6.81.7–1.310.5–8.8
Nb5Si343.6 ± 0.318.6 ± 0.327.3 ± 0.51.2 ± 0.12.0 ± 0.26.2 ± 0.11.1 ± 0.2
43.8–43.119.1–18.527.7–26.71.3–1.12.2–1.86.3–6.11.4–1.0
Ti-rich Nb5Si338.8 ± 2.023.0 ± 1.920.6 ± 0.61.9 ± 0.45.2 ± 0.46.7 ± 0.23.8 ± 0.2
40.5–36.125.3–21.121.3–19.62.5–1.65.8–4.87.1–6.44.1–3.5
Table 2. Microanalysis data (at.%) of OHS1-HT.
Area/PhaseNb (at.%)Ti (at.%)Si (at.%)Cr (at.%)Al (at.%)Ge (at.%)Sn (at.%)
Top39.6 ± 0.424.1 ± 0.518.2 ± 0.84.2 ± 0.34.6 ± 0.35.1 ± 0.24.2 ± 0.3
39.9–39.124.6–23.619.2–17.44.5–3.95.0–4.25.3–4.84.7–4.0
Bulk40 ± 1.023.7 ± 0.617.8 ± 1.04.6 ± 0.44.7 ± 0.25.0 ± 0.24.2 ± 0.5
41.1–38.424.6–23.219.1–16.35.0–4.05.0–4.55.3–4.65.2–3.8
Bottom39.4 ± 0.624.4 ± 0.418.0 ± 0.74.4 ± 0.54.5 ± 0.25.2 ± 0.24.1 ± 0.2
40.3–38.824.9–24.018.6–17.14.9–3.84.7–4.35.4–5.04.3–3.8
NbCr226.0 ± 0.610.1 ± 0.78.8 ± 0.250.5 ± 1.03.5 ± 0.40.7 ± 0.00.4 ± 0.3
26.6–25.310.5–9.19.1–8.651.7–49.33.9–3.10.8–0.70.7–0.1
Nb3Sn47 ± 0.423.8 ± 0.42.6 ± 0.25.8 ± 0.25.0 ± 0.61.3 ± 0.114.5 ± 0.8
47.5–46.724.1–23.12.8–2.46.1–5.55.5–4.01.3–1.215.8–14.0
Nb5Si337.1 ± 0.424.2 ± 0.822.0 ± 1.33.2 ± 0.34.8 ± 0.35.8 ± 0.72.9 ± 0.4
37.6–6.525.0–23.523.5–20.93.5–3.05.0–4.56.4–5.0 3.2–2.5
Ti-rich Nb5Si333.2 ± 0.227.2 ± 1.324.9 ± 0.72.1 ± 0.44 ± 0.54.9 ± 0.73.7 ± 0.2
34.8–32.629.5–26.625.6–24.12.7–1.74.9–3.76.7–5.14.1–3.5
Table 3. Total weight gain and oxidation rate constants of OHS1 at 800 and 1200 °C.
TemperaturenKl (g·cm−2·s−1)Kp (g2·cm−4·s−1)Weight Gain (mg/cm2)
800 °C0.46-2.4 × 10⁻¹¹ (0–100) h3.19
1200 °C0.831.1 × 10−7 (> 3.1) h4.9 × 10−10 (0–3.1) h31.28
Table 4. Alloy parameters for the macrosegregation of Si (MACSi) in the cast alloys KZ5, ZF6, OHS1, and ZX8.
AlloyΔHm (kJ/mol)Tm (K)ΔHm/T (J/mol·K)ΔHmsd/ΔHmspTmsd (K)Tmsp (K)Tmsd/Tmsp[ΔHm/Tm] × [ΔHmsd/ΔHmsp]−1MACSi (at.%)
ZX8
OHS1
ZF6
KZ5
26.9
27.7
27.7
27.5
Materials 13 00722 i001
Table 5. Alloy parameters for the macrosegregation of Si in the cast alloys KZ7, ZF5, ZX6, and OHS1 considering the Al effect with Ge or Sn individually and simultaneously. Bold red numbers and arrows represent strong trends, while non-bold red numbers and arrows represent weak trends.
AlloyΔHm (kJ/mol)Tm (K)ΔHm/Tm (J/mol·K)ΔHmsd/ΔHmspTmsd (K)Tmsp (K)Tmsd/Tmsp[ΔHm/Tm] × [ΔHmsd/ΔHmsp]−1MACSi (at%)
OHS1
ZX6 (Al)
ZF5 (Al)
KZ7 (Al)
27.7
27.3
28
27.7
Materials 13 00722 i002
Table 6. Alloy parameters for the macrosegregation of Si in the cast alloys KZ4, ZF4, ZX4, and OHS1 considering the Cr effect with Ge and Sn individually (indicated by (Cr) next to the alloy designation) and simultaneously (alloy OHS1). Bold red numbers and arrows represent strong trends (excluding the Sn + Ge synergy in OHS1), while bold italics represent minima (in purple) and maxima (in green).
AlloyΔHm (kJ/mol)Tm (K)ΔHm/Tm (J/mol·K)ΔHmsd/ΔHmspTmsd (K)Tmsp (K)Tmsd/Tmsp[ΔHm/Tm] × [ΔHmsd/ΔHmsp]−1MACSi (at%)
ZX4 (Cr)
OHS1
ZF4 (Cr)
KZ4 (Cr)
27.8
27.7
28.4
28.2
Materials 13 00722 i003

