A Study on the Algorithm of Quality Evaluation for Fiber Laser Welding Process of ASTM A553-1 (9% Nickel Steel) Using Determination of Solidification Crack Susceptibility
Abstract
1. Introduction
2. Materials and Methods
3. Results
3.1. Measurement of Penetration Geometry
3.2. Measurement of Weldment Hardness
3.3. Measurement of Chemical Composition for Weldment
4. Discriminant of Quality Characteristics of 9% Ni Steel
4.1. Solidification Crack Susceptibility
4.2. Discriminant Analysis
5. Optimization of Fiber Laser Welding of 9% Ni Steel
5.1. Development of Mathematical Model Welding Factors
5.2. Optimization for Welding Process of 9% Ni Steel
6. Conclusions
- (1)
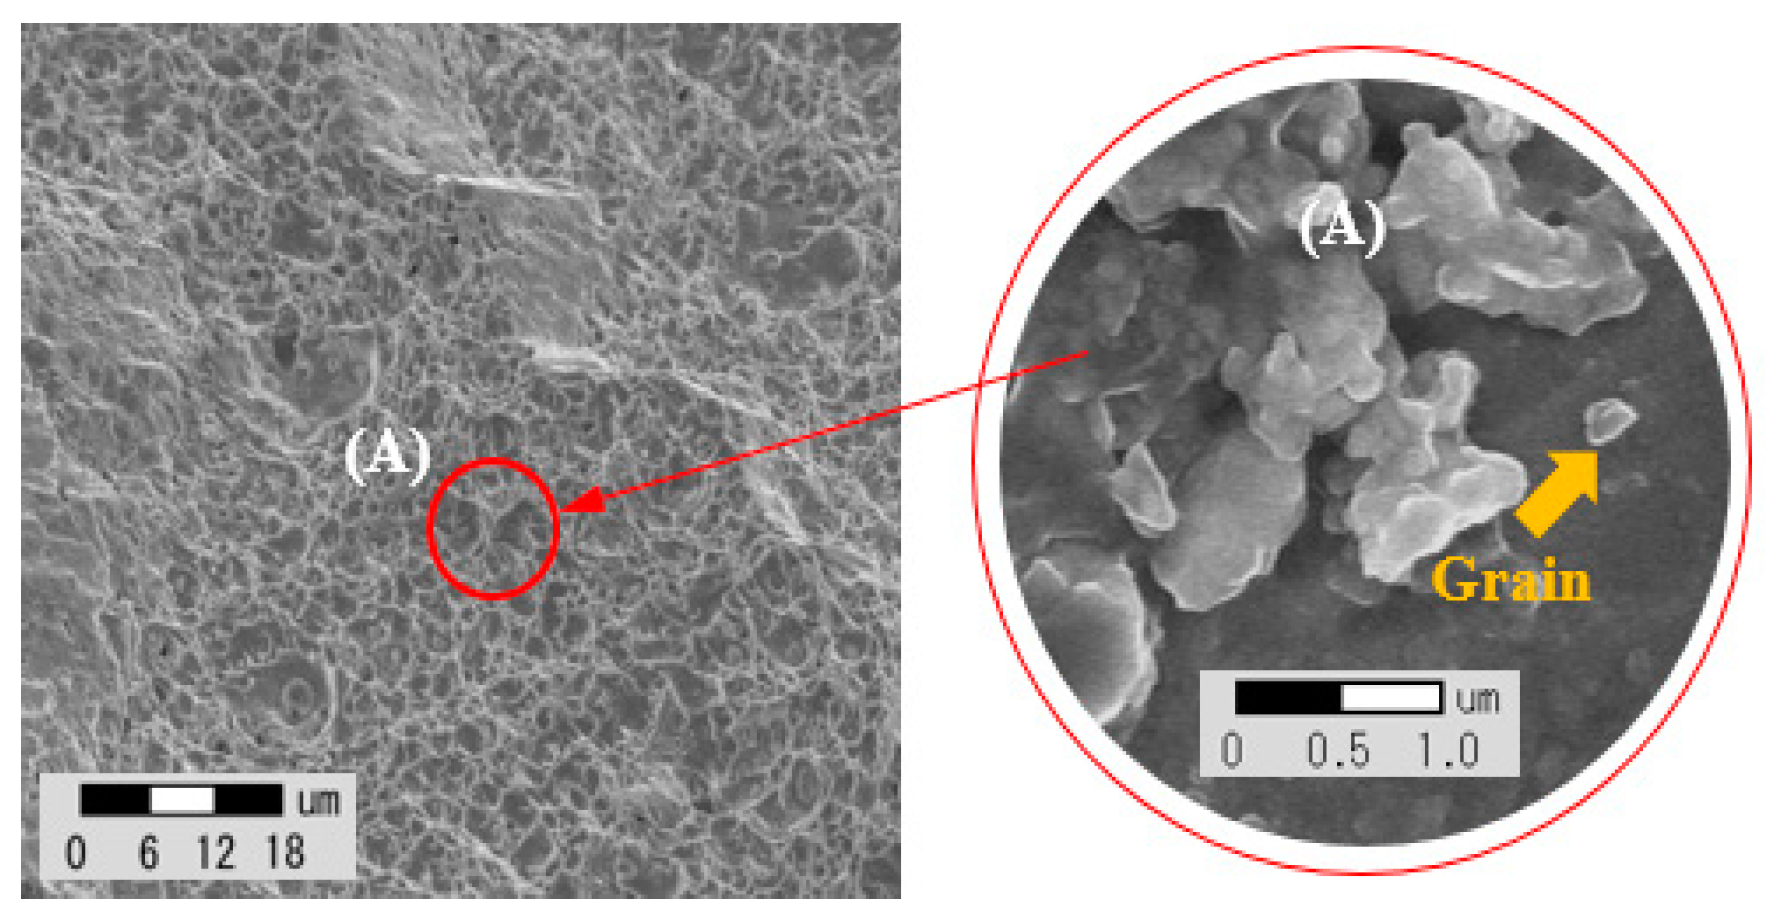
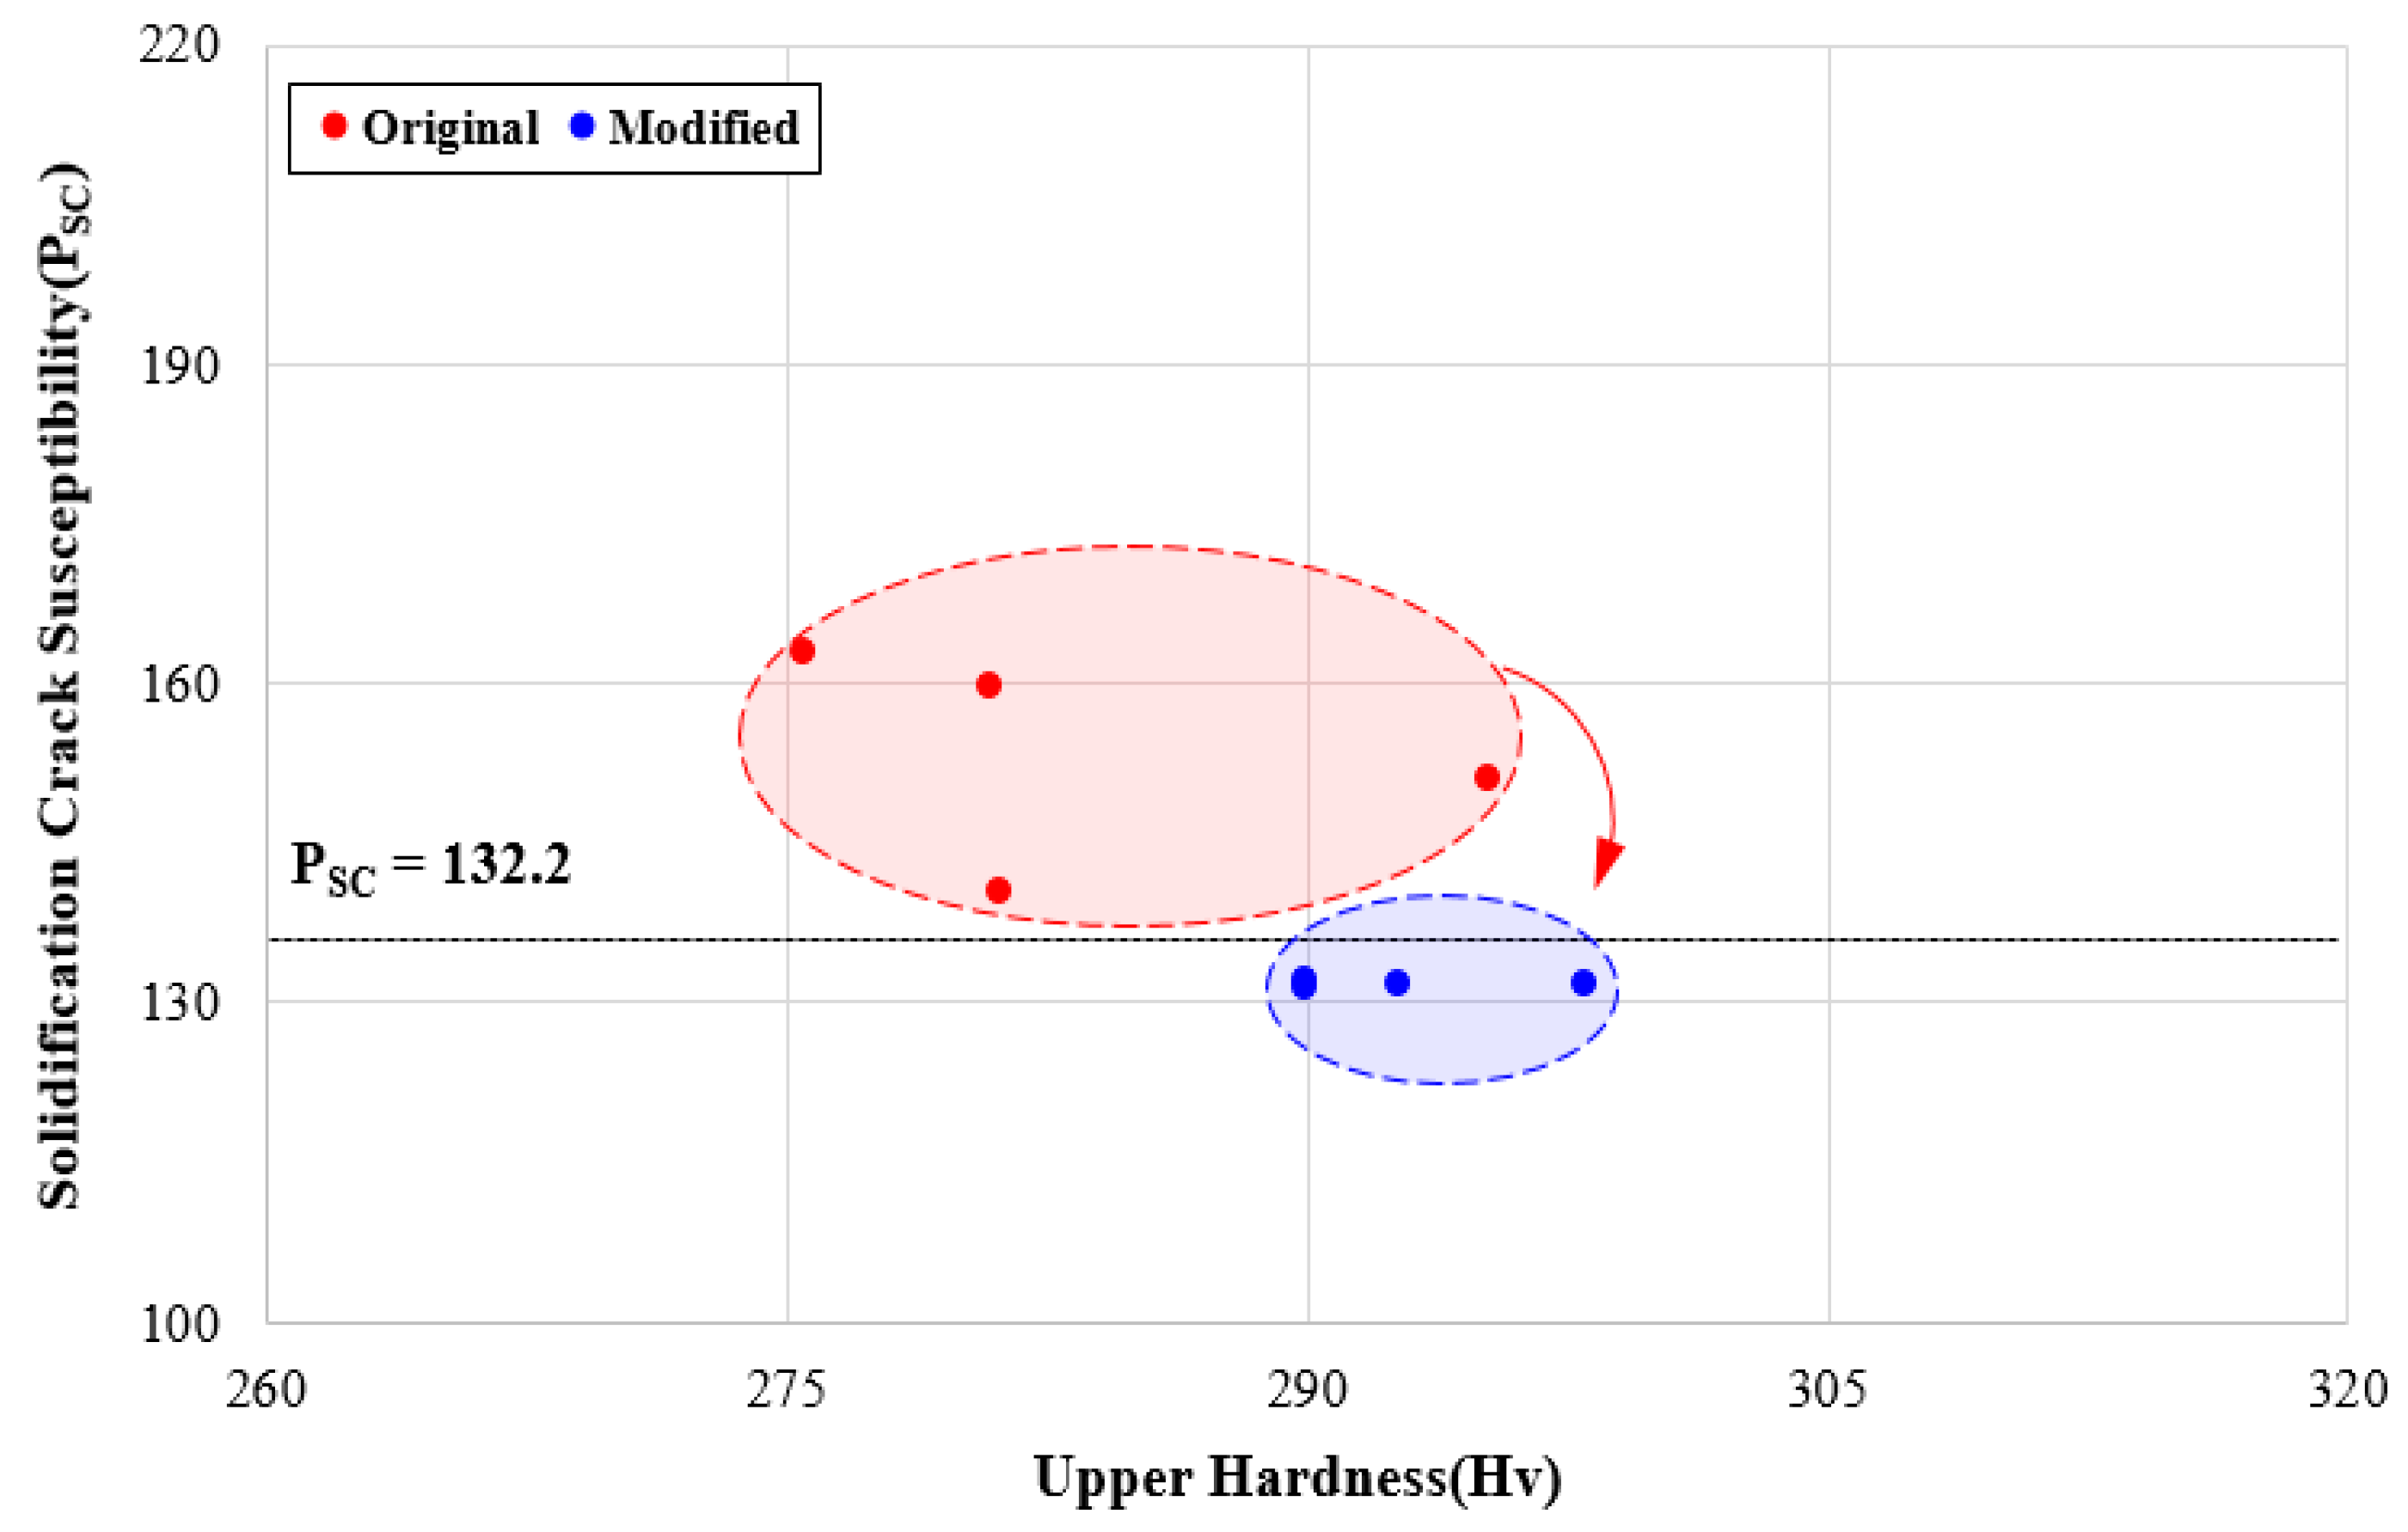
- The appropriate weldability of a welding part was confirmed by measuring the penetration shape, mechanical strength, and chemical composition of the welding part derived through the fiber laser welding test. The solidification crack susceptibility phenomenon was found where the upper hardness is lowered by the impurities concentrated on the upper part of the welding part. In addition, because it was difficult to secure a stable upper hardness when an index of solidification crack susceptibility of 132.2 or more was calculated, this number was defined as a criterion at which quality deterioration occurs.
- (2)
- To determine the solidification crack susceptibility of 9% Ni steel caused by welding process parameters, the SVM technique was used to learn the quality deterioration characteristics. It was then examined whether the group where quality deterioration occurred was accurately identified. As a result, it was found that the group where the solidification crack susceptibility occurred was predicted accurately at 100% and this result was used as a procedure to determine the quality deterioration of a welding part.
- (3)
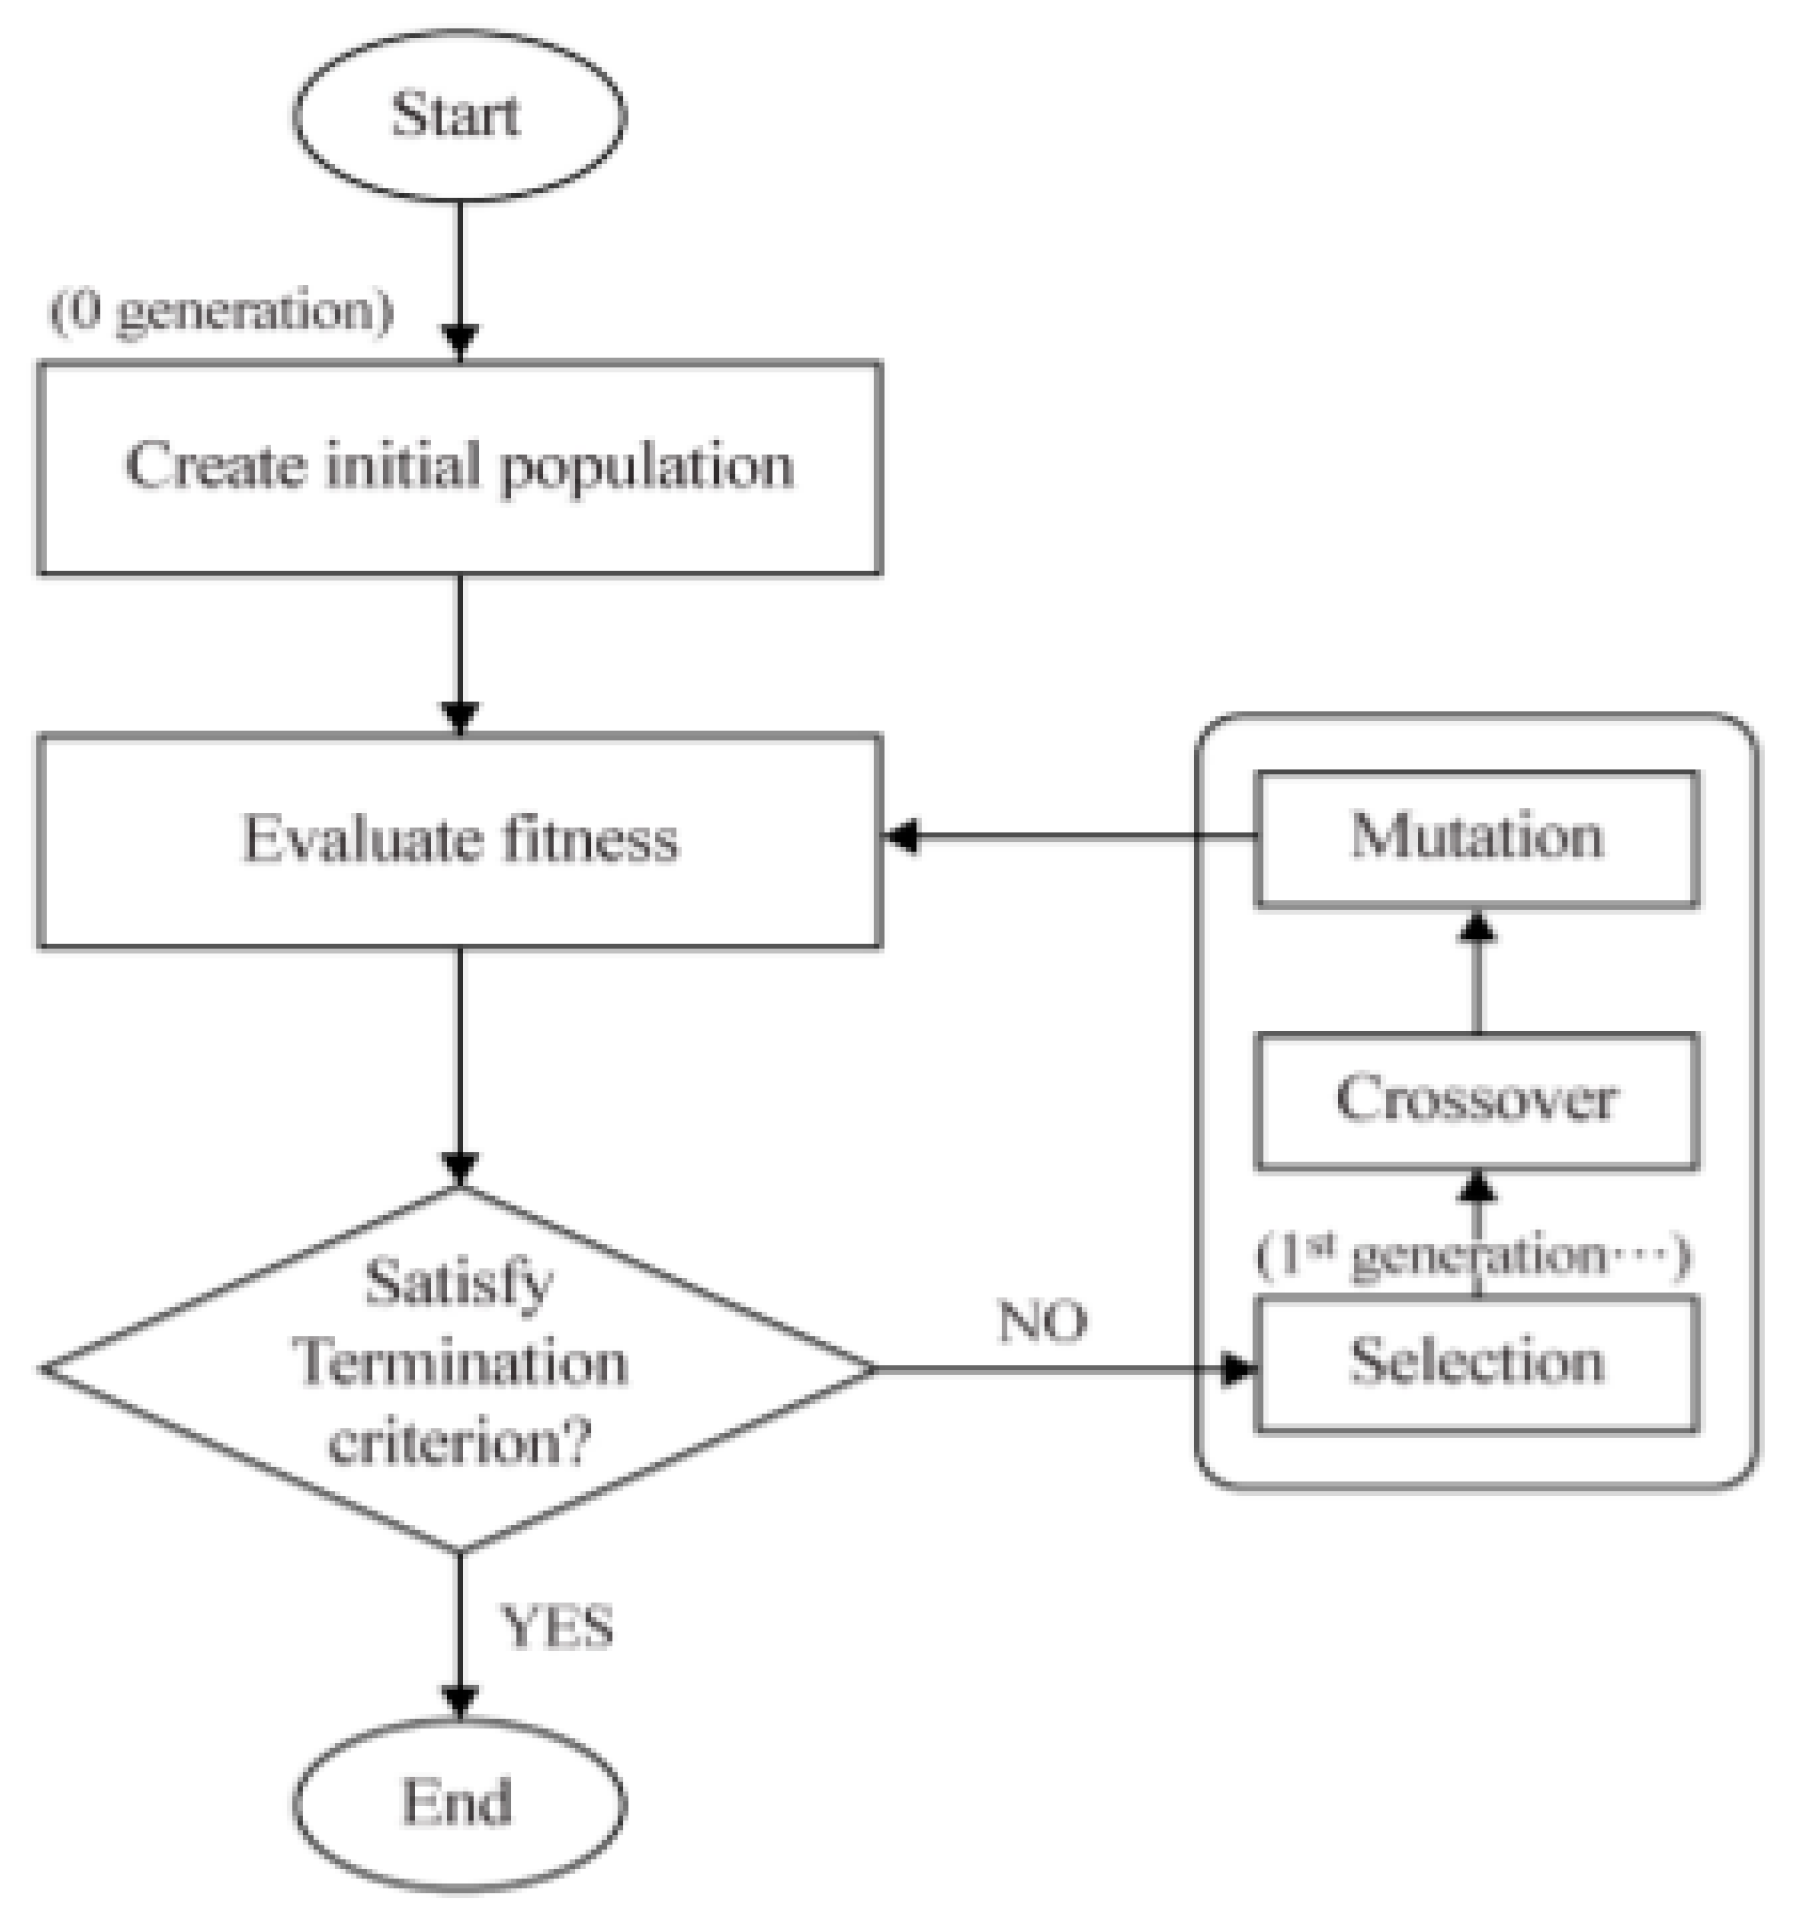
- A mathematical predicted model for the response surface method was developed to apply an objective function to optimize the welding process parameters where quality deterioration occurs and it was used in a multipurpose optimization algorithm. By entering raw data from where the solidification crack susceptibility occurred into the optimization algorithm created by the defined objective function and constraints, the quality deterioration characteristics intrinsic in the process parameters were supplemented.
- (4)
- The predicted welding factors were calculated by entering the input parameters supplemented with the quality deterioration characteristic into the response surface mathematical model. When re-entering the output parameters into a discriminant system, it was found that the possibility of quality deterioration of all raw data, where the solidification crack susceptibility is considered, was removed.
Author Contributions
Funding
Conflicts of Interest
References
- Schinas, O.; Butler, M. Feasibility and commercial considerations of LNG-fueled ships. Ocean Eng. 2016, 122, 84–96. [Google Scholar] [CrossRef]
- Azzara, A.; Rutherford, D.; Wang, H. Feasibility of IMO annex VI Tier III implementation using selective catalytic reduction. Int. Counc. Clean Transp. 2014, 4, 1–9. [Google Scholar]
- Li, K.; Wu, M.; Gu, X.; Yuan, K.F.; Xiao, Y. Determinants of ship operator’s options for compliance with IMO 2020. Transp Res Procedia. 2020, 86, 1–17. [Google Scholar]
- Lee, H.J.; Yoo, S.H.; Huh, S.Y. Economic benefits of introducing LNG-fuelled ships for imported flour in South Korea. Transp Res Procedia. 2020, 78, 1–12. [Google Scholar] [CrossRef]
- Chang, W.S.; Kim, K.C.; Kim, Y.C.; Kim, S.R.; Kim, W.S. Ni alloy welding consumables for 9% Nickel steel. Korean Weld. Join Soc. 1998, 16, 25–37. [Google Scholar]
- ASTM E23. Standard Test Methods for Notched Bar Impact Testing of Metallic Materials. Am. Soc. Test. Mater. 2007, 7, 1–6. [Google Scholar]
- Kim, H.S. Investigation of welding joint-design and technique for 9% Ni steel. J. KWS 2002, 20, 605–611. [Google Scholar]
- Lee, G.H.; Jeon, H.S. Status and prospect of site welding technology for LNG storage tank. J. Korean Weld. Soc. 1995, 13, 8–17. [Google Scholar]
- Kim, Y.S.; Kim, S.C. Latest welding technology for storage and transportation facilities of liquified natural gas. J. Korean Soc. Mar. Eng. 2016, 40, 17–27. [Google Scholar]
- Saitoh, N.; Muraoka, H.; Yamaba, R.; Saeki, O. Development of heavy 9% nickel steel plates with superior low-temperature toughness for LNG storage tanks. Nippon. Steel Tech. Rep. 1993, 58, 9–16. [Google Scholar]
- Watanabe, I.; Suzuki, M.; Matsuda, Y.; Tagawa, H.; Matsui, K.; Shimada, S. Fracture toughness of 9% Ni steel and safety of LNG storage tank against brittle fracture. Nippon Kokan Tech. Rep. 1984, 42, 2–10. [Google Scholar]
- Liu, X.; Athanasiou, C.E.; Padture, N.P.; Sheldon, B.W.; Gao, H. A machine learning approach to fracture mechanics problems. J. Acta Materialia 2020, 190, 105–112. [Google Scholar] [CrossRef]
- Oh, D.J.; Lee, J.M.; Noh, B.J.; Kim, W.S.; Ando, R.; Matsumoto, T.; Kim, M.H. Investigation of fatigue performance of low temperature alloys for liquefied natural gas storage tanks. J. Mech. Eng. 2015, 229, 1–15. [Google Scholar] [CrossRef]
- Kourshid, A.F.M.; Ghanem, M. Using the welding parameters to improve the mechanical properties of Liquefied Natural Gas storage tank welded joint. IOSR J. Mechnical Civil Eng. (IOSR-JMCE) 2012, 4, 32–39. [Google Scholar] [CrossRef]
- Nishigami, H.; Kusagawa, M.; Yamahita, M.; Kawabata, T.; Kamo, T.; Onishi, K.; Hirai, S.; Sakato, N.; Mitsumoto, M.; Hagihara, Y. Development and realization of large scale LNG storage tank applying 7% Nikel steel plate. In Proceedings of the 2015 World Gas Conference, Paris, France, 1–5 June 2012; pp. 1–18. [Google Scholar]
- Kruzic, R. LNG storage tanks: Advancements in weld inspections. Hydrocarb. Process. July 2004, 2004, 53–55. [Google Scholar]
- Paura, R. IPG Fiber lasers: What’s new in applications for fabricators. In Proceedings of the ALAW Laser Application Workshop, Plymouth, MI, USA, 13–14 May 2009; Volume 1, pp. 1–55. [Google Scholar]
- Nakao, Y.; Kang, J.Y. Welding and bonding of super alloys. Korean Weld. Join Soc. 1990, 8, 8–20. [Google Scholar]
- Kim, Z.H. A Comparative Study of Classification Techniques Using Forest Cover Type Data: Discriminant Analysis, Logistic Regression, Neural Network, Decision Tree. Unpublished Master’s Thesis, Chung-Ang University, Seoul, Korea, 2012. [Google Scholar]
- Amrine, D.E.; White, B.J.; Larson, R.L. Comparison of classification algorithms to predict outcomes of feedlot cattle identified and treated for bovine respiratory disease. Comput. Electron. Agric. 2014, 105, 9–19. [Google Scholar] [CrossRef]
- Knowles, J.D.; Corne, D.W. Approximating the nondominated front using the pareto archived evolution strategy. Evol. Comput. 2000, 8, 149–172. [Google Scholar] [CrossRef]
- Vapnik, V.N. The Nature of Statistical Learning Theory; Springer: Berlin/Heidelberg, Germany, 1999. [Google Scholar]
- Deb, K.; Agrawal, S.; Pratap, A.; Meyarivan, T. A fast elitist non-dominated sorting genetic algorithm for multi-objective optimization: NSGA-II. Lect. Notes Comput. Sci. 2000, 1917, 849–858. [Google Scholar]
- Zitzler, E.; Deb, K.; Thiele, L. Comparison of multiobjective evolutionary algorithms: Empirical results. Evol. Comput. 2000, 8, 173–195. [Google Scholar] [CrossRef]
- Veldjuizen, D.A.V.; Lamont, G.B. On measuring multiobjective evolutionary algorithm performance. Evol. Comput. 2000, 1, 204–211. [Google Scholar]
- Deb, K.; Pratap, A.; Agarwal, S.; Meyarivan, T.A. A fast and elitist multi objective genetic algorithm: NSGA-II. IEEE Trans. Evol. Comput. 2002, 6, 182–197. [Google Scholar] [CrossRef]




| Material | Yield Strength (MPa) | Tensile Strength (MPa) | Elongation (%) | Hardness (HV) |
|---|---|---|---|---|
| A553-1 | 651.6 | 701.1 | 26.6 | 243 |
| Component | C | Si | Mn | S | P | Ni | Fe |
|---|---|---|---|---|---|---|---|
| Percentage (wt.%) | 0.05 | 0.67 | 0.004 | 0.003 | 0.25 | 9.02 | Bal. |
| Parameter | Symbol | −1 | 0 | 1 |
| Laser Power (kW) | 3.0 | 4.0 | 5.0 | |
| Defocusing (mm) | −0.5 | 0.0 | 0.5 | |
| Welding Speed (m/min) | 0.5 | − | 0.8 | |
| Fixed Parameter | Wavelength: 1070 nm | |||
| Optical Fiber Diameter: 200 µm | ||||
| Shielding Gas Flow Rate: 18 L/min, (L/min) | ||||
| Test No. | L | D | S | Test No. | L | D | S |
|---|---|---|---|---|---|---|---|
| 1 | 3.0 | −0.5 | 0.5 | 10 | 3.0 | −0.5 | 0.8 |
| 2 | 3.0 | 0.0 | 0.5 | 11 | 3.0 | 0.0 | 0.8 |
| 3 | 3.0 | 0.5 | 0.5 | 12 | 3.0 | 0.5 | 0.8 |
| 4 | 4.0 | −0.5 | 0.5 | 13 | 4.0 | −0.5 | 0.8 |
| 5 | 4.0 | 0.0 | 0.5 | 14 | 4.0 | 0.0 | 0.8 |
| 6 | 4.0 | 0.5 | 0.5 | 15 | 4.0 | 0.5 | 0.8 |
| 7 | 5.0 | −0.5 | 0.5 | 16 | 5.0 | −0.5 | 0.8 |
| 8 | 5.0 | 0.0 | 0.5 | 17 | 5.0 | 0.0 | 0.8 |
| 9 | 5.0 | 0.5 | 0.5 | 18 | 5.0 | 0.5 | 0.8 |
| Test No. | Penetration Width (mm) | Penetration Depth (mm) | Penetration Geometry | ||||||
|---|---|---|---|---|---|---|---|---|---|
| 1st | 2nd | 3rd | Average | 1st | 2nd | 3rd | Average | ||
| 1 | 3.93 | 3.90 | 3.90 | 3.91 ± 0.008 | 6.49 | 6.47 | 6.51 | 6.49 ± 0.009 |  |
| 2 | 3.19 | 3.18 | 3.17 | 3.18 ± 0.005 | 6.64 | 6.66 | 6.64 | 6.65 ± 0.005 |  |
| 3 | 4.73 | 4.72 | 4.69 | 4.71 ± 0.010 | 7.21 | 7.22 | 7.15 | 7.19 ± 0.018 |  |
| 4 | 5.82 | 5.86 | 5.84 | 5.84 ± 0.009 | 8.52 | 8.51 | 8.55 | 8.53 ± 0.010 |  |
| 5 | 5.48 | 5.49 | 5.49 | 5.49 ± 0.003 | 8.17 | 8.15 | 8.15 | 8.16 ± 0.005 |  |
| 6 | 3.61 | 3.71 | 3.5 | 3.61 ± 0.050 | 7.84 | 7.82 | 7.79 | 7.82 ± 0.012 |  |
| 7 | 6.59 | 6.58 | 6.58 | 6.58 ± 0.003 | 9.11 | 9.12 | 9.11 | 9.11 ± 0.003 |  |
| 8 | 6.54 | 6.55 | 6.55 | 6.55 ± 0.003 | 9.49 | 9.51 | 9.53 | 9.51 ± 0.009 |  |
| 9 | 7.01 | 7.03 | 7.04 | 7.03 ± 0.007 | 10.09 | 10.09 | 10.11 | 10.1 ± 0.005 |  |
| 10 | 2.51 | 2.47 | 2.37 | 2.45 ± 0.034 | 4.86 | 4.78 | 4.79 | 4.81 ± 0.021 |  |
| 11 | 2.21 | 2.28 | 2.32 | 2.27 ± 0.026 | 4.95 | 4.89 | 4.95 | 4.93 ± 0.016 |  |
| 12 | 3.26 | 3.27 | 3.22 | 3.25 ± 0.012 | 5.19 | 5.23 | 5.21 | 5.21 ± 0.009 |  |
| 13 | 3.25 | 3.23 | 3.17 | 3.22 ± 0.020 | 5.49 | 5.48 | 5.44 | 5.47 ± 0.012 |  |
| 14 | 3.22 | 3.30 | 3.20 | 3.24 ± 0.025 | 6.25 | 6.24 | 6.29 | 6.26 ± 0.012 |  |
| 15 | 2.82 | 2.84 | 2.86 | 2.84 ± 0.009 | 5.43 | 5.44 | 5.54 | 5.47 ± 0.029 |  |
| 16 | 4.94 | 4.97 | 4.91 | 4.94 ± 0.014 | 6.18 | 6.24 | 6.21 | 6.21 ± 0.014 |  |
| 17 | 4.25 | 4.19 | 4.21 | 4.22 ± 0.014 | 7.26 | 7.24 | 7.24 | 7.25 ± 0.005 |  |
| 18 | 5.84 | 5.83 | 5.85 | 5.84 ± 0.005 | 7.47 | 7.41 | 7.44 | 7.44 ± 0.014 |  |
| Test No. | Upper by Point (Hv) | Test No. | HAZ (Heat Affected Zone) by Point (Hv) | |||||||||||
|---|---|---|---|---|---|---|---|---|---|---|---|---|---|---|
| 1st | 2nd | 3rd | 4th | 5th | Avg. | 1st | 2nd | 3rd | 4th | 5th | 6th | Avg. | ||
| 1 | 266.6 | 262.1 | 264.9 | 262.3 | 264.8 | 264.2 | 1 | 374.1 | 373.4 | 373.1 | 373.2 | 373.6 | 373.7 | 373.5 |
| 2 | 296.4 | 300.0 | 294.6 | 293.6 | 291.1 | 295.2 | 2 | 379.6 | 380.8 | 379.8 | 380.0 | 380.0 | 379.6 | 380.0 |
| 3 | 283.3 | 279.0 | 282.6 | 282.7 | 280.9 | 281.7 | 3 | 379.8 | 379.9 | 380.4 | 381.0 | 379.8 | 380.6 | 380.3 |
| 4 | 277.4 | 279.8 | 276.1 | 287.3 | 284.7 | 281.1 | 4 | 384.1 | 384.1 | 384.4 | 384.0 | 384.7 | 384.3 | 384.3 |
| 5 | 314.6 | 305.9 | 299.2 | 300.6 | 311.4 | 306.3 | 5 | 382.4 | 382.8 | 383.4 | 382.8 | 382.4 | 382.7 | 382.7 |
| 6 | 270.7 | 277.1 | 274.2 | 269.5 | 269.0 | 272.1 | 6 | 376.1 | 376.5 | 376.5 | 376.3 | 377.2 | 376.8 | 376.6 |
| 7 | 314.6 | 312.7 | 306.0 | 313.7 | 314.7 | 312.4 | 7 | 386.3 | 386.3 | 386.8 | 386.0 | 386.6 | 385.9 | 386.3 |
| 8 | 308.3 | 301.1 | 303.3 | 302.8 | 302.8 | 303.7 | 8 | 385.4 | 385.4 | 385.0 | 385.6 | 385.0 | 385.8 | 385.4 |
| 9 | 283.7 | 287.5 | 287.1 | 280.6 | 284.6 | 284.7 | 9 | 377.5 | 377.4 | 376.3 | 378.5 | 377.6 | 378.5 | 377.7 |
| 10 | 289.6 | 284.2 | 274.6 | 284.3 | 281.8 | 282.9 | 10 | 372.4 | 371.9 | 373.0 | 371.5 | 371.8 | 371.5 | 372.0 |
| 11 | 295.3 | 295.6 | 293.0 | 289.3 | 294.2 | 293.5 | 11 | 371.4 | 371.8 | 370.8 | 371.3 | 371.3 | 371.2 | 371.3 |
| 12 | 280.9 | 278.1 | 272.8 | 276.3 | 279.5 | 277.5 | 12 | 372.6 | 371.8 | 371.7 | 372.3 | 371.2 | 372.7 | 372.1 |
| 13 | 279.2 | 276.2 | 282.4 | 277.4 | 283.2 | 279.7 | 13 | 373.0 | 373.2 | 372.6 | 373.0 | 373.6 | 372.8 | 373.1 |
| 14 | 279.1 | 276.1 | 273.7 | 272.8 | 276.1 | 275.5 | 14 | 373.6 | 373.4 | 373.5 | 374.0 | 372.6 | 373.1 | 373.4 |
| 15 | 278.2 | 279.8 | 291.8 | 282.1 | 284.0 | 283.2 | 15 | 371.9 | 372.8 | 371.6 | 371.8 | 372.5 | 372.0 | 372.1 |
| 16 | 276.5 | 275.7 | 275.7 | 274.1 | 274.0 | 275.2 | 16 | 375.7 | 375.5 | 376.0 | 375.3 | 375.6 | 374.9 | 375.5 |
| 17 | 280.3 | 280.4 | 285.7 | 279.6 | 278.3 | 280.9 | 17 | 381.4 | 381.2 | 381.9 | 373.0 | 373.8 | 372.4 | 377.3 |
| 18 | 277.6 | 280.9 | 271.5 | 274.9 | 278.6 | 276.7 | 18 | 375.9 | 376.3 | 376.2 | 374.9 | 374.9 | 375.8 | 375.7 |
| Test No. | Ti | Nb | Mo | Si |
|---|---|---|---|---|
| 1 | 0.0204 ± 8.0 × 10⁻⁵ | 0.1036 ± 8.3 × 10⁻⁴ | 0.0154 ± 9.1 × 10⁻⁵ | 0.7395 ± 7.0 × 10⁻² |
| 2 | 0.0205 ± 1.3 × 10⁻⁴ | 0.1038 ± 1.0 × 10⁻³ | 0.0157 ± 1.3 × 10⁻⁴ | 0.6729 ± 6.5 × 10⁻² |
| 3 | 0.0203 ± 8.5 × 10⁻⁵ | 0.1040 ± 1.1 × 10⁻³ | 0.0156 ± 1.2 × 10⁻⁴ | 0.7357 ± 7.3 × 10⁻² |
| 4 | 0.0205 ± 9.5 × 10⁻⁵ | 0.1049 ± 8.6 × 10⁻⁴ | 0.0159 ± 1.6 × 10⁻⁴ | 0.6374 ± 7.1 × 10⁻² |
| 5 | 0.0205 ± 1.0 × 10⁻⁴ | 0.1031 ± 8.4 × 10⁻⁴ | 0.0160 ± 1.2 × 10⁻⁴ | 0.5598 ± 5.2 × 10⁻² |
| 6 | 0.0205 ± 9.7× 10⁻⁵ | 0.1048 ± 7.9 × 10⁻⁴ | 0.0157 ± 1.1 × 10⁻⁴ | 0.7617 ± 6.8 × 10⁻² |
| 7 | 0.0206 ± 8.9 × 10⁻⁵ | 0.1051 ± 9.7 × 10⁻⁴ | 0.0157 ± 1.7 × 10⁻⁴ | 0.6101 ± 5.7 × 10⁻² |
| 8 | 0.0206 ± 8.4 × 10⁻⁵ | 0.1055 ± 9.6 × 10⁻⁴ | 0.0158 ± 1.5 × 10⁻⁴ | 0.5828 ± 6.4 × 10⁻² |
| 9 | 0.0204 ± 1.2 × 10⁻⁴ | 0.1030 ± 7.2 × 10⁻⁴ | 0.0156 ± 9.3 × 10⁻⁵ | 0.6989 ± 7.9 × 10⁻² |
| 10 | 0.0205 ± 6.7 × 10⁻⁵ | 0.1067 ± 6.7 × 10⁻⁴ | 0.0159 ± 1.4 × 10⁻⁴ | 0.6899 ± 5.9 × 10⁻² |
| 11 | 0.0207 ± 6.3 × 10⁻⁵ | 0.1059 ± 7.2 × 10⁻⁴ | 0.0157 ± 1.3 × 10⁻⁴ | 0.6023 ± 6.7 × 10⁻² |
| 12 | 0.0205 ± 1.1 × 10⁻⁴ | 0.1032 ± 8.0 × 10⁻⁴ | 0.0162 ± 1.2 × 10⁻⁴ | 0.7631 ± 6.8 × 10⁻² |
| 13 | 0.0204 ± 1.0 × 10⁻⁴ | 0.1043 ± 7.4 × 10⁻⁴ | 0.0157 ± 1.3 × 10⁻⁴ | 0.7689 ± 6.4 × 10⁻² |
| 14 | 0.0206 ± 6.3 × 10⁻⁵ | 0.1052 ± 1.1 × 10⁻³ | 0.0158 ± 1.4 × 10⁻⁴ | 0.7125 ± 5.7 × 10⁻² |
| 15 | 0.0205 ± 7.6 × 10⁻⁵ | 0.1043 ± 7.9 × 10⁻⁴ | 0.0156 ± 1.6 × 10⁻⁴ | 0.6254 ± 5.9 × 10⁻² |
| 16 | 0.0205 ± 8.9 × 10⁻⁵ | 0.1043 ± 1.2 × 10⁻³ | 0.0158 ± 1.3 × 10⁻⁴ | 0.7126 ± 5.7 × 10⁻² |
| 17 | 0.0204 ± 7.5 × 10⁻⁵ | 0.1041 ± 1.0 × 10⁻³ | 0.0153 ± 1.1 × 10⁻⁴ | 0.7018 ± 7.0 × 10⁻² |
| 18 | 0.0206 ± 8.8 × 10⁻⁵ | 0.1054 ± 6.2 × 10⁻⁴ | 0.0159 ± 1.3 × 10⁻⁴ | 0.8315 ± 5.0 × 10⁻² |
| Test No. | Upper Hardness (Hv) | Value of PSC | Crack Susceptibility | Test No. | Upper Hardness (Hv) | Value of PSC | Crack Susceptibility |
|---|---|---|---|---|---|---|---|
| 1 | 264.2 ± 0.8 | 170.9 ± 2.1 | Unstable | 10 | 282.9 ± 2.2 | 156.1 ± 1.8 | Unstable |
| 2 | 295.2 ± 1.3 | 151.0 ± 2.0 | Unstable | 11 | 293.5 ± 1.0 | 129.9 ± 2.0 | Stable |
| 3 | 281.7 ± 0.7 | 169.8 ± 2.2 | Unstable | 12 | 277.5 ± 1.3 | 178.0 ± 2.0 | Unstable |
| 4 | 281.1 ± 1.9 | 140.4 ± 2.1 | Unstable | 13 | 279.7 ± 1.2 | 179.8 ± 1.9 | Unstable |
| 5 | 306.3 ± 2.7 | 117.0 ± 1.6 | Stable | 14 | 275.5 ± 1.0 | 162.9 ± 1.7 | Unstable |
| 6 | 272.1 ± 1.4 | 177.6 ± 2.1 | Unstable | 15 | 283.2 ± 2.1 | 136.7 ± 1.8 | Unstable |
| 7 | 312.4 ± 1.5 | 132.2 ± 1.7 | Stable | 16 | 275.2 ± 0.4 | 162.9 ± 1.7 | Unstable |
| 8 | 303.7 ± 1.1 | 124.0 ± 1.9 | Stable | 17 | 280.9 ± 1.1 | 159.6 ± 2.1 | Unstable |
| 9 | 284.7 ± 1.1 | 158.7 ± 2.4 | Unstable | 18 | 276.7 ± 1.4 | 198.6 ± 1.5 | Unstable |
| Test No. | L | D | S | PW | PD | HU | HH | PSC | Group |
|---|---|---|---|---|---|---|---|---|---|
| 1 | 3.0 | −5.0 | 0.5 | 3.91 ± 0.008 | 6.49 ± 0.009 | 264.2 ± 0.8 | 373.5 ± 0.1 | 170.9 ± 2.1 | Unstable |
| 2 | 3.0 | 0.0 | 0.5 | 3.18 ± 0.005 | 6.65 ± 0.005 | 295.2 ± 1.3 | 380.0 ± 0.2 | 151.0 ± 2.0 | Unstable |
| 3 | 3.0 | 5.0 | 0.5 | 4.71 ± 0.010 | 7.19 ± 0.018 | 281.7 ± 0.7 | 380.3 ± 0.2 | 169.8 ± 2.2 | Unstable |
| 4 | 4.0 | −5.0 | 0.5 | 5.84 ± 0.009 | 8.53 ± 0.010 | 281.1 ± 1.9 | 384.3 ± 0.1 | 140.4 ± 2.1 | Unstable |
| 5 | 4.0 | 0.0 | 0.5 | 5.49 ± 0.003 | 8.16 ± 0.005 | 306.3 ± 2.7 | 382.7 ± 0.1 | 117.0 ± 1.6 | Stable |
| 6 | 4.0 | 5.0 | 0.5 | 3.61 ± 0.050 | 7.82 ± 0.012 | 272.1 ± 1.4 | 376.6 ± 0.1 | 177.6 ± 2.1 | Unstable |
| 7 | 5.0 | −5.0 | 0.5 | 6.58 ± 0.003 | 9.11 ± 0.003 | 312.4 ± 1.5 | 386.3 ± 0.1 | 132.2 ± 1.7 | Stable |
| 8 | 5.0 | 0.0 | 0.5 | 6.55 ± 0.003 | 9.51 ± 0.009 | 303.7 ± 1.1 | 385.4 ± 0.1 | 124.0 ± 1.9 | Stable |
| 9 | 5.0 | 5.0 | 0.5 | 7.03 ± 0.007 | 10.1 ± 0.005 | 284.7 ± 1.1 | 377.7 ± 0.3 | 158.7 ± 2.4 | Unstable |
| 10 | 3.0 | −5.0 | 0.8 | 2.45 ± 0.034 | 4.81 ± 0.021 | 282.9 ± 2.2 | 372.0 ± 0.2 | 156.1 ± 1.8 | Unstable |
| 11 | 3.0 | 0.0 | 0.8 | 2.27 ± 0.026 | 4.93 ± 0.016 | 293.5 ± 1.0 | 371.3 ± 0.1 | 129.9 ± 2.0 | Stable |
| 12 | 3.0 | 5.0 | 0.8 | 3.25 ± 0.012 | 5.21 ± 0.009 | 277.5 ± 1.3 | 372.1 ± 0.2 | 178.0 ± 2.0 | Unstable |
| 13 | 4.0 | −5.0 | 0.8 | 3.22 ± 0.020 | 5.47 ± 0.012 | 279.7 ± 1.2 | 373.1 ± 0.1 | 179.8 ± 1.9 | Unstable |
| 14 | 4.0 | 0.0 | 0.8 | 3.24 ± 0.025 | 6.26 ± 0.012 | 275.5 ± 1.0 | 373.4 ± 0.2 | 162.9 ± 1.7 | Unstable |
| 15 | 4.0 | 5.0 | 0.8 | 2.84 ± 0.009 | 5.47 ± 0.029 | 283.2 ± 2.1 | 372.1 ± 0.2 | 136.7 ± 1.8 | Unstable |
| 16 | 5.0 | −5.0 | 0.8 | 4.94 ± 0.014 | 6.21 ± 0.014 | 275.2 ± 0.4 | 375.5 ± 0.1 | 162.9 ± 1.7 | Unstable |
| 17 | 5.0 | 0.0 | 0.8 | 4.22 ± 0.014 | 7.25 ± 0.005 | 280.9 ± 1.1 | 377.3 ± 1.7 | 159.6 ± 2.1 | Unstable |
| 18 | 5.0 | 5.0 | 0.8 | 5.84 ± 0.005 | 7.44 ± 0.014 | 276.7 ± 1.4 | 375.7 ± 0.2 | 198.6 ± 1.5 | Unstable |
| Test No. | Measured Group | Predicted Group | Test No. | Measured Group | Predicted Group |
|---|---|---|---|---|---|
| 1 | 1 | 1 (1.00) | 10 | 1 | 1 (1.00) |
| 2 | 1 | 1 (1.00) | 11 | 0 | 0 (0.27) |
| 3 | 1 | 1 (1.00) | 12 | 1 | 1 (1.00) |
| 4 | 1 | 1 (0.99) | 13 | 1 | 1 (1.00) |
| 5 | 0 | 0 (0.00) | 14 | 1 | 1 (1.00) |
| 6 | 1 | 1 (1.00) | 15 | 1 | 1 (1.00) |
| 7 | 0 | 0 (0.00) | 16 | 1 | 1 (1.00) |
| 8 | 0 | 0 (0.00) | 17 | 1 | 1 (1.00) |
| 9 | 1 | 1 (1.00) | 18 | 1 | 1 (1.00) |
| Design Parameter | Predicted Model | SE (Standard Error) | R2 (Coefficient of Determination, %) |
|---|---|---|---|
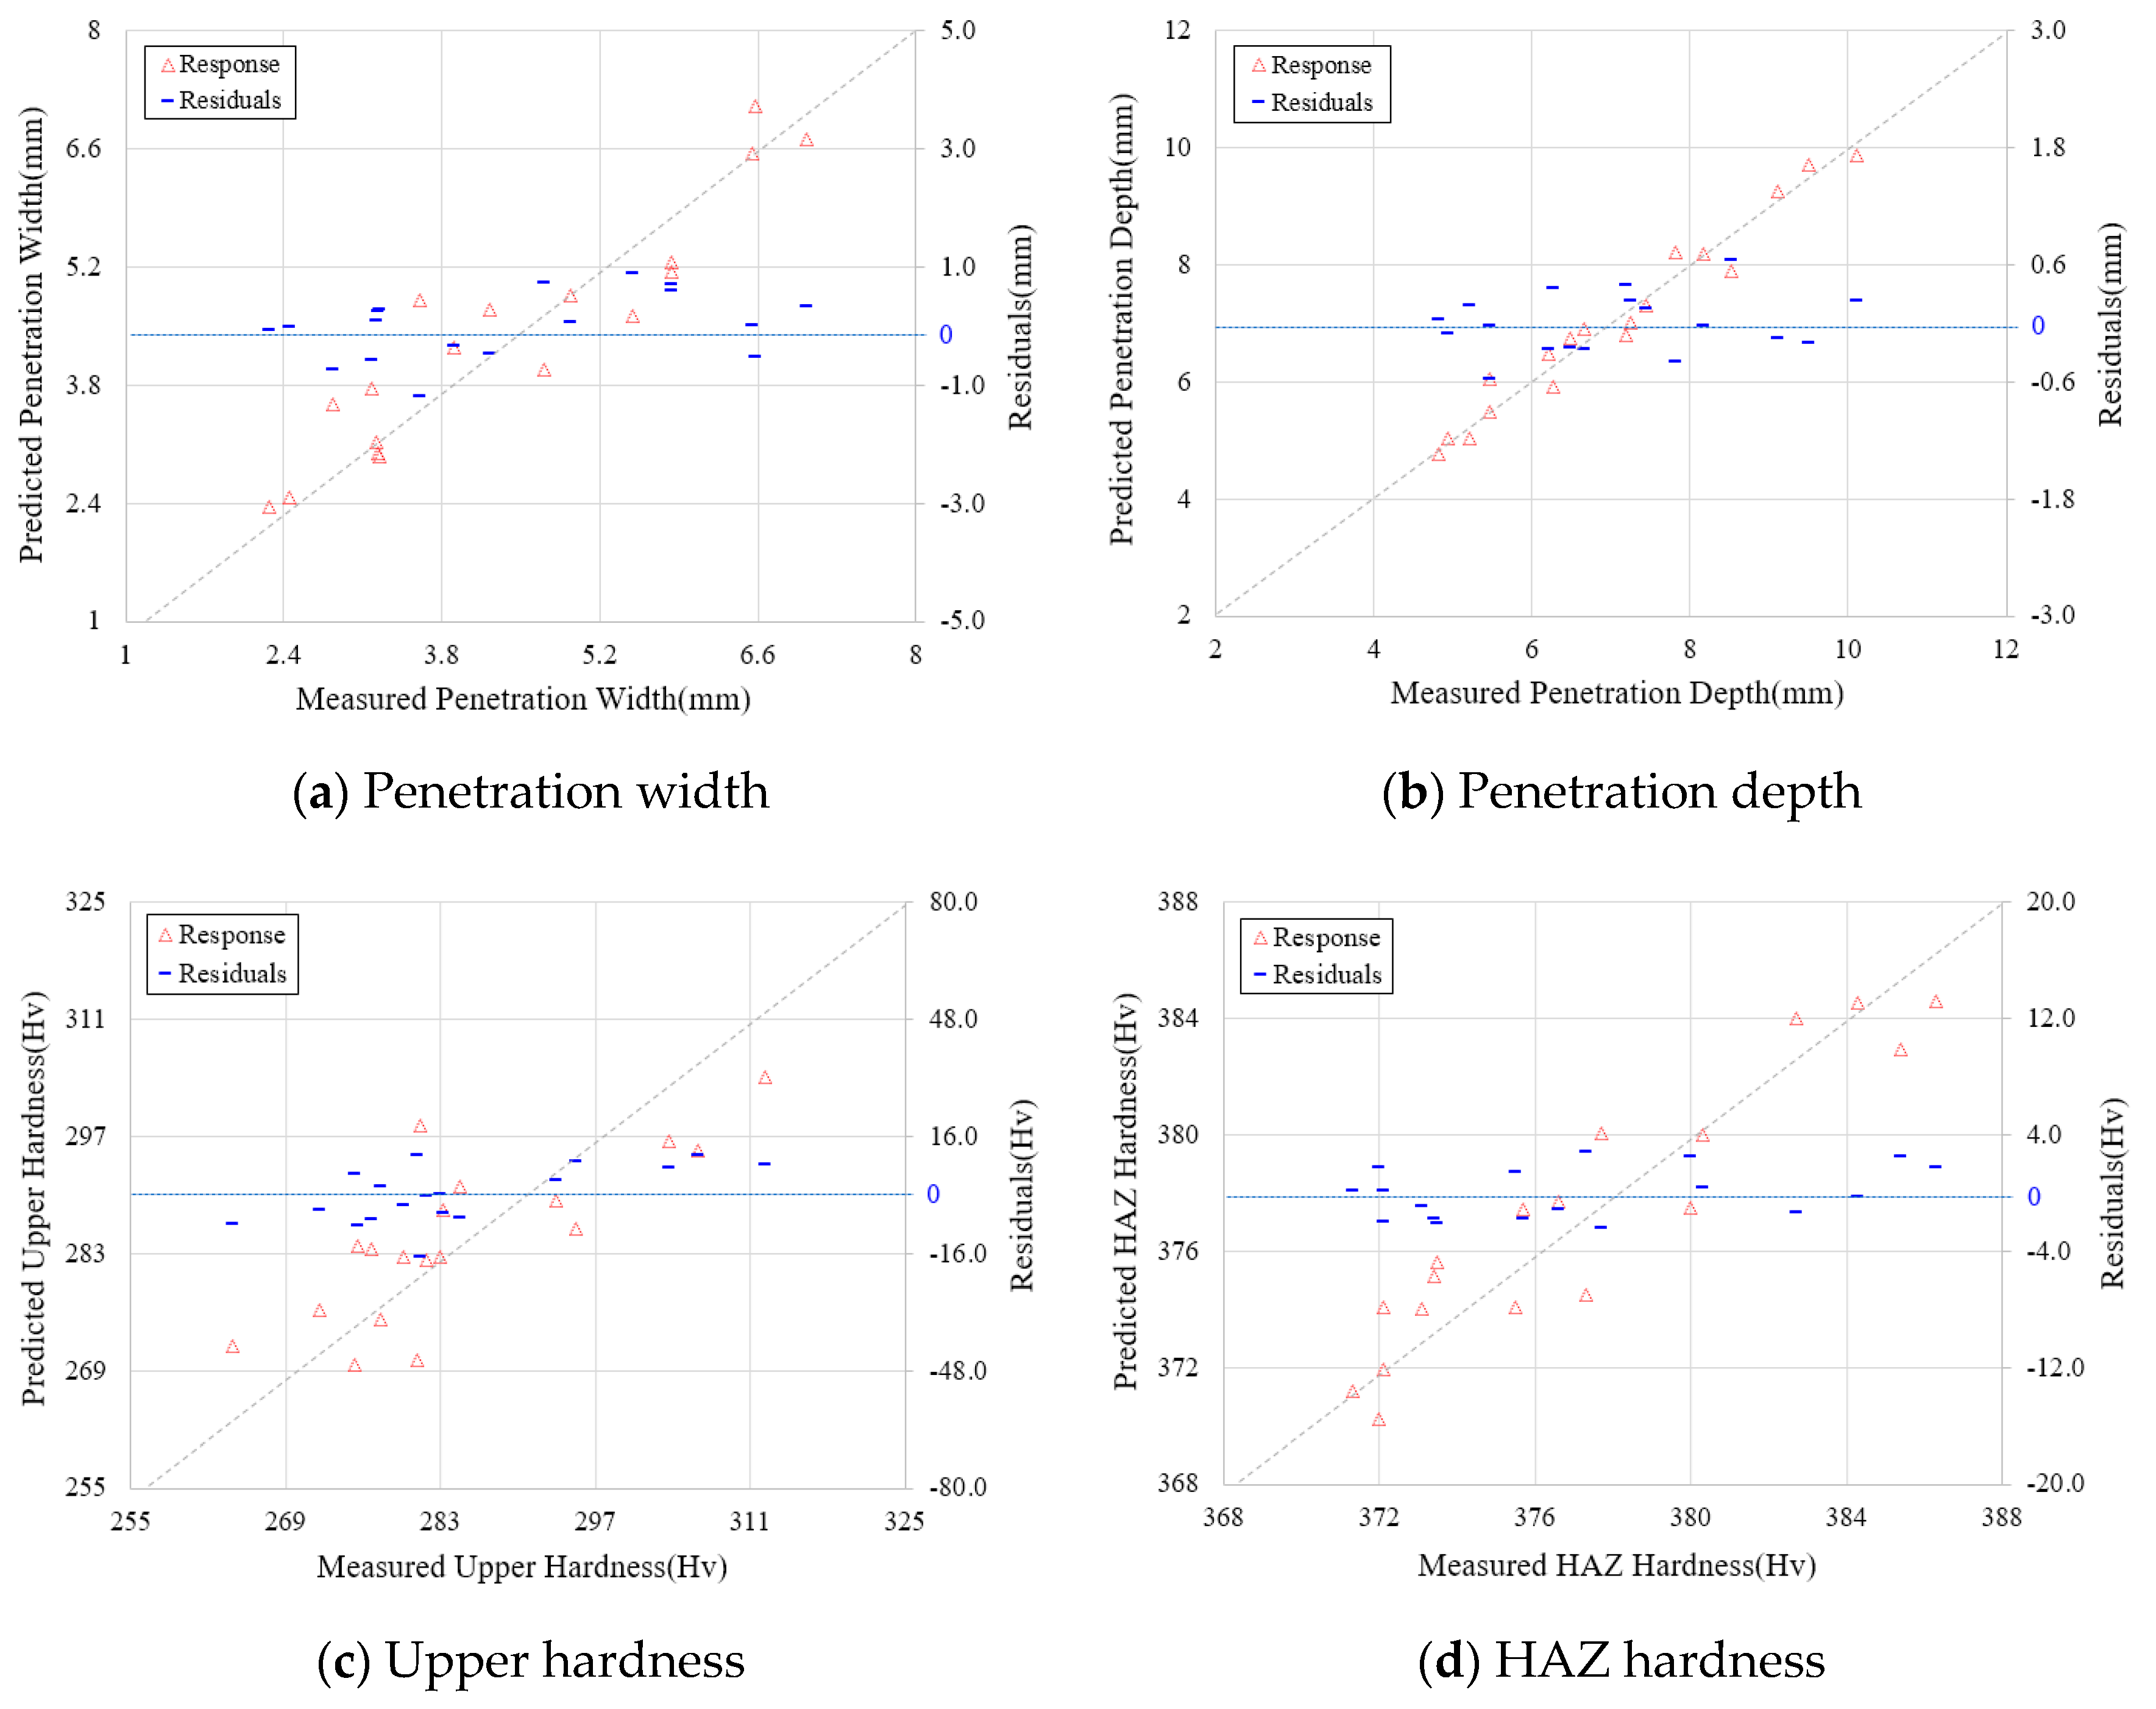
| PW | Response Surface Analysis | 0.769 | 86.4 |
| PD | Response Surface Analysis | 0.423 | 96.3 |
| HU | Response Surface Analysis | 10.83 | 71.1 |
| HH | Response Surface Analysis | 2.541 | 80.7 |
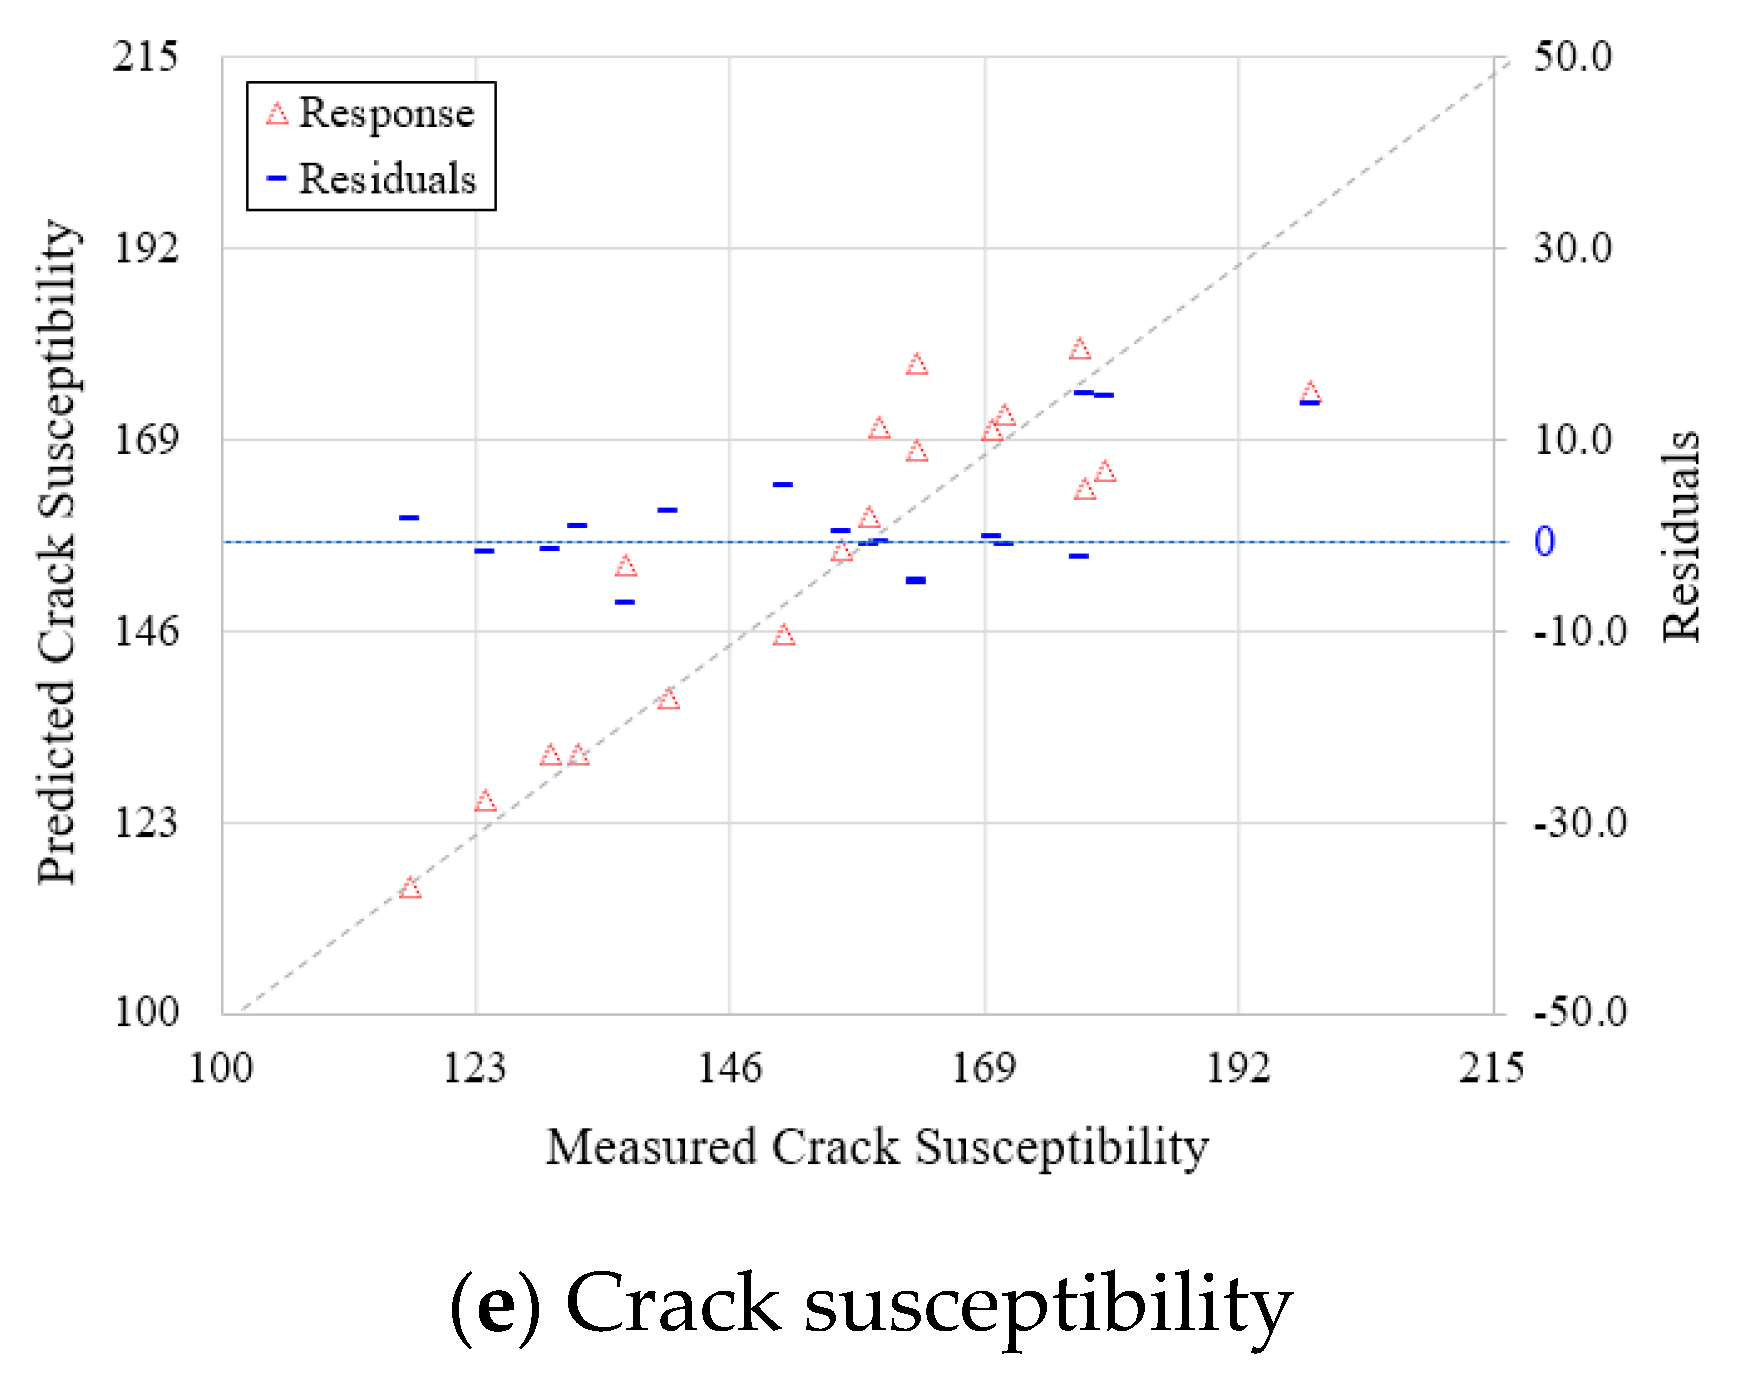
| PSC | Response Surface Analysis | 2.414 | 87.3 |
| Optimal Method | MOO (Multi-Objective Optimization) | |
|---|---|---|
| Range of Local Parameters | L (Laser Power) | [−0.5 ≤ Input ≤ +0.5] kW |
| D (Defocusing) | [−0.25 ≤ Input ≤ +0.25] mm | |
| S (Welding Speed) | [−0.15 ≤ Input ≤ +0.15] m/min | |
| Range of Constraints | PSC (Crack Susceptibility) | PSC ≤ 132.2 |
| Fitness Factor | Population Size | 50, 60, 70, 80, 90, 100 |
| Solver | Constrained Nonlinear Minimization | |
| Algorithm | Trust Region Reflective Algorithm | |
| Derivatives | Gradient Supplied | |
| Test No. | Original | Modified | Welding Factors | Group | ||||||||
|---|---|---|---|---|---|---|---|---|---|---|---|---|
| L | D | S | L | D | S | PW | PD | HU | HH | PSC | ||
| 2 | 3.0 | 0.0 | 0.5 | 3.45 | −0.24 | 0.49 | 4.2 | 7.5 | 289.9 | 381.9 | 132.1 | Stable |
| 4 | 4.0 | −5.0 | 0.5 | 3.91 | −0.51 | 0.51 | 5.0 | 7.7 | 289.9 | 382.4 | 131.5 | Stable |
| 14 | 4.0 | 0.0 | 0.8 | 3.84 | −0.08 | 0.86 | 2.5 | 5.3 | 298.0 | 374.5 | 131.8 | Stable |
| 17 | 5.0 | 0.0 | 0.8 | 5.23 | 0.24 | 0.92 | 4.7 | 6.4 | 292.6 | 379.4 | 131.7 | Stable |
Publisher’s Note: MDPI stays neutral with regard to jurisdictional claims in published maps and institutional affiliations. |
© 2020 by the authors. Licensee MDPI, Basel, Switzerland. This article is an open access article distributed under the terms and conditions of the Creative Commons Attribution (CC BY) license (http://creativecommons.org/licenses/by/4.0/).
Share and Cite
Park, M.; Kim, J.; Pyo, C.; Son, J.; Kim, J. A Study on the Algorithm of Quality Evaluation for Fiber Laser Welding Process of ASTM A553-1 (9% Nickel Steel) Using Determination of Solidification Crack Susceptibility. Materials 2020, 13, 5617. https://doi.org/10.3390/ma13245617
Park M, Kim J, Pyo C, Son J, Kim J. A Study on the Algorithm of Quality Evaluation for Fiber Laser Welding Process of ASTM A553-1 (9% Nickel Steel) Using Determination of Solidification Crack Susceptibility. Materials. 2020; 13(24):5617. https://doi.org/10.3390/ma13245617
Chicago/Turabian StylePark, Minho, Jisun Kim, Changmin Pyo, JoonSik Son, and Jaewoong Kim. 2020. "A Study on the Algorithm of Quality Evaluation for Fiber Laser Welding Process of ASTM A553-1 (9% Nickel Steel) Using Determination of Solidification Crack Susceptibility" Materials 13, no. 24: 5617. https://doi.org/10.3390/ma13245617
APA StylePark, M., Kim, J., Pyo, C., Son, J., & Kim, J. (2020). A Study on the Algorithm of Quality Evaluation for Fiber Laser Welding Process of ASTM A553-1 (9% Nickel Steel) Using Determination of Solidification Crack Susceptibility. Materials, 13(24), 5617. https://doi.org/10.3390/ma13245617


