Variation in Service Life on RC Structure According to Concrete Binder Type


Abstract
1. Introduction
2. Materials and Specimens
2.1. Materials
2.2. Concrete Mix Proportion
2.3. Concrete Specimens
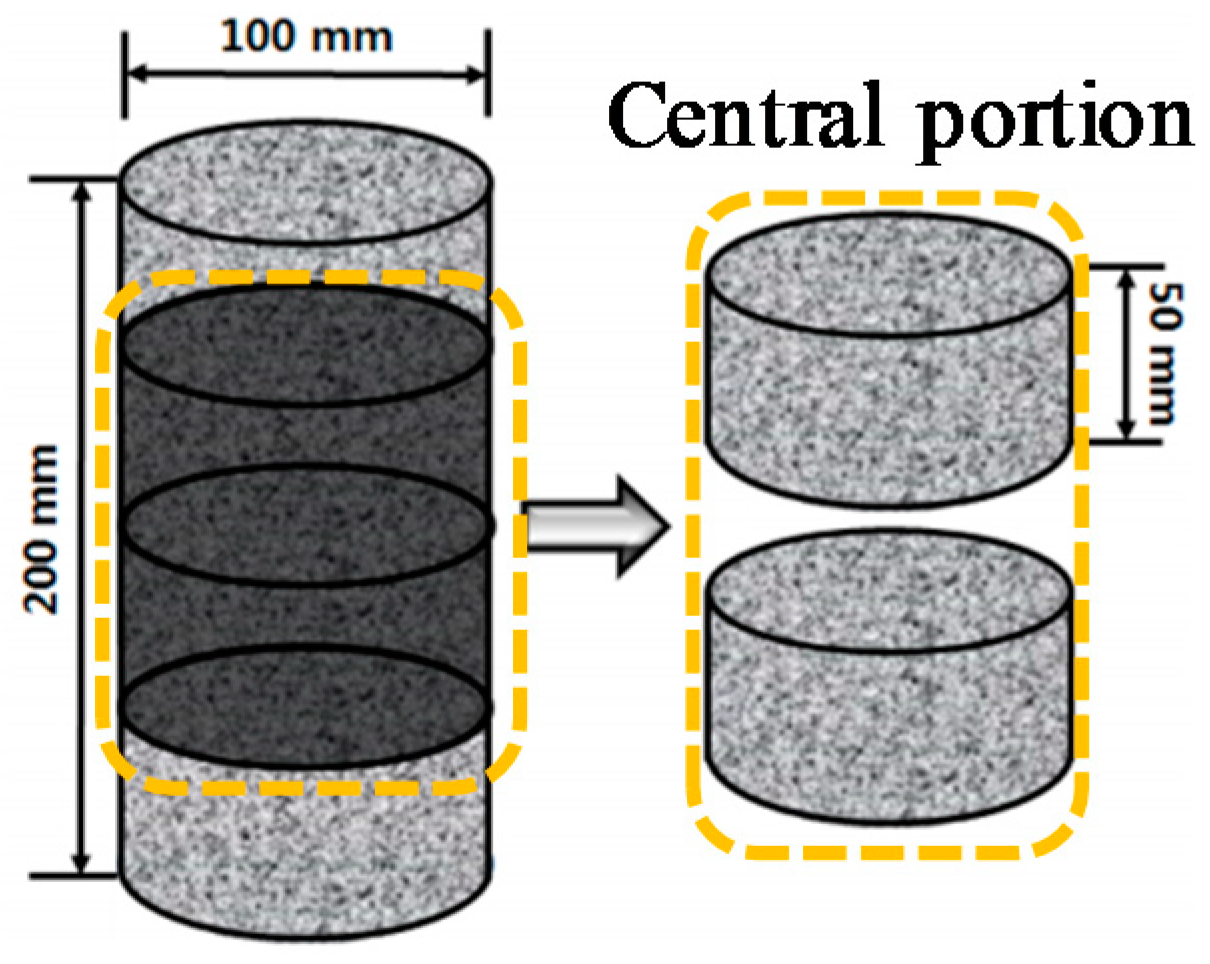
2.3.1. Concrete Specimen for Measurement of Chloride Ion Diffusion Coefficient of Concrete
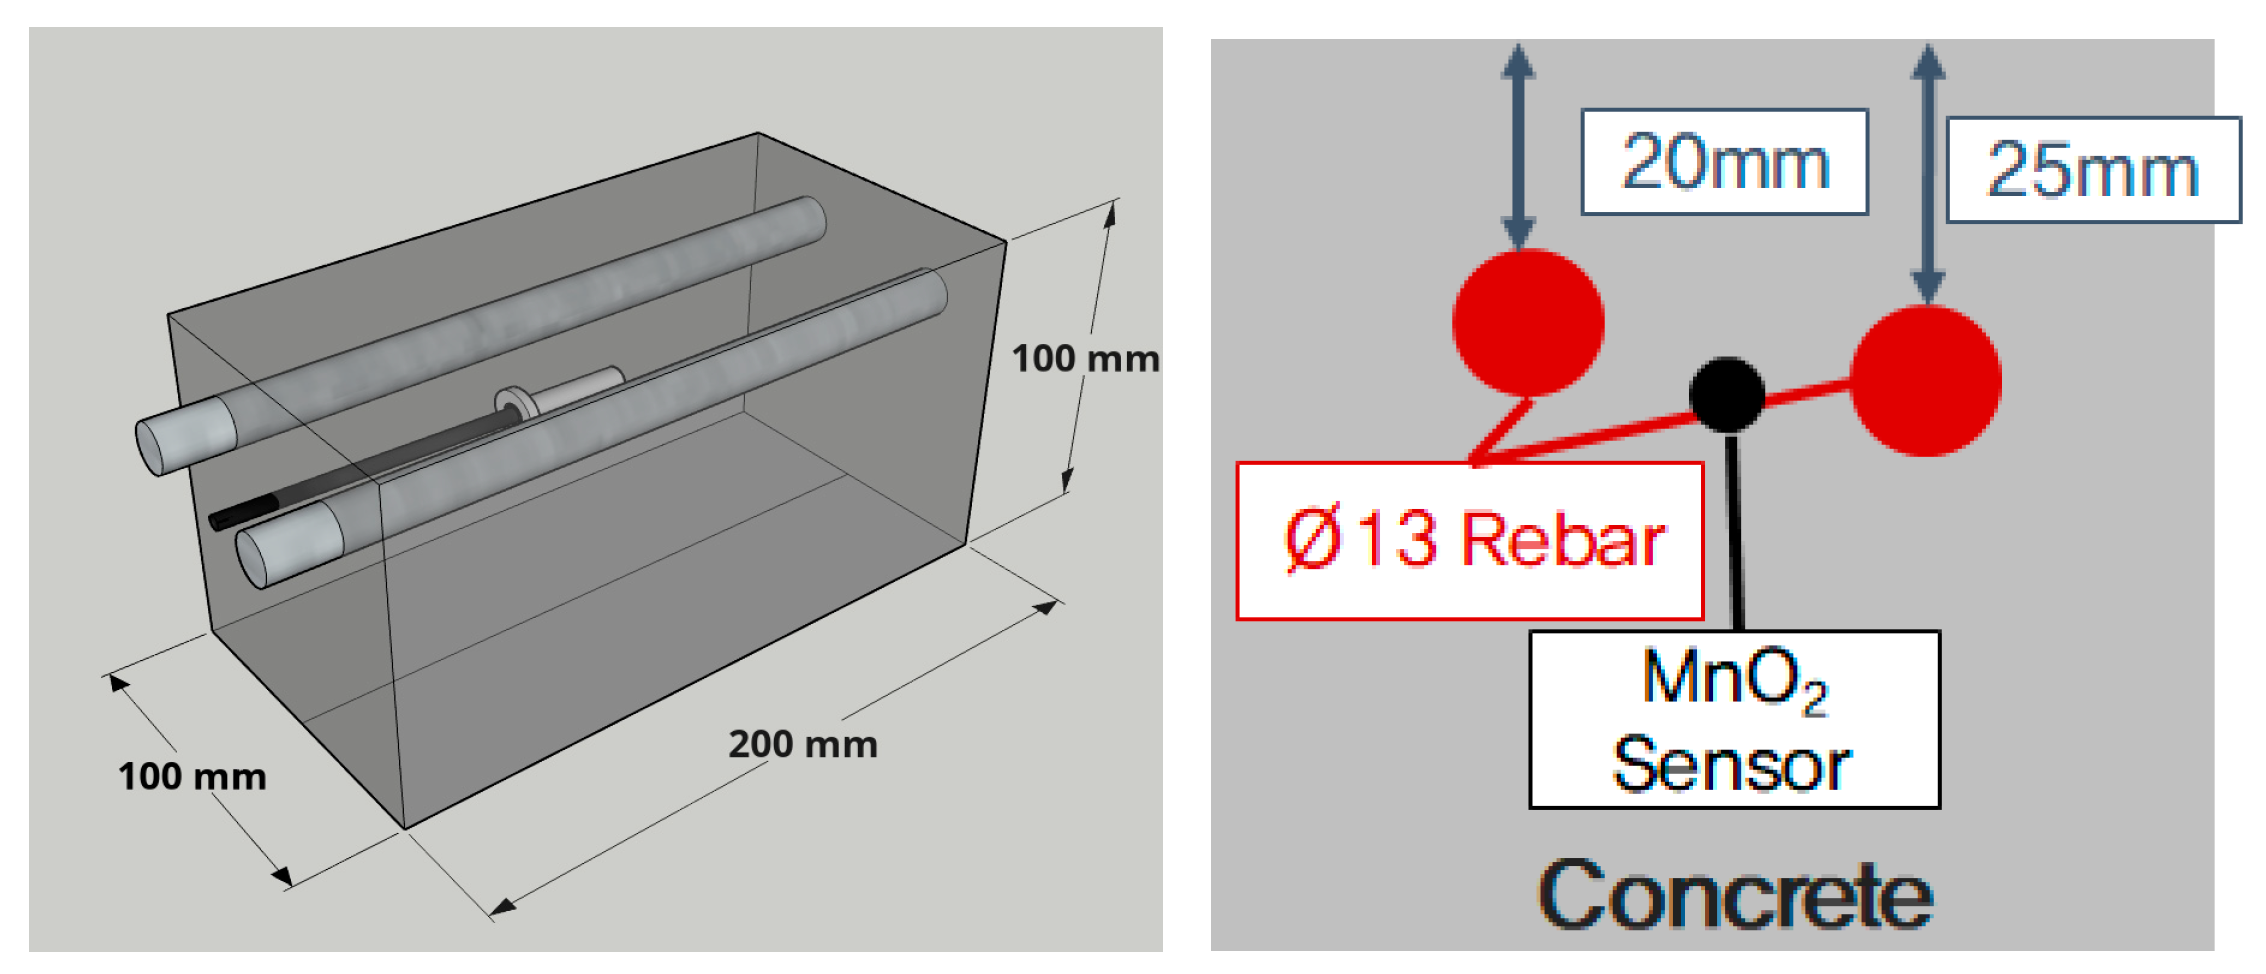
2.3.2. Specimen for Measuring the Critical Chloride Contents of Rebars Embedded in Concrete
2.3.3. Curing Method
3. Experiment
3.1. Compressive Strength Test
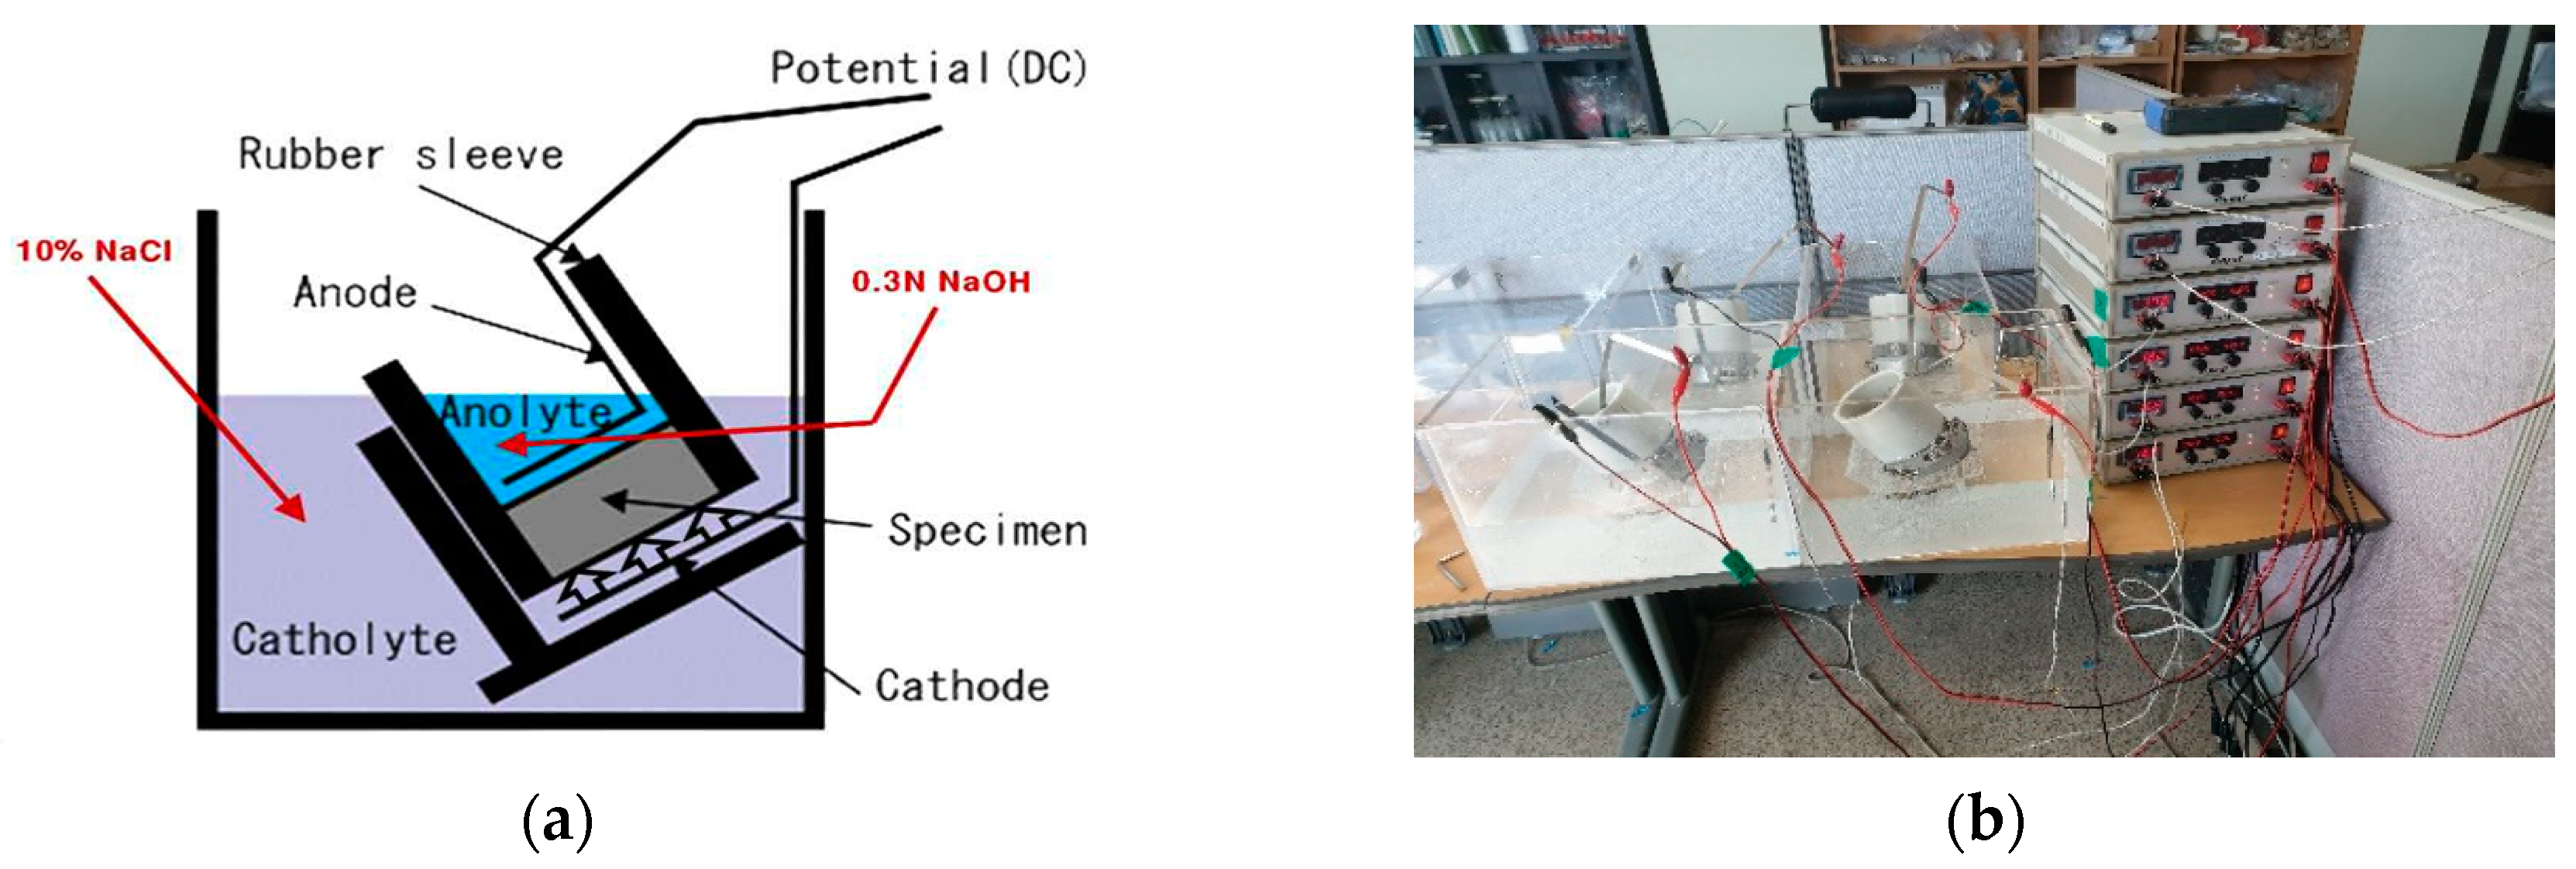
3.2. Measurement of Resistance to Chloride Ion Coefficient of Concrete
3.3. Potential Monitoring of Rebar Embedded in Concrete
3.4. Evaluation of Critical Chloride Content of Rebar Embedded in Concrete
3.5. Evaluation of Service Life of Reinforced Concrete Structure
4. Results and Discussion
4.1. Result of Concrete Compressive Strength
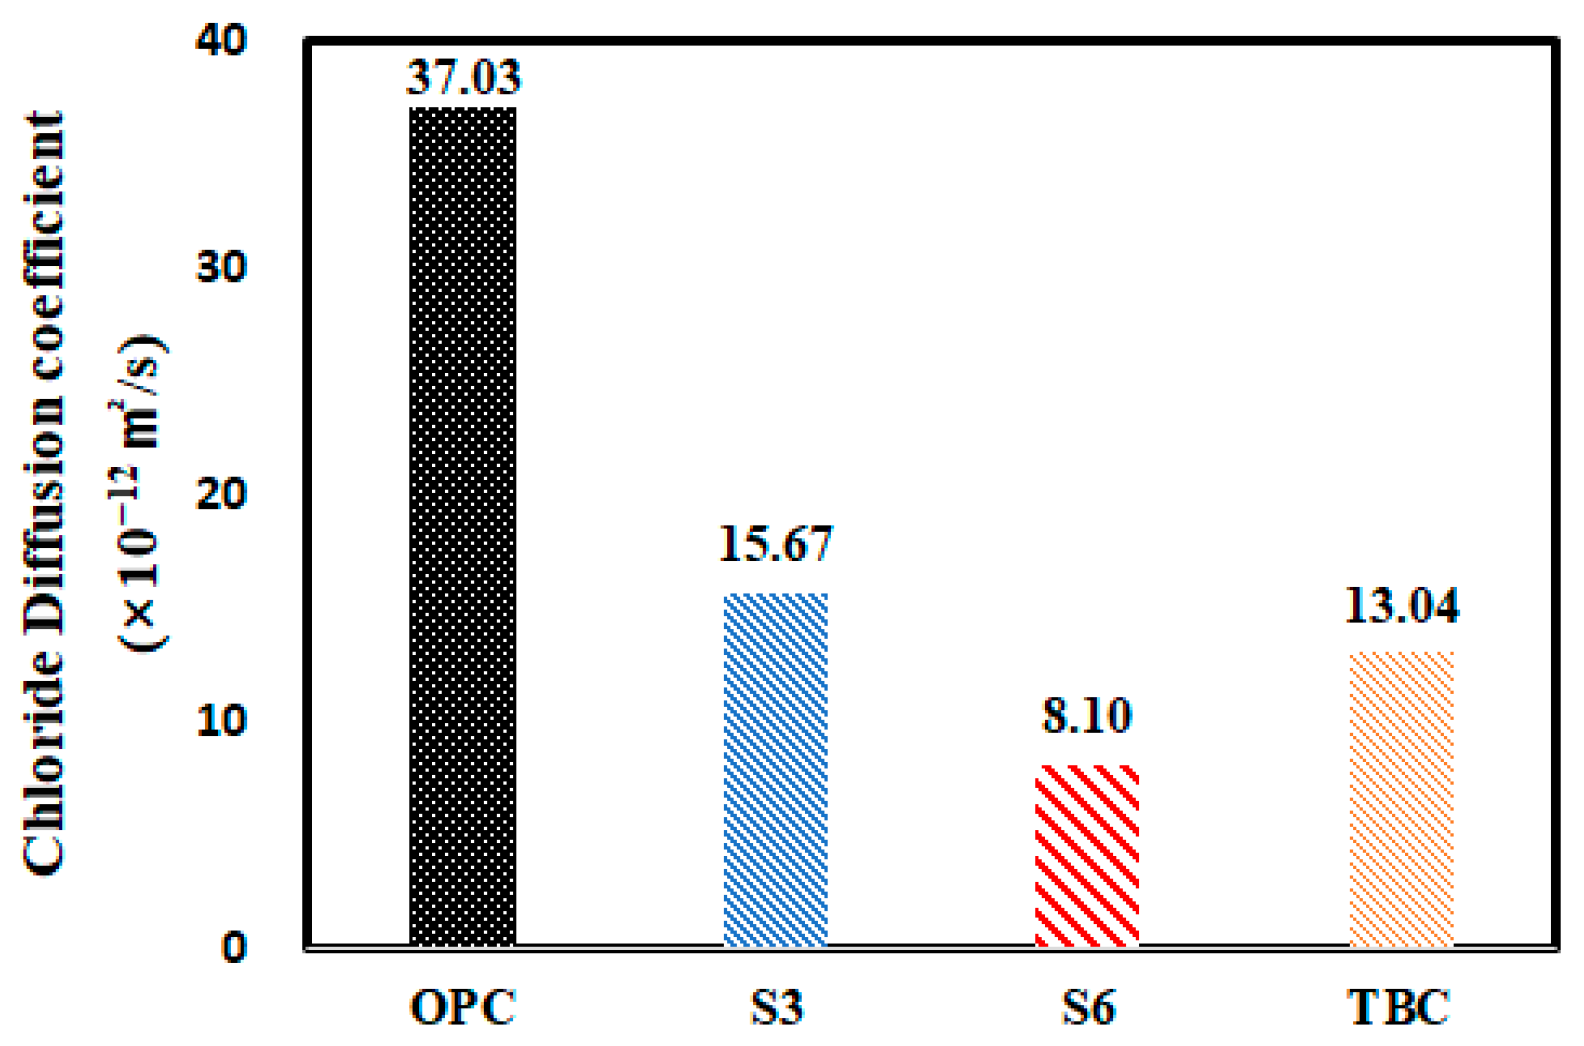
4.2. Result of Chloride Ion Diffusion Coefficient of Concrete
4.3. Result of OCP Monitoring
4.4. Result of Critical Chloride Contents Measurement
4.5. Result of Service Life on RC Structure by Concrete Binder Type
5. Conclusions
- By evaluating the compressive strength of concrete, it was determined that the compressive strength of concrete decreased as the additive replacement ratio was increased. This tendency was more pronounced when GGBFS and FA were used together than when GGBFS was used alone. This is because the latent hydraulic reaction of GGBFS or the pozzolanic reaction of FA did not occur properly, as the amount of Ca(OH)2 produced decreased due to the reduced quantity of cement and the lack of curing water under air-dry curing conditions. When cement is replaced with additive in concrete, attention to curing conditions is required to increase the performance of concrete.
- By measuring the chloride ion diffusion coefficient of concrete, it was found that the chloride ion diffusion coefficient decreased as the additive replacement ratio increased. It is judged that the pore-filling effect of concrete was due to the high fineness of GGBFS and FA. This was considered to be due to the effect of blocking the penetration of chloride ions while filling the capillary pores according to the formation of C–S–H hydrate by the latent hydraulic properties.
- Through evaluating the critical chloride content of the rebars embedded in concrete, it was found that the critical chloride content to induce rebar corrosion decreased as the admixture replacement rate increased. This was because the pH of concrete was reduced before hardening as the absolute quantity of cement decreased, and the performance of the passive film formed on the surface of the rebars was reduced.
- Applying the concrete chloride ion diffusion coefficient according to the additive replacement ratio and the additive type and the critical chloride content that initiates rebar corrosion in this study will enable a more accurate evaluation and prediction of service life compared to the use of conventional standards (0.4% of binder). As a result, the calculated service life of concrete was S3 89 years, TBC 60 years, S3 51 years, and OPC 26 years.
- It was confirmed that the service life of reinforced concrete is more affected by the chloride ion diffusion coefficient than the critical chloride content. However, it was confirmed that the effect of reducing the amount of critical chloride content of reinforced concrete according to the additive replacement ratio. In order to accurately design the durability of reinforced concrete structures using additives, it is considered that continuous research on critical chloride content is necessary.
Author Contributions
Funding
Conflicts of Interest
References
- Watson, R. Spaghetti Junction lifts off £400 m repairs. New Civ. Eng. 1990, 28, 7. [Google Scholar]
- Wallbank, E.J. The performance of concrete in bridges. A Survey of 200 Highway Bridges; Department of Transport, HMSO: London, UK, 1989; p. 96. [Google Scholar]
- Page, C.L. Mechanism of corrosion protection in reinforced concrete marine structures. Nat. Cell Biol. 1975, 258, 514–515. [Google Scholar] [CrossRef]
- Amey, S.L.; Johnson, D.A.; Miltenberger, M.A.; Farzam, H. Predicting the Service Life of Concrete Marine Structures: An Environmental Methodology. ACI Struct. J. 1998, 95, 205–214. [Google Scholar] [CrossRef]
- Seleem, H.E.-D.H.; Rashad, A.M.; El-Sabbagh, B.A. Durability and strength evaluation of high-performance concrete in marine structures. Constr. Build. Mater. 2010, 24, 878–884. [Google Scholar] [CrossRef]
- Page, C.; Short, N.; El Tarras, A. Diffusion of chloride ions in hardened cement pastes. Cem. Concr. Res. 1981, 11, 395–406. [Google Scholar] [CrossRef]
- Hussain, S.E. In Mechanisms of High Durability Performance Plane and Blended Cements. Ph.D. Thesis, Department Civil Engineering, King Fahd University of Petroleum and Minerals, Dhahran, Saudi Arabia, 1991; pp. 221–228. [Google Scholar]
- Al-Amoudi, O.S.B.; Maslehuddin, M.; Al-Mana, A.I. Prediction of Long-Term Corrosion Resistance of Plain and Blended Cement concretes. ACI Mater. J. 1993, 90, 564–570. [Google Scholar] [CrossRef]
- Fulton, F.S. The Properties of Portland Cements Containing Milled Granulated Blast-Furnace Slag; Portland Cement Institute: Johannesburg, South Africa, 1974; pp. 4–46. [Google Scholar]
- Boğa, A.R.; Topçu, I.B. Influence of fly ash on corrosion resistance and chloride ion permeability of concrete. Constr. Build. Mater. 2012, 31, 258–264. [Google Scholar] [CrossRef]
- Thomas, M.; Hooton, R.; Scott, A.; Zibara, H. The effect of supplementary cementitious materials on chloride binding in hardened cement paste. Cem. Concr. Res. 2012, 42, 1–7. [Google Scholar] [CrossRef]
- Lee, H.S.; Ismail, M.; Hussin, M.W. Durability Probabilistic Evaluation of RC Structures Subjected to Chloride Ion. Energy Sustain. Dev. 2015, 1, 160–166. [Google Scholar]
- Mehta, P. Blended cements in construction. Cem. Concr. Compos. 1992, 14, 223–224. [Google Scholar] [CrossRef]
- Hussain, S.E. Corrosion Resistance Performance of Fly Ash Blended Cement Concrete. ACI Mater. J. 1994, 91, 264–272. [Google Scholar] [CrossRef]
- Halstead, W.J.; Ozyildirim, C. Improved Concrete Quality with Combinations of Fly Ash and Silica Fume. ACI Mater. J. 1995, 91, 587–594. [Google Scholar] [CrossRef]
- G#xFC;neyisi, E.; Özturan, T.; Gesoğlu, M. Laboratory Investigation of Chloride Permeability for High Performance Concrete Containing Fly-Ash and Silica Fume. In Proceedings of the Innovations and Developments in Concrete Materials and Construction at the University of Dundee, Scotland, UK, 9–11 September 2002; Thomas Telford Publishing: Dundee, UK, 2002; pp. 295–305. [Google Scholar]
- Luo, R.; Cai, Y.; Wang, C.; Huang, X. Study of chloride binding and diffusion in GGBS concrete. Cem. Concr. Res. 2003, 33, 1–7. [Google Scholar] [CrossRef]
- Cheng, A.; Huang, R.; Wu, J.-K.; Chen, C.-H. Influence of GGBS on durability and corrosion behavior of reinforced concrete. Mater. Chem. Phys. 2005, 93, 404–411. [Google Scholar] [CrossRef]
- Song, H.-W.; Saraswathy, V. Studies on the corrosion resistance of reinforced steel in concrete with ground granulated blast-furnace slag—An overview. J. Hazard. Mater. 2006, 138, 226–233. [Google Scholar] [CrossRef] [PubMed]
- Wei, J.; Dong, J.; Ke, W. Corrosion resistant performance of a chemical quenched rebar in concrete. Constr. Build. Mater. 2011, 25, 1243–1247. [Google Scholar] [CrossRef]
- Wang, Z.; Zeng, Q.; Wang, L.; Yao, Y.; Li, K. Corrosion of rebar in concrete under cyclic freeze-thaw and Chloride salt action. Constr. Build. Mater. 2014, 53, 40–47. [Google Scholar] [CrossRef]
- Topçu, İ.B.; Boğa, A.R. Effect of ground granulate blast-furnace slag on corrosion performance of steel embedded in concrete. Mater. Des. 2010, 31, 3358–3365. [Google Scholar] [CrossRef]
- Moreno, M.; Morris, W.; Alvarez, M.G.; Du, G.S. Corrosion of reinforcing steel in simulated concrete pore solutions: Eect of carbonation and chloride content. Corros. Sci. 2004, 46, 2681–2699. [Google Scholar] [CrossRef]
- Kim, E.-K.; Kim, J.-K.; Lee, D.-H.; Kim, Y.-U.; Kim, Y.-C. A Study on Corrosion Resistance of the Reinforement in Concrete Using Blast-Furnace Slag Powder. J. Korea Concr. Inst. 2004, 16, 1–9. [Google Scholar] [CrossRef]
- Wang, J.; Liu, E. The relationship between steady-state chloride diusion and migration coecients in cementitious materials. Mag. Concr. Res. 2019, 223, 595–604. [Google Scholar]
- Lee, K.-C.; Cho, J.-W.; Jung, S.-H.; Kim, J.-H.J. Study on Hydration Heat of Blended Belite Binder. J. Korea Concr. Inst. 2011, 23, 145–150. [Google Scholar] [CrossRef]
- Thomas, M. Chloride thresholds in marine concrete. Cem. Concr. Res. 1996, 26, 513–519. [Google Scholar] [CrossRef]
- Glass, G.K.; Buenfield, N.R. The presentation of the chloride threshold level for corrosion of reinforced concrete. Corros. Sci. 1997, 39, 1001–1013. [Google Scholar] [CrossRef]
- Hussain, E.; Al-Gahtani, S. Chloride Threshold for Corrosion of Reinforcement in Concrete. ACI Mater. J. 1996, 93, 534–548. [Google Scholar] [CrossRef]
- Zhang, M.-H.; Beaudoin, J.J.; Gu, P.; Malhotra, V.M. Performance of Reinforcing Steel in Concrete Containing Silica Fume and Blast-Furnace Slag Ponded with Sodium-Chloride Solution. ACI Mater. J. 2000, 97, 254–262. [Google Scholar] [CrossRef][Green Version]
- Li, L.; Sagüés, A.A. Chloride Corrosion Threshold of Reinforcing Steel in Alkaline Solutions—Cyclic Polarization Behavior. Corrosion 2002, 58, 305–316. [Google Scholar] [CrossRef]
- Horiguchi, K.; Yamaguchi, T.; Maruya, T.; Takewaka, A. Study on the Method of Measuring the Chloride Threshold Value of Corrosion and Estimation of the Values in Durability Design of Concrete Structures. J. Adv. Concr. Technol. 2015, 71, 107–123. [Google Scholar] [CrossRef]
- Ryou, J.S.; Ann, K.Y. Variation in the chloride threshold level for steel corrosion in concrete arising from different chloride sources. Mag. Concr. Res. 2008, 60, 177–187. [Google Scholar] [CrossRef]
- Hartt, W.; Nam, J. Effect of cement alkalinity on chloride threshold and time to corrosion of reinforcing steel in concrete. Corrosion 2008, 64, 671–680. [Google Scholar] [CrossRef]
- Yang, S.K.; Kim, D.S.; Um, T.S.; Lee, J.R.; Katsuya, K. Study on the Critical Threshold Chloride Content for Steel Corrosion in Concrete with Various Cement Contents. J. Korea Concr. Inst. 2008, 20, 415–421. [Google Scholar] [CrossRef]
- Concrete Standard Specification of Korea, Durability; Ministry of Land, Infrastructure and Transport: Sejong Special Governing City, Korea, 2004; pp. 3–38.
- Concrete Standard Specification of Korea; Ministry of Land, Infrastructure and Transport: Sejong Special Governing City, Korea, 2016; pp. 332–351.
- Concrete Structure Durability Design Standard, Korean Design Standard; Ministry of Land, Infrastructure and Transport: Sejong Special Governing City, Korea, 2016; pp. 2–21.
- Architectural Structural Standard of Korea; Ministry of Land, Infrastructure and Transport: Sejong Special Governing City, Korea, 2016; pp. 286–291.
- Broomfield, J.P. Corrosion of Steel in Concrete: Understanding, Investigation and Repair; CRC Press: Boca Raton, FL, USA, 2003; pp. 140–152. [Google Scholar]
- Alonso, C.; Andrade, C.; Castellote, M.; Castro, P. Chloride threshold values to depassivate reinforcing bars embedded in a standardized OPC mortar. Cem. Concr. Res. 2000, 30, 1047–1055. [Google Scholar] [CrossRef]
- Gouda, V.K. Corrosion and Corrosion Inhibition of Reinforcing Steel: I. Immersed in Alkaline Solutions. Br. Corros. J. 1970, 5, 198–203. [Google Scholar] [CrossRef]
- Mattsson, E. Stress corrosion in brass considered against the background of potential/pH diagrams. Electrochimica Acta 1961, 3, 279–291. [Google Scholar] [CrossRef]
- Polder, R.B. Critical chloride content for reinforced concrete and its relationship to concrete resistivity. Mater. Corros. 2009, 60, 623–630. [Google Scholar] [CrossRef]
- Park, C. A Review on Estimation of Chloride Threshold Values in Reinforced Concrete. J. Korea Concr. Inst. 2018, 30, 32–40. [Google Scholar]
- Angst, U.; Elsener, B.; Larsen, C.K.; Vennesland, Ø. Critical chloride content in reinforced concrete—A review. Cem. Concr. Res. 2009, 39, 1122–1138. [Google Scholar] [CrossRef]
- Cao, Y.; Gehlen, C.; Angst, U.M.; Wang, L.; Wang, Z.; Yao, Y. Critical chloride content in reinforced concrete—An updated review considering Chinese experience. Cem. Concr. Res. 2019, 117, 58–68. [Google Scholar] [CrossRef]
- Tsutsumi, T.; Shirai, S.-I.; Yasuda, N.; Matsushima, M. Evaluation of Parameters of Chloride Induced Damage Based on Actual Data in Situ. Doboku Gakkai Ronbunshu 1996, 1996, 33–41. [Google Scholar] [CrossRef][Green Version]
- Song, H.W.; Pack, S.W.; Ann, K.Y. Time Dependent Chloride Transport Evaluation of Concrete Structures Exposed to Marine Environment. J. Korea Concr. Inst. 2007, 19, 585–593. [Google Scholar] [CrossRef]
- Alexander, M.; Beushausen, H. Durability, service life prediction, and modelling for reinforced concrete structures—Review and critique. Cem. Concr. Res. 2019, 122, 17–29. [Google Scholar] [CrossRef]
- Ashrafi, H.R.; Ramezanianpour, A.A. Service Life Prediction of Silica Fume Concretes. Int. J. Civ. Eng. 2007, 5, 182–197. [Google Scholar]
- Mahima, S.; Moorthi, P.V.P.; Bahurudeen, A.; Athira, G. Influence of chloride threshold value in service life prediction of reinforced concrete structures. Sadhana 2018, 43, 115. [Google Scholar] [CrossRef]
- Park, J.-I.; Lee, K.-M.; Kwon, S.-O.; Jung, S.-H.; Yoo, S.-W.; Bae, S.-H. Diffusion Decay Coefficient for Chloride Ions of Concrete Containing Mineral Admixtures. Adv. Mater. Sci. Eng. 2016, 2016, 1–11. [Google Scholar] [CrossRef]
- ASTM. Standard Specification for Portland Cement. In Annual Book of ASTM Standards; ASTM C. 150; ASTM: West Conshohocken, PA, USA, 2001. [Google Scholar]
- ASTM. Standard Specification for Ground Granulated Blast Furnace Slag for Use in Concrete and Mortars. In Annual Book of ASTM Standards; ASTM C. 989; ASTM: West Conshohocken, PA, USA, 1999. [Google Scholar]
- ASTM. Standard Specification for Coal Fly Ash and Raw of Calcined Natural Pozzolan for Use in Concrete. In AMERICAN Society for Testing and Materials; ASTM C. 618; ASTM: West Conshohocken, PA, USA, 2003. [Google Scholar]
- Kim, J.-H.; Yoon, S.-C.; Jee, N.-Y. The Effect of Combined Aggregates on Fluidity of the High Fluid Concrete Containing GGBFS. J. Korea Inst. Build. Constr. 2003, 3, 79–86. [Google Scholar] [CrossRef]
- Kang, M.-J.; Lee, P.-K.; Youm, S.-J. Assessment of Environmental Contamination caused by the Stone-dust using Leaching Tests. J. Soil Groundw. Environ. 2010, 15, 52–60. [Google Scholar]
- Build, N.T. Concrete, Mortar and Cement-Based Repair Materials: Chloride Migration Coefficient from Non-Steady-State Migration Experiments; Technical Report of the Nordtest Method: Espoo, Finland, November 1999. [Google Scholar]
- ASTM. Standard Test Method for Compressive Strength of Concrete; ASTM C. 39; ASTM International: West Conshohocken, PA, USA, 2012. [Google Scholar]
- ASTM. Standard Test Method for Half-cell Potentials of Uncoated Reinforcing Steel in Concrete. In Annual Book of ASTM Standards; ASTM C 876-91; ASTM: West Conshohocken, PA, USA, 1991. [Google Scholar]
- Muralidharan, S.; Saraswathy, V.; Madhavamayandi, A.; Thangavel, K.; Palaniswamy, N. Evaluation of embeddable potential sensor for corrosion monitoring in concrete structures. Electrochim. Acta 2008, 53, 7248–7254. [Google Scholar] [CrossRef]
- ASTM. Standard Test Method for Water-Soluble Chloride in Mortar and Concrete. In Annual Book of ASTM Standards; ASTM C. 1218; ASTM: West Conshohocken, PA, USA, 2008. [Google Scholar]
- Maage, M.; Helland, S.; Poulsen, E.; Vennesland, O.; Carl, J.E. Service Life Prediction of Existing Concrete Structures Exposed to Marine Environment. ACI Mater. J. 1996, 93, 602–608. [Google Scholar] [CrossRef]


| Name | Chemical Compositions (%) | |||||||||
|---|---|---|---|---|---|---|---|---|---|---|
| SiO2 | Al2O3 | TiO2 | Fe2O3 | CaO | MgO | SO3 | K2O | Etc. | * L.O.I. | |
| OPC | 19.74 | 5.33 | 0.30 | 2.93 | 61.74 | 3.78 | 2.47 | 0.89 | 2.82 | 2.3 |
| GGBFS | 33.35 | 13.36 | 0.59 | 0.33 | 44.62 | 4.12 | 2.69 | 0.41 | 0.53 | 0.1 |
| FA | 52.66 | 21.44 | 0.92 | 9.20 | 5.01 | 2.01 | 0.27 | 1.13 | 7.29 | 3.86 |
| Name | Unit Weight (kg/m3) | Unit Weight (g/m3) | |||||||
|---|---|---|---|---|---|---|---|---|---|
| W | C | GGBFS | FA | S1 1 | S2 2 | G 3 | S.P. | A.E. | |
| OPC | 180 | 300 | – | – | 640 | 273 | 867 | 3007 | 93 |
| S3 | 180 | 210 | 90 | – | 640 | 273 | 867 | 2400 | 120 |
| S6 | 180 | 120 | 180 | – | 633 | 267 | 867 | 2100 | 250 |
| TBC | 180 | 120 | 120 | 60 | 620 | 267 | 867 | 2100 | 1000 |
| Initial Current I30V (with 30V) (mA) | Applied Voltage U (after Adjustment) (V) | Possible New Initial Current I0 (mA) | Test Duration (H) |
|---|---|---|---|
| I0 < 5 | 60 | I0 < 10 | 96 |
| 5 ≤ I0 < 10 | 60 | 10 ≤ I0 < 20 | 48 |
| 10 ≤ I0 < 15 | 60 | 20 ≤ I0 < 30 | 24 |
| 15 ≤ I0 < 20 | 50 | 25 ≤ I0 < 35 | 24 |
| 20 ≤ I0 < 30 | 40 | 25 ≤ I0 < 40 | 24 |
| 30 ≤ I0 < 40 | 35 | 35 ≤ I0 < 50 | 24 |
| 40 ≤ I0 < 60 | 30 | 40 ≤ I0 < 60 | 24 |
| 60 ≤ I0 < 90 | 25 | 50 ≤ I0 < 75 | 24 |
| 90 ≤ I0 < 120 | 20 | 60 ≤ I0 < 80 | 24 |
| 120 ≤ I0 < 180 | 15 | 60 ≤ I0 < 90 | 24 |
| 180 ≤ I0 < 360 | 10 | 60 ≤ I0 < 120 | 24 |
| I0 ≥ 360 | 10 | I0 ≥ 120 | 6 |
| Potential of Rebar (mV) | Corrosion Probablity | |||
|---|---|---|---|---|
| CSE | SCE | SHE | MnO2 | |
| <−500 | <−426 | <−184 | <−665 | Severe |
| <−350 | <−276 | <−34 | <−515 | 90% ↑ |
| −350~−200 | −276~−126 | −34~+116 | −515~−419 | 50% ↓ |
| >−200 | >−126 | >+116 | >−419 | 10% ↓ |
| Name | Compressive Strength (MPa) | Slump (mm) | Air Content (%) | ||
|---|---|---|---|---|---|
| 3d | 7d | 28d | |||
| OPC | 18.0 | 23.2 | 29.2 | 196 | 3.6 |
| S3 | 13.6 | 20.9 | 28.2 | 195 | 4.2 |
| S6 | 11.8 | 20.9 | 27.4 | 200 | 4.5 |
| TBC | 8.4 | 15.4 | 21.8 | 200 | 3.2 |
| Name | Chloride Ion Diffusion Coefficient (28 days) (×10−12 m2/s) | Compressive Strength (28 days) (Mpa) |
|---|---|---|
| OPC | 37.03 | 29.2 |
| S3 | 15.67 | 28.2 |
| S6 | 8.10 | 27.4 |
| TBC | 13.04 | 21.8 |
| Name | OPC | S3 | S6 | TBC |
|---|---|---|---|---|
| Surface Image |  |  |  |  |
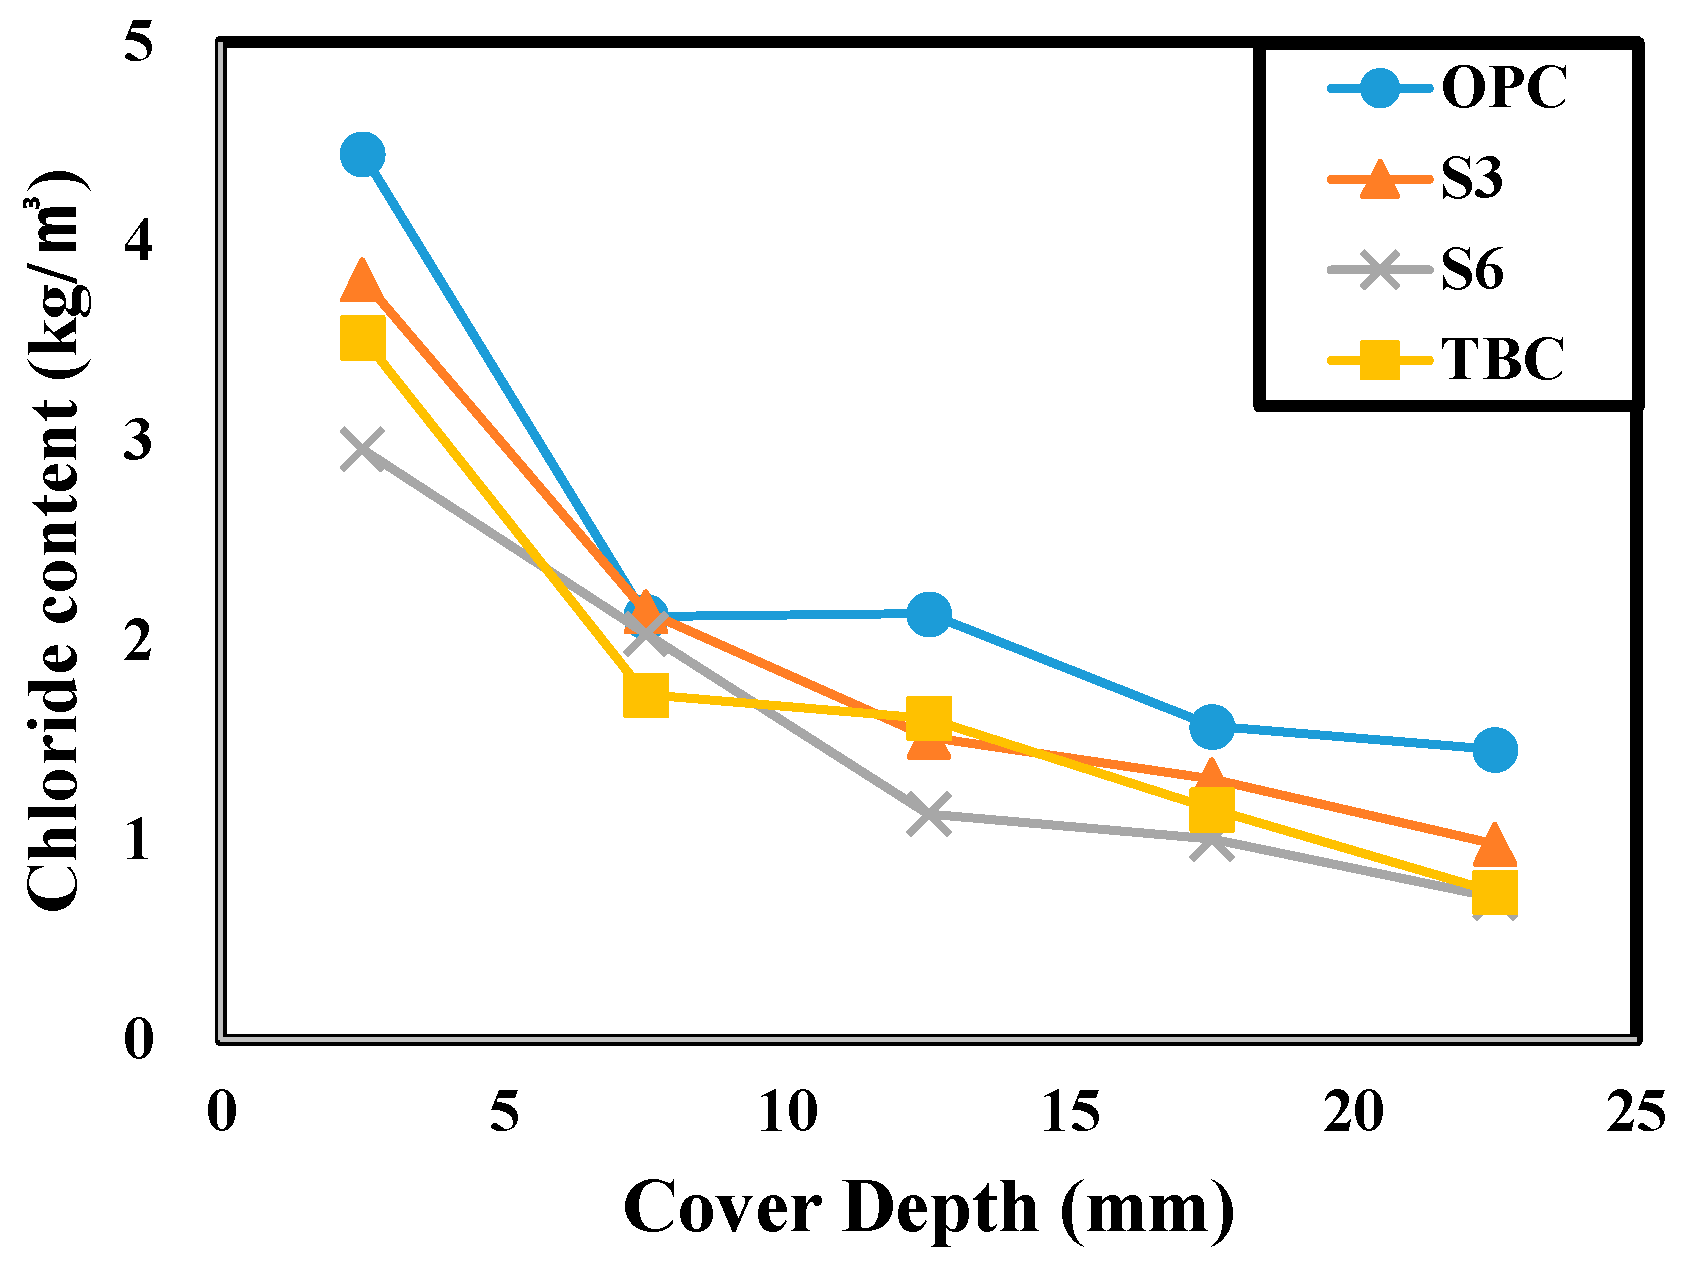
| Cover Depth (mm) | Amount of Chloride Content (kg/m3) | |||
|---|---|---|---|---|
| OPC | S3 | S6 | TBC | |
| 0–5 | 4.44 | 3.81 | 2.96 | 3.52 |
| 5–10 | 2.12 | 2.15 | 2.03 | 1.73 |
| 10–15 | 2.14 | 1.52 | 1.13 | 1.61 |
| 15–20 | 1.57 | 1.31 | 1.01 | 1.16 |
| 20–25 | 1.46 | 0.98 | 0.71 | 0.74 |
| Name | Chloride Ion Diffusion Coefficient (10−12 m2/s) | Critical Chloride Content (kg/m3) | Service Life (Years) |
|---|---|---|---|
| OPC | 37.03 | 1.2 | 23 |
| S3 | 15.67 | 1.2 | 53 |
| S6 | 8.10 | 1.2 | 102 |
| TBC | 13.04 | 1.2 | 80 |
| Name | Chloride Ion Diffusion Coefficient (10−12 m2/s) | Critical Chloride Content (kg/m3) | Service Life (Years) |
|---|---|---|---|
| OPC | 37.03 | 1.53 | 26 |
| S3 | 15.67 | 1.11 | 51 |
| S6 | 8.10 | 0.91 | 89 |
| TBC | 13.04 | 0.72 | 60 |
Publisher’s Note: MDPI stays neutral with regard to jurisdictional claims in published maps and institutional affiliations. |
© 2020 by the authors. Licensee MDPI, Basel, Switzerland. This article is an open access article distributed under the terms and conditions of the Creative Commons Attribution (CC BY) license (http://creativecommons.org/licenses/by/4.0/).
Share and Cite
Park, J.; Park, J.; Jung, M. Variation in Service Life on RC Structure According to Concrete Binder Type. Materials 2020, 13, 5430. https://doi.org/10.3390/ma13235430
Park J, Park J, Jung M. Variation in Service Life on RC Structure According to Concrete Binder Type. Materials. 2020; 13(23):5430. https://doi.org/10.3390/ma13235430
Chicago/Turabian StylePark, JangHyun, JinHo Park, and MyeongGyu Jung. 2020. "Variation in Service Life on RC Structure According to Concrete Binder Type" Materials 13, no. 23: 5430. https://doi.org/10.3390/ma13235430
APA StylePark, J., Park, J., & Jung, M. (2020). Variation in Service Life on RC Structure According to Concrete Binder Type. Materials, 13(23), 5430. https://doi.org/10.3390/ma13235430