Performance Evaluation of Cementless Composites with Alkali-Sulfate Activator for Field Application


Abstract
1. Introduction
2. Experimental Procedure
2.1. Materials
2.2. Experimental Procedures
2.3. Test Methods
3. Results and Discussion
3.1. Engineering Properties Analysis
3.2. Acid Resistance Analysis
3.3. CO2 Reduction Properties Analysis
4. Conclusions
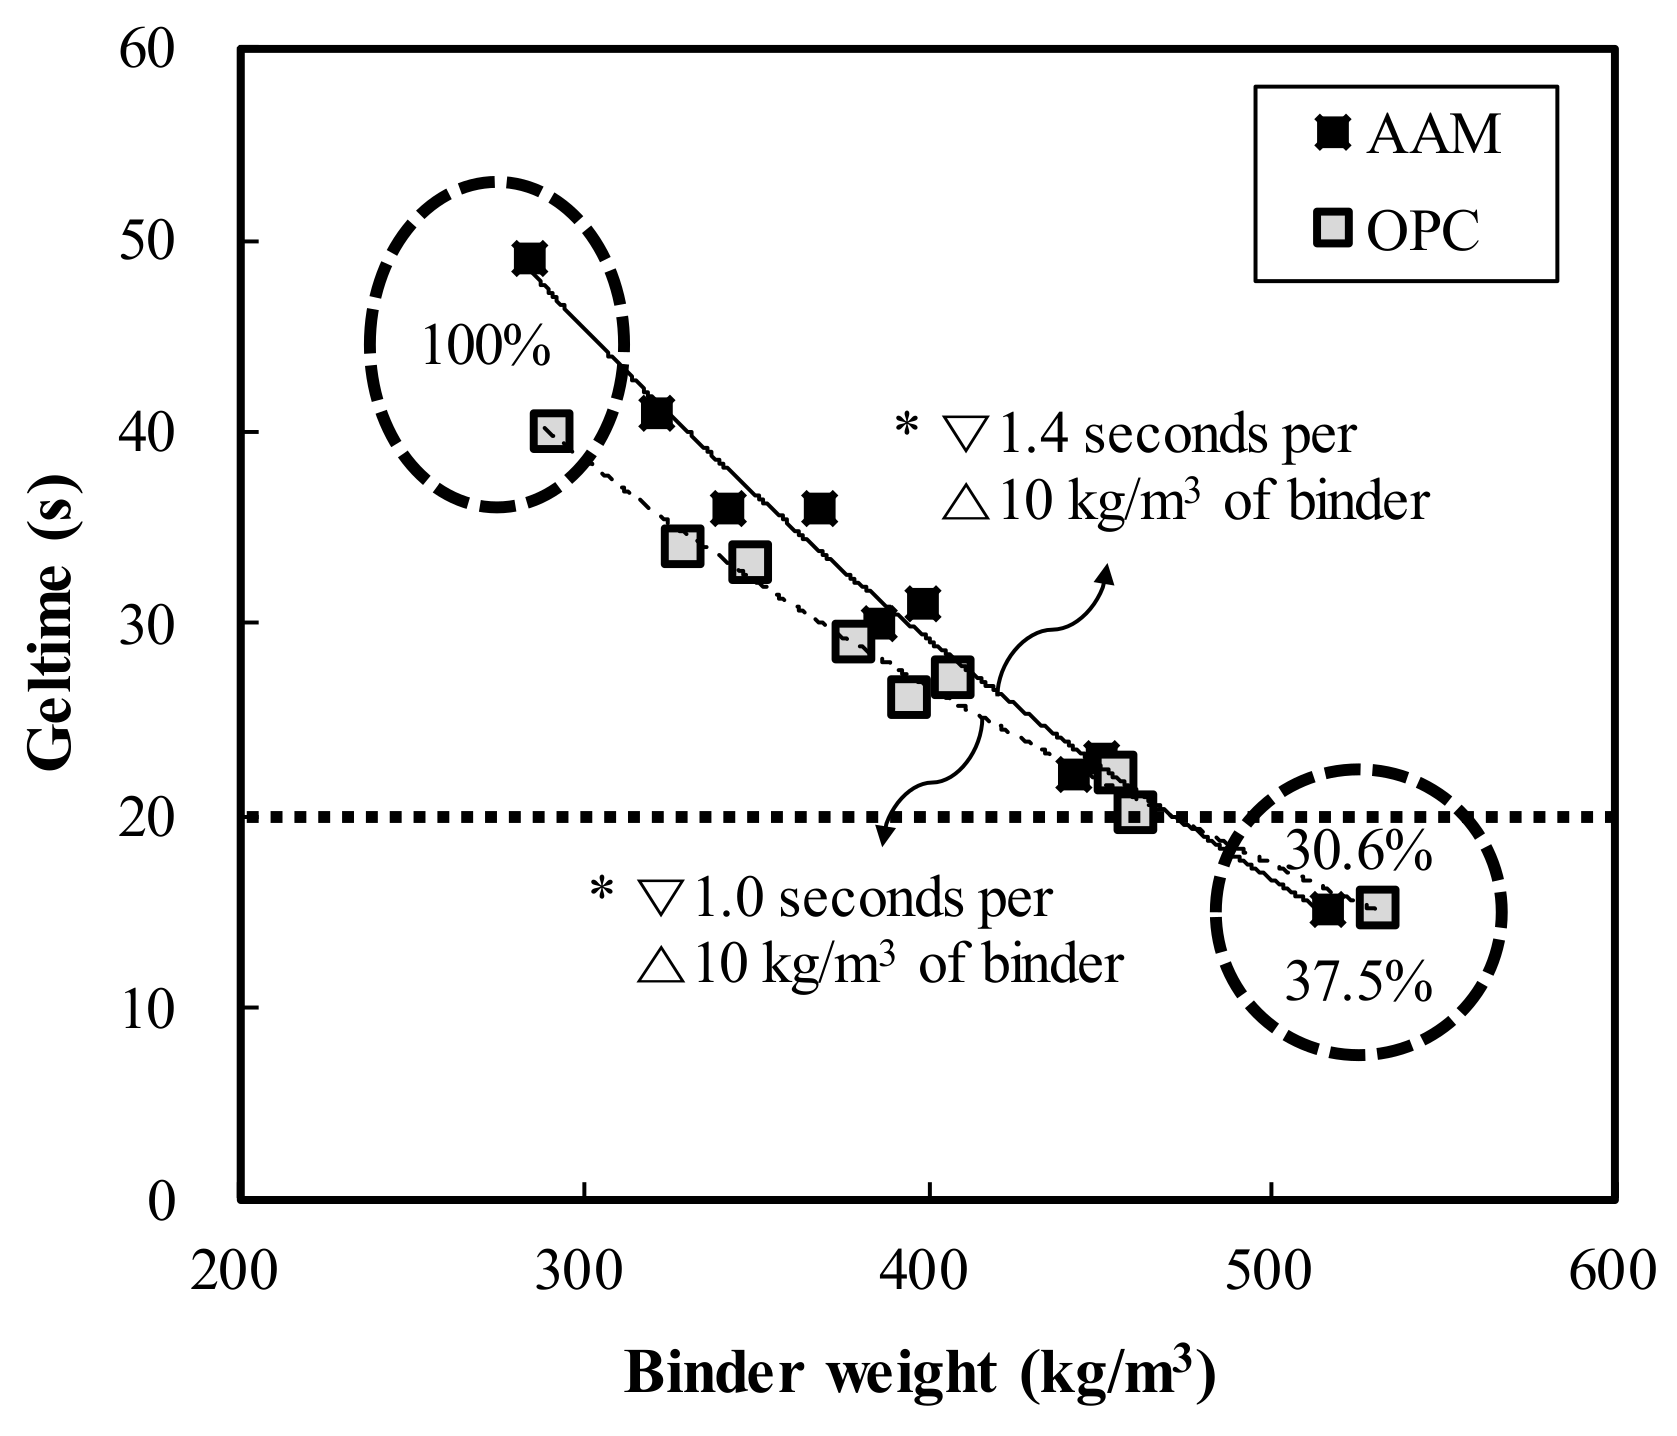
- Geltime decreased by 1.0 and 1.4 s in OPC and AAC, respectively, for each increase in binder weight of 10 kg/m3. Thus, under similar mixing conditions, OPC had more advantageous properties with a shorter geltime than AAC.
- In both OPC and AAC specimens, the homogel strength tended to increase as W/B decreased and the replacement ratio increased. At 7 days of age, W/B ratios of 100%, 120%, and 140%, and a replacement ratio of 70%, the AAC specimens exhibited higher homogel strength by 9.4 MPa (236.2%), 5.9 MPa (195.2%), and 5.3 MPa (198.1%), respectively. Hence, under the same mixing conditions, AAC is more advantageous for securing homogel strength than OPC.
- At 3 days of age, OPC showed an increase of 1.7 MPa when the binder weight increased by 100 kg/m3, whereas AAC showed an increase of 4.1 MPa. In addition, at 7 days of age, OPC showed an increase of 0.9 MPa when the binder weight increased by 100 kg/m3, whereas AAC showed an increase of 5.0 MPa. Geltime and homogel strength were found to be inversely related for both OPC and AAC.
- Based on the 5000× magnification SEM images taken at 7 days to analyze the matrix microstructures, similar hydration products found in OPC, calcium silicate hydrates (C–S–H, Ca1.5SiO3.5·H2O)) and ettringite (Ca6Al2(SO4)3(OH)12·26H2O), were formed in AAC. These findings proved that in the AAC specimens, GGBS, CFBC ash, and PCDG produced hydrates similar to OPC through chemical hydration reactions, although OPC was not used.
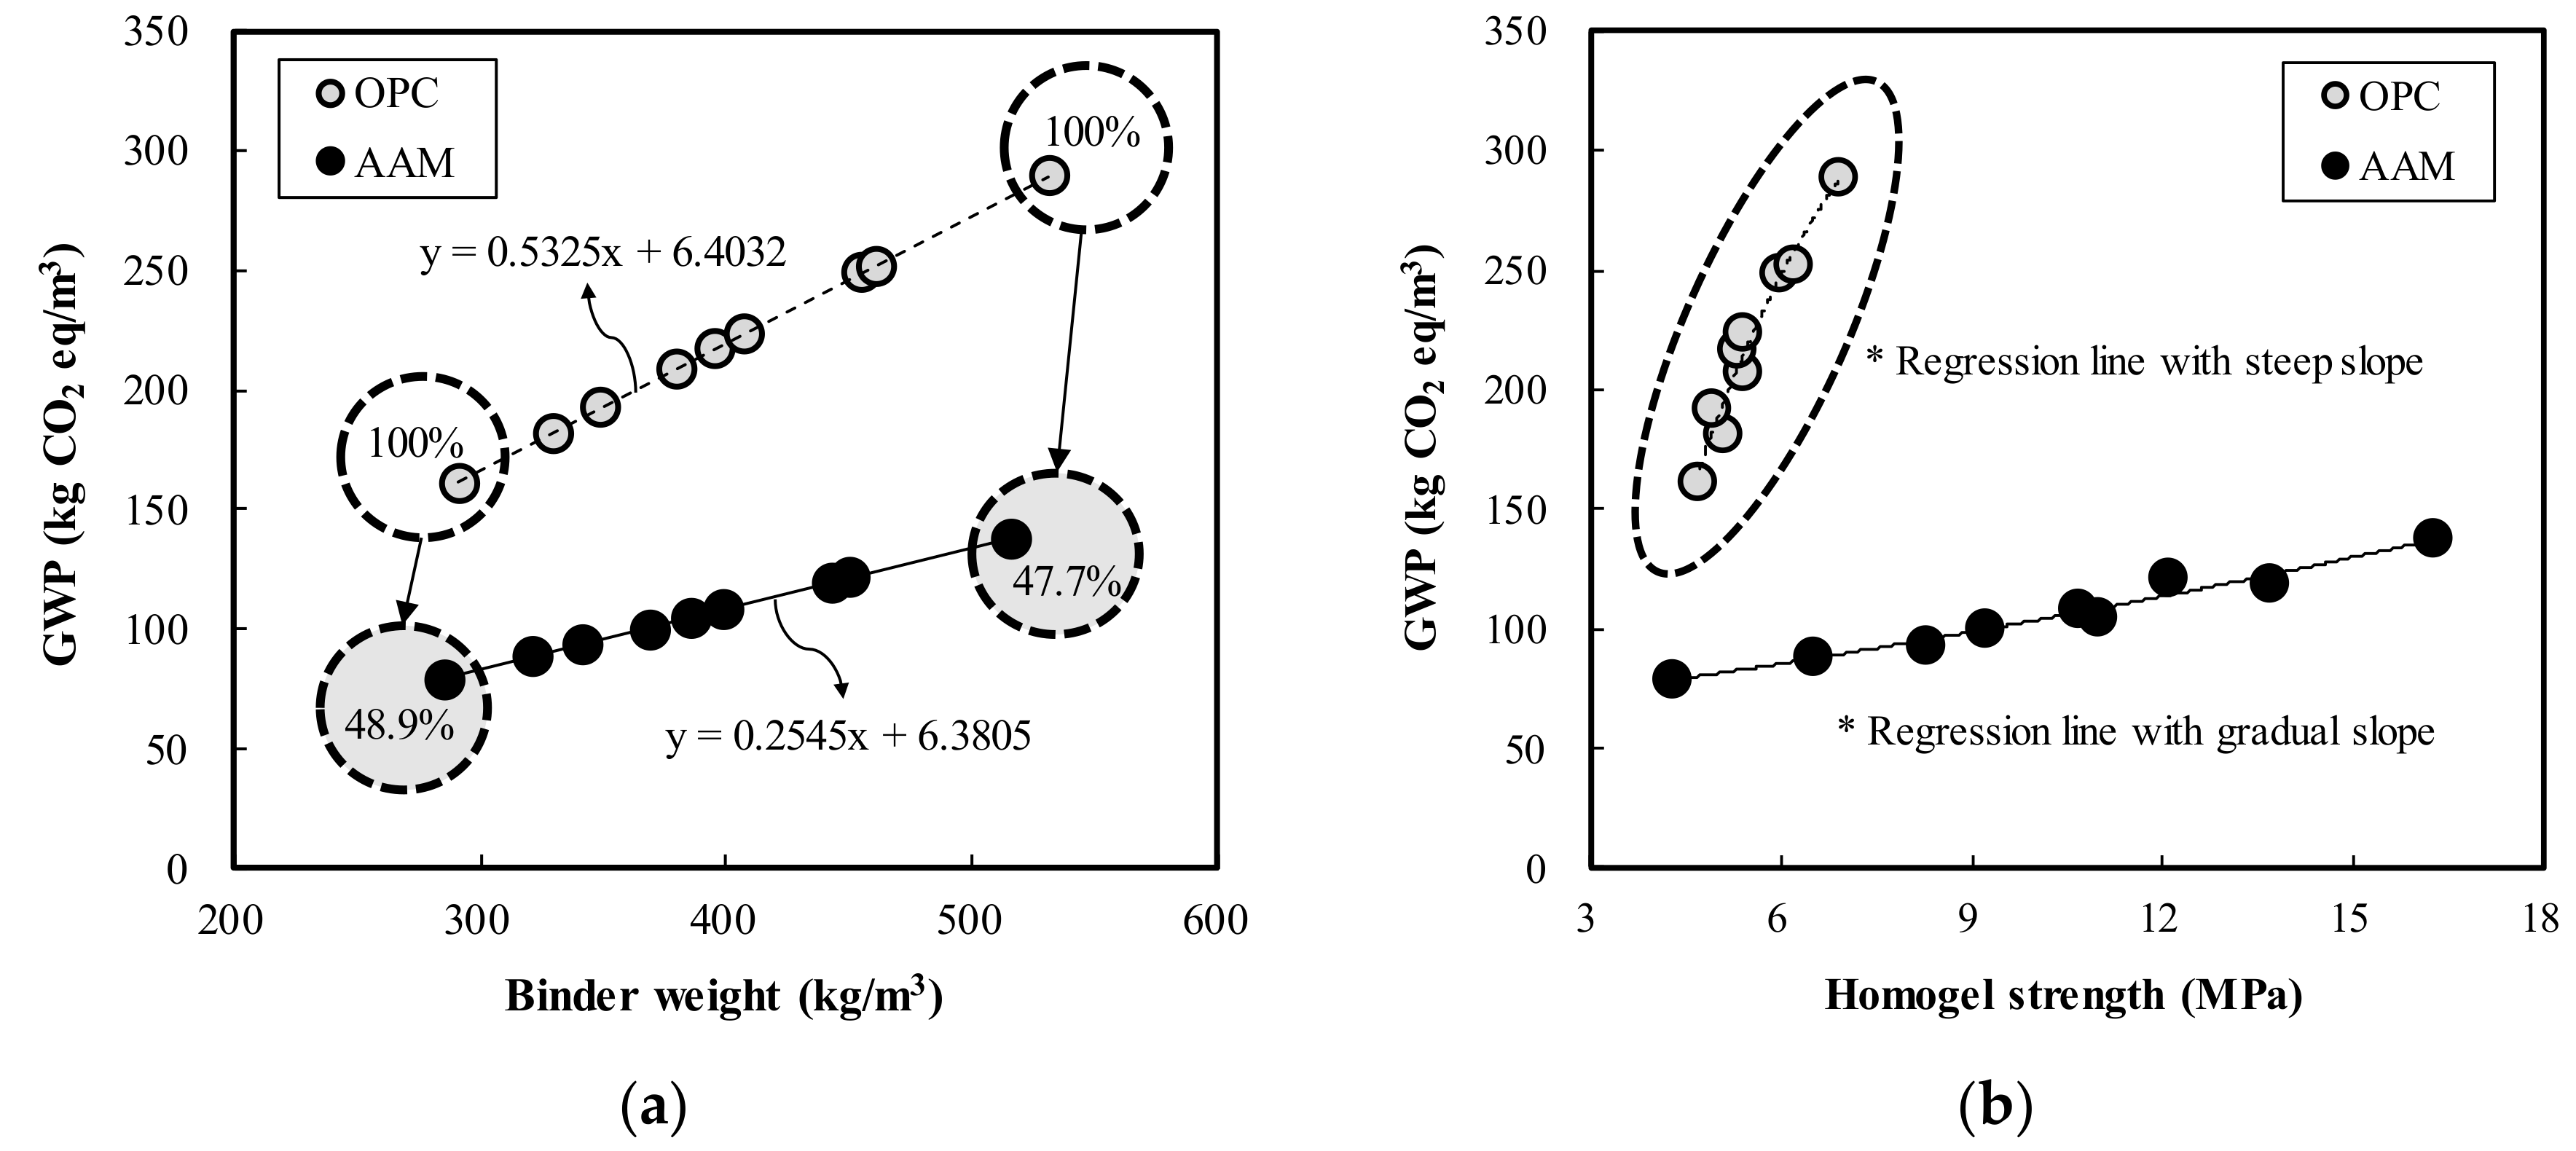
- The acid resistance properties analysis showed that the mass change of AAC in HCl and H2SO4 solutions ranged from 36.1 to 88.0%, lower than that of OPC, indicating AAC’s superior acid resistance. Furthermore, for OPC, GWP increased by 25.45 kg CO2 eq with a 100 kg/m3 increase in binder weight, while GWP of AAC increased by 53.25 kg CO2 eq. This demonstrates that AAC has a greater effect on CO2 reduction than OPC.
Author Contributions
Funding
Conflicts of Interest
Abbreviations
| AAC | Alkali-activated Composites |
| OPC | Ordinary Portland Cement |
| GWP | Global Warming Potential |
| GGBS | Ground Granulated Blast-furnace Slag |
| FA | Fly Ash |
| CSA | Calcium Sulfoaluminate |
| CFBC | Circulating Fluidized Bed Combustion |
| PCDG | Petro Cokes Desulfurization Gypsum |
| PCC | Pulverized Coal Combustion |
| SSS | Sodium Silicate Solution |
| SEM | Scanning Electron Microscope |
References
- The European Cement Association. Activity Report; CEMBUREAU: Brussels, Belgium, 2018; pp. 1–56. [Google Scholar]
- Parron-Rubio, M.E.; Perez-Garcia, F.; Gonzalez-Herrera, A.; Oliveira, M.J.; Rubio-Cintas, M.D. Slag Substitution as a Cementing Material in Concrete: Mechanical, Physical and Environmental Properties. Materials 2019, 12, 2845. [Google Scholar] [CrossRef]
- Anand, S.; Vrat, P.; Dahiya, R. Application of a system dynamics approach for assessment and mitigation of CO2 emissions from the cement industry. J. Environ. Manag. 2006, 79, 383–398. [Google Scholar] [CrossRef]
- Roskovi, R.; Bjegovi, D. Role of mineral additions in reducing CO2 emission. Cem. Concr. Res. 2005, 35, 974–978. [Google Scholar] [CrossRef]
- Coppola, L.; Co etti, D.; Crotti, E.; Pastore, T. CSA-based Portland-free binders to manufacture sustainable concretes for jointless slabs on ground. Constr. Build. Mater. 2018, 187, 691–698. [Google Scholar] [CrossRef]
- Pacheco, F.-T.; Castro-Gomes, J.; Jalali, S. Alkali-activated binders: A review: Part 1. Historical background, terminology, reaction mechanisms and hydration products. Constr. Build. Mater. 2008, 22, 1305–1314. [Google Scholar] [CrossRef]
- Małek, M.; Łasica, W.; Jackowski, M.; Kadela, M. Effect of Waste Glass Addition as a Replacement for Fine Aggregate on Properties of Mortar. Materials 2020, 13, 3189. [Google Scholar] [CrossRef] [PubMed]
- Lee, J.; Lee, T. Influences of Chemical Composition and Fineness on the Development of Concrete Strength by Curing Conditions. Materials 2019, 12, 4061. [Google Scholar] [CrossRef] [PubMed]
- Coppola, L.; Co etti, D.; Crotti, E.; Marini, A.; Passoni, C.; Pastore, T. Lightweight cement-free alkali-activated slag plaster for the structural retrofit and energy upgrading of poor quality masonry walls. Cem. Concr. Compos. 2019, 104, 103341. [Google Scholar] [CrossRef]
- Lee, J.; Kim, G.; Kim, Y.; Mun, K.; Nam, J. Engineering Properties and Optimal Conditions of Cementless Grouting Materials. Materials 2019, 12, 3059. [Google Scholar] [CrossRef]
- Cartwright, C.; Rajabipour, F.; Radlinska, A. Shrinkage characteristics of alkali-activated slag cements. J. Mater. Civ. Eng. 2014, 27, 4014007. [Google Scholar] [CrossRef]
- Kumarappa, D.B.; Peethamparan, S.; Ngami, M. Autogenous shrinkage of alkali activated slag mortars: Basic mechanisms and mitigation methods. Cem. Concr. Res. 2018, 109, 1–9. [Google Scholar] [CrossRef]
- Atis, C.D.; Bilim, C.; Çelik, Ö.; Karahan, O. Influence of activator on the strength and drying shrinkage of alkali-activated slag mortar. Constr. Build. Mater. 2009, 23, 548–555. [Google Scholar] [CrossRef]
- Choi, S.; Ryu, G.S.; Koh, K.T.; An, G.H.; Kim, H.Y. Experimental Study on the Shrinkage Behavior and Mechanical Properties of AAC Mortar Mixed with CSA Expansive Additive. Materials 2019, 12, 3312. [Google Scholar] [CrossRef] [PubMed]
- Nguyen, H.-A.; Chang, T.-P.; Shih, J.-Y.; Chen, C.-T.; Nguyen, T.-D. Influence of circulating fluidized bed combustion (CFBC) fly ash on properties of modified high volume low calcium fly ash (HVFA) cement paste. Constr. Build. Mater. 2015, 91, 208–215. [Google Scholar] [CrossRef]
- Wu, T.; Chi, M.; Huang, R. Characteristics of CFBC fly ash and properties of cement-based composites with CFBC fly ash and coal-fired fly ash. Constr. Build. Mater. 2014, 66, 172–180. [Google Scholar] [CrossRef]
- Oka, S.N.; Anthony, E.J. Fluidized Bed Combustion; Marcel Dekker Inc.: New York, NY, USA, 2004; pp. 1–31. ISBN 0-8247-4699-6. [Google Scholar]
- Cuenca, M.A.; Anthony, E.J. Pressurized Fluidized Bed Combustion; Blackie Academic & Professional: London, UK, 1995; pp. 80–113. ISBN 978-94-011-0617-7. [Google Scholar]
- Conn, R.E.; Sellakumar, K.; Bland, A.E. Utilization of CFB Fly ash for Construction Applications. In Proceedings of the International Conference on Fluidized Bed Combustion, Livingston, NJ, USA, 16–19 May 1999; pp. 1–18. [Google Scholar]
- Zhang, Z.; Qian, J.; You, C.; Hu, C. Use of circulating fluidized bed combustion fly ash and slag in autoclaved brick. Constr. Build. Mater. 2012, 35, 109–116. [Google Scholar] [CrossRef]
- Chen, X.; Yan, Y.; Liu, Y.; Hu, Z. Utilization of circulating fluidized bed fly ash for the preparation of foam concrete. Constr. Build. Mater. 2014, 54, 137–146. [Google Scholar] [CrossRef]
- Blondin, J.; Anthony, E. A Selective Hydration Treatment to Enhance the Utilization of CFBC Ash in Concrete. In Proceedings of the 13th International Conference on FBC, Orlando, FL, USA, 7–10 May 1995. [Google Scholar]
- Peng, Z.; Vance, K.; Dakhane, A.; Marzke, R.F.; Neithalath, N. Microstructural and 29Si MAS NMR spectroscopic evaluations of alkali cationic effects on fly ash activation. Cem. Concr. Compos. 2015, 57, 34–43. [Google Scholar] [CrossRef]
- Bernal, S.A.; Provis, J.L.; Rose, V.; De Gutierrez, R.M. Evolution of binder structure in sodium silicate-activated slag-metakaolin blends. Cem. Concr. Compos. 2011, 33, 46–54. [Google Scholar] [CrossRef]
- Dakhane, A.; Peng, Z.; Marzke, R.; Neithalath, N. 29 Si NMR investigations on alkali activated fly ash or slag: The role of the alkali cation. Spec. Publ. 2016, 312, 1–14. [Google Scholar]
- Ravikumar, D.; Neithalath, N. Reaction kinetics in sodium silicate powder and liquid activated slag binders evaluated using isothermal calorimetry. Thermochim. Acta 2012, 546, 32–43. [Google Scholar] [CrossRef]
- Yang, K.-H.; Song, J.-K.; Ashour, A.F.; Lee, E.-T. Properties of cementless mortars activated by sodium silicate. Constr. Build. Mater. 2008, 22, 1981–1989. [Google Scholar] [CrossRef]
- Donatello, S.; Fernández-Jimenez, A.; Palomo, A. Very high volume fly ash cements. Early age hydration study using Na2SO4 as an activator. J. Am. Ceram. Soc. 2013, 96, 900–906. [Google Scholar] [CrossRef]
- Abdalqader, A.; Jin, F.; Al-Tabbaa, A. Development of greener alkali-activated cement: Utilisation of sodium carbonate for activating slag and fly ash mixtures. J. Clean. Prod. 2016, 113, 66–75. [Google Scholar] [CrossRef]
- Mobasher, N.; Bernal, S.A.; Provis, J.L. Structural evolution of an alkali sulfate activated slag cement. J. Nucl. Mater. 2016, 468, 97–104. [Google Scholar] [CrossRef]
- Lee, J.; Lee, T. Effects of High CaO Fly Ash and Sulfate Activator as a Finer Binder for Cementless Grouting Material. Materials 2019, 12, 3664. [Google Scholar] [CrossRef]
- Korean Industrial Standards. Portland Cement (KS L 5201); Korean Standards Association: Seoul, Korea, 2006. [Google Scholar]
- Korean Industrial Standards. Sodiun Silicate Liquid (KS M 1415); Korean Standards Association: Seoul, Korea, 2017. [Google Scholar]
- ASTM C1723-16. Standard Guide for Examination of Hardened Concrete Using Scanning Electron Microscopy; American Society of Testing and Materials: West Conshohocken, PA, USA, 2010; Volume 4, p. 2.
- ASTM C114-18. Standard Test Methods for Chemical Analysis of Hydraulic Cement; American Society of Testing and Materials: West Conshohocken, PA, USA, 2018.
- ASTM D4217-07. Standard Test Method for Geltime of Thermosetting Coating Powder; American Society of Testing and Materials: West Conshohocken, PA, USA, 2017.
- ASTM C109/C109M-20a. Standard Test Method for Compressive Strength of Hydraulic Cement Mortars (Using 2-in. or [50-mm] Cube Specimens); American Society of Testing and Materials: West Conshohocken, PA, USA, 2016.
- ASTM C267-01. Standard Test Methods for Chemical Resistance of Mortars, Grouts, and Monolithic Surfacings and Polymer Concretes; American Society of Testing and Materials: West Conshohocken, PA, USA, 2012.
- ASTM C579-18. Standard Test Methods for Compressive Strength of Chemical-Resistant Mortars, Grouts, Monolithic Surfacings, and Polymer Concretes; American Society of Testing and Materials: West Conshohocken, PA, USA, 2018.
- ISO 14040. Environmental Management: Life Cycle Assessment; Requirements and Guidelines; International Organization for Standardization: Geneva, Switzerland, 2006.
- Jeong, J.; Hong, T.; Kim, J.; Chae, M.; Ji, C. Multi-criteria analysis of a self-consumption strategy for building sectors focused on ground source heat pump systems. J. Clean. Prod. 2018, 186, 68–80. [Google Scholar] [CrossRef]
- Korea Environmental Industry and Technology Institute (KEITI). Available online: http://www.epd.or.kr/ (accessed on 21 November 2019).


| Material | Chemical Composition (%) | ||||||||
|---|---|---|---|---|---|---|---|---|---|
| CaO | SiO2 | Al2O3 | Fe2O3 | MgO | SO3 | H2O | Na2O | Other | |
| OPC (1) | 66.70 | 17.20 | 4.38 | 3.13 | 3.03 | 3.48 | 2.08 | ||
| AAC (2) | 56.28 | 20.72 | 8.29 | 0.51 | 2.31 | 10.51 | 1.38 | ||
| SSS (3) | 27.2 | 0.01 | 63.6 | 9.14 | 0.05 | ||||
| Material | Property |
|---|---|
| OPC | Type 1 ordinary Portland cement (KS L 5201) |
| Density: 3.15 g/cm3, specific surface area: 3120 cm2/g | |
| AAC | Alkali-activated composites |
| Density: 2.82 g/cm3, specific surface area: 4120 cm2/g | |
| SSS | Type 3 Sodium silicate solution (KS M 1415) |
| Density: 1.38 g/cm3, Water insolubility: 0.0026 |
| Series | Experimental Factor and Level | Evaluation Item | ||
|---|---|---|---|---|
| Binder Type | W/B Ratio (%) | Replacement Ratio (%) | ||
| Ⅰ. Raw material analysis | OPC AAC | 100 120 140 | 50 60 70 | Scanning electron microscope |
| X-ray fluorescence | ||||
| Ⅱ. Engineering properties analysis | Geltime (s) | |||
| Homogel strength (MPa) | ||||
| Scanning electron microscope | ||||
| Ⅲ. Acid resistance and CO2 reduction properties analysis | Mass change (%) | |||
| Global warming potential (kg CO2 eq/m3) | ||||
| Mix No. | Liquid A (kg/m3) | Liquid B (kg/m3) | Mix No. | Liquid A (kg/m3) | Liquid B (kg/m3) | ||||
|---|---|---|---|---|---|---|---|---|---|
| SSS | Water | OPC | SSS | SSS | Water | AAC | Water | ||
| O-100-50 | 346.0 | 250.0 | 379.5 | 379.5 | A-100-50 | 346.0 | 250.0 | 369.1 | 369.1 |
| O-100-60 | 276.8 | 200.0 | 455.4 | 455.4 | A-100-60 | 276.8 | 200.0 | 442.9 | 442.9 |
| O-100-70 | 207.6 | 150.0 | 531.3 | 531.3 | A-100-70 | 207.6 | 150.0 | 516.8 | 516.8 |
| O-120-50 | 346.0 | 250.0 | 329.5 | 395.4 | A-120-50 | 346.0 | 250.0 | 321.6 | 385.9 |
| O-120-60 | 276.8 | 200.0 | 395.4 | 474.5 | A-120-60 | 276.8 | 200.0 | 385.9 | 463.1 |
| O-120-70 | 207.6 | 150.0 | 461.3 | 553.6 | A-120-70 | 207.6 | 150.0 | 450.3 | 540.3 |
| O-140-50 | 346.0 | 250.0 | 291.1 | 407.6 | A-140-50 | 346.0 | 250.0 | 285.0 | 398.9 |
| O-140-60 | 276.8 | 200.0 | 349.4 | 489.1 | A-140-60 | 276.8 | 200.0 | 342.0 | 478.7 |
| O-140-70 | 207.6 | 150.0 | 407.6 | 570.6 | A-140-70 | 207.6 | 150.0 | 398.9 | 558.5 |
| Series | Evaluation Item | Test Method |
|---|---|---|
| Ⅰ. Raw material analysis | Scanning electron microscope | ASTM C1723 |
| X-ray fluorescence | ASTM C114 | |
| Ⅱ. Engineering properties analysis | Geltime (s) | ASTM D4217 |
| Homogel strength (MPa) | ASTM C109 | |
| Scanning electron microscope | ASTM C1723 | |
| Ⅲ. Acid resistance and CO2 reduction properties analysis | Mass change (%) | ASTM C267, 579 |
| Global warming potential (kg CO2 eq/m3) | ISO 14040 |
| Materials | GWP (kg CO2 eq.) |
|---|---|
| OPC | 5.32 × 10⁻¹ |
| GGBS | 5.01 × 10⁻¹ |
| CFBC ash | 1.01 × 10⁻² |
| PCDG | 5.96 × 10⁻⁴ |
| SSS | 1.73 × 10⁻³ |
| Water | 8.88 × 10⁻³ |
Publisher’s Note: MDPI stays neutral with regard to jurisdictional claims in published maps and institutional affiliations. |
© 2020 by the authors. Licensee MDPI, Basel, Switzerland. This article is an open access article distributed under the terms and conditions of the Creative Commons Attribution (CC BY) license (http://creativecommons.org/licenses/by/4.0/).
Share and Cite
Lee, J.; Lee, T.; Lee, S.; Choi, H. Performance Evaluation of Cementless Composites with Alkali-Sulfate Activator for Field Application. Materials 2020, 13, 5410. https://doi.org/10.3390/ma13235410
Lee J, Lee T, Lee S, Choi H. Performance Evaluation of Cementless Composites with Alkali-Sulfate Activator for Field Application. Materials. 2020; 13(23):5410. https://doi.org/10.3390/ma13235410
Chicago/Turabian StyleLee, Jaehyun, Taegyu Lee, Seungwoo Lee, and Hyeonggil Choi. 2020. "Performance Evaluation of Cementless Composites with Alkali-Sulfate Activator for Field Application" Materials 13, no. 23: 5410. https://doi.org/10.3390/ma13235410
APA StyleLee, J., Lee, T., Lee, S., & Choi, H. (2020). Performance Evaluation of Cementless Composites with Alkali-Sulfate Activator for Field Application. Materials, 13(23), 5410. https://doi.org/10.3390/ma13235410