In Situ Laser-Induced Fabrication of a Ruthenium-Based Microelectrode for Non-Enzymatic Dopamine Sensing

 ,
, 

Abstract

1. Introduction
2. Materials and Methods
2.1. Materials
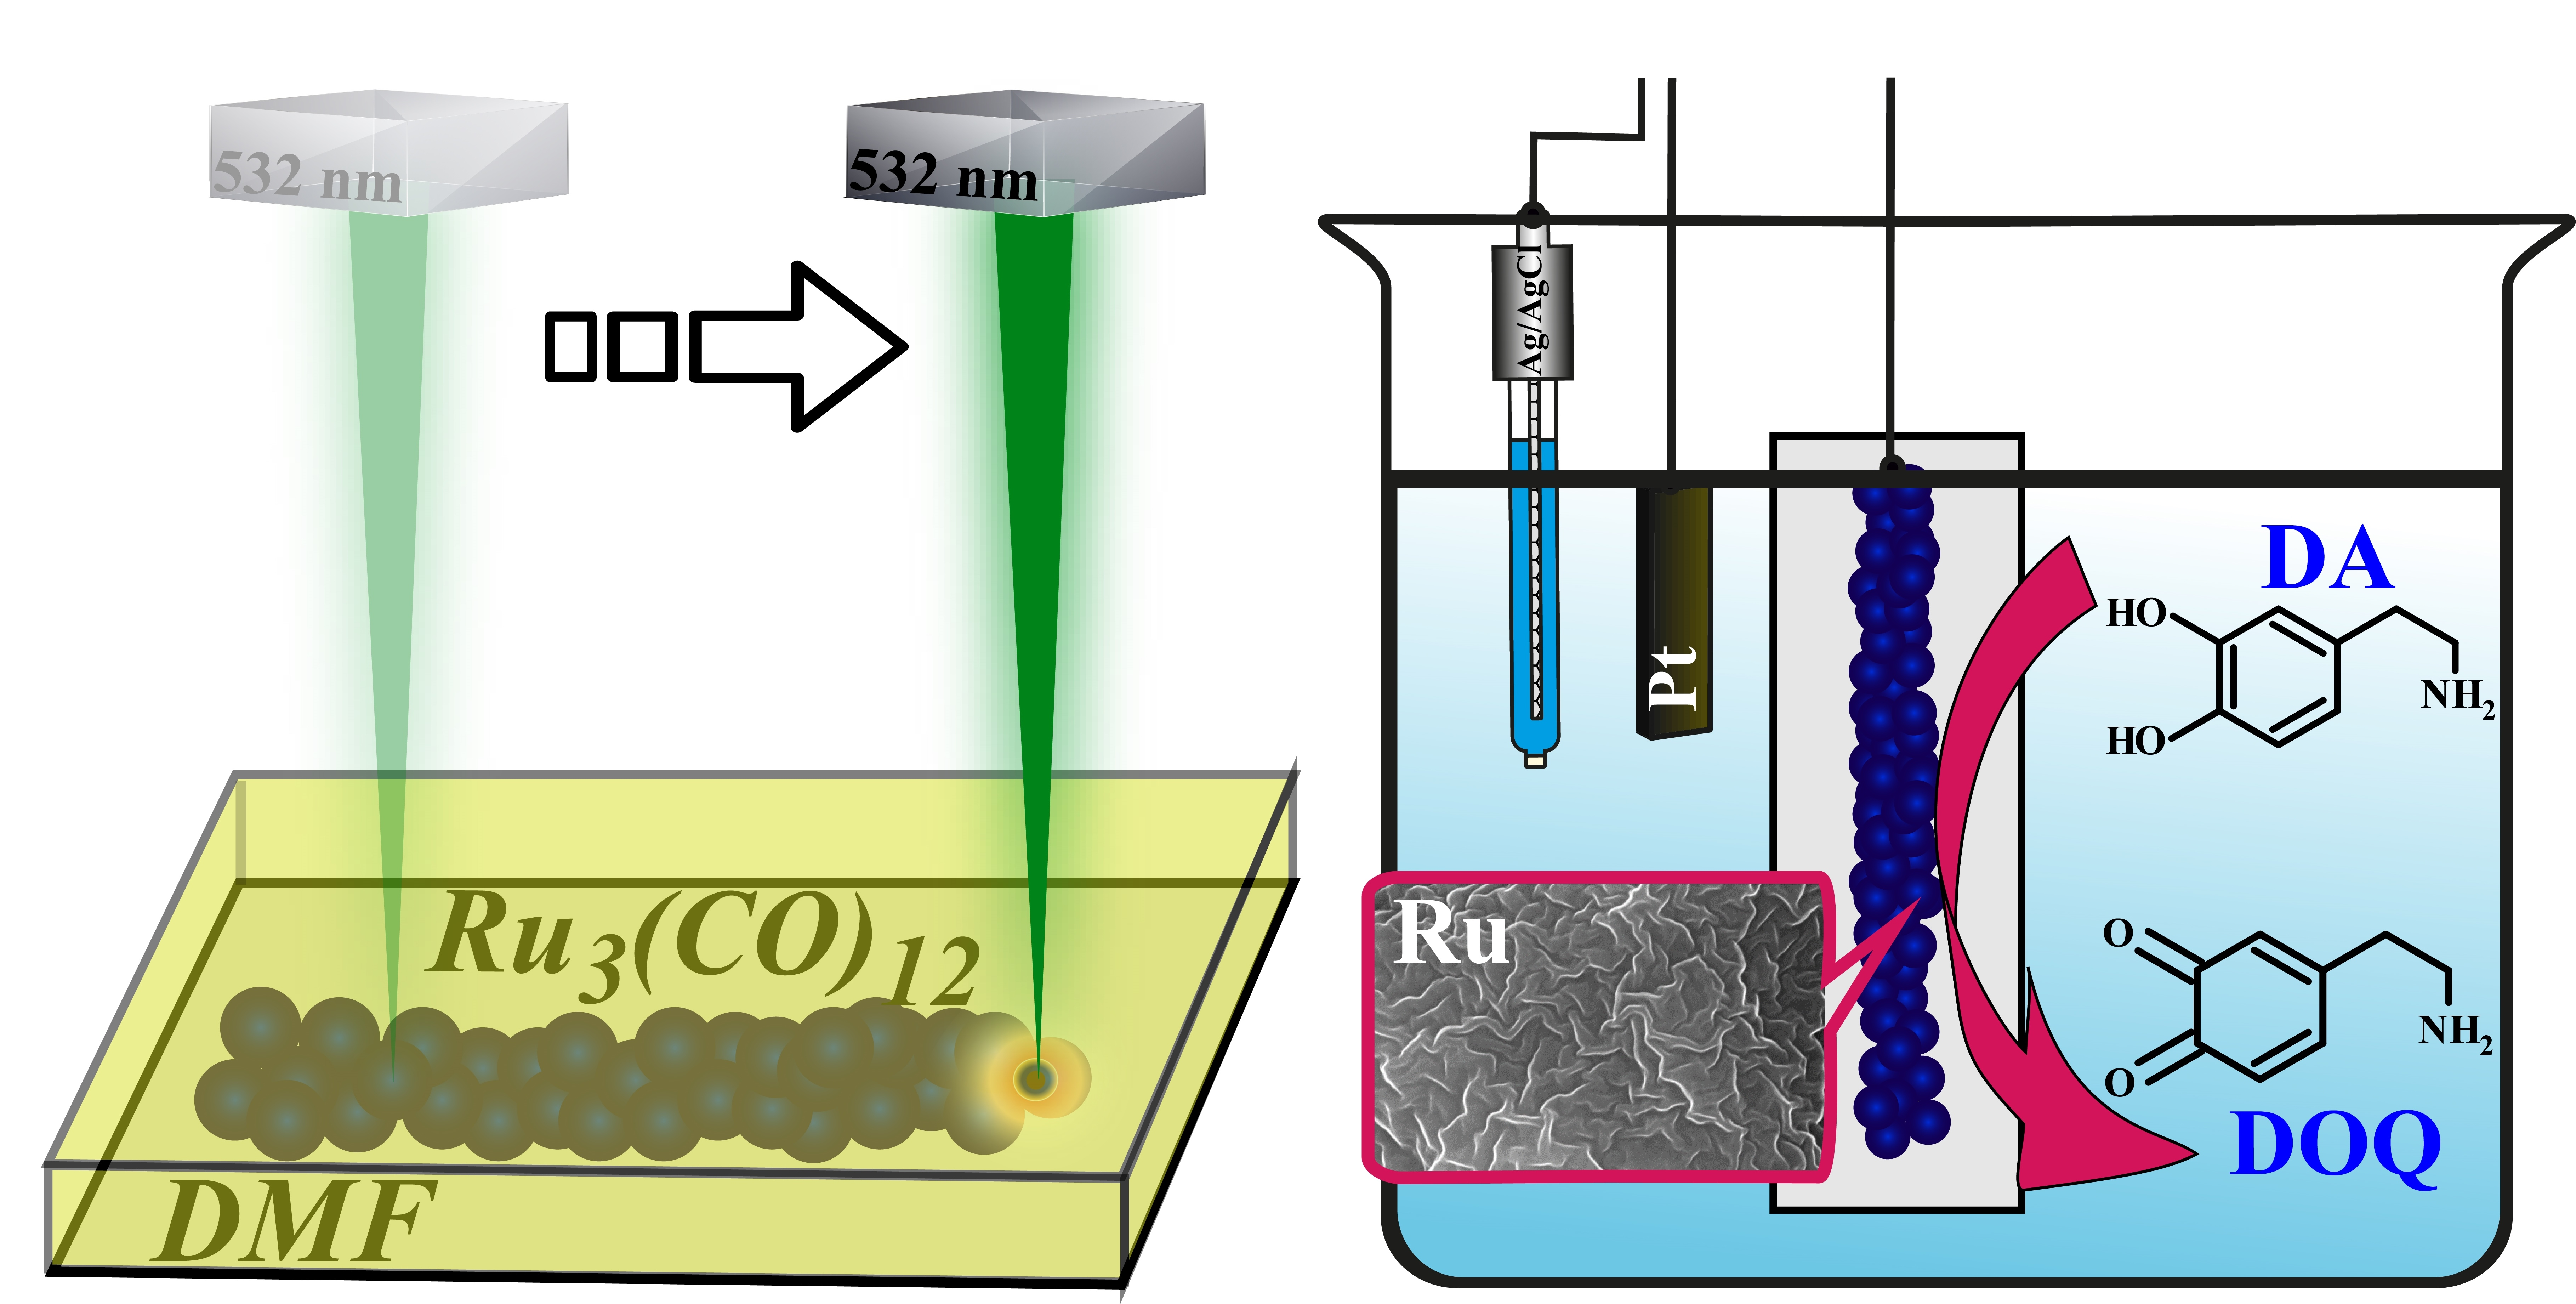
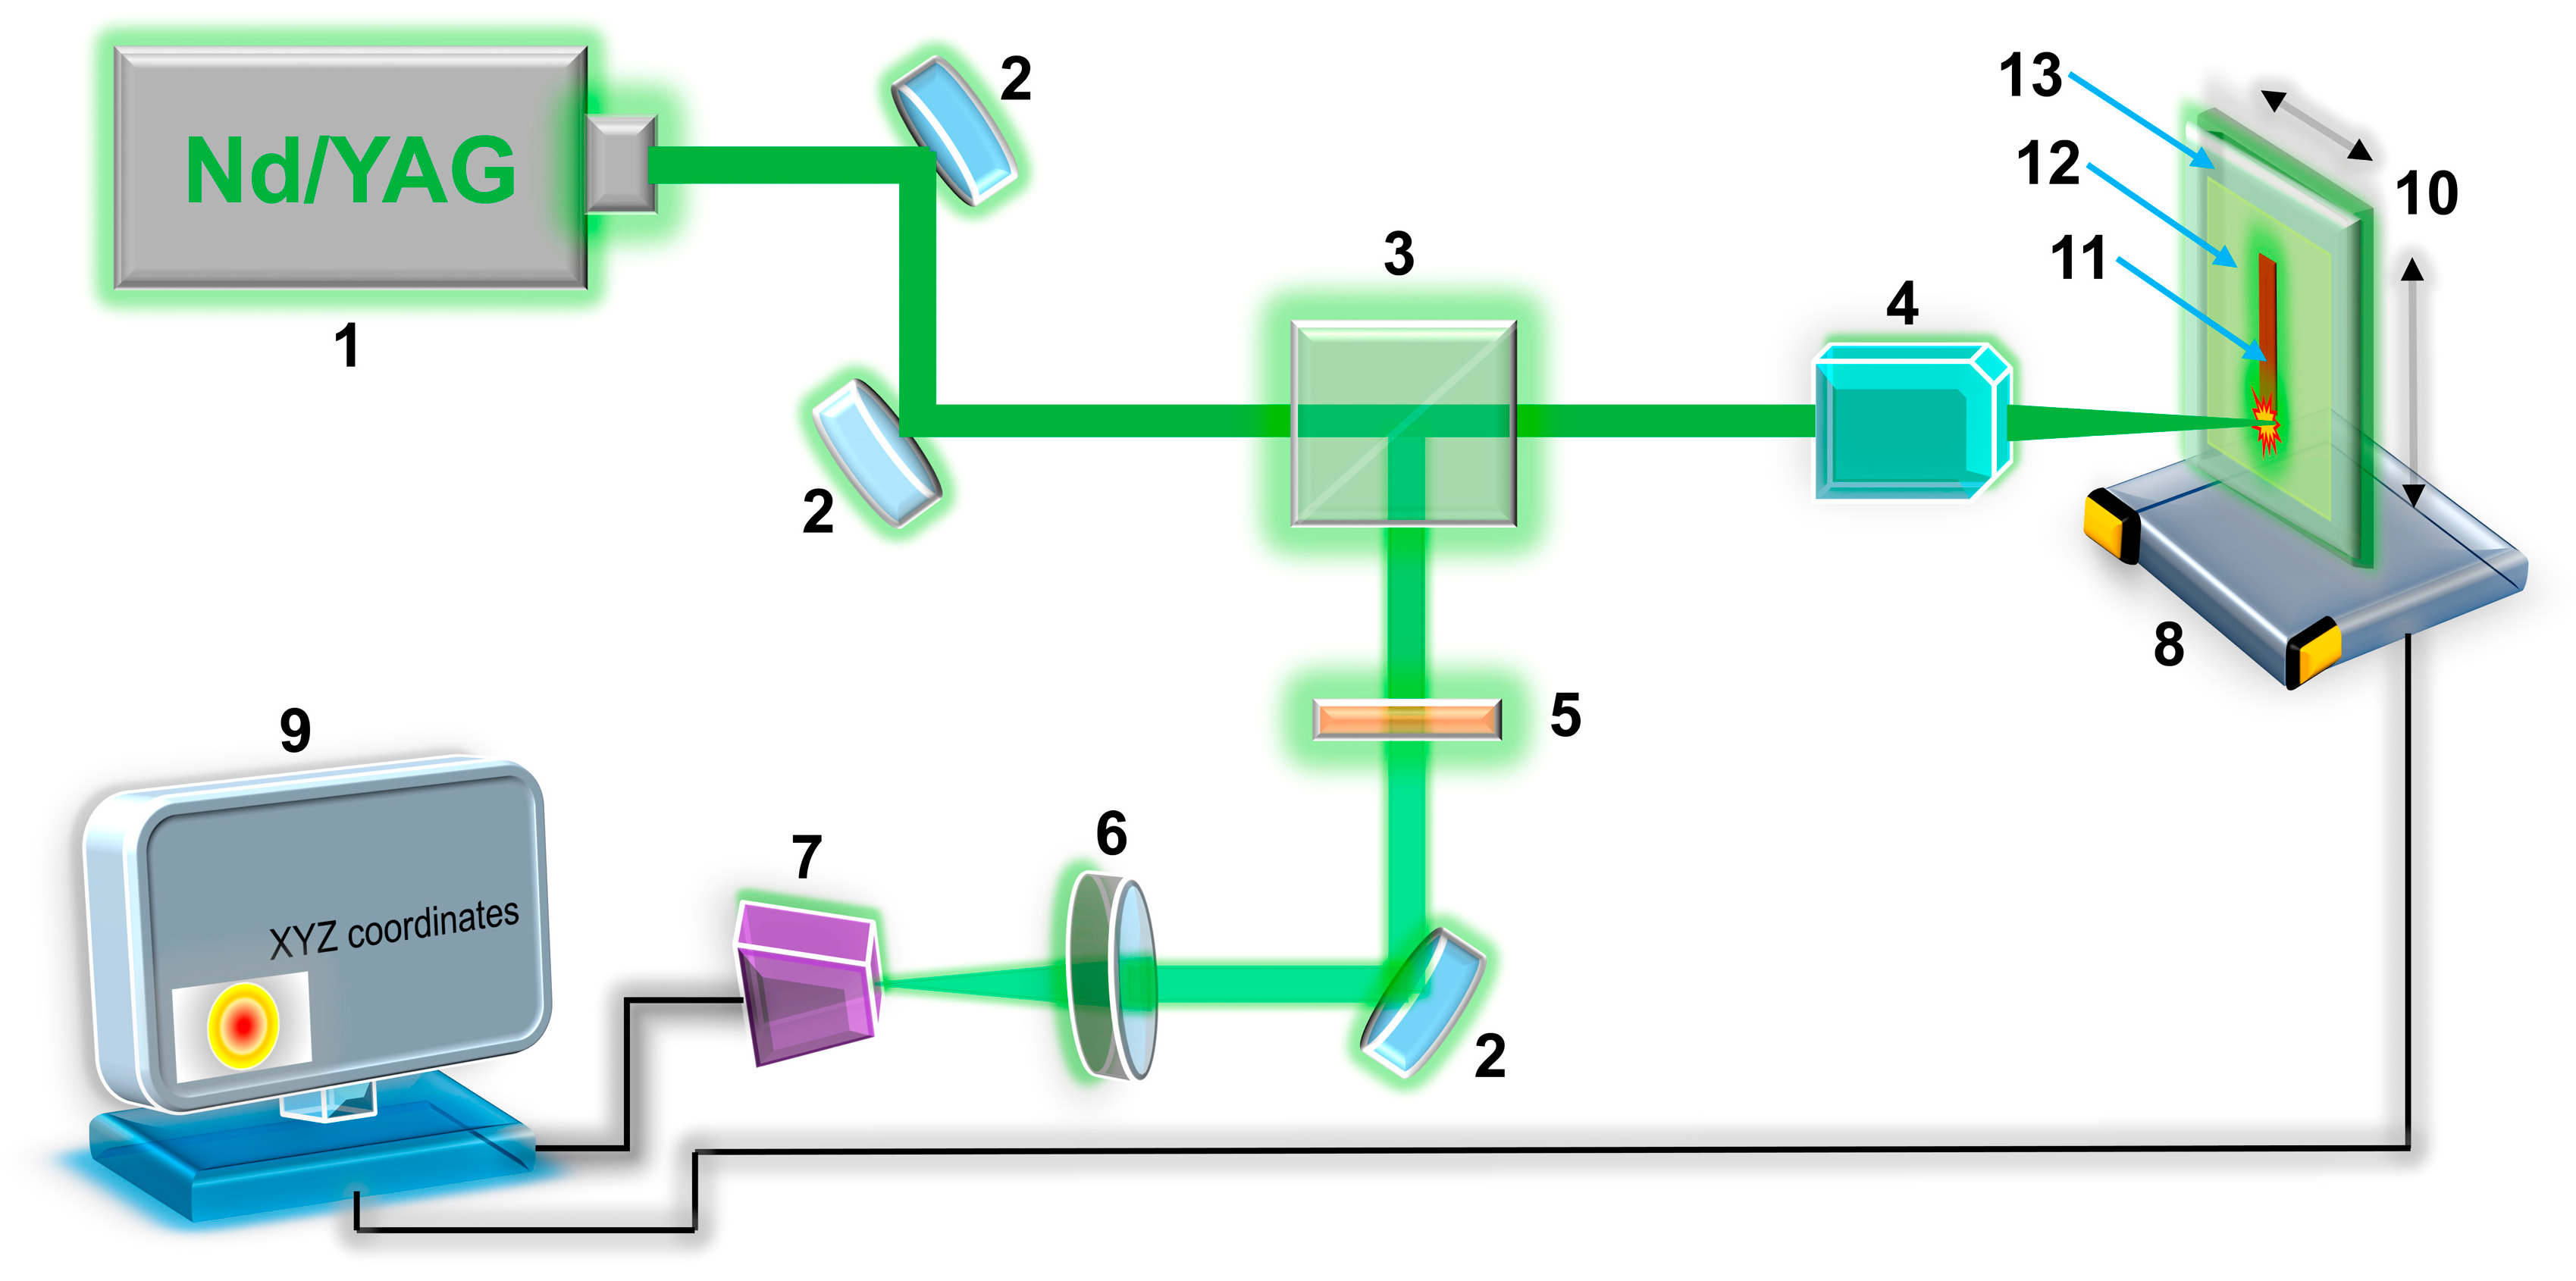
2.2. Synthesis of Ru-Based Microelectrode
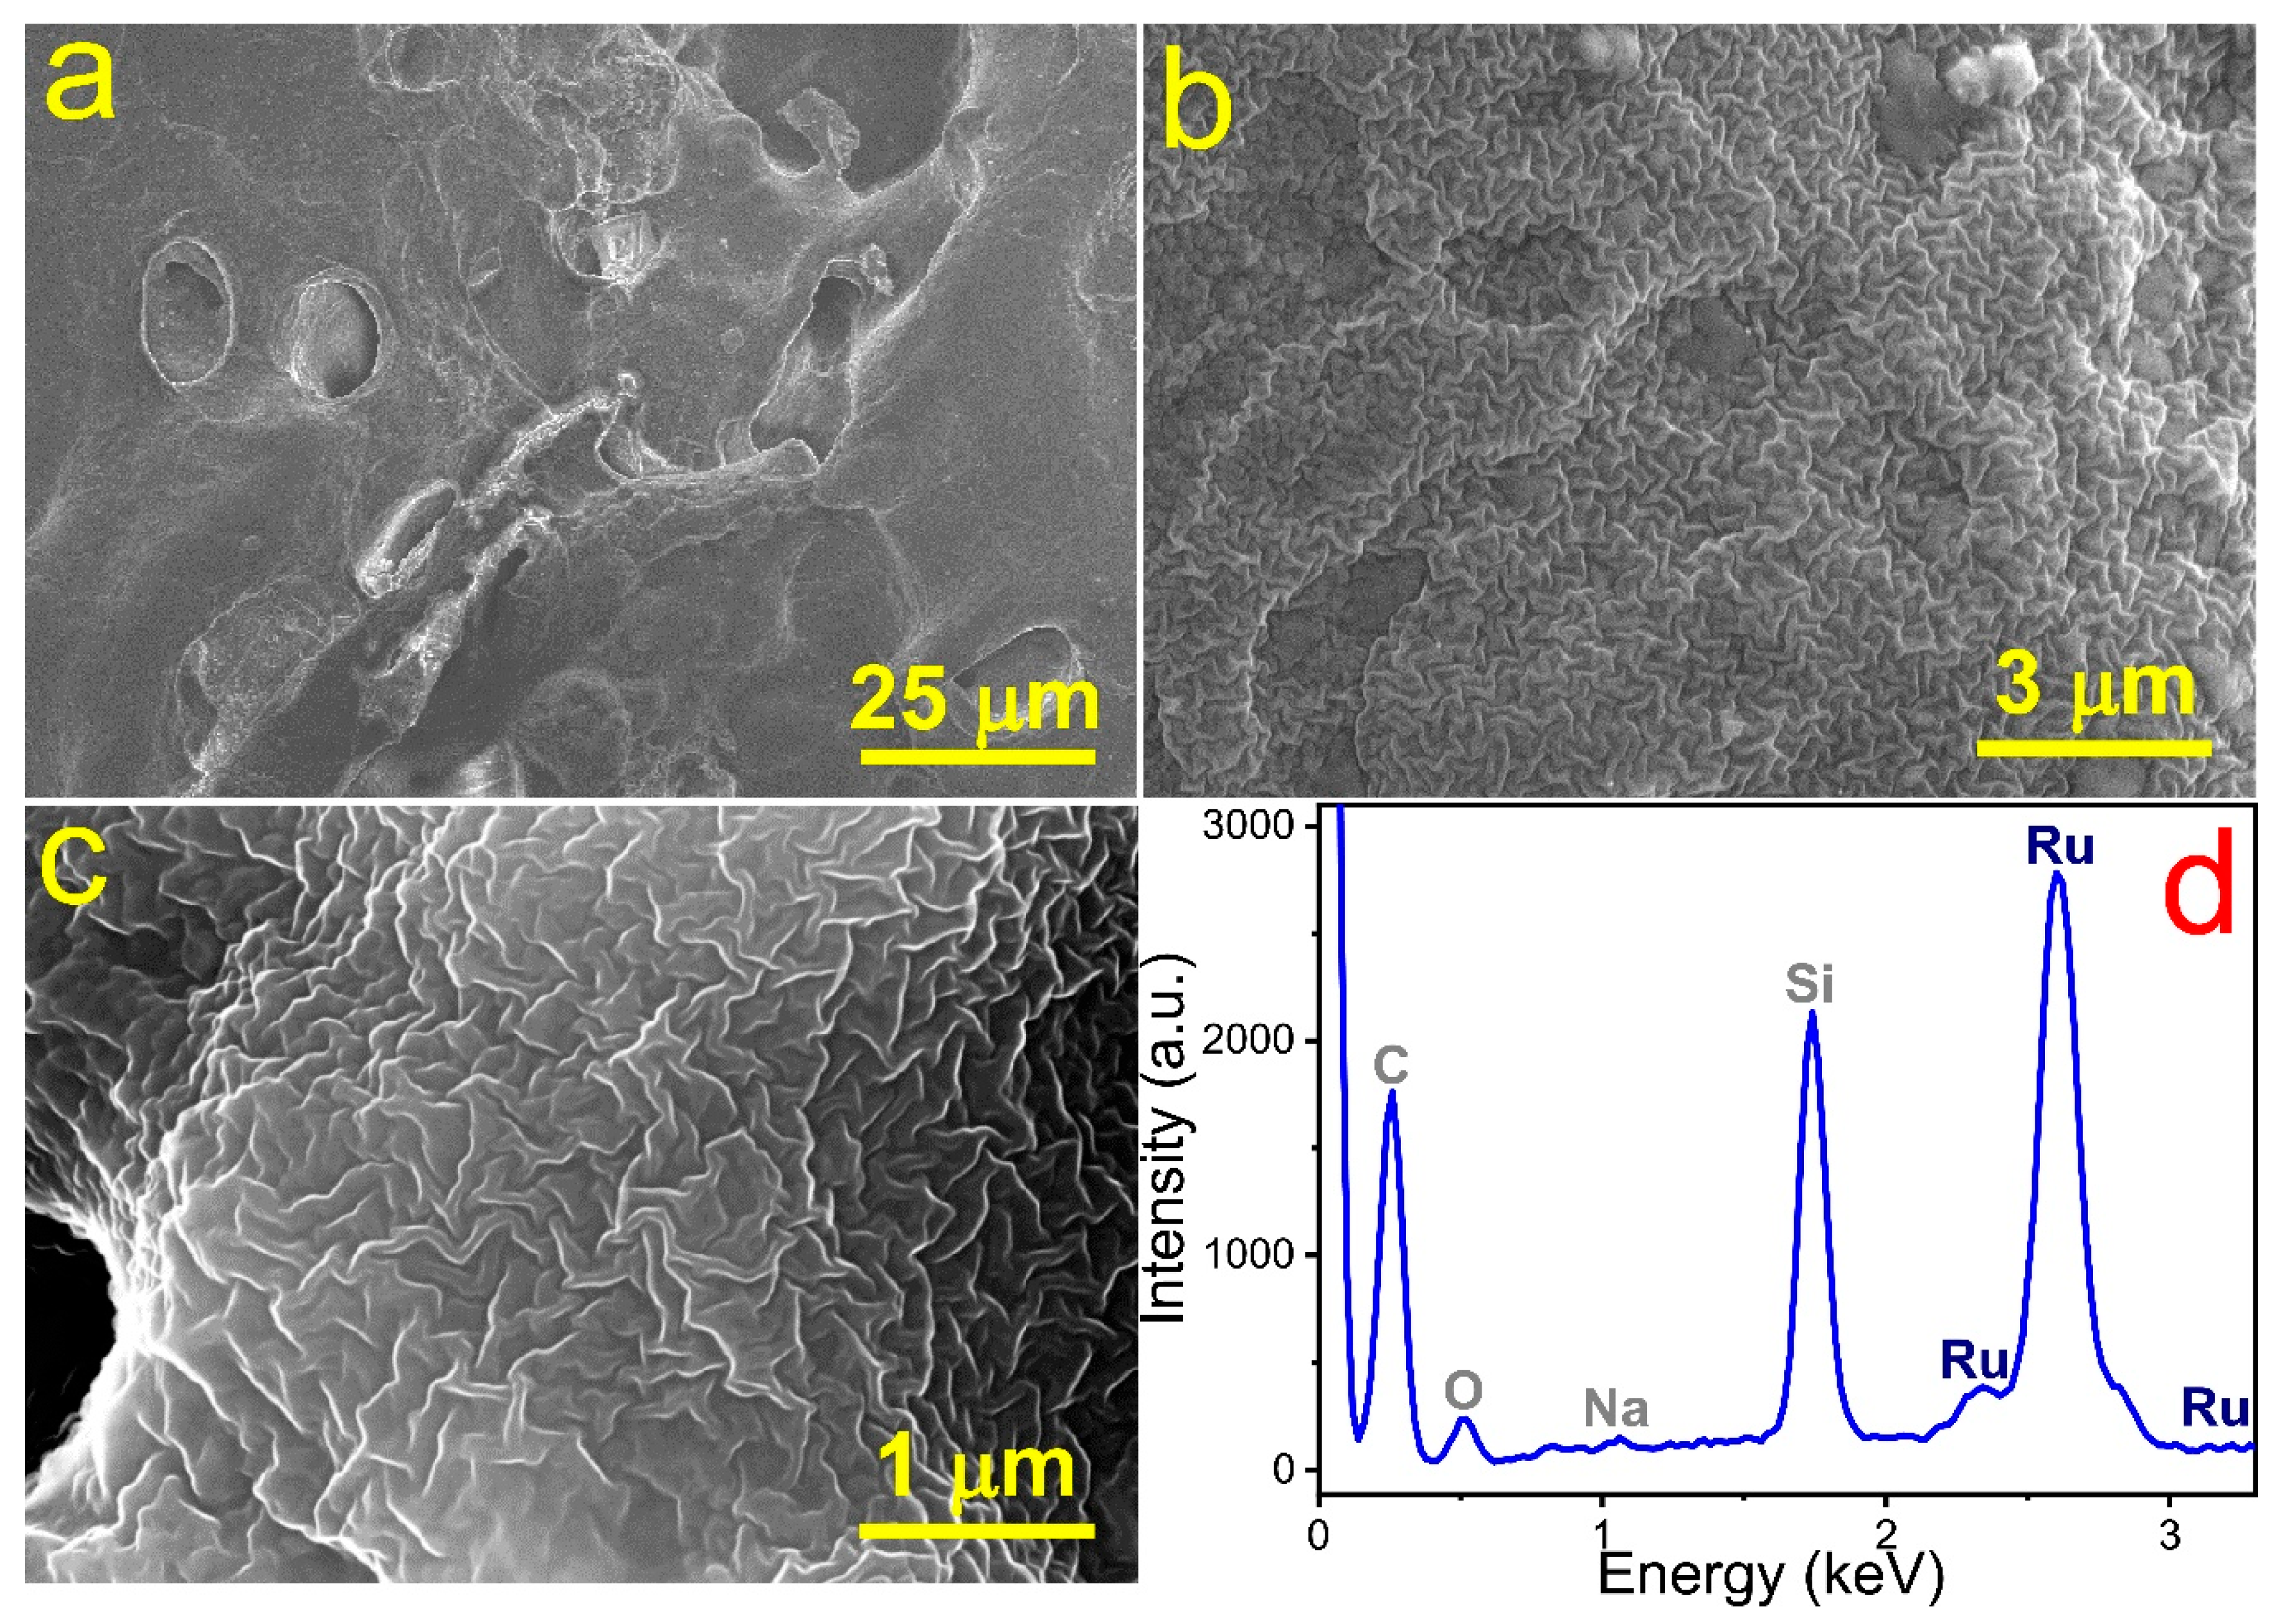
2.3. Morphology and Phase Identification of Ru-Based Microelectrode
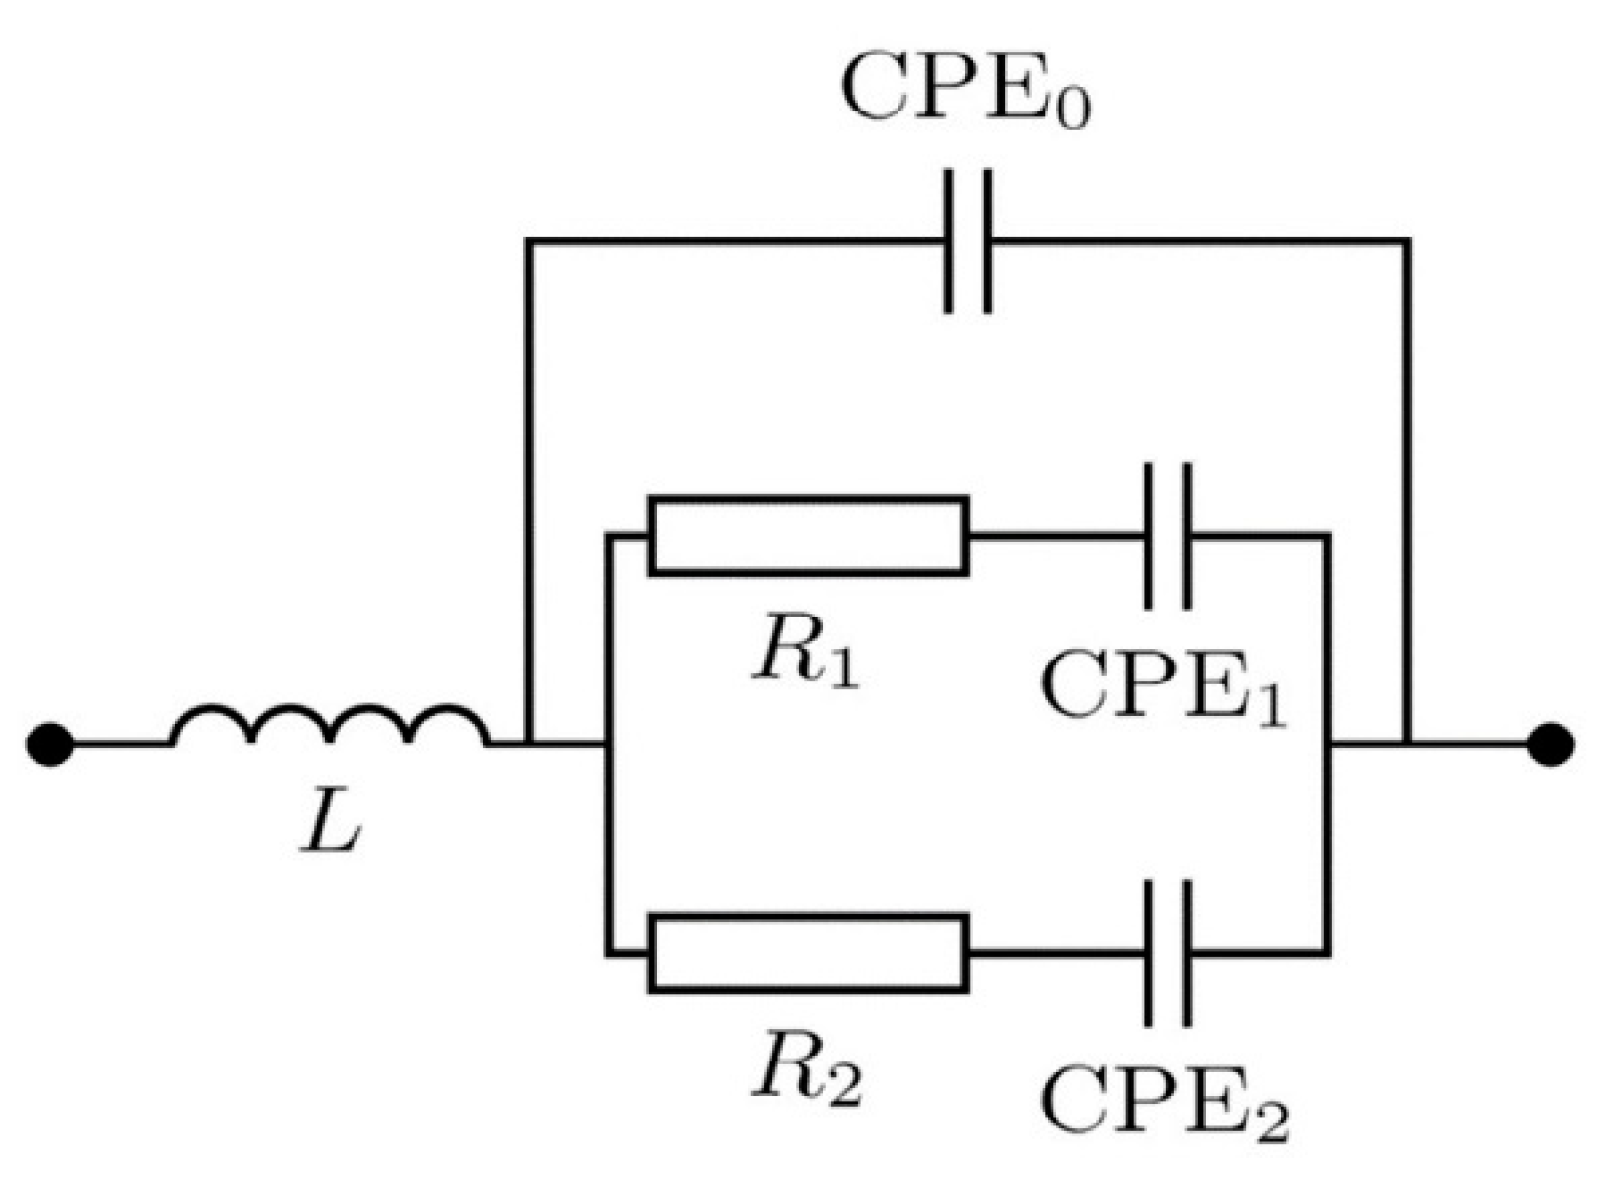
2.4. Impedance Measurements
2.5. Electrochemical Studies
3. Results and Discussion
4. Conclusions
Author Contributions
Funding
Acknowledgments
Conflicts of Interest
References
- Bakker, E. Electrochemical sensors. Anal. Chem. 2004, 76, 3285–3298. [Google Scholar] [CrossRef] [PubMed]
- Wei, F.; Patel, P.; Liao, W.; Chaudhry, K.; Zhang, L.; Arellano-Garcia, M.; Hu, S.; Elashoff, D.; Zhou, H.; Shukla, S.; et al. Electrochemical sensor for multiplex biomarkers detection. Clin. Cancer Res. 2009, 15, 4446–4452. [Google Scholar] [CrossRef] [PubMed]
- Manbohi, A.; Ahmadi, S.H. Sensitive and selective detection of dopamine using electrochemical microfluidic paper-based analytical nanosensor. Sens. Bio-Sens. Res. 2019, 23, 100270. [Google Scholar] [CrossRef]
- Qian, T.; Yu, C.; Zhou, X.; Ma, P.; Wu, S.; Xu, L.; Shen, J. Ultrasensitive dopamine sensor based on novel molecularly imprinted polypyrrole coated carbon nanotubes. Biosens. Bioelectron. 2014, 58, 237–241. [Google Scholar] [CrossRef]
- Rocha, B.A.; Da Costa, B.R.B.; De Albuquerque, N.C.P.; De Oliveira, A.R.M.; Souza, J.M.O.; Al-Tameemi, M.; Campiglia, A.D.; Barbosa, F. A fast method for bisphenol A and six analogues (S, F, Z, P, AF, AP) determination in urine samples based on dispersive liquid-liquid microextraction and liquid chromatography-tandem mass spectrometry. Talanta 2016, 154, 511–519. [Google Scholar] [CrossRef]
- Zhang, Y.; Qi, S.; Liu, Z.; Shi, Y.; Yue, W.; Yi, C. Rapid determination of dopamine in human plasma using a gold nanoparticle-based dual-mode sensing system. Mater. Sci. Eng. C 2016, 61, 207–213. [Google Scholar] [CrossRef]
- Dutta, S.; Ray, C.; Mallick, S.; Sarkar, S.; Sahoo, R.; Negishi, Y.; Pal, T. A Gel-Based Approach to Design Hierarchical CuS Decorated Reduced Graphene Oxide Nanosheets for Enhanced Peroxidase-like Activity Leading to Colorimetric Detection of Dopamine. J. Phys. Chem. C 2015, 119, 23790–23800. [Google Scholar] [CrossRef]
- Li, W.; Ding, L.; Wang, Q.; Su, B. Differential pulse voltammetry detection of dopamine and ascorbic acid by permselective silica mesochannels vertically attached to the electrode surface. Analyst 2014, 139, 3926–3931. [Google Scholar] [CrossRef]
- Sha, R.; Jones, S.S.; Vishnu, N.; Soundiraraju, B.; Badhulika, S. A Novel Biomass Derived Carbon Quantum Dots for Highly Sensitive and Selective Detection of Hydrazine. Electroanalysis 2018, 30, 2228–2232. [Google Scholar] [CrossRef]
- Si, Y.; Lao, J.; Zhang, X.; Liu, Y.; Cai, S.; Gonzalez-Vila, A.; Li, K.; Huang, Y.; Yuan, Y.; Caucheteur, C.; et al. Electrochemical Plasmonic Fiber-optic Sensors for Ultra-Sensitive Heavy Metal Detection. J. Lightwave Technol. 2019, 37, 3495–3502. [Google Scholar] [CrossRef]
- Revathi, C.; Rajendra Kumar, R.T. Enzymatic and Nonenzymatic Electrochemical Biosensors; Elsevier Ltd.: Amsterdam, The Netherlands, 2019; ISBN 9780081025772. [Google Scholar]
- Florescu, M.; David, M. Tyrosinase-based biosensors for selective dopamine detection. Sensors 2017, 17, 1314. [Google Scholar] [CrossRef] [PubMed]
- Yue, H.Y.; Zhang, H.J.; Huang, S.; Gao, X.; Song, S.S.; Wang, Z.; Wang, W.Q.; Guan, E.H. A novel non-enzymatic dopamine sensors based on NiO-reduced graphene oxide hybrid nanosheets. J. Mater. Sci. Mater. Electron. 2019, 30, 5000–5007. [Google Scholar] [CrossRef]
- Sun, C.L.; Lee, H.H.; Yang, J.M.; Wu, C.C. The simultaneous electrochemical detection of ascorbic acid, dopamine, and uric acid using graphene/size-selected Pt nanocomposites. Biosens. Bioelectron. 2011, 26, 3450–3455. [Google Scholar] [CrossRef] [PubMed]
- Su, C.H.; Kung, C.W.; Chang, T.H.; Lu, H.C.; Ho, K.C.; Liao, Y.C. Inkjet-printed porphyrinic metal-organic framework thin films for electrocatalysis. J. Mater. Chem. A 2016, 4, 11094–11102. [Google Scholar] [CrossRef]
- Li, G. Direct laser writing of graphene electrodes. J. Appl. Phys. 2020, 127, 8725–8729. [Google Scholar] [CrossRef]
- Mizoshiri, M.; Kondo, Y. Direct writing of two- and three-dimensional Cu-based microstructures by femtosecond laser reductive sintering of the Cu2O nanospheres. Opt. Mater. Express 2019, 9, 2828. [Google Scholar] [CrossRef]
- Li, M.; Li, Y.T.; Li, D.W.; Long, Y.T. Recent developments and applications of screen-printed electrodes in environmental assays-A review. Anal. Chim. Acta 2012, 734, 31–44. [Google Scholar] [CrossRef]
- Barreca, D.; Massignan, C.; Daolio, S.; Fabrizio, M.; Piccirillo, C.; Armelao, L.; Tondello, E. Composition and microstructure of cobalt oxide thin films obtained from a novel cobalt(II) precursor by chemical vapor deposition. Chem. Mater. 2001, 13, 588–593. [Google Scholar] [CrossRef]
- Gordeychuk, D.I.; Sorokoumov, V.N.; Mikhaylov, V.N.; Panov, M.S.; Khairullina, E.M.; Melnik, M.V.; Kochemirovsky, V.A.; Balova, I.A. Copper-based nanocatalysts produced via laser-induced ex situ generation for homo- and cross-coupling reactions. Chem. Eng. Sci. 2020, 227, 115940. [Google Scholar] [CrossRef]
- Logunov, L.S.; Panov, M.S.; Myund, L.A.; Tumkin, I.I.; Khairullina, E.M.; Ryazantsev, M.N.; Balova, I.A.; Kochemirovsky, V.A. Influence of the ligand nature on the in situ laser-induced synthesis of the electrocatalytically active copper microstructures. Arab. J. Chem. 2018, 11, 624–634. [Google Scholar] [CrossRef]
- Panov, M.S.; Tumkin, I.I.; Mironov, V.S.; Khairullina, E.M.; Smikhovskaia, A.V.; Ermakov, S.S.; Kochemirovsky, V.A. Sensory properties of copper microstructures deposited from water-based solution upon laser irradiation at 532 nm. Opt. Quantum Electron. 2016, 48. [Google Scholar] [CrossRef]
- Panov, M.; Aliabev, I.; Khairullina, E.; Mironov, V.; Tumkin, I. Fabrication of nickel-gold microsensor using in situ laser-induced metal deposition technique. J. Laser Micro Nanoeng. 2019, 14, 266–269. [Google Scholar] [CrossRef]
- Panov, M.S.; Vereshchagina, O.A.; Ermakov, S.S.; Tumkin, I.I.; Khairullina, E.M.; Skripkin, M.Y.; Mereshchenko, A.S.; Ryazantsev, M.N.; Kochemirovsky, V.A. Non-enzymatic sensors based on in situ laser-induced synthesis of copper-gold and gold nano-sized microstructures. Talanta 2017, 167, 201–207. [Google Scholar] [CrossRef] [PubMed]
- S Panov, M.; M Khairullina, E.; S Vshivtcev, F.; N Ryazantsev, M.; I Tumkin, I. Laser-Induced Synthesis of Composite Materials Based on Iridium, Gold and Platinum for Non-Enzymatic Glucose Sensing. Materials 2020, 13, 3359. [Google Scholar] [CrossRef]
- Baranauskaite, V.E.; Novomlinskii, M.O.; Tumkin, I.I.; Khairullina, E.M.; Mereshchenko, A.S.; Balova, I.A.; Panov, M.S.; Kochemirovsky, V.A. In situ laser-induced synthesis of gas sensing microcomposites based on molybdenum and its oxides. Compos. Part B Eng. 2019, 157, 322–330. [Google Scholar] [CrossRef]
- Smikhovskaia, A.V.; Andrianov, V.S.; Khairullina, E.M.; Lebedev, D.V.; Ryazantsev, M.N.; Panov, M.S.; Tumkin, I.I. In situ laser-induced synthesis of copper-silver microcomposite for enzyme-free D-glucose and L-alanine sensing. Appl. Surf. Sci. 2019, 488, 531–536. [Google Scholar] [CrossRef]
- Smikhovskaia, A.V.; Panov, M.S.; Tumkin, I.I.; Khairullina, E.M.; Ermakov, S.S.; Balova, I.A.; Ryazantsev, M.N.; Kochemirovsky, V.A. In situ laser-induced codeposition of copper and different metals for fabrication of microcomposite sensor-active materials. Anal. Chim. Acta 2018, 1044, 138–146. [Google Scholar] [CrossRef]
- Singh, K.; Lou, B.S.; Her, J.L.; Pang, S.T.; Pan, T.M. Super Nernstian pH response and enzyme-free detection of glucose using sol-gel derived RuOx on PET flexible-based extended-gate field-effect transistor. Sens. Actuators B Chem. 2019, 298, 126837. [Google Scholar] [CrossRef]
- Shim, J.H.; Kang, M.; Lee, Y.; Lee, C. A nanoporous ruthenium oxide framework for amperometric sensing of glucose and potentiometric sensing of pH. Microchim. Acta 2012, 177, 211–219. [Google Scholar] [CrossRef]
- Senthil Kumar, A.; Zen, J.M. Organic redox probes for the key oxidation states in mixed valence ruthenium oxide/cyanometallate (ruthenium Prussian blue analogue) catalysts. Electroanalysis 2004, 16, 1211–1220. [Google Scholar] [CrossRef]
- Kumar, A.S.; Chen, P.Y.; Chien, S.H.; Zen, J.M. Development of an enzymeless/mediatorless glucose sensor using ruthenium oxide-Prussian blue combinative analogue. Electroanalysis 2005, 17, 210–222. [Google Scholar] [CrossRef]
- Ryazantsev, M.N.; Jamal, A.; Maeda, S.; Morokuma, K. Global Investigation of Potential Energy Surfaces for the Pyrolysis of C1-C3 Hydrocarbons: Towards the Development of Detailed Kinetics Models from First Principles. Phys. Chem. Chem. Phys. 2015, 17, 27789–27805. [Google Scholar] [CrossRef] [PubMed]
- Parker, D.S.N.; Dangi, B.B.; Kaiser, R.I.; Jamal, A.; Ryazantsev, M.N.; Morokuma, K. Formation of 7-Methyl-1,4-Dihydronaphthalene in the Reaction of the Para-Tolyl Radical with 1,3-Butadiene under Single Collision Conditions. J. Phys. Chem. A 2014, 118, 12111–12119. [Google Scholar] [CrossRef] [PubMed]
- Anjalidevi, C.; Dharuman, V.; Shankara Narayanan, J. Non enzymatic hydrogen peroxide detection at ruthenium oxide-gold nano particle-Nafion modified electrode. Sens. Actuators B Chem. 2013, 182, 256–263. [Google Scholar] [CrossRef]
- Deepika, J.; Sha, R.; Badhulika, S. A ruthenium(IV) disulfide based non-enzymatic sensor for selective and sensitive amperometric determination of dopamine. Microchim. Acta 2019, 186. [Google Scholar] [CrossRef]
- Chang, B.Y.; Park, S.M. Electrochemical impedance spectroscopy. Annu. Rev. Anal. Chem. 2010, 3, 207–229. [Google Scholar] [CrossRef]
- Stupin, D.D.; Koniakhin, S.V.; Verlov, N.A.; Dubina, M.V. Adaptive Filtering to Enhance Noise Immunity of Impedance and Admittance Spectroscopy: Comparison with Fourier Transformation. Phys. Rev. Appl. 2017, 7, 1–11. [Google Scholar] [CrossRef]
- Popkirov, G.S.; Schindler, R.N. A new impedance spectrometer for the investigation of electrochemical systems. Rev. Sci. Instrum. 1992, 63, 5366–5372. [Google Scholar] [CrossRef]
- Macdonald, J.R.; Schoonman, J.; Lehnen, A.P. The applicability and power of complex nonlinear least squares for the analysis of impedance and admittance data. J. Electroanal. Chem. 1982, 131, 77–95. [Google Scholar] [CrossRef]
- Jorcin, J.B.; Orazem, M.E.; Pébère, N.; Tribollet, B. CPE analysis by local electrochemical impedance spectroscopy. Electrochim. Acta 2006, 51, 1473–1479. [Google Scholar] [CrossRef]
- De Levie, R. The influence of surface roughness of solid electrodes on electrochemical measurements. Electrochim. Acta 1965, 10, 113–130. [Google Scholar] [CrossRef]
- Kerner, Z.; Pajkossy, T. On the origin of capacitance dispersion of rough electrodes. Electrochim. Acta 2000, 46, 207–211. [Google Scholar] [CrossRef]
- Pajkossy, T. Impedance of rough capacitive electrodes. J. Electroanal. Chem. 1994, 364, 111–125. [Google Scholar] [CrossRef]
- Rui, Z.; Huang, W.; Chen, Y.; Zhang, K.; Cao, Y.; Tu, J. Facile synthesis of graphene/polypyrrole 3D composite for a high-sensitivity non-enzymatic dopamine detection. J. Appl. Polym. Sci. 2017, 134, 6–11. [Google Scholar] [CrossRef]
- Lu, S.; Hummel, M.; Chen, K.; Zhou, Y.; Kang, S.; Gu, Z. Synthesis of Au@ZIF-8 nanocomposites for enhanced electrochemical detection of dopamine. Electrochem. Commun. 2020, 114, 106715. [Google Scholar] [CrossRef]
- Ma, L.; Zhang, Q.; Wu, C.; Zhang, Y.; Zeng, L. PtNi bimetallic nanoparticles loaded MoS 2 nanosheets: Preparation and electrochemical sensing application for the detection of dopamine and uric acid. Anal. Chim. Acta 2019, 1055, 17–25. [Google Scholar] [CrossRef]
- Zhang, X.; Zheng, J. Hollow carbon sphere supported Ag nanoparticles for promoting electrocatalytic performance of dopamine sensing. Sens. Actuators B Chem. 2019, 290, 648–655. [Google Scholar] [CrossRef]
- Hsieh, Y.S.; Hong, B.D.; Lee, C.L. Non-enzymatic sensing of dopamine using a glassy carbon electrode modified with a nanocomposite consisting of palladium nanocubes supported on reduced graphene oxide in a nafion matrix. Microchim. Acta 2016, 183, 905–910. [Google Scholar] [CrossRef]


| Parameter | R1, Ω | W1, S sα1 | α1 |
| Value | 4.4 × 10³ | 1.09 × 10⁻⁶ | 0.604 |
| Relative Error, % | 7 | 5 | 1 |
| Parameter | - | W0, S sα0 | α0 |
| Value | - | 4 × 10⁻¹⁰ | 1.02 |
| Relative Error, % | - | 50 | 4 |
| Parameter | R2, Ω | W2, S sα2 | α2 |
| Value | 2.7 × 10³ | 1.1 × 10⁻⁷ | 0.70 |
| Relative Error, % | 7 | 27 | 3 |
| Parameter | R1, Ω | W1, S sα1 | α1 |
| Value | 3.8 × 10³ | 1.27 × 10⁻⁶ | 0.590 |
| Relative Error, % | 6 | 6 | 1 |
| Parameter | - | W0, S sα0 | α0 |
| Value | - | 6 × 10⁻¹⁰ | 0.99 |
| Relative Error, % | - | 50 | 5 |
| Parameter | R2, Ω | W2, S sα2 | α2 |
| Value | 3.1 × 10³ | 7 × 10⁻⁸ | 0.73 |
| Relative Error, % | 10 | 29 | 3 |
| Material of Electrode | Linear Range (μM) | LOD (μM) | Sensitivity (μA mM−1 cm−2) | References |
|---|---|---|---|---|
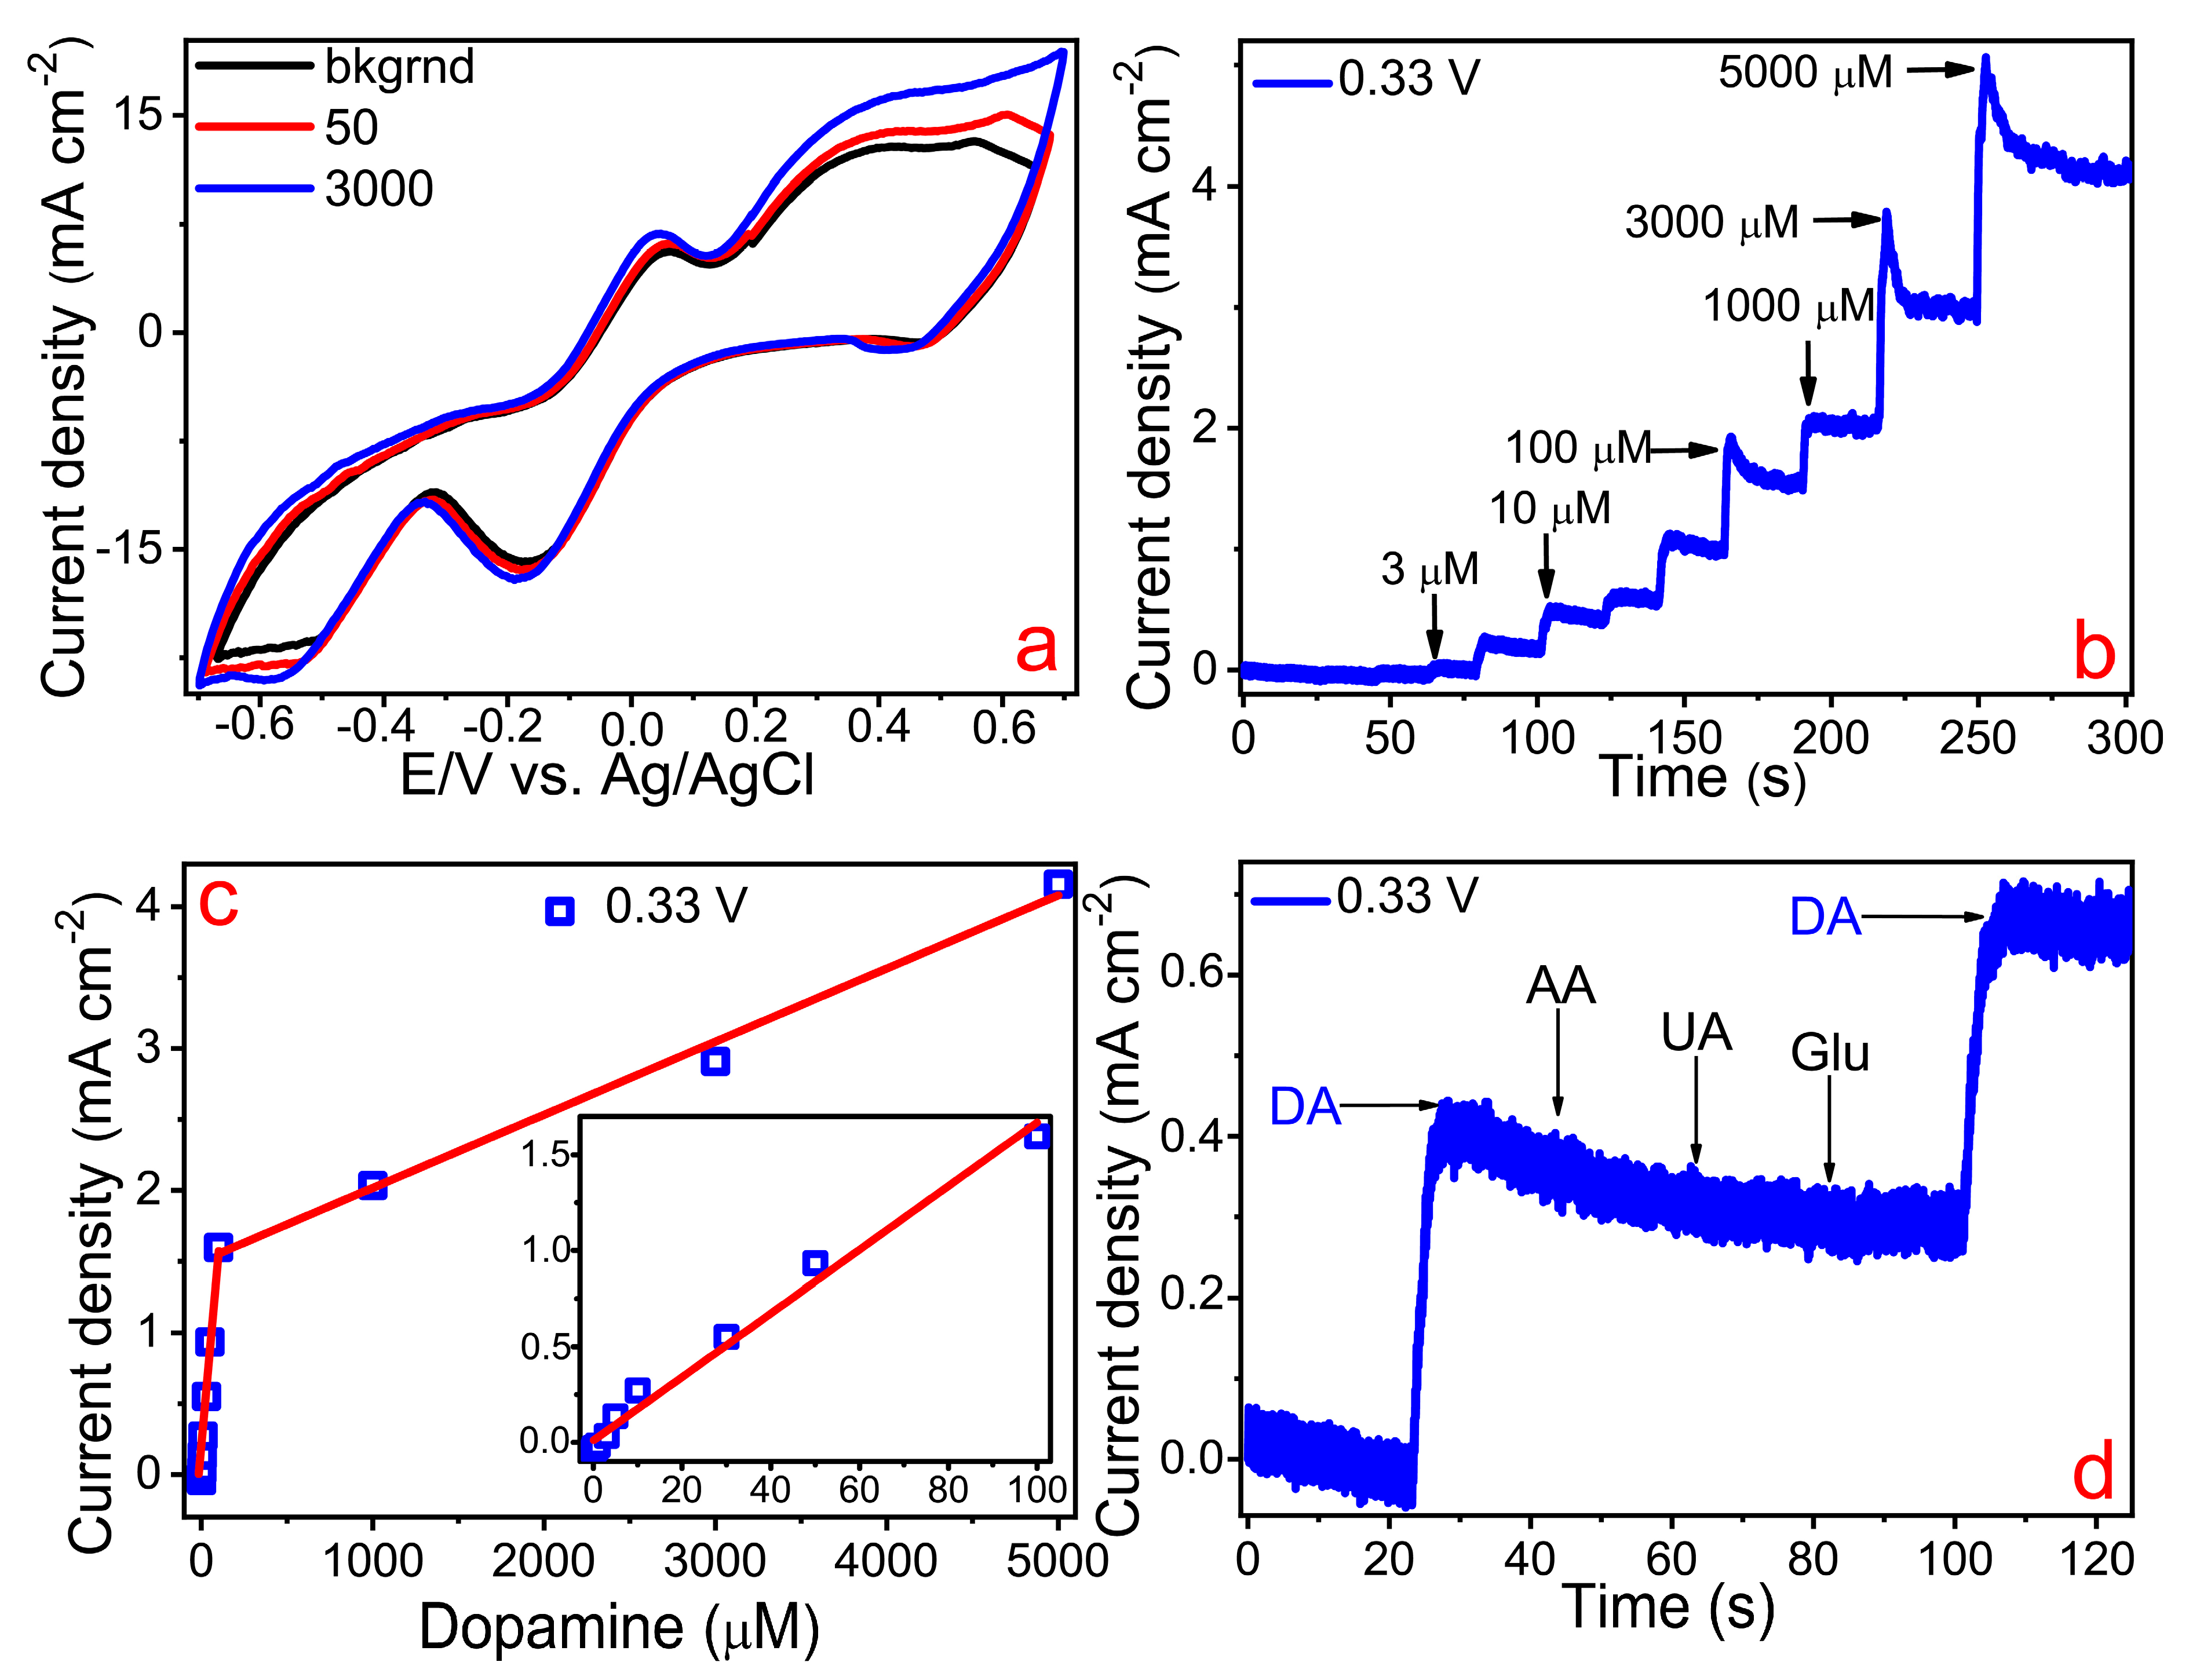
| Ru | 1–100 and 100–5000 | 0.13 and 0.15 | 858.5 and 509.1 | This work |
| PPy/graphene composite | 100–1000 | 2.3 | 363 | [45] |
| Au@ZIF-8 nanocomposite | 0.1–50 | 0.01 | 6.452 | [46] |
| RuS2 NPs | 10–80 | 0.0738 | 1800 | [36] |
| PtNi-MoS2 | 0.5–250 | 0.1 | 502 | [47] |
| Nf-Ag@HCS(hollow carbon spheres)/GCE | 3–2000 | 0.6 | 757.4 | [48] |
| Pd-NC/rGO | 20–220 | 7.02 | 0.943 | [49] |
Publisher’s Note: MDPI stays neutral with regard to jurisdictional claims in published maps and institutional affiliations. |
© 2020 by the authors. Licensee MDPI, Basel, Switzerland. This article is an open access article distributed under the terms and conditions of the Creative Commons Attribution (CC BY) license (http://creativecommons.org/licenses/by/4.0/).
Share and Cite
Panov, M.S.; Grishankina, A.E.; Stupin, D.D.; Lihachev, A.I.; Mironov, V.N.; Strashkov, D.M.; Khairullina, E.M.; Tumkin, I.I.; Ryazantsev, M.N. In Situ Laser-Induced Fabrication of a Ruthenium-Based Microelectrode for Non-Enzymatic Dopamine Sensing. Materials 2020, 13, 5385. https://doi.org/10.3390/ma13235385
Panov MS, Grishankina AE, Stupin DD, Lihachev AI, Mironov VN, Strashkov DM, Khairullina EM, Tumkin II, Ryazantsev MN. In Situ Laser-Induced Fabrication of a Ruthenium-Based Microelectrode for Non-Enzymatic Dopamine Sensing. Materials. 2020; 13(23):5385. https://doi.org/10.3390/ma13235385
Chicago/Turabian StylePanov, Maxim S., Anastasiia E. Grishankina, Daniil D. Stupin, Alexey I. Lihachev, Vladimir N. Mironov, Daniil M. Strashkov, Evgeniia M. Khairullina, Ilya I. Tumkin, and Mikhail N. Ryazantsev. 2020. "In Situ Laser-Induced Fabrication of a Ruthenium-Based Microelectrode for Non-Enzymatic Dopamine Sensing" Materials 13, no. 23: 5385. https://doi.org/10.3390/ma13235385
APA StylePanov, M. S., Grishankina, A. E., Stupin, D. D., Lihachev, A. I., Mironov, V. N., Strashkov, D. M., Khairullina, E. M., Tumkin, I. I., & Ryazantsev, M. N. (2020). In Situ Laser-Induced Fabrication of a Ruthenium-Based Microelectrode for Non-Enzymatic Dopamine Sensing. Materials, 13(23), 5385. https://doi.org/10.3390/ma13235385