Activation of Rubber-Seed Shell Waste by Malic Acid as Potential CO2 Removal: Isotherm and Kinetics Studies


Abstract
1. Introduction
2. Materials and Methods
2.1. Materials and Preparation
2.2. Activation and Carbonization
2.3. Characterization Studies
2.4. Studies on CO2 Adsorption
2.5. Kinetics Modeling Studies
3. Results and Discussion
3.1. Elemental Composition of RSS
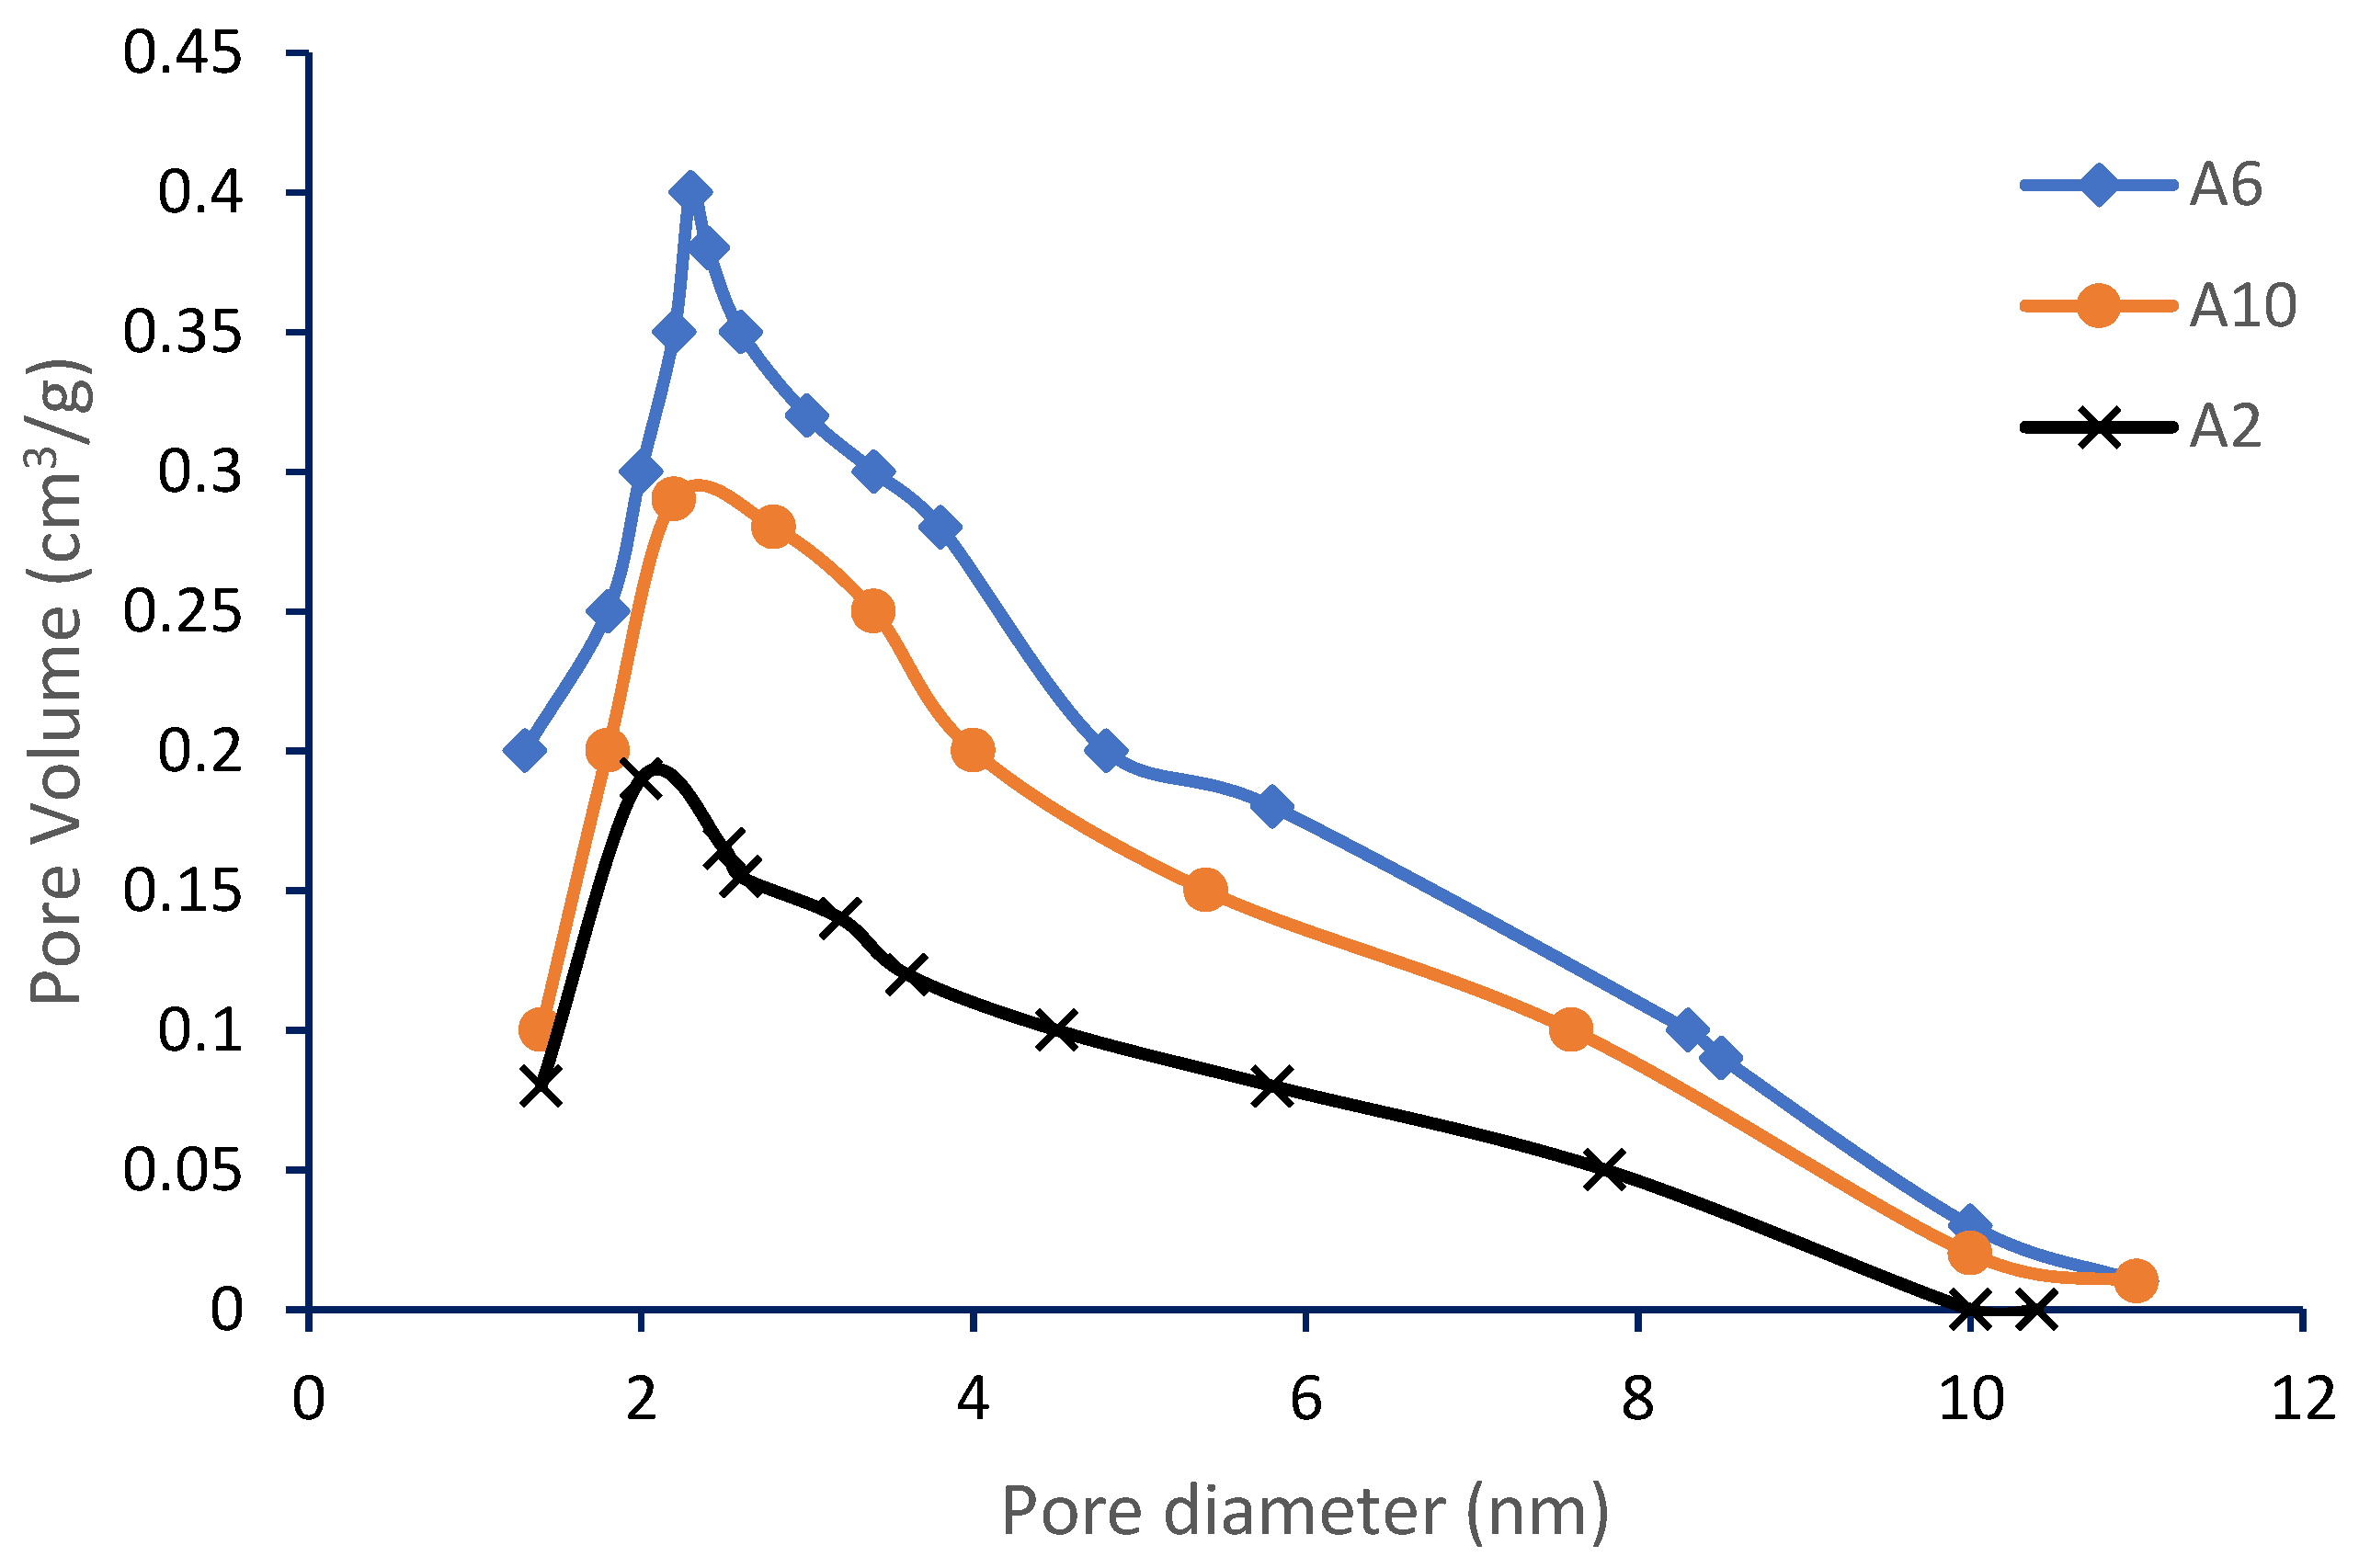
3.2. Surface and Porosity Analysis
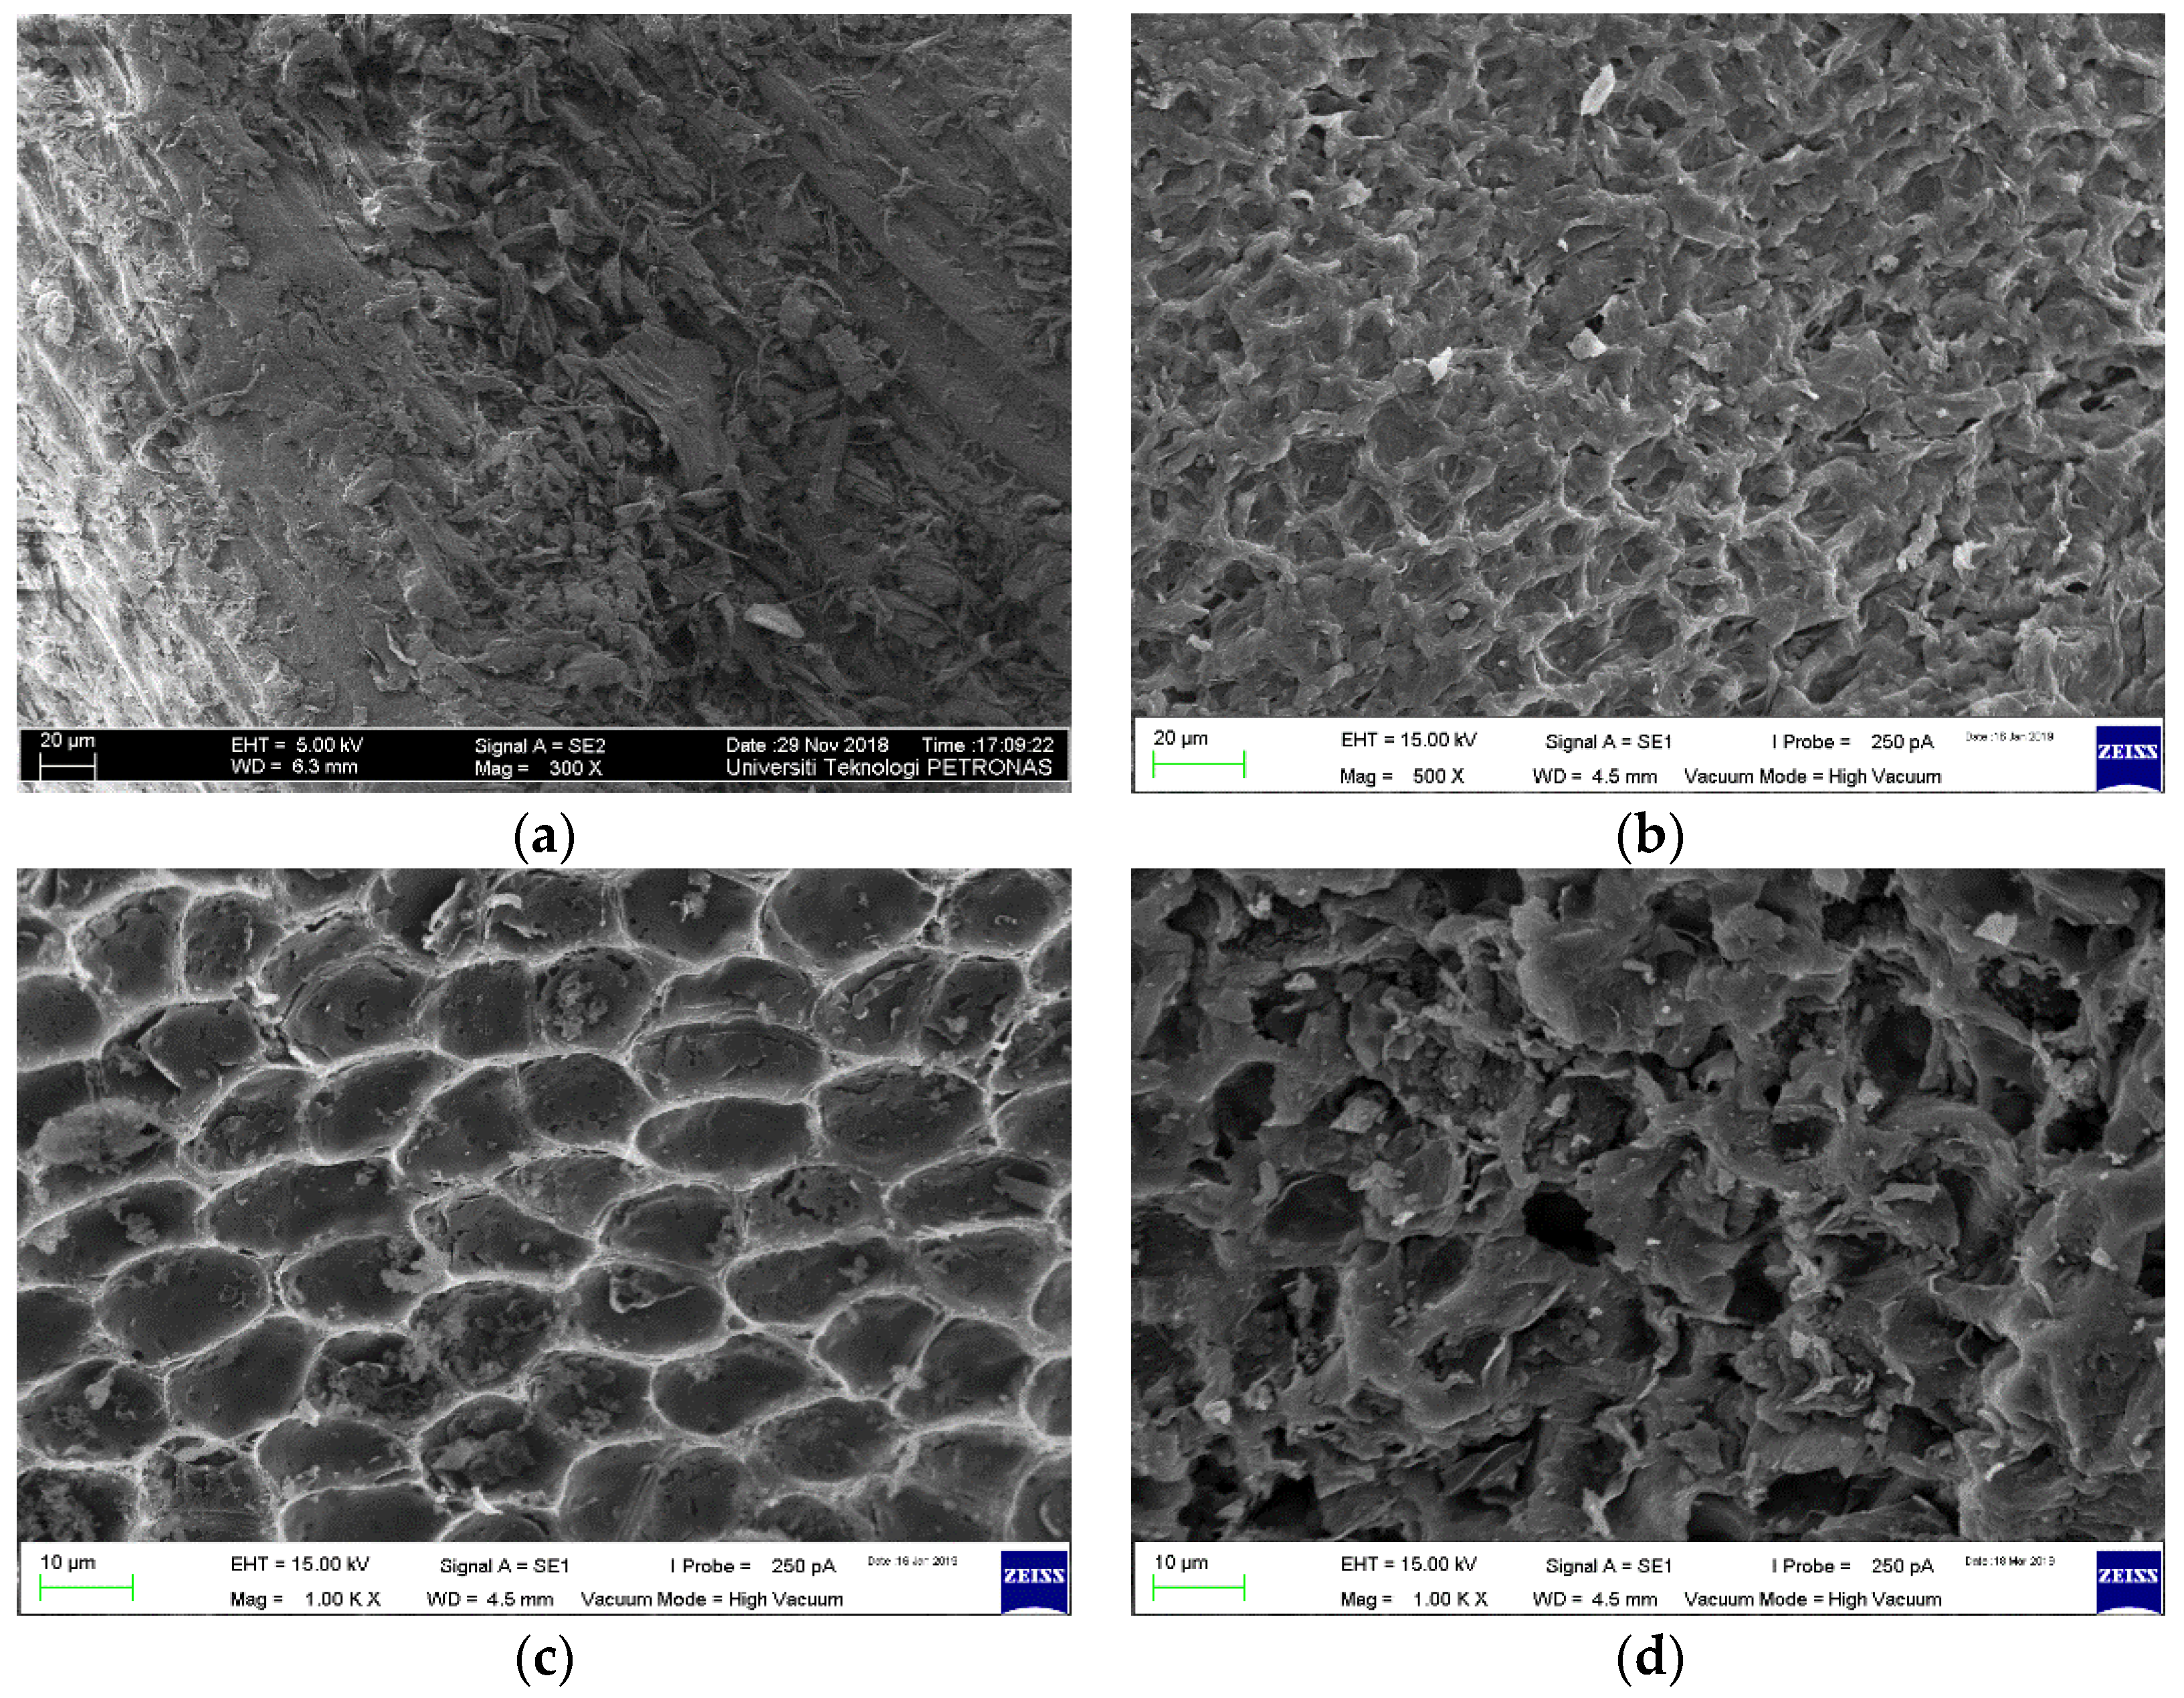
3.3. Surface Morphology
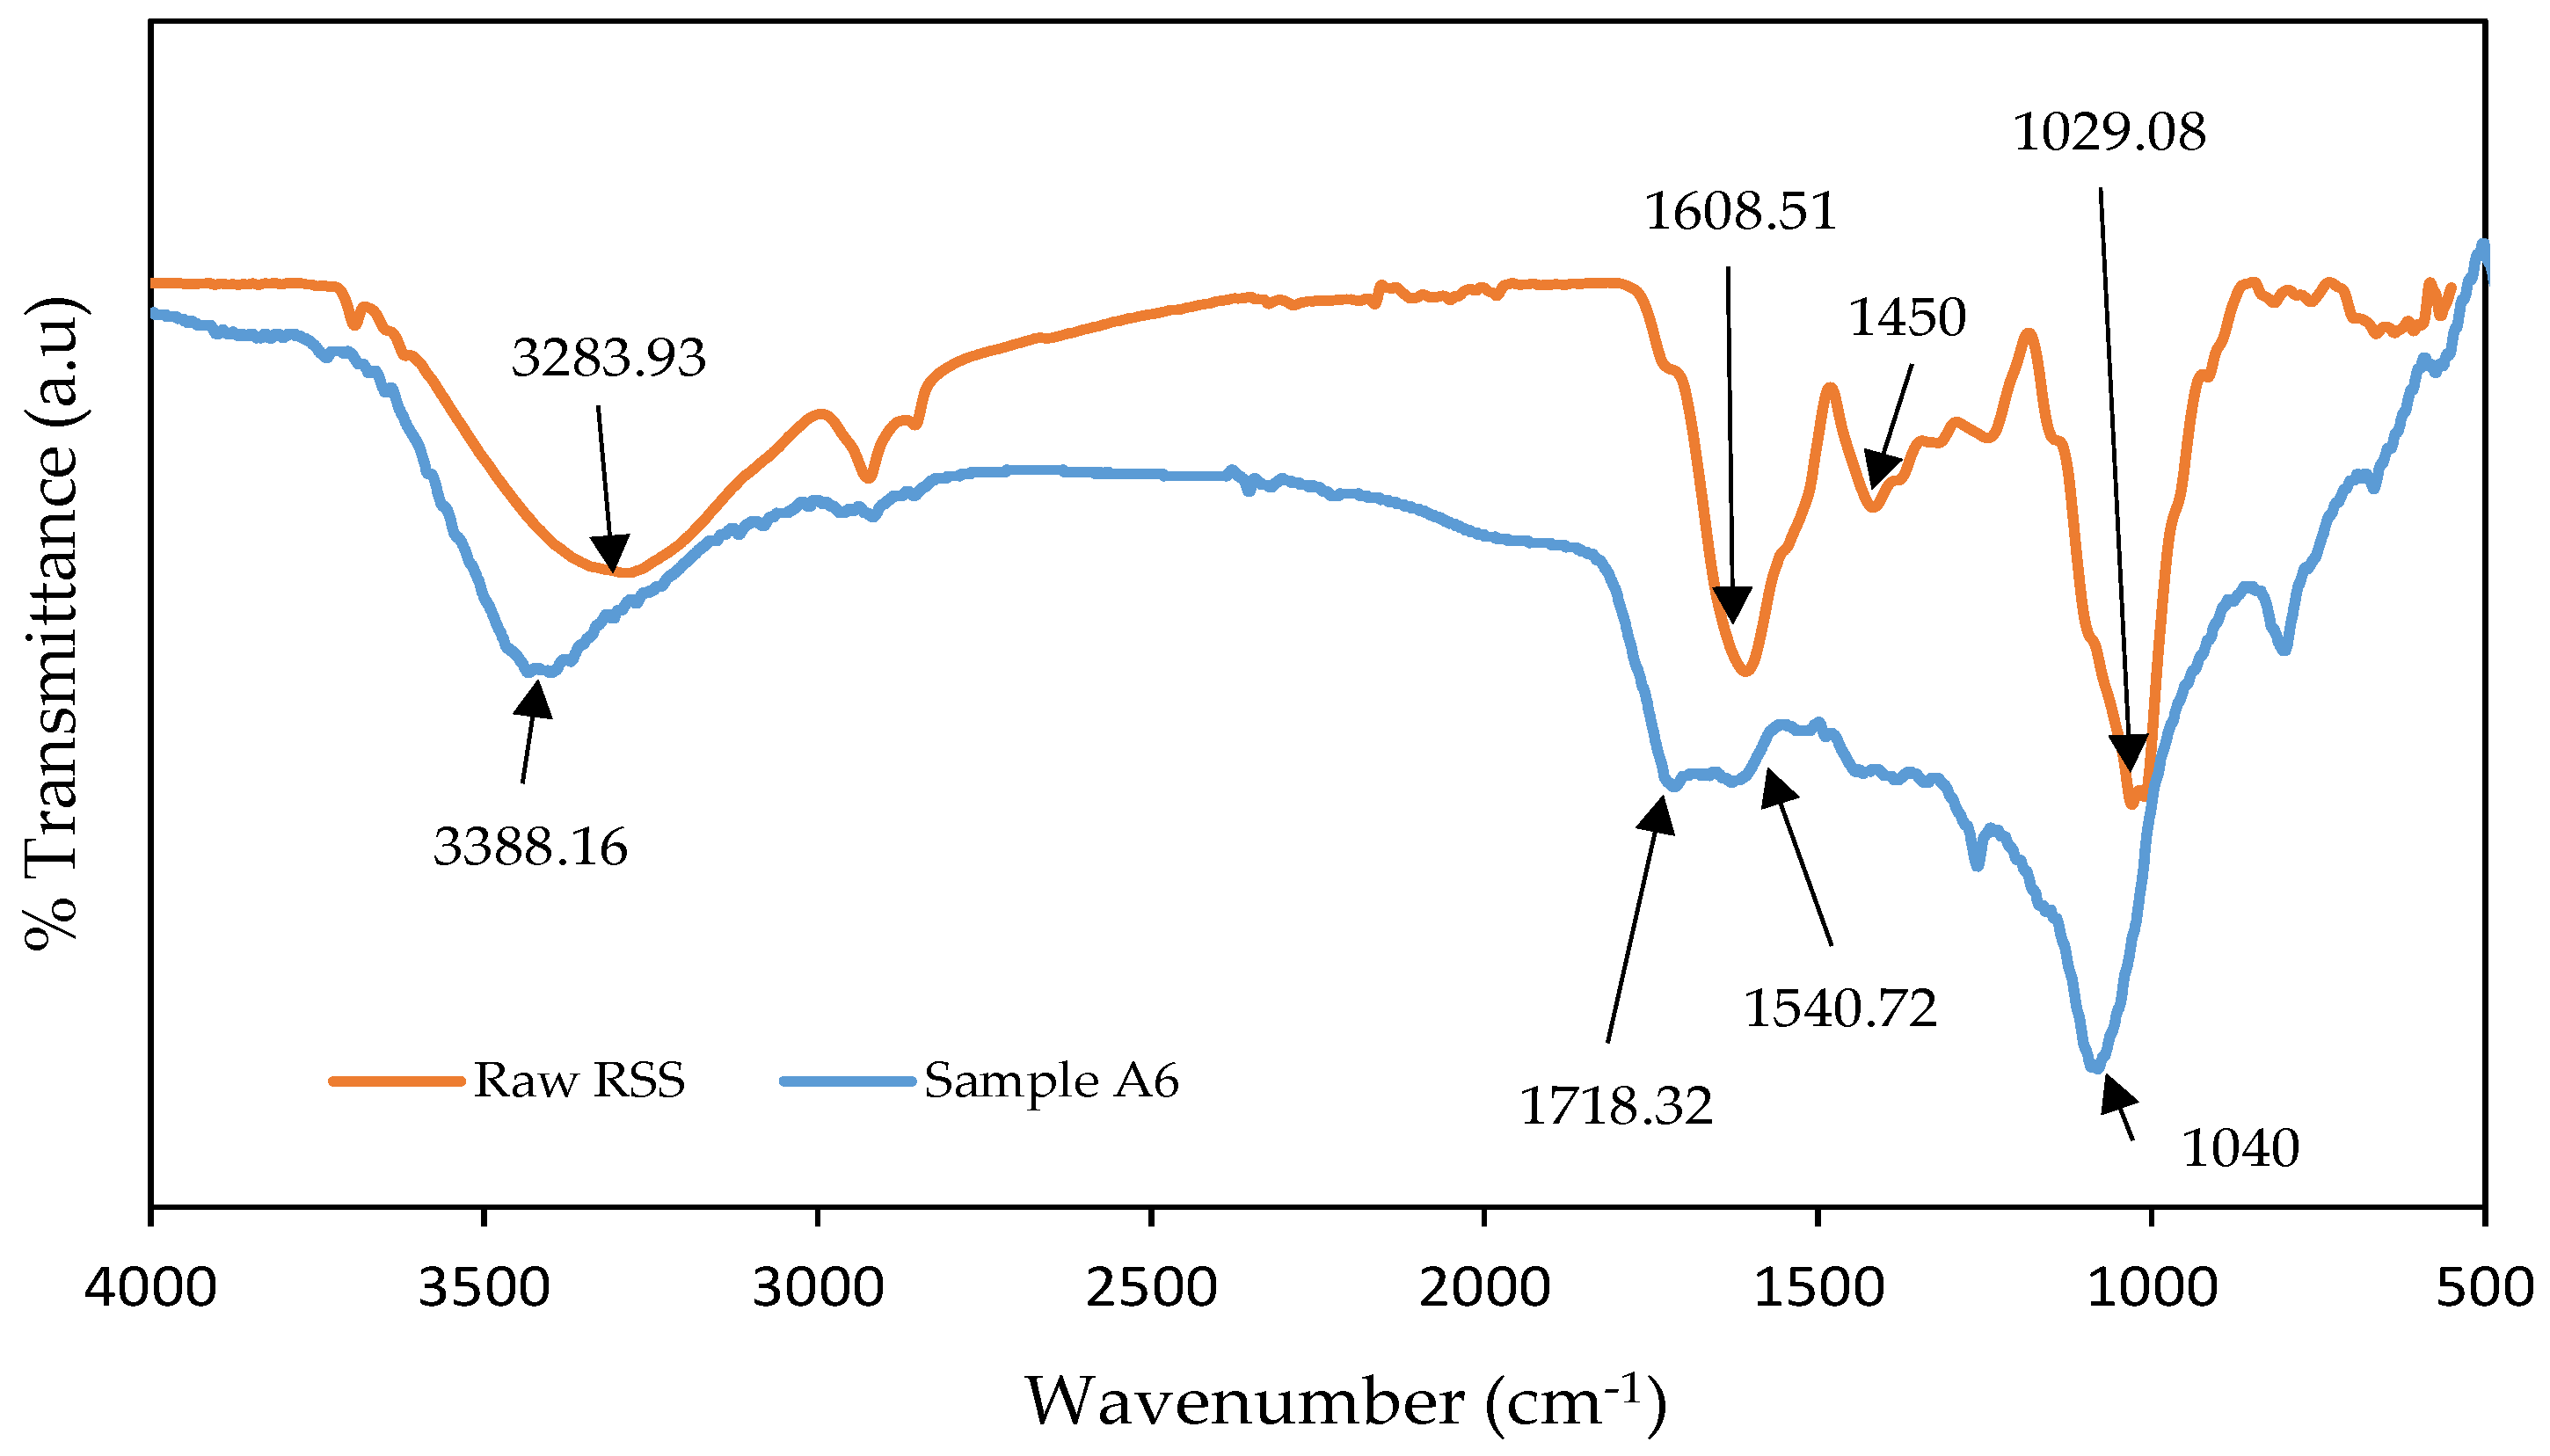
3.4. FTIR Analysis
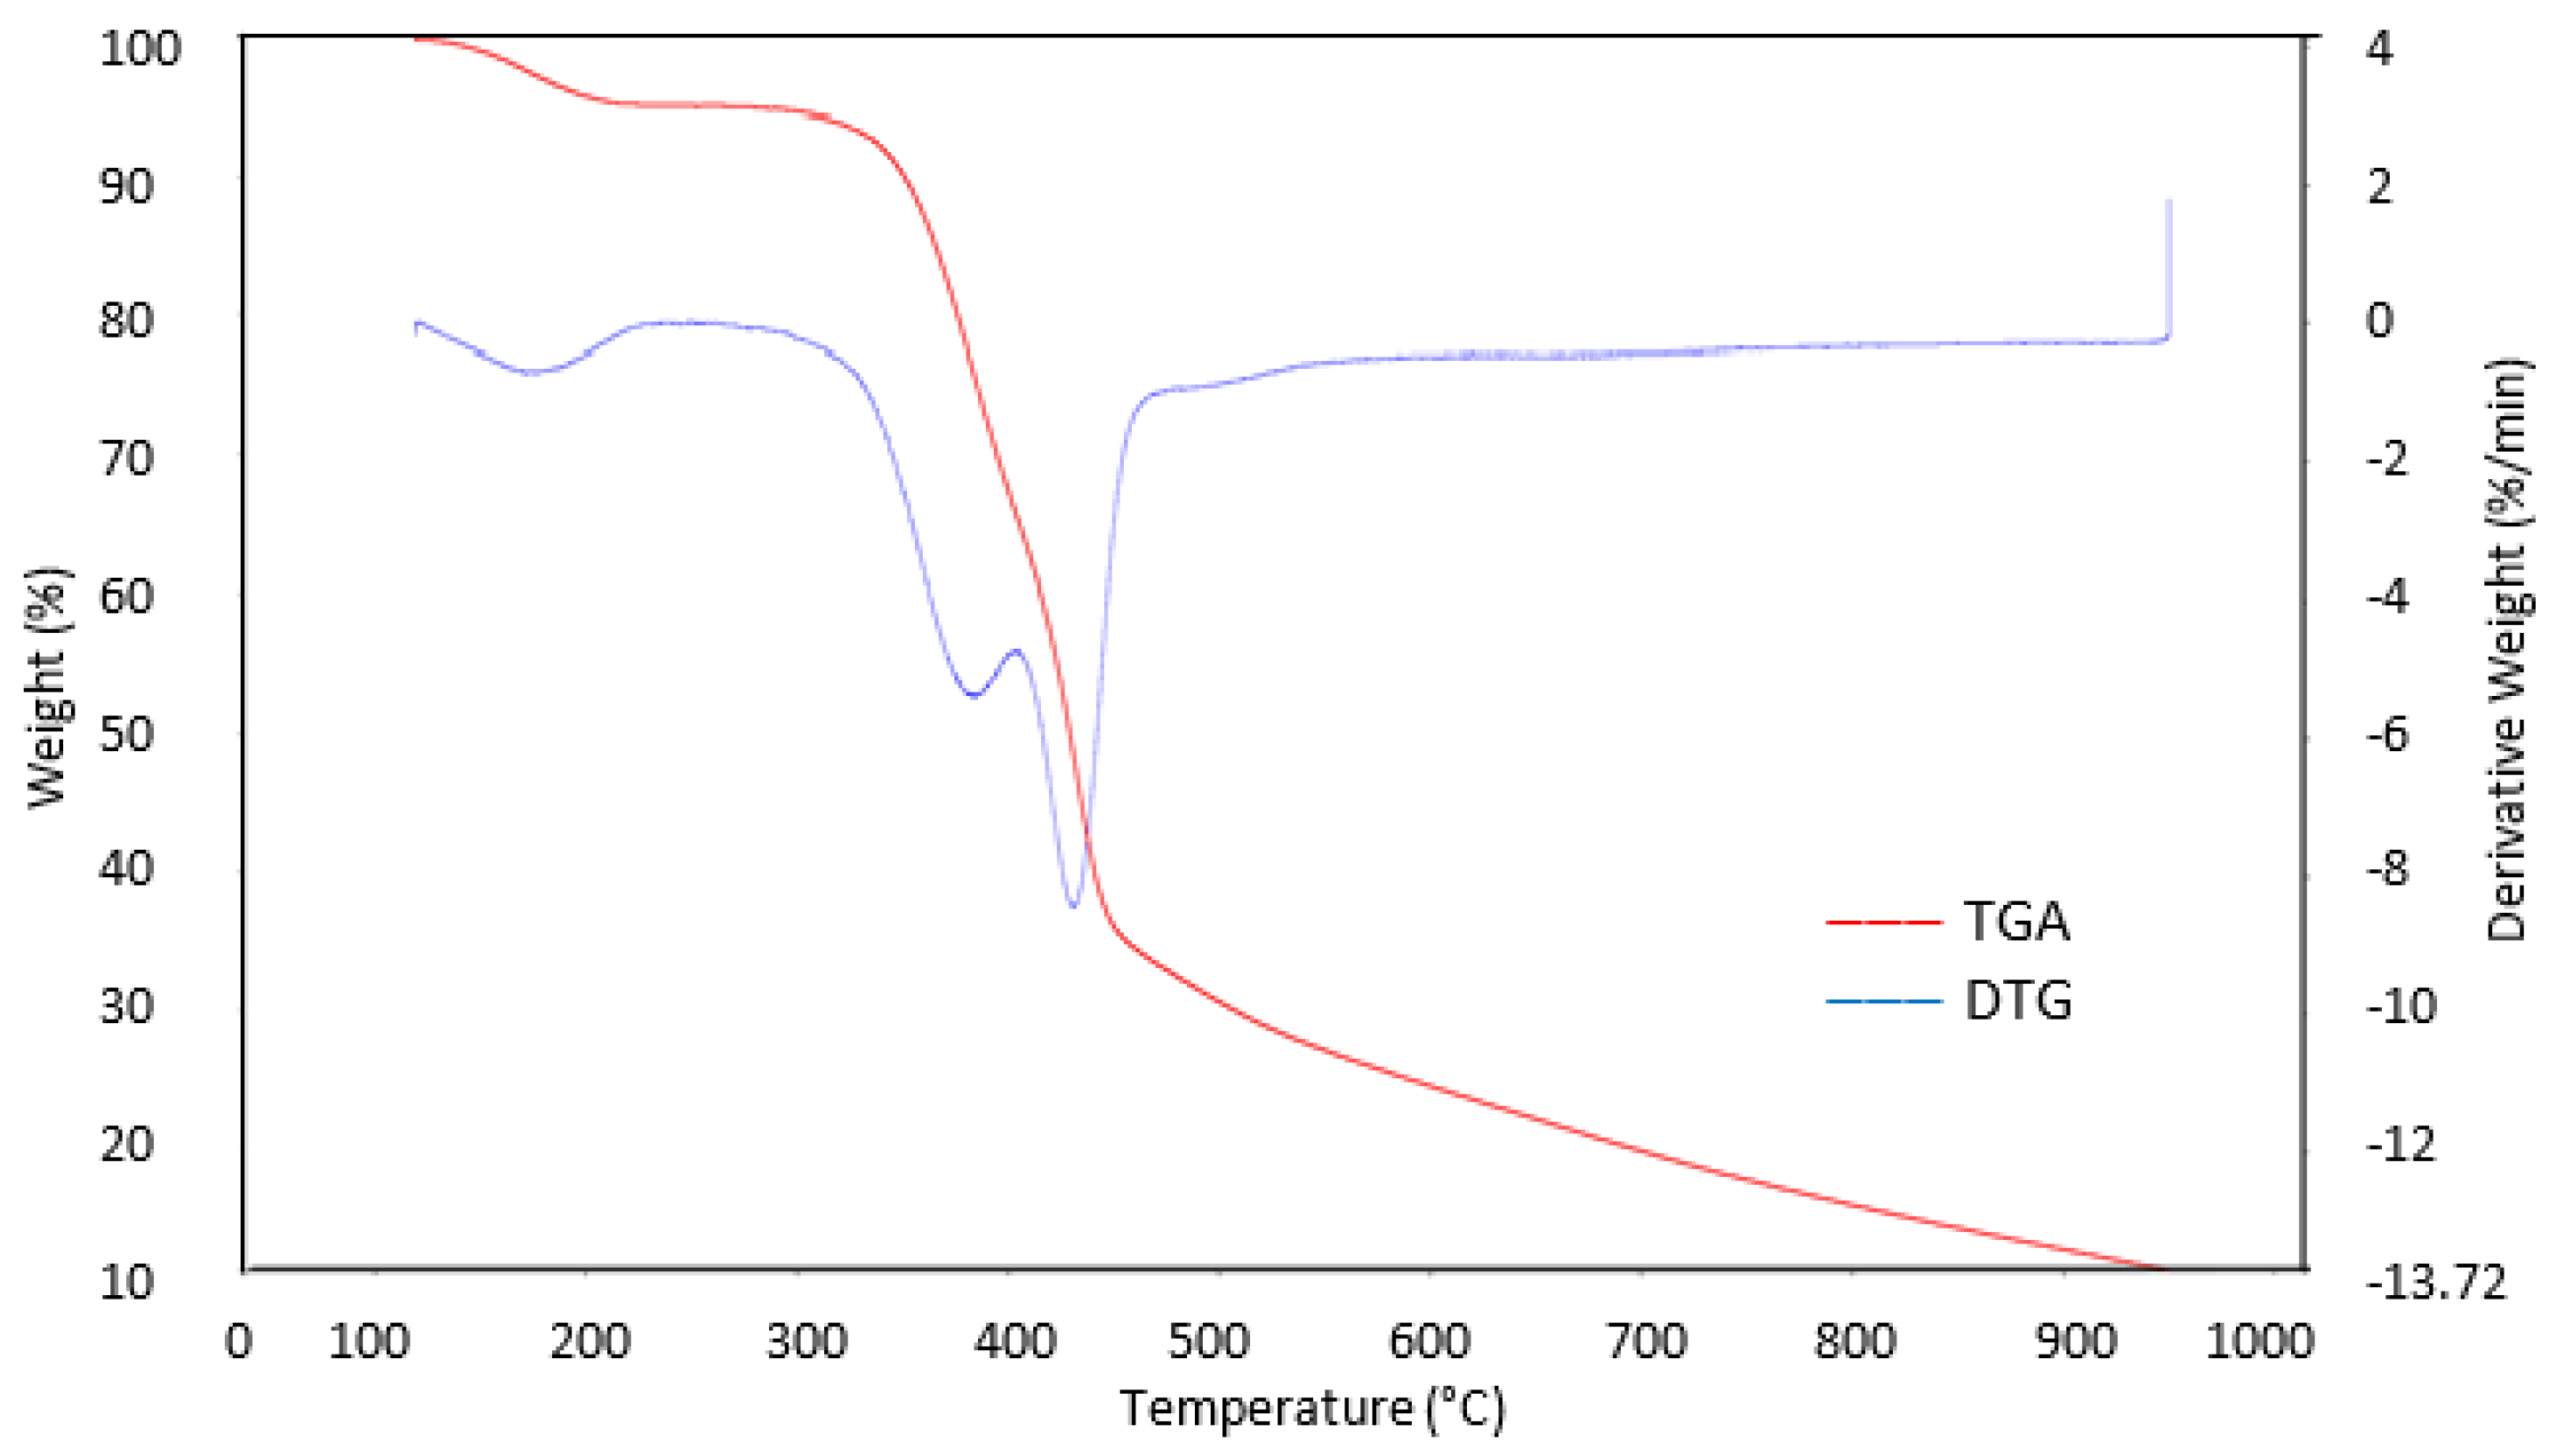
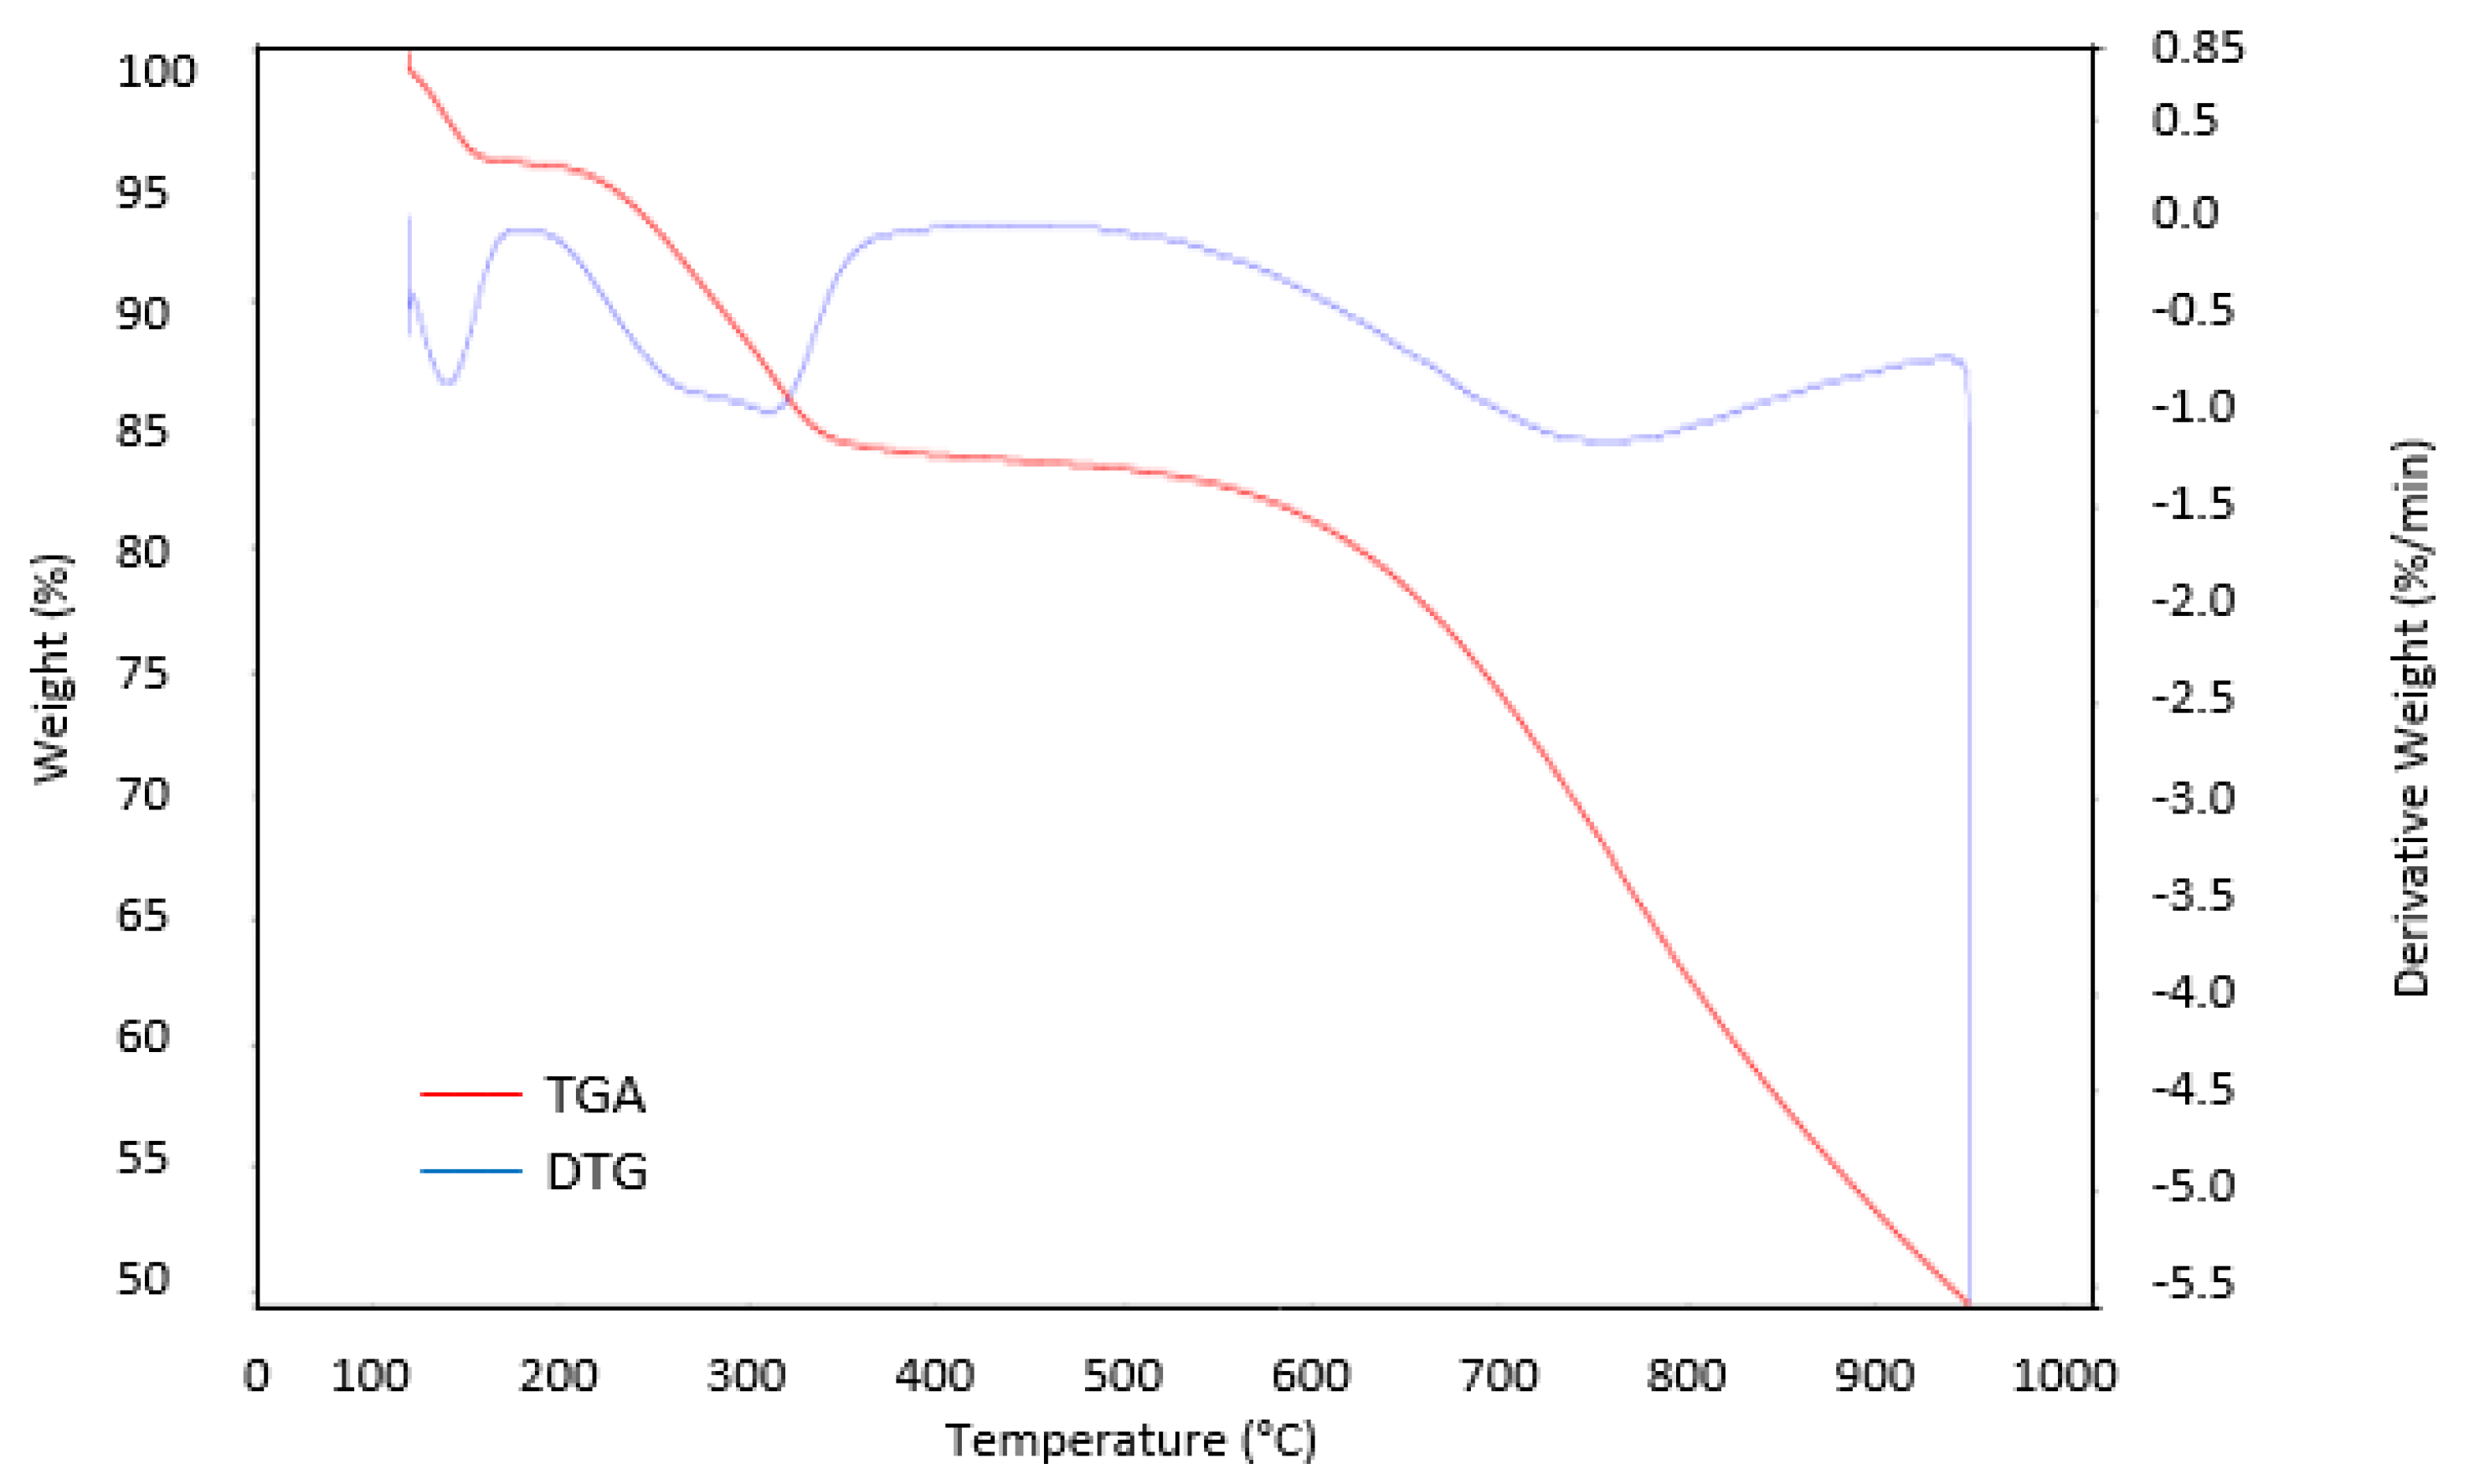
3.5. TGA Analysis
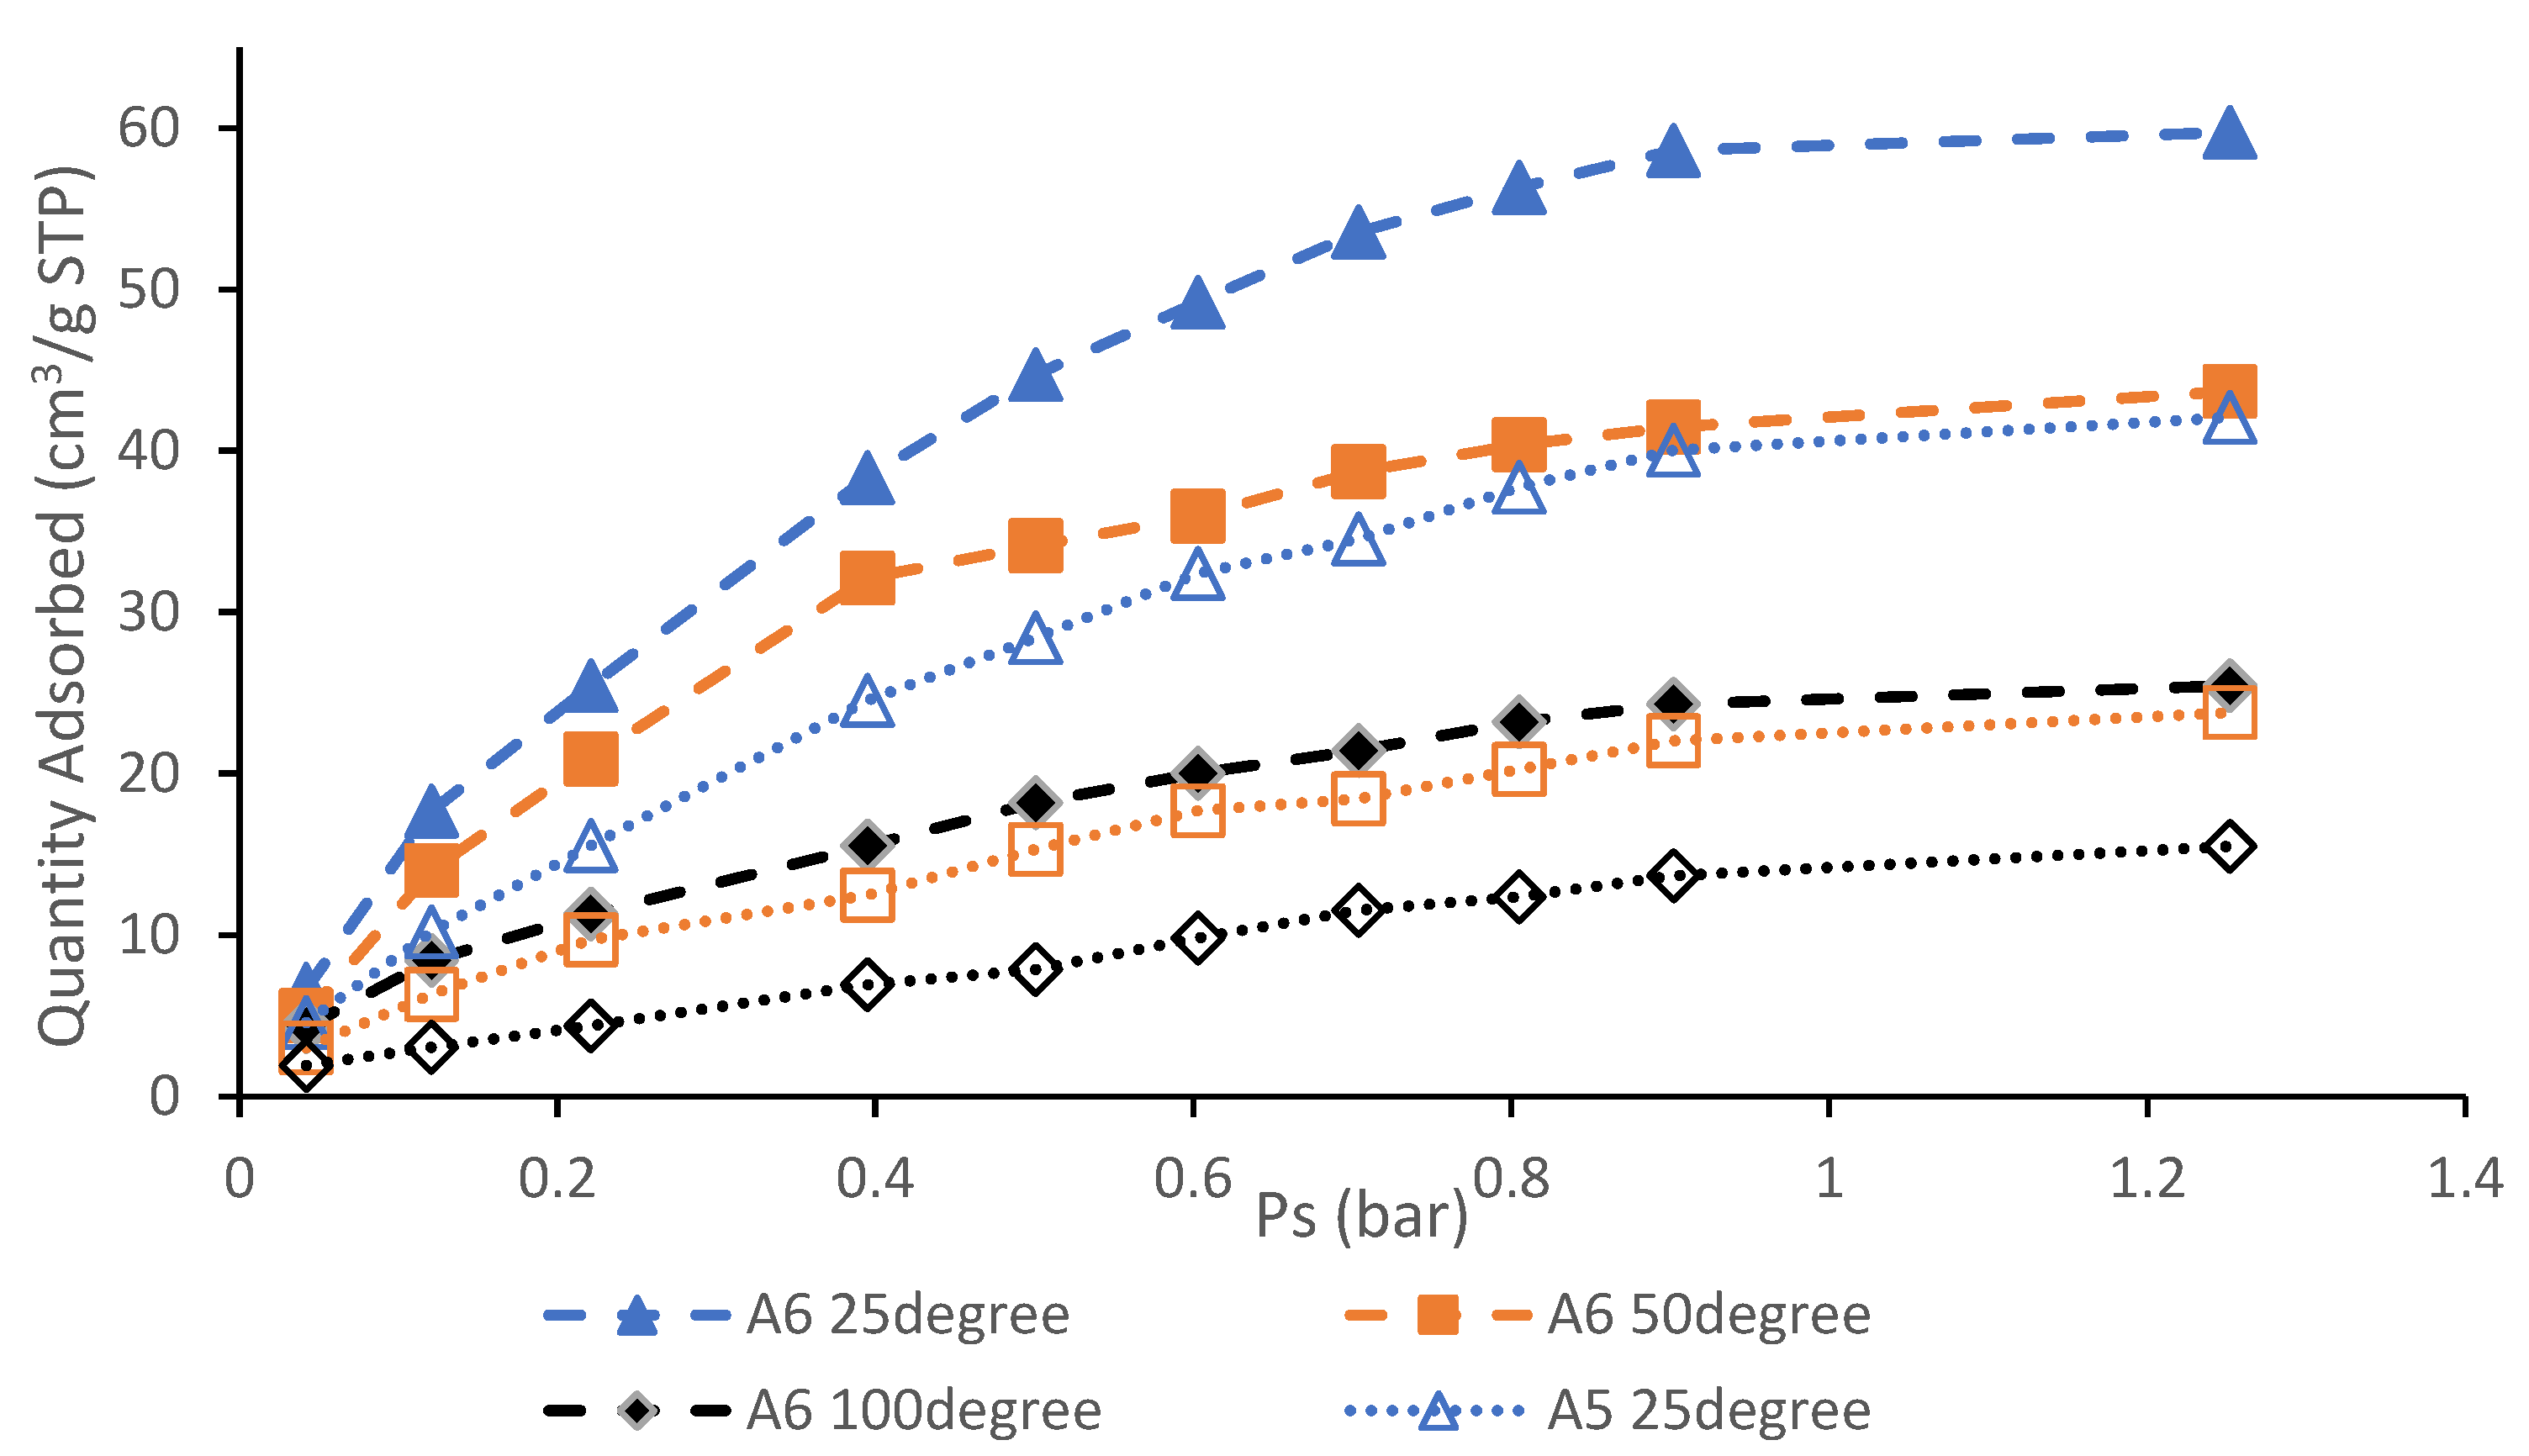
3.6. CO2 Adsorption Performance and Isotherm Studies
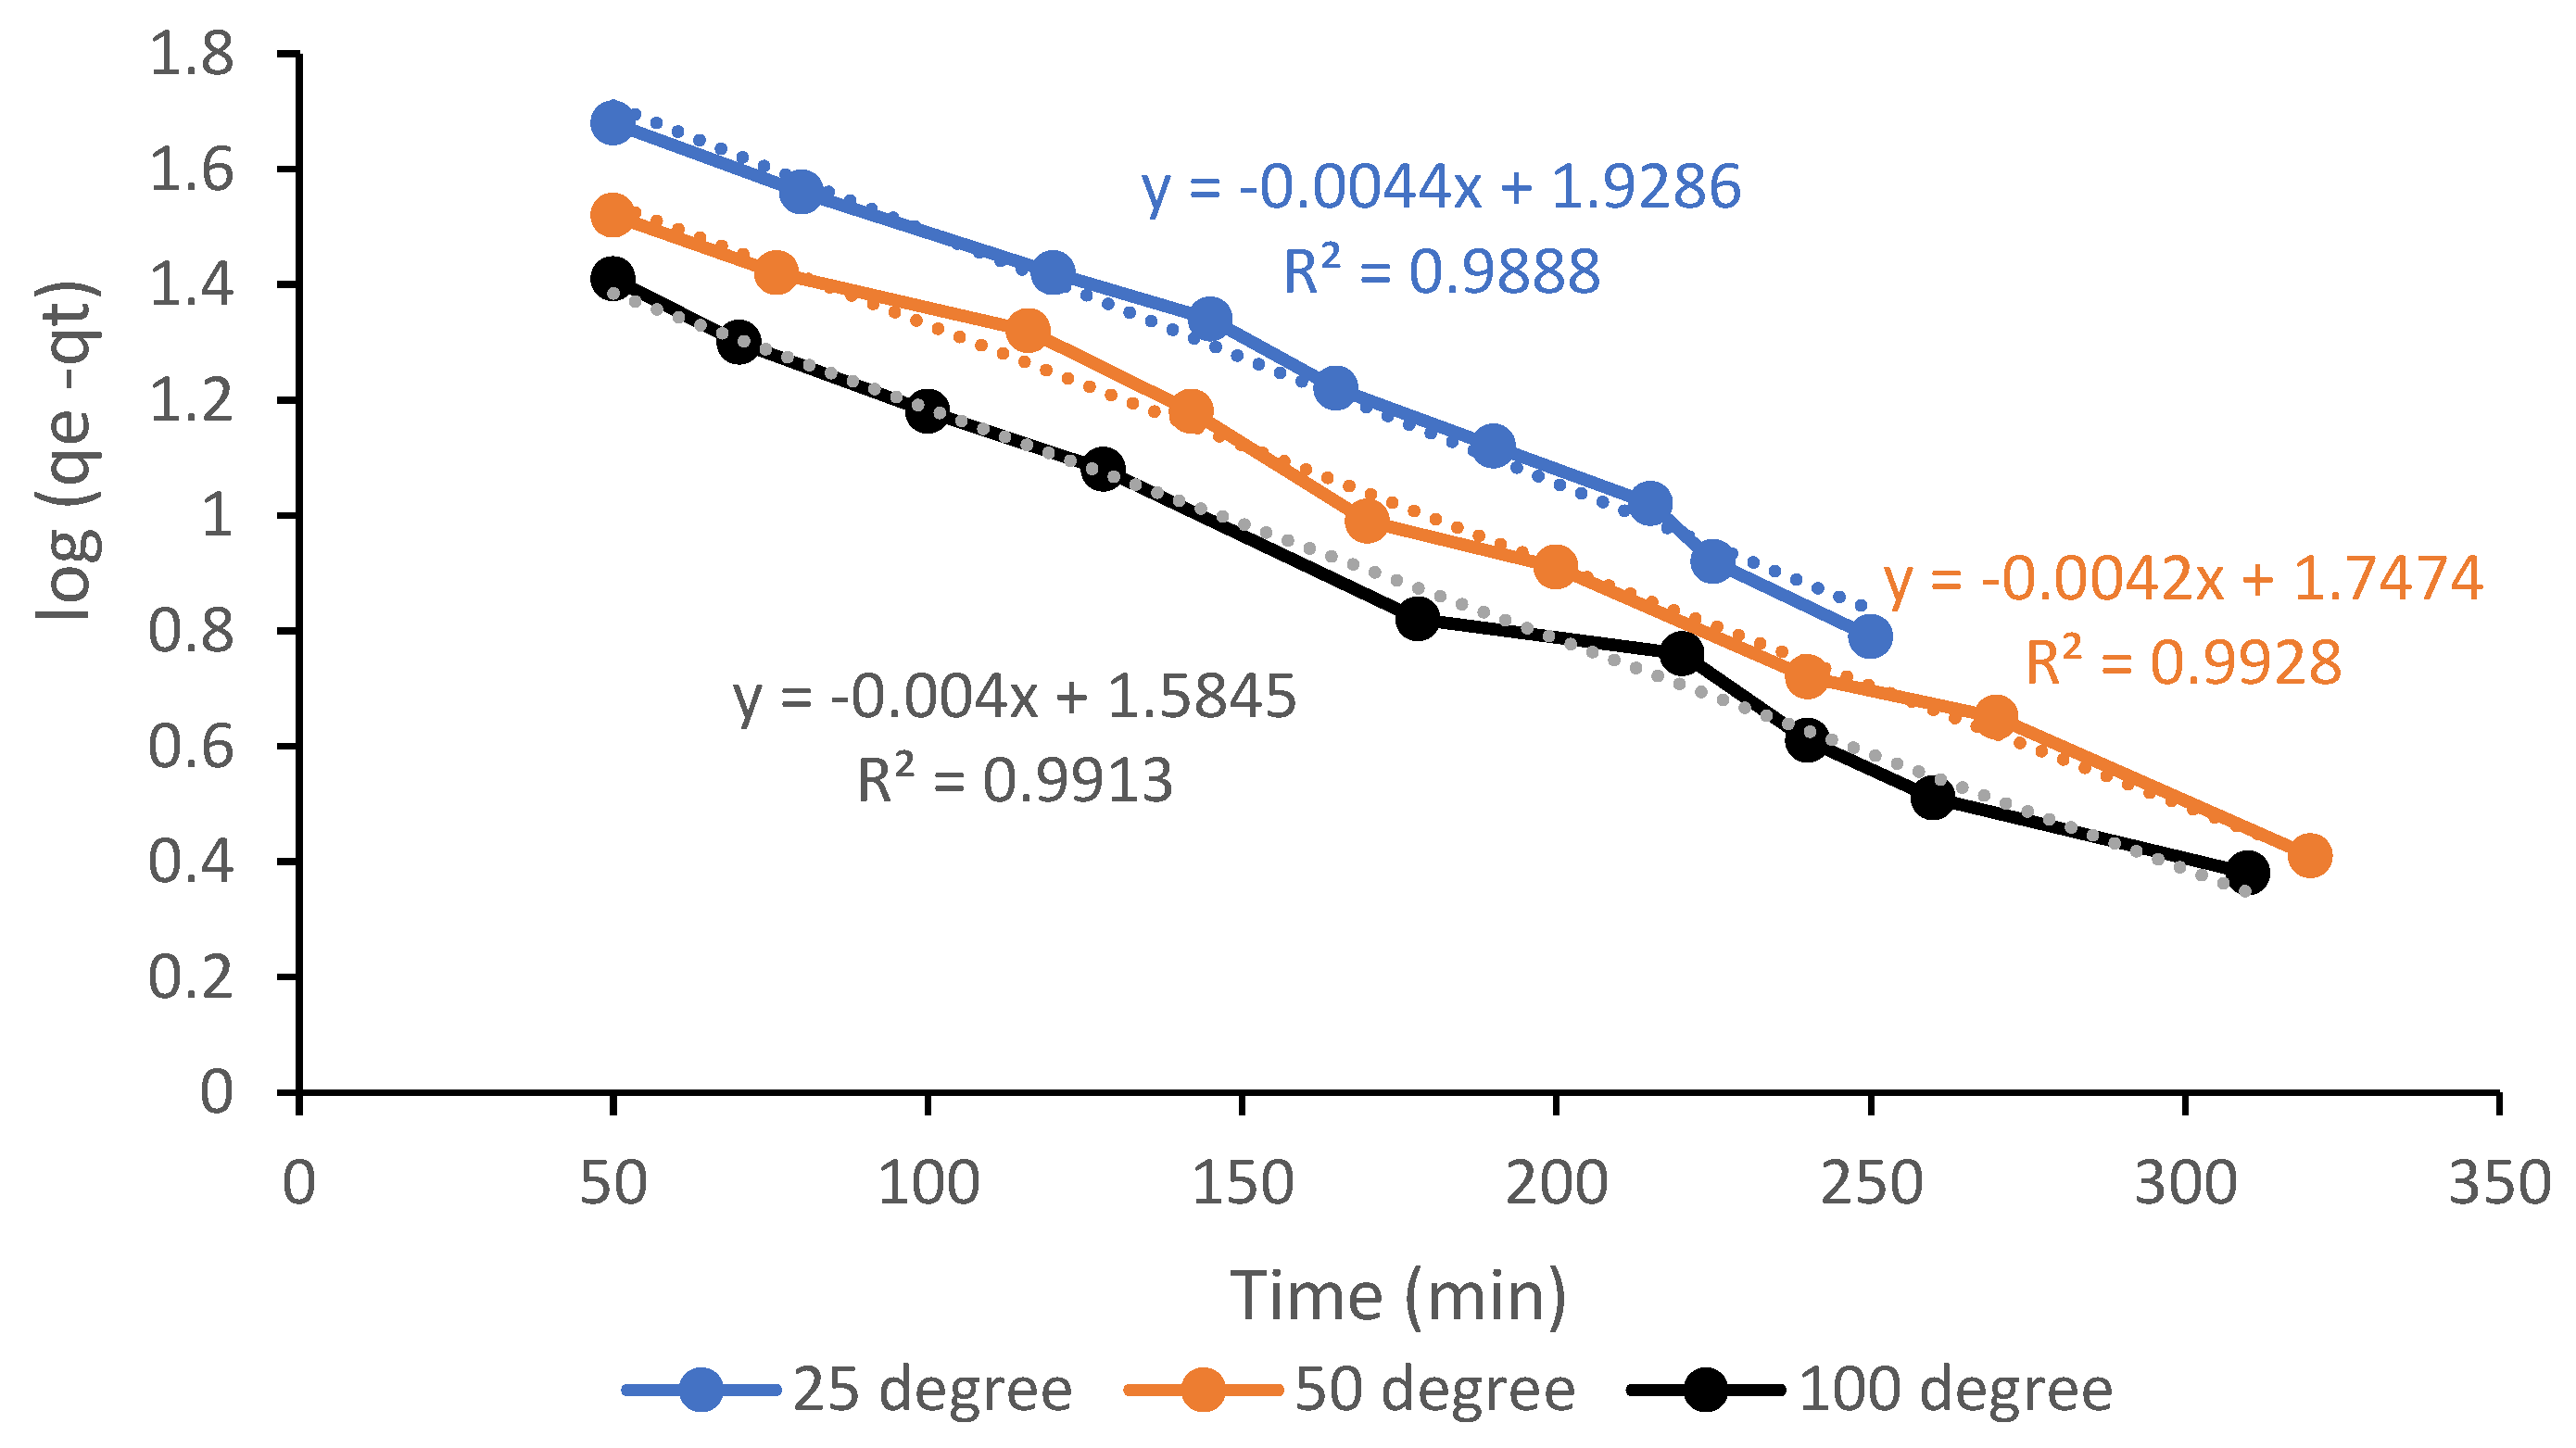
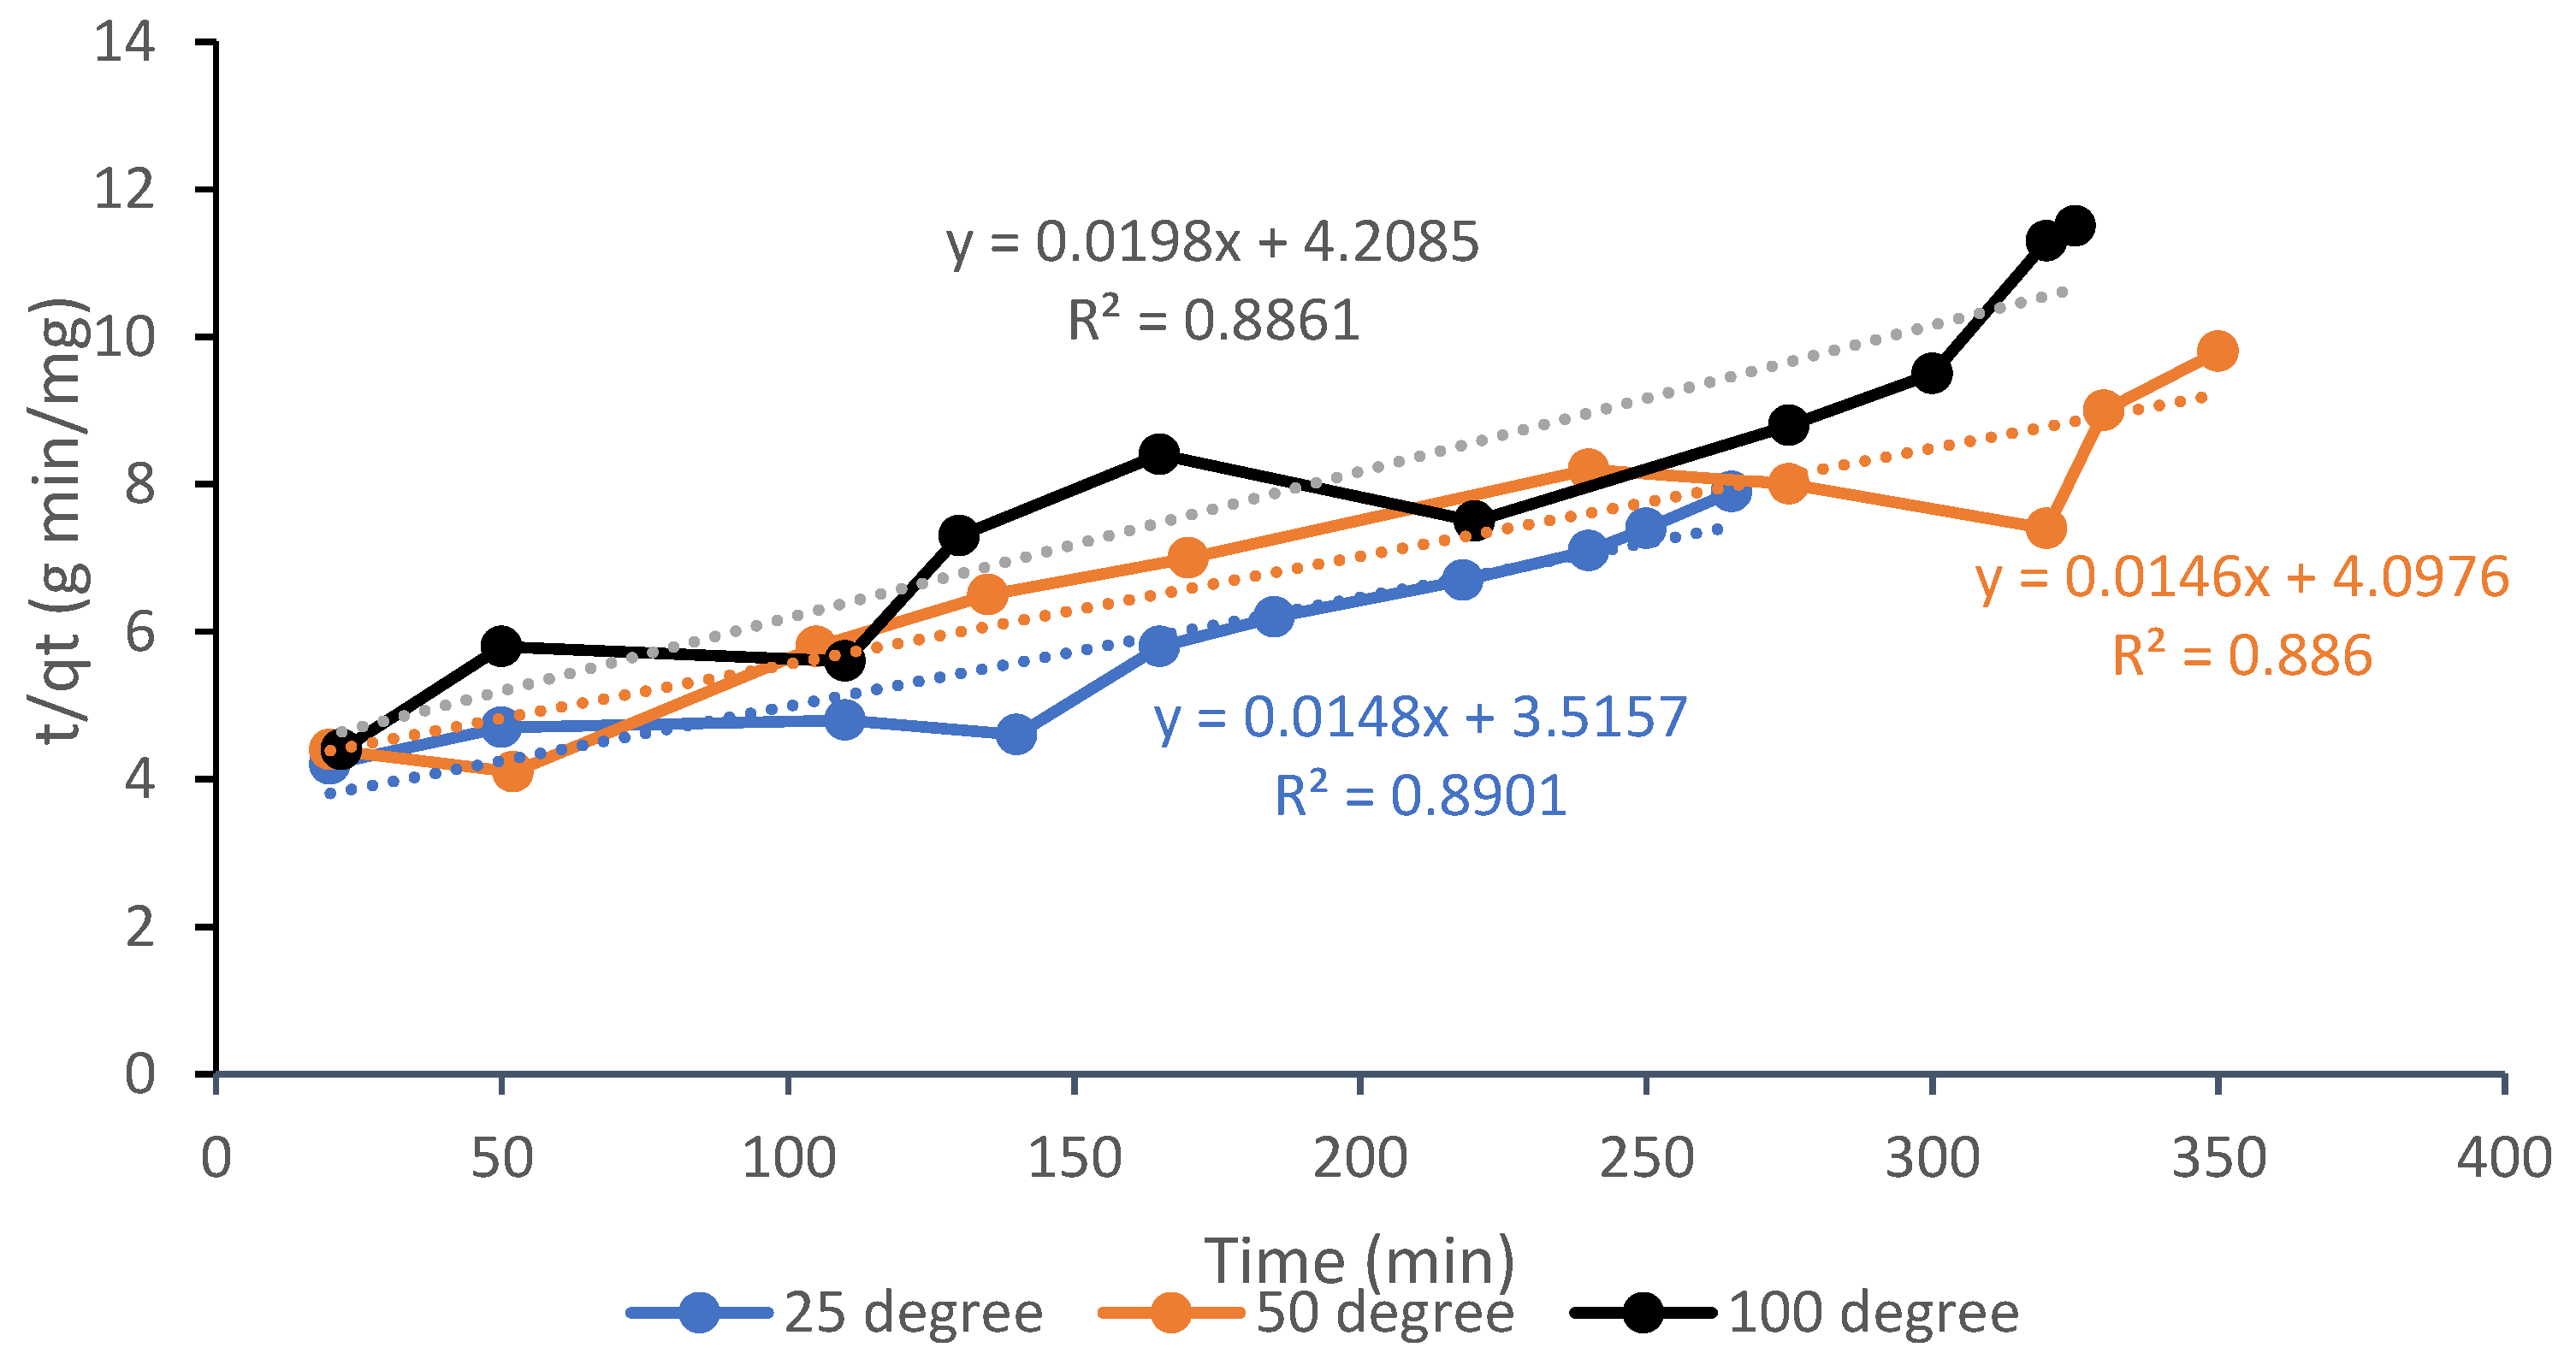
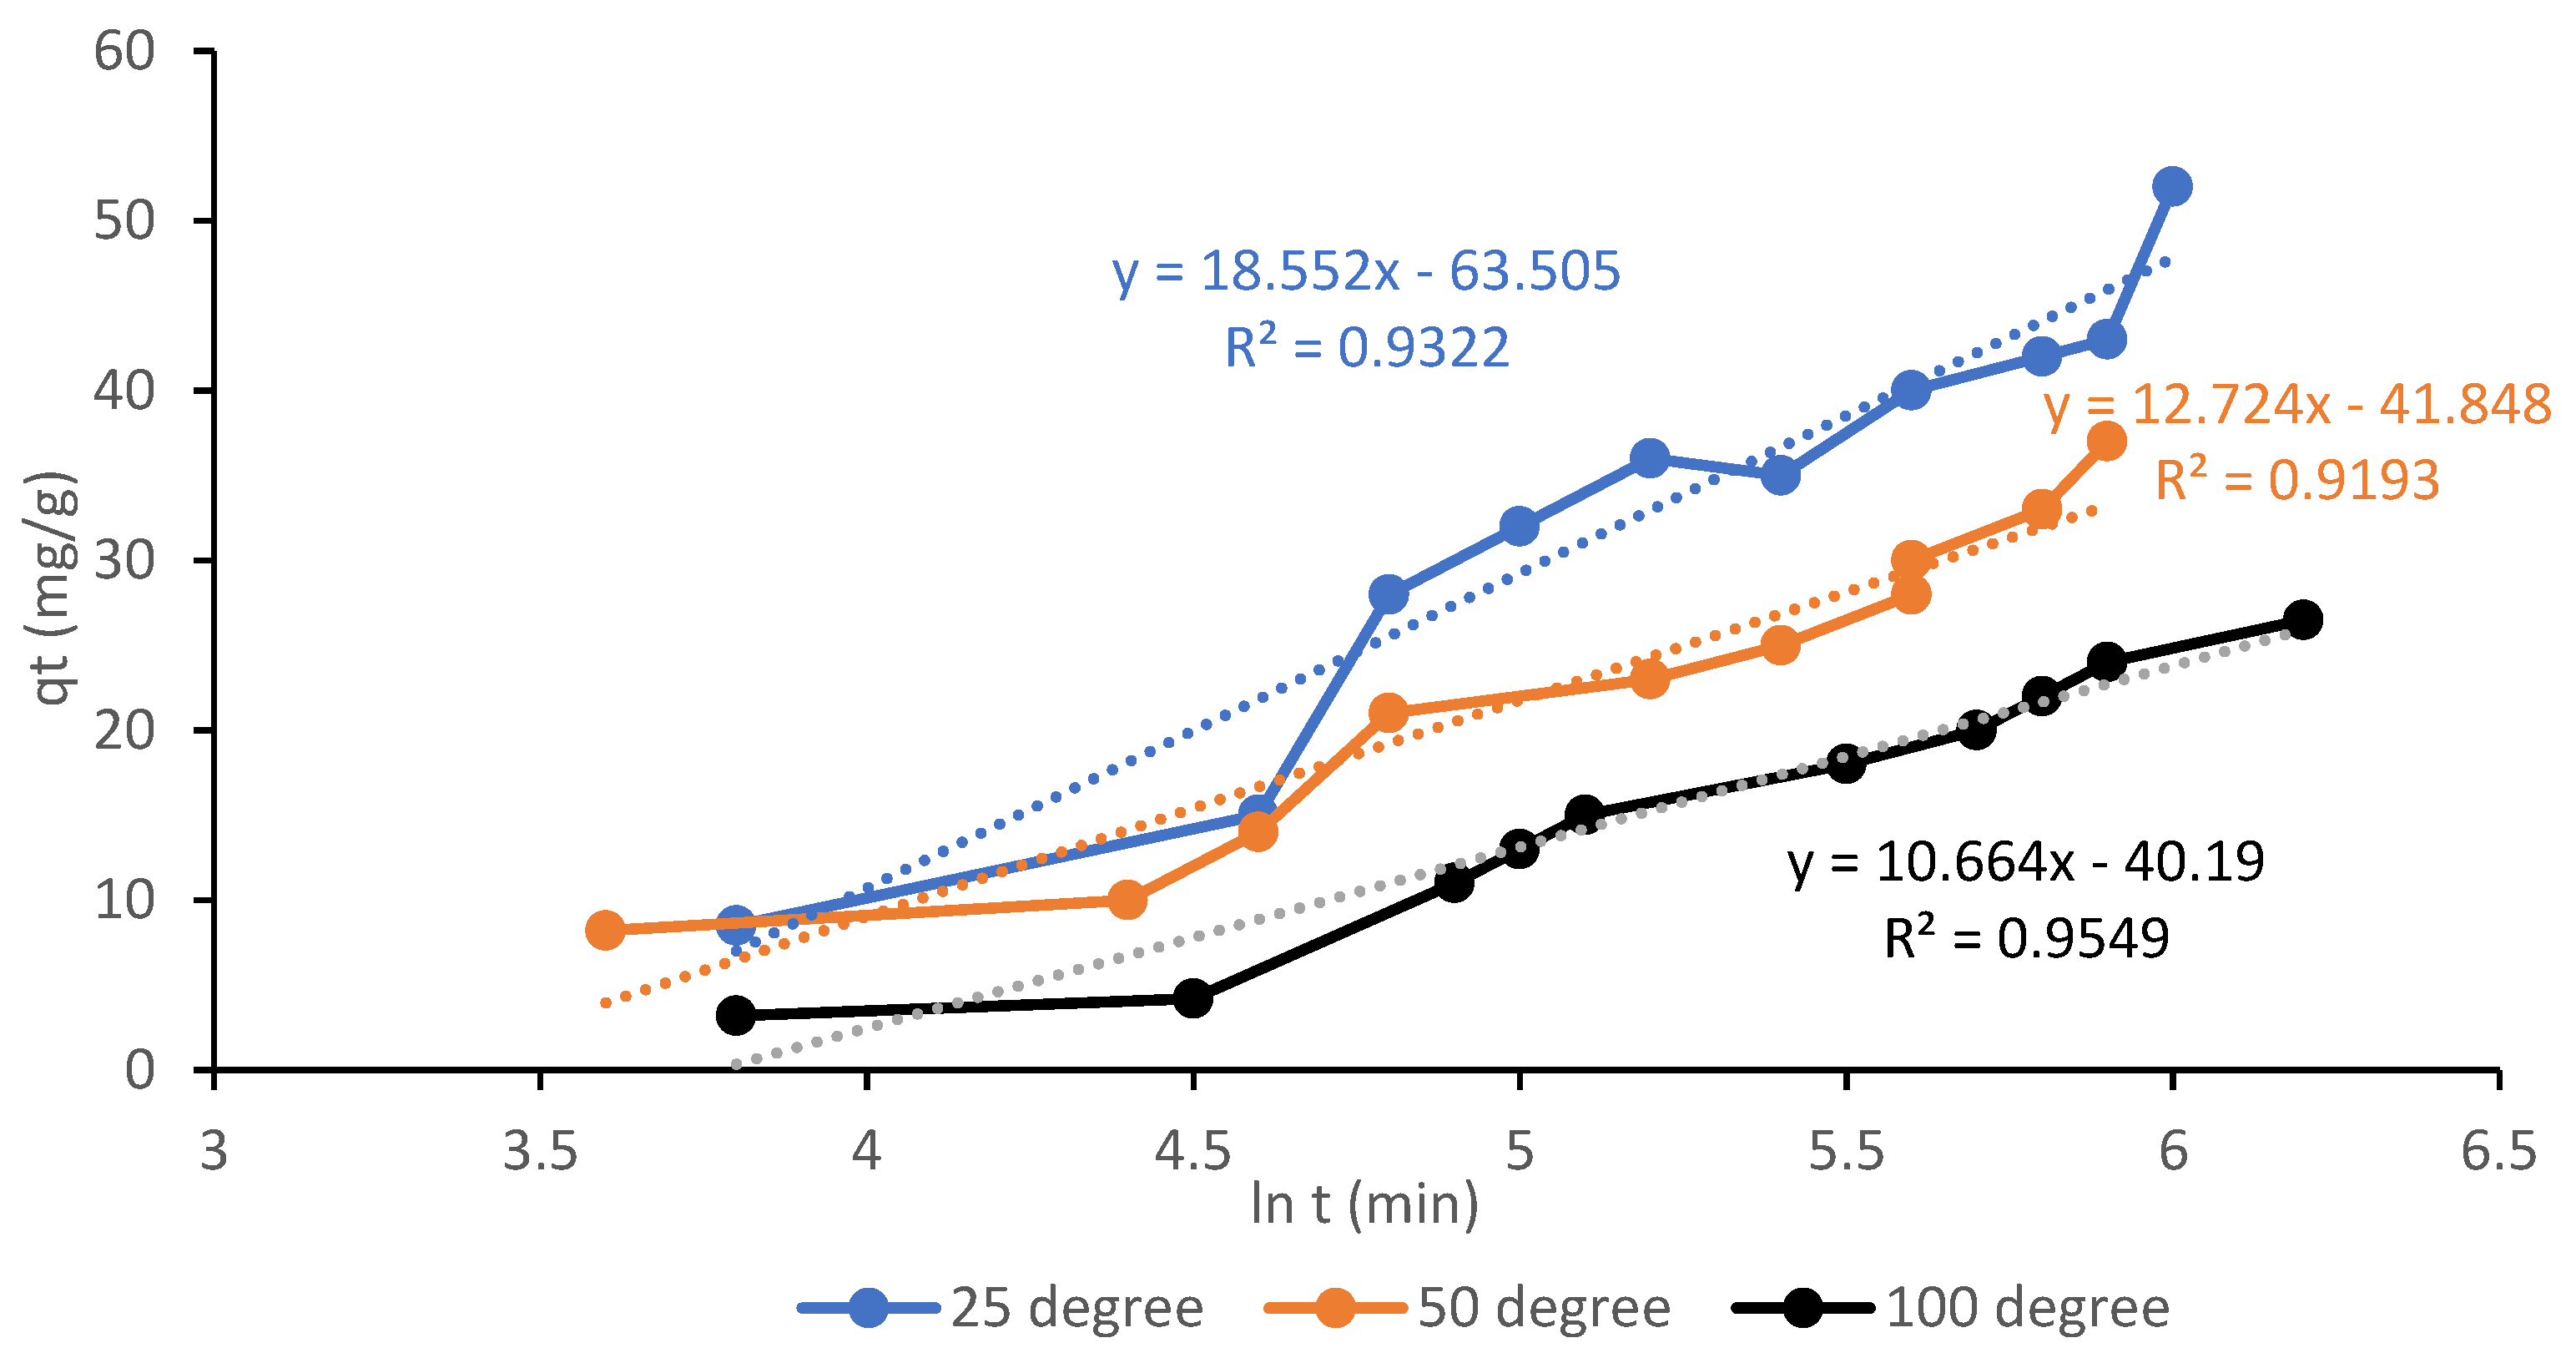
3.7. Kinetic Analysis of the CO2 Adsorption Process
3.8. Comparison Study with Other Adsorbent Materials
4. Conclusions
Author Contributions
Funding
Acknowledgments
Conflicts of Interest
References
- Guloren, T. CCS: Applications and opportunities for the oil and gas industry. Glob. CSS Inst. 2020, 1–6. Available online: https://www.globalccsinstitute.com/resources/publications-reports-research/ccs-applications-and-opportunities-for-the-oil-and-gas-industry/ (accessed on 25 September 2020).
- Berry, E.X. Human CO2 Emissions Have Little Effect on Atmospheric CO2. Int. J. Atmos. Ocean. Sci. 2019, 3, 13–26. [Google Scholar] [CrossRef]
- Kwiatkowski, M.; Broniek, E. An evaluation of the reliability of the results obtained by the LBET, QSDFT, BET, and DR methods for the analysis of the porous structure of activated carbons. Materials 2020, 13, 3929. [Google Scholar] [CrossRef] [PubMed]
- Lei, L.; Bai, L.; Lindbråthen, A.; Pan, F.; Zhang, X.; He, X. Carbon membranes for CO2 removal: Status and perspectives from materials to processes. Chem. Eng. J. 2020, 401, 1–17. [Google Scholar] [CrossRef]
- Hart, A.; Gnanendran, N. Cryogenic CO2 capture in natural gas. Energy Procedia 2009, 1, 697–706. [Google Scholar] [CrossRef]
- Babu, P.; Linga, P.; Kumar, R.; Englezos, P. A review of the hydrate based gas separation (HBGS) process for carbon dioxide pre-combustion capture. Energy 2015, 85, 261–279. [Google Scholar] [CrossRef]
- Gjernes, E.; Helgesen, L.I.; Maree, Y. Health and environmental impact of amine based post combustion CO2 capture. Energy Procedia 2013, 37, 735–742. [Google Scholar] [CrossRef]
- Raganati, F.; Chirone, R.; Ammendola, P. CO2 Capture by temperature swing adsorption: Working capacity as affected by temperature and CO2 partial pressure. Ind. Eng. Chem. Res. 2020, 59, 3593–3605. [Google Scholar] [CrossRef]
- Hidayu, A.R.; Muda, N. impregnated palm kernel shell activated carbon for CO2 adsorption by pressure swing adsorption. Indian J. Sci. Technol. 2017, 10, 1–6. [Google Scholar] [CrossRef]
- Tan, Y.; Islam, A.; Asif, M.; Hameed, B. Adsorption of carbon dioxide by sodium hydroxide-modified granular coconut shell activated carbon in a fixed bed. Energy 2014, 77, 926–931. [Google Scholar] [CrossRef]
- Boonpoke, A.; Chiarakorn, S.; Laosiripojana, N.; Towprayoon, S.; Chidthaisong, A. Synthesis of activated carbon and MCM-41 from bagasse and rice husk and their carbon dioxide adsorption capacity. J. Sustain. Energy Environ. 2011, 2, 77–81. [Google Scholar]
- Borhan, A.; Thangamuthu, S.; Taha, M.F.; Ramdan, A.N. Development of activated carbon derived from banana peel for CO2 removal. AIP Conf. Proc. 2015, 1674, 1–6. [Google Scholar] [CrossRef]
- Madzaki, H.; KarimGhani, W.A.W.A.; Rebitanim, N.Z.; Alias, A.B. Carbon dioxide adsorption on sawdust biochar. Procedia Eng. 2016, 148, 718–725. [Google Scholar] [CrossRef]
- Raganati, F.; Ammendola, P.; Chirone, R. On improving the CO2 recovery efficiency of a conventional TSA process in a sound assisted fluidized bed by separating heating and purging. Sep. Purif. Technol. 2016, 167, 24–31. [Google Scholar] [CrossRef]
- Borhan, A.; Yusup, S.; Lim, J.W.; Show, P.L. Characterization and modelling studies of activated carbon produced from rubber-seed shell using KOH for CO2 Adsorption. Process 2019, 7, 855. [Google Scholar] [CrossRef]
- Kövilein, A.; Kubisch, C.; Cai, L.; Ochsenreither, K. Malic acid production from renewables: A review. J. Chem. Technol. Biotechnol. 2019, 95, 513–526. [Google Scholar] [CrossRef]
- Hitchcock, I.; Malik, S.A.; Holt, E.M.; Fletcher, R.S.; Rigby, S.P. Impact of chemical heterogeneity on the accuracy of pore size distributions in disordered solids. J. Phys. Chem. C 2014, 118, 20627–20638. [Google Scholar] [CrossRef]
- Contescu, C.; Adhikari, S.; Gallego, N.C.; Evans, N.D.; Biss, B.E. Activated carbons derived from high-temperature pyrolysis of lignocellulosic biomass. Carbon 2018, 4, 51. [Google Scholar] [CrossRef]
- Guarín Romero, J.R.; Moreno-Piraján, J.C.; Giraldo Gutierrez, L. Kinetic and equilibrium study of the adsorption of CO2 in ultramicropores of resorcinol-Formaldehyde aerogels obtained in acidic and basic medium. J. Carbon Res. 2018, 4, 52. [Google Scholar] [CrossRef]
- Ho, Y.S.; McKay, G. Pseudo-second order model for sorption processes. Process Biochem. 1999, 34, 451–465. [Google Scholar] [CrossRef]
- Lendzion-Bieluń, Z.; Czekajło, Ł.; Sibera, D.; Moszyński, D.; Sreńscek-Nazzal, J.; Morawski, A.; Wrobel, R.J.; Michalkiewicz, B.; Arabczyk, W.; Narkiewicz, U. Surface characteristics of KOH-treated commercial carbons applied for CO2 adsorption. Adsorpt. Sci. Technol. 2017, 36, 478–492. [Google Scholar] [CrossRef]
- Oluodo, L.A.; Huda, N.; Komilus, C.F. Potential utilization of rubber seed meal as feed and food. Int. J. Eng. Technol. 2018, 7, 64–71. [Google Scholar] [CrossRef]
- Li, W.; Yang, K.; Peng, J.; Zhang, L.; Guo, S.; Xia, H. Effects of carbonization temperatures on characteristics of porosity in coconut shell chars and activated carbons derived from carbonized coconut shell chars. Ind. Crop. Prod. 2008, 28, 190–198. [Google Scholar] [CrossRef]
- Örkün, Y.; Karatepe, N.; Yavuz, R. Influence of Temperature and Impregnation Ratio of H3PO4on the Production of Activated Carbon from Hazelnut Shell. Acta Physica Polonica Gen. Phys. 2012, 121, 277–280. [Google Scholar] [CrossRef]
- Üner, O.; Bayrak, Y. The effect of carbonization temperature, carbonization time and impregnation ratio on the properties of activated carbon produced from Arundo donax. Microporous Mesoporous Mater. 2018, 268, 225–234. [Google Scholar] [CrossRef]
- Mays, T.J. A new classification of pore sizes. Stud. Surf. Sci. Catal. 2007, 160, 57–62. [Google Scholar] [CrossRef]
- Ukanwa, K.S.; Patchigolla, K.; Sakrabani, R.; Anthony, E.; Mandavgane, S. A Review of chemicals to produce activated carbon from agricultural waste biomass. Sustainability 2019, 11, 6204. [Google Scholar] [CrossRef]
- Couto, G.M.; Dessimoni, A.L.D.A.; Bianchi, M.L.; Perigolo, D.M.; Trugilho, P.F. Use of sawdust Eucalyptus sp. in the preparation of activated carbons. Ciência e Agrotecnologia 2012, 36, 69–77. [Google Scholar] [CrossRef]
- Mohtashami, S.-A.; Asasian-Kolur, N.; Kaghazchi, T.; Asadi-Kesheh, R.; Soleimani, M. Optimization of sugarcane bagasse activation to achieve adsorbent with high affinity towards phenol. Turk. J. Chem. 2018, 42, 1720–1735. [Google Scholar] [CrossRef]
- Shi, J.; Xing, D.; Lia, J. FTIR Studies of the Changes in wood chemistry from wood forming tissue under inclined treatment. Energy Procedia 2012, 16, 758–762. [Google Scholar] [CrossRef]
- Garcia, S.; Fernandez, E.S.; Stewart, A.J.; Maroto-Valer, M.M. Process integration of post-combustion CO2 capture with Li4SiO4/Li2CO3 looping in a NGCC plant. Energy Procedia 2017, 114, 2611–2617. [Google Scholar] [CrossRef]
- Esteves, I.A.; Lopes, M.S.; Nunes, P.M.; Mota, J.P. Adsorption of natural gas and biogas components on activated carbon. Sep. Purif. Technol. 2008, 62, 281–296. [Google Scholar] [CrossRef]
- Al-Ghouti, M.A.; Da’Ana, D.A. Guidelines for the use and interpretation of adsorption isotherm models: A review. J. Hazard. Mater. 2020, 393, 1–22. [Google Scholar] [CrossRef]
- Gebreslassie, Y.T. Equilibrium, kinetics, and thermodynamic studies of malachite green adsorption onto Fig (Ficus cartia) leaves. J. Anal. Methods Chem. 2020, 2020, 1–11. [Google Scholar] [CrossRef]
- Singh, V.K.; Kumar, E.A. Comparative studies on CO2 adsorption kinetics by solid adsorbents. Energy Procedia 2016, 90, 316–325. [Google Scholar] [CrossRef]
- Shahkarami, S.; Azargohar, R.; Dalai, A.K.; Soltan, J. Breakthrough CO2 adsorption in bio-based activated carbons. J. Environ. Sci. 2015, 34, 68–76. [Google Scholar] [CrossRef]
- Ghani, W.A.W.A.K.; Rebitanim, N.Z.; Salleh, M.A.M.; Alias, A.B. Carbon dioxide adsorption on coconut shell biochar. Prog. Clean Energy 2015, 1, 683–693. [Google Scholar] [CrossRef]
- Huang, Y.F.; Chiueh, P.T.; Lo, S.L. CO2 adsorption on biochar from co-torrefaction of sewage sludge and leucaena wood using microwave heating. Energy Procedia 2019, 158, 4435–4440. [Google Scholar] [CrossRef]
- Carvalho, F.C.; Nascimento, P.F.P.; De Souza, M.R.O.; Araujo, A.S. The efficiency of bimodal silica as a carbon dioxide adsorbent for natural gas treatment. Processes 2020, 8, 289. [Google Scholar] [CrossRef]
- Rashidi, N.A.; Yusup, S.; Hameed, B.H. Kinetic studies on carbon dioxide capture using lignocellulosic based activated carbon. Energy 2013, 61, 440–446. [Google Scholar] [CrossRef]
- Luebke, R.; Eubank, J.F.; Cairns, A.J.; Belmabkhout, Y.; Wojtas, L.; Eddaoudi, M. The unique rht-MOF platform, ideal for pinpointing the functionalization and CO2 adsorption relationship. Chem. Commun. 2012, 48, 1455–1457. [Google Scholar] [CrossRef]
- Forrest, K.A.; Pham, T.; Elsaidi, S.K.; Mohamed, M.H.; Thallapally, P.K.; Zaworotko, M.J.; Space, B. Investigating CO2 Sorption in SIFSIX-3-M (M = Fe, Co, Ni, Cu, Zn) through computational studies. Cryst. Growth Des. 2019, 19, 3732–3743. [Google Scholar] [CrossRef]


| Isotherm | Non-Linear Equation | Linear Equation |
|---|---|---|
| Langmuir | ||
| Freundlich | ||
| Dubinin-Radushkevich | ||
| Temkin |
| Elements | RSS before Carbonization | Sample A6 after Carbonization |
|---|---|---|
| Weight (%) | Weight (%) | |
| Carbon | 51.4 | 69.4 |
| Oxygen | 38.5 | 22.1 |
| Hydrogen | 5.3 | 2.1 |
| Sulphur | 0.1 | 0.1 |
| Nitrogen | 1.6 | 3.4 |
| Calcium | 3.1 | 2.9 |
| Total | 100 | 100 |
| Sample | IR | Act. Temp, Tact (°C) | Act. Time, tact (min) | Specific Surface Area, SBET (m2/g) | Total Pore Volume, VT (cm3/g) | Average Pore Diameter, D (nm) | Percentage Micro Pores (%) | Yield (wt%) |
|---|---|---|---|---|---|---|---|---|
| Raw | - | - | - | 3.05 | 0.00 | 4.554 | 19.82 | - |
| A1 | 1:1 | 400 | 60 | 265.51 | 0.12 | 3.810 | 68.21 | 44.07 |
| A2 | 1:1 | 500 | 60 | 471.14 | 0.19 | 1.084 | 79.04 | 43.85 |
| A3 | 1:2 | 500 | 120 | 684.19 | 0.26 | 1.173 | 83.10 | 42.04 |
| A4 | 1:3 | 500 | 120 | 502.50 | 0.24 | 1.155 | 81.32 | 42.28 |
| A5 | 1:1 | 600 | 120 | 832.24 | 0.31 | 1.214 | 83.73 | 41.86 |
| A6 | 1:2 | 600 | 120 | 938.61 | 0.41 | 1.368 | 85.24 | 42.72 |
| A7 | 1:3 | 600 | 180 | 622.44 | 0.37 | 1.231 | 84.02 | 41.22 |
| A8 | 1:2 | 700 | 120 | 730.61 | 0.31 | 1.330 | 84.07 | 40.62 |
| A9 | 1:2 | 800 | 120 | 682.13 | 0.31 | 1.372 | 83.24 | 40.26 |
| A10 | 1:2 | 900 | 120 | 510.20 | 0.30 | 2.214 | 82.92 | 38.66 |
| A11 | 1:2 | 900 | 180 | 302.35 | 0.21 | 3.025 | 72.70 | 38.02 |
| Type | 25 °C | 50 °C | 100 °C | Type | 25 °C | 50 °C | 100 °C |
|---|---|---|---|---|---|---|---|
| Langmuir | Freundlich | ||||||
| qm | 76.7234 | 59.0621 | 41.4431 | kF | 43.7640 | 30.8725 | 12.5502 |
| kL | 2.4326 | 1.32280 | 0.6844 | n | 2.7697 | 1.4205 | 1.2009 |
| R2 | 0.9873 | 0.9744 | 0.9821 | R2 | 0.9952 | 0.9951 | 0.9910 |
| Dubinin Radushkevich | Temkin | ||||||
| qm | 39.7542 | 25.8004 | 12.6642 | B | 12.0744 | 9.2582 | 4.7621 |
| λ | 3.6771E-8 | 3.8261E-8 | 4.8011E-8 | kT | 28.903 | 19.005 | 13.1774 |
| E | 4.0241 | 3.4902 | 3.0182 | bT | 238.7742 | 389.0624 | 714.5542 |
| R2 | 0.9432 | 0.9576 | 0.9611 | R2 | 0.9589 | 0.9476 | 0.9305 |
| Type | 25 °C | 50 °C | 100 °C | Type | 25 °C | 50 °C | 100 °C |
|---|---|---|---|---|---|---|---|
| Pseudo-First Order | Pseudo-Second Order | ||||||
| qe (mg/g) | 138.716 | 101.447 | 74.929 | k2 (g/mg min) | 1.09 × 10⁻⁴ | 1.45 × 10⁻⁴ | 1.74 × 10⁻³ |
| k1 (1/min) | 0.0882 | 0.0294 | 0.0068 | h (mg/g min) | 2.097 | 1.276 | 0.9761 |
| R2 | 0.9888 | 0.9928 | 0.9913 | R2 | 0.8901 | 0.8860 | 0.8861 |
| Elovich | |||||||
| β (g/mg) | 0.0390 | 0.0638 | 0.9243 | ||||
| α (mg/g min) | 0.6282 | 0.4028 | 0.0932 | ||||
| R2 | 0.9322 | 0.9193 | 0.9549 | ||||
| Adsorbent Types | Activation Method | CO2 Adsorption Capacity (mg/g) | References |
|---|---|---|---|
| Coconut shell | Chemical (NaOH) | 27.10 | [10] |
| Banana peel | Chemical (KOH) | 48.40 | [12] |
| Rice husk | Chemical (ZnCl2) | 57.13 | [11] |
| Palm kernel shell | Chemical (ZnCl2) | 62.05 | [9] |
| Coconut shell char | Chemical (MEA) | 35.57 | [37] |
| Sewage sludge | Physical (microwave) | 53.30 | [38] |
| Sawdust biochar | Chemical (MEA) | 44.80 | [14] |
| Bimodal silica | Physical (hydrothermal) | 123.23 | [39] |
| Norit® SX2 CAC | Physical (steam) | 82.74 | [40] |
| Rht-MOF-7 | Chemical (MOF) | 105.6 | [41] |
| Zeolite 13X CAC | Physical (hydrothermal) | 91.23 | [35] |
| SIFSIX-3-Zn | Chemical (MOM) | 124.52 | [42] |
| RSS AC | Chemical (KOH) | 54.41 | [15] |
| RSS AC | Chemical (malic acid) | 107.99 | This work |
Publisher’s Note: MDPI stays neutral with regard to jurisdictional claims in published maps and institutional affiliations. |
© 2020 by the authors. Licensee MDPI, Basel, Switzerland. This article is an open access article distributed under the terms and conditions of the Creative Commons Attribution (CC BY) license (http://creativecommons.org/licenses/by/4.0/).
Share and Cite
Borhan, A.; Yusuf, S. Activation of Rubber-Seed Shell Waste by Malic Acid as Potential CO2 Removal: Isotherm and Kinetics Studies. Materials 2020, 13, 4970. https://doi.org/10.3390/ma13214970
Borhan A, Yusuf S. Activation of Rubber-Seed Shell Waste by Malic Acid as Potential CO2 Removal: Isotherm and Kinetics Studies. Materials. 2020; 13(21):4970. https://doi.org/10.3390/ma13214970
Chicago/Turabian StyleBorhan, Azry, and Suzana Yusuf. 2020. "Activation of Rubber-Seed Shell Waste by Malic Acid as Potential CO2 Removal: Isotherm and Kinetics Studies" Materials 13, no. 21: 4970. https://doi.org/10.3390/ma13214970
APA StyleBorhan, A., & Yusuf, S. (2020). Activation of Rubber-Seed Shell Waste by Malic Acid as Potential CO2 Removal: Isotherm and Kinetics Studies. Materials, 13(21), 4970. https://doi.org/10.3390/ma13214970