1. Introduction
The article contains research on sulfate resistance as a critical aspect of durability. Several studies have confirmed that durability is critical for building materials [
1,
2,
3]. Fly ash is used as a partial replacement for Portland cement to improve the strength and sulfate resistance of concrete [
4,
5,
6], as well as to obtain artificial aggregates [
7,
8]. There is evidence of a significant decrease in the diffusion rate in places where fly ash is present, as well as stabilization of calcium aluminate hydrates, which leads to an increase in resistance to sulfate attack. The results are consistent for cements with a C
3A content of 9 to 12% [
9].
Fly ash is usually replaced by 15–35% of cement by weight. This range is acceptable for replacement without a significant negative impact on concrete performance. Fly ash is divided into low-calcium fly ash with a CaO content of no more than 18% (class F) and high-calcium fly ash with a CaO content of more than 18% (class C) according to ASTM C618 [
10].
In scientific publications, such as [
11,
12,
13] and others, other additives are known that are used in lightweight concrete and affect their performance. The properties of structures made on the basis of concrete with similar additives were studied in [
13,
14].
Low-calcium fly ash permanently improved the sulfate resistance of mortar based on Portland cement with high C
3A content, and generally met the criteria for high sulfate resistance when containing 2 to 25% fly ash as cement replacement by mass. Fly ash with a high calcium content (i.e., CaO > 20%) had very different properties. The authors showed that fly ash replacement of 20% to 40% resulted in increased expansion when compared to high C
3A cement used alone. Mortars with different levels of high-calcium fly ash content can be produced in accordance with the criteria for high sulfate resistance. This can be achieved by using low-C
3A Portland cements or ternary cement mixtures containing low levels of silica fume. [
15]. However, fly ash with a similar chemical composition could have different physical characteristics [
16], depending on the type and source of fuel, boiler system, and cooling system. In [
17], 15 types of class C fly ash and 11 types of class F fly ash were investigated. Fly ash of class C contained from 19.5 to 32.5% CaO with an average diameter D
50 of 1.3 to 3.1 microns, and fly ash of class F contained from 2.1 to 17.1% CaO with D
50 = 1.6–2.4 microns. In [
18], a high-strength self-compacting concrete mix with high-calcium (class C) fly ash was designed. The compressive strength of the concrete was 100 MPa. It was found that with an equivalent w/b ratio, high-strength self-compacting concrete develops considerably higher compressive strength (more than 15 MPa) compared to that of conventionally vibrated high-strength concrete.
Estonian oil shale has a special place among the sources of fuel ash. It is characterized by a high content of carbonate minerals. Therefore, shale ash contains a lot of free lime. The properties of shale ash depend on the chemical and mineral composition, which in turn depend on the combustion temperature. A temperature of 800 °C is for low-temperature circulating fluidized bed firing technology and 1400 °C is for high-temperature powdered fuel combustion. The pulverized fuel ash from electrostatic precipitators of high-temperature boilers is used as an additional binder in cement materials [
19]. This type includes the fly ash “Zolest-bet”. This ash of burnt oil shale is supplied by Narva to the entire European part of Russia and beyond the Urals.
The research in [
20] was done to compare two types of shale ashes from the Narva power plant. The first type was cyclone ash and the second one was electrostatic precipitator ash. Both types had almost the same chemical composition. The cyclone ash significantly reduced the mechanical strength of the material and the electrostatic precipitator ash showed little change in the compressive strength and flexural strength. This may be due to its high dispersion. The electrostatic precipitator ash reduces the resistance of the material to solutions of sulfate salts more than cyclonic ash. However, at the same time, both ashes do not affect the frost resistance of the material.
The Jordan Natural Resources Authority considers oil shale as one of the most important promising energy sources, and shale ash as an alternative to other types of pozzolana. The authors compared the compressive strength of cement mortar cubes and mortar cubes with cement and fly ash. Replacement levels of fly ash were 10, 20, and 30% by weight. The replacement of cement by oil shale ash reduced the compressive strength of the cubes by 7.4, 11.7, and 23%, respectively. The setting time of cement paste increased by 20, 30, and 50 min, and the soundness also increased by 0, 0.5, and 1.5 mm due 10, 20, and 30% replacement of cement by oil shale ash, respectively. The experimental results confirmed that use of oil shale ash up to 20%, as there was no significant effect on the cement properties [
21].
The research in [
22] showed that an increase in the dispersion of shale ash significantly improves the rheology of the mixture and the rate of strength growth.
The study in [
23] showed that free lime did not affect normal consistency and water demand, and free lime content up to 4.5% had little chemical effect on mixtures with cement and fly ash, i.e., faster setting, higher early age compressive strength, and higher autoclave expansion. However, the autoclave expansion values were still within the standard range. In terms of durability, high free lime fly ash mixtures resulted in higher expansion due to alkaline aggregate reactions.
In addition to the chemical composition, morphology, and crystallinity, particle size has a great influence on the change in the hydration, which, in turn, leads to a change in the mechanical properties and durability of fly ash concrete [
24,
25]. The paper [
26] notes that the processing type, rather than the chemical composition, has a stronger effect on the compressive strength. The research in [
27] shows that curing conditions are the most important factor affecting the durability of fly ash concrete. The effect of curing on cementitious concrete is of much lesser importance.
Investigating the action of two types of superplasticizers, the authors of [
28] established that both types of superplasticizers were significantly less effective with geopolymers, compared with Portland cement paste. Polycarboxylate-based superplasticizer was more effective with class C than with class F fly ash. The naphthalene-based superplasticizer did not show much difference when added to the two types of fly ash.
There is conflicting information in the literature regarding the characteristics of fly ash, in particular concerning shrinkage, high-temperature curing, water requirements, toxicity [
29], etc. Due to the high variability of characteristics observed for mortars and concretes containing fly ash with high calcium content, there is a need to test individual specific combinations of materials.
The objective of the work is the determination of the impact of electrostatic precipitator ash “Zolest-bet” and micro silica on the sulfate resistance of Portland cement in comparison with the sulfate resistance of a solution based on sulfate-resistant cement.
3. Results and Discussion
3.1. Shrinkage and Expansion Test Results
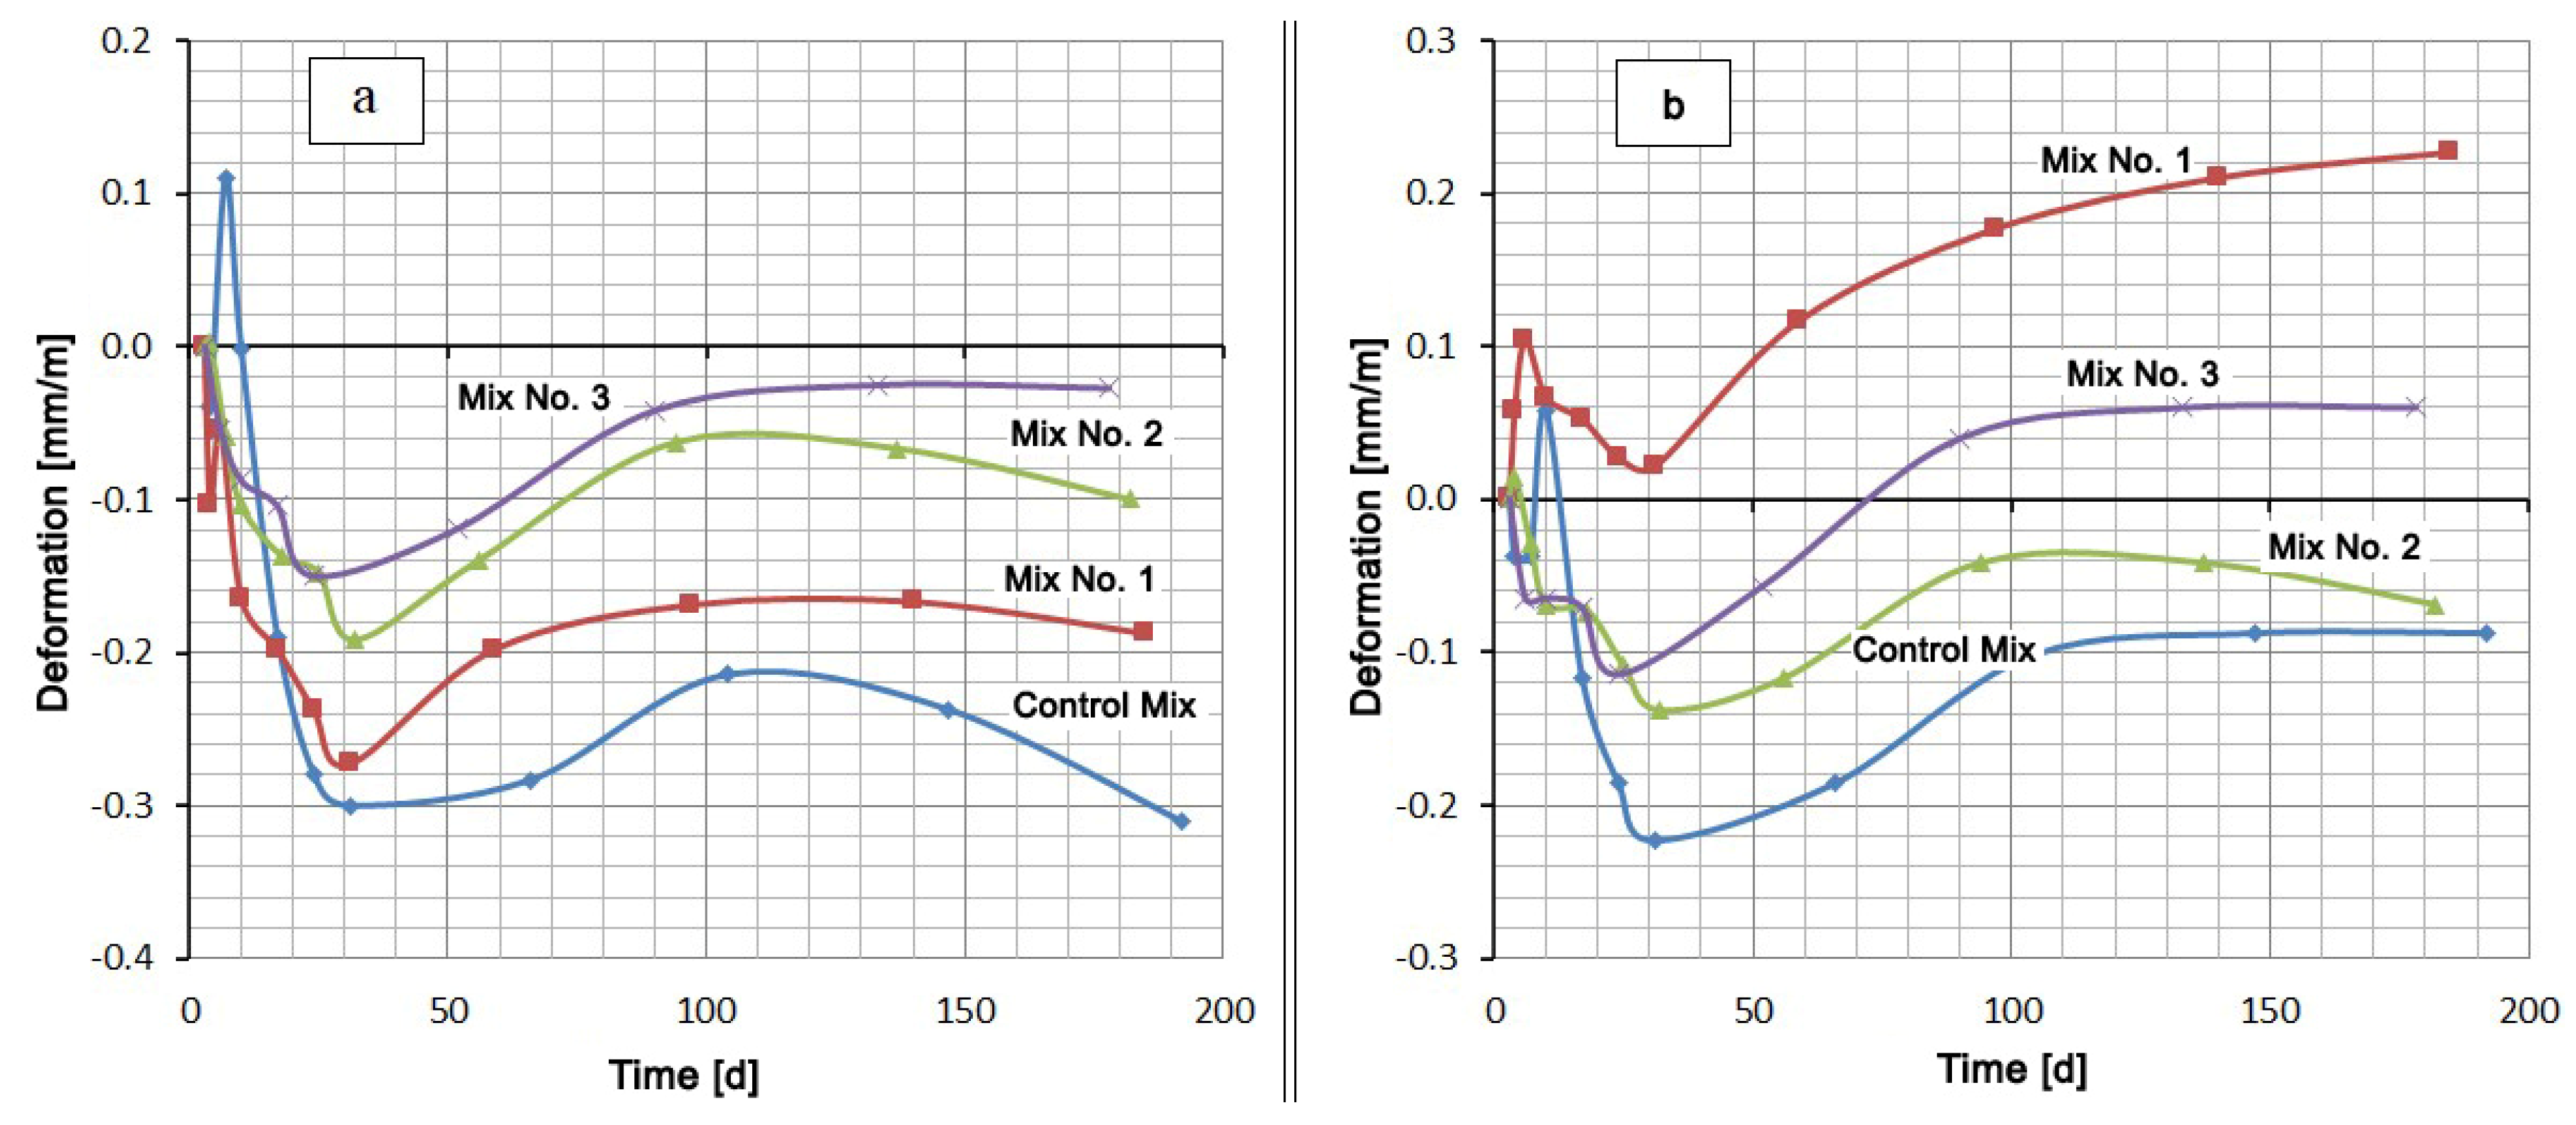
The hardening of all cement mixtures in water was accompanied by shrinkage (see
Figure 2). An exception was the Control Mix, which had a short-term expansion to 0.11 mm/m on the seventh day of hardening. The hardening of the mixtures based on Portland cement CEM I 42.5 N (Control Mix, Mix No. 1, Mix No. 2) in 5% Na
2SO
4 solution showed at first a slight expansion (no more than 0.1 mm/m), which then changed to shrinkage. After about 25–30 days from the moment of mixing, the expansion of all samples, which hardened both in water and in a Na
2SO
4 solution, began. This expansion of mixtures in water reached its maximum value by 120–140 days, after which shrinkage began again. A similar maximum on the deformation curve among the compositions in sodium sulfate solution took place only for the mixture with the addition of silica fume (Mix No. 2). Other mixtures expanded until the end of the test. The compositions of Control Mix and Mix No. 2 had curves No. 2, which remained in the negative region (
Figure 2a,c). This means that the samples, both in water and in Na
2SO
4 solution, showed shrinkage deformation at the end of the test period (Control Mix and Mix No. 2). The other two compositions, Mix No. 1 and Mix No. 3, underwent shrinkage in water and expansion in the Na
2SO
4 solution.
A small step on the deformation curves, and even expansion in the case of Control Mix and Mix No. 1, were observed in the initial section of shrinkage development. This circumstance and the subsequent wavelike nature of deformation indicated competition between contraction shrinkage and expansion under the action of the formed compounds and ordinary swelling in water.
The extent of the effect of Na
2SO
4 on expansion in comparison with pure water can be seen in the area between curves 1 and 2, the values of which for 180 days are given in
Table 4.
Table 4 shows that the mixture with silica fume additive (Mix No. 2) has the smallest discrepancy between deformation in Na
2SO
4 solution and deformation in water, and, therefore, this mixture has the highest sulfate resistance. The mixture with the Zolest-bet additive (Mix No. 1) has the largest discrepancy between curves 1 and 2. The mixture based on sulfate-resistant cement (Mix No. 3) has, as expected, less expansion than the Control Mix based on Portland cement, but this expansion is 2.3 times greater than the expansion of the mixture with silica fume additive (Mix No. 2).
A comparison of the mixtures by the deformation value in the same medium gives a slightly different picture (
Figure 3). Typically, cementitious compositions swell when hardened in water. However, in this case, the samples were placed in water 3 days after production, when a sufficiently rigid skeleton of the material was formed. In this case, the penetration of moisture inside is difficult. At this age, the most intense contraction shrinkage of the material, which overlaps the swelling, occurs. After about 30 days of hardening, the shrinkage rate decreases and the expansion process begins to prevail. Despite this, the deformation values of all mixtures remain in the negative region (shrinkage region) (see
Figure 3a). Under these conditions, sulfate-resistant Portland cement CEM I 32.5 N SR5 has the lowest shrinkage, and the Control Mix based on Portland cement CEM I 42.5 N has the highest shrinkage. At the same time, replacing 20% of the cement in the Control Mix by Zolest-bet additive (Mix No. 1) reduced the final shrinkage by almost 40%. A similar replacement of cement by silica fume reduces shrinkage by more than three times.
The mix with Zolest-bet additive (Mix No. 1) in 5% Na2SO4 solution showed the highest expansion value (0.227 mm/m) at 180 days. Throughout this period, the deformation values of the mix with Zolest-bet additive were positive. The mix based on sulfate-resistant Portland cement remained in the shrinkage area until 70 days, and after that, it began to exceed the initial sample size. The final expansion of this mix was 0.06 mm/m. The best results were obtained for the mix with silica fume additive (Mix No. 2), the expansion of which did not go beyond the negative region. Additionally, in the area of shrinkage, the deformation of the Control Mix remained, but its shrinkage turned out to be higher than that of the mix with silica fume additive.
Along with measuring the deformation, the mass increment of the samples was determined by weighing them on an electronic balance with a scale division of 0.01 g in the same periods. It was obvious that the increase in the mass of the samples occurred due to the absorption of either water or a Na
2SO
4 solution. The reverse process (weight reduction) could have occurred because of Ca(OH)
2 leaching. A definite relationship between the expansion and the amount of absorbed water or solution must have existed. However, the experiments did not show a stable correlation between these values, but there was something in common in the form of all curves in the form of a “pit” or a loop in the middle of the graph (
Figure 4).
The falling part of the loop indicates that shrinkage occurs despite the increase in the mass of the samples. Additionally, there is some similarity between curves 1 and 2 for each mixture. This suggests a possible correlation between the deformation values or mass increments for the same mixtures at the same time points. This correlation in the form of direct proportionality is obtained with a high degree of reliability (R
2 = 0.992–0.998) for mass increments in water solution and in the salt solution (
Figure 5,
Table 5). There is little correlation between the deformation values in water and in solution (R
2 = 0.133–0.980).
Table 5 shows the values of the slope coefficients and the R-squared value of the relationship between the mass increment of the samples and the values of their deformations in solution and in water at the same time points.
The presence of a correlation between the mass increment of the samples in water and in a Na2SO4 solution and the absence of such a relationship between changes in volume shows that these two processes are little related to each other. The mass increment is mainly determined by water consumption for cement hydration and absorption by the gel and contraction pores. The volume change is mainly due to contraction shrinkage, gel swelling, and the formation of expandable compounds. Direct proportionality here indicates that the Na2SO4 present in the solution, without practically affecting the hydration and associated processes, causes an additional water demand for the formation of hydrating compounds (gypsum and ettringite). In this case, the mass increment of the samples in the Na2SO4 solution in comparison with the mass increment in water increases with time in a constant percentage: for Mix No. 1 by 8%; for Mix No. 2 by 3%; for Mix No. 3 by 12%. In the case of the Control Mix, an inverse ratio of 10% is obtained. It is not possible to explain this circumstance within the framework of this article.
3.2. Strength Test Results
Another criterion for evaluating sulfate resistance, in addition to the expansion, is the strength of samples exposed to long-term aggressive environments.
After the end of the shrinkage–expansion experiments, after 192 days, the test beams with dimensions of 40 × 40 × 160 mm were left in the corresponding media for another 138 days, but at a higher temperature of 40 °C. Thus, some samples were hardened in water and other ones in 5% Na2SO4 solution for 6 months at a temperature of 20 °C and 4.6 months at a temperature of 40 °C.
Thereafter, the beams were tested for flexural strength at the age of 340 days. The halves of the beams were tested for compressive strength using standard 25 cm2 plates after the flexural strength test.
The strength test results are shown in
Figure 6.
The mixture with the Zolest-bet additive (Mix No. 1) has the highest compressive strength after hardening both in water and in a Na2SO4 solution. The compressive strength of Mix No. 1 was 4% lower and the flexural strength 8% higher after hardened in Na2SO4 solution than after hardened in water. The strength of Mix No. 1 exceeded the compressive strength of the Control Mix by 24% (in water) and by 14% (in Na2SO4 solution).
The compressive strength of the mixture with silica fume additive (Mix No. 2) turned out to be slightly lower than that of the mixture with the Zolest-bet additive (Mix No. 1). This decrease was 2.5 and 1.0% in a water medium and in Na2SO4 solution, respectively. The flexural strength of Mix No. 2, hardened in solution, was significantly lower than when hardened in water. Mix No. 2 had the lowest value among the samples that had a positive effect on strength from the Na2SO4 solution. However, the compressive strength when exposed to Na2SO4 decreased for all mixtures, except for samples based on sulfate-resistant cement (Mix No. 3). The strength of Mix No. 3 in an aggressive environment increased both in the flexural strength and in the compressive strength.
3.3. Density Test Results
The density of the samples was calculated from the results of periodic weighing. Before the start of the experiment, the dimensions of the samples were determined with an accuracy of 0.1 mm. The change in the sample due to shrinkage or expansion was taken into account when determining the volume. The volume correction was calculated from the measured relative change in the sample length and the proportional change in the other two dimensions. However, this correction turned out to be negligible.
Table 6 shows the density values at the beginning of the experiment and after a 340-day immersion in water and in a 5% Na
2SO
4 solution.
The density of the samples before the experiment did not depend on the hardening environment, because in the first three days, the samples of both series were in the same conditions. As a result of staying in the appropriate environment for 340 days, the density of the Control Mix increased in comparison with the initial one by 1.3%. The density of the other mixtures increased in comparison with the initial one by 2.0–2.4%, regardless of the environment. The density after the experiment of the mixtures without additives (Control Mix and Mix No. 3), both in the water and in the Na2SO4 solution, turned out to be practically the same. The hardening conditions did not affect the density of mixtures with additives (Mix No. 1 and Mix No. 2). The density of these mixtures after being in the Na2SO4 solution turned out to be higher than the density after water hardening by 1.0 and 1.3%, respectively.
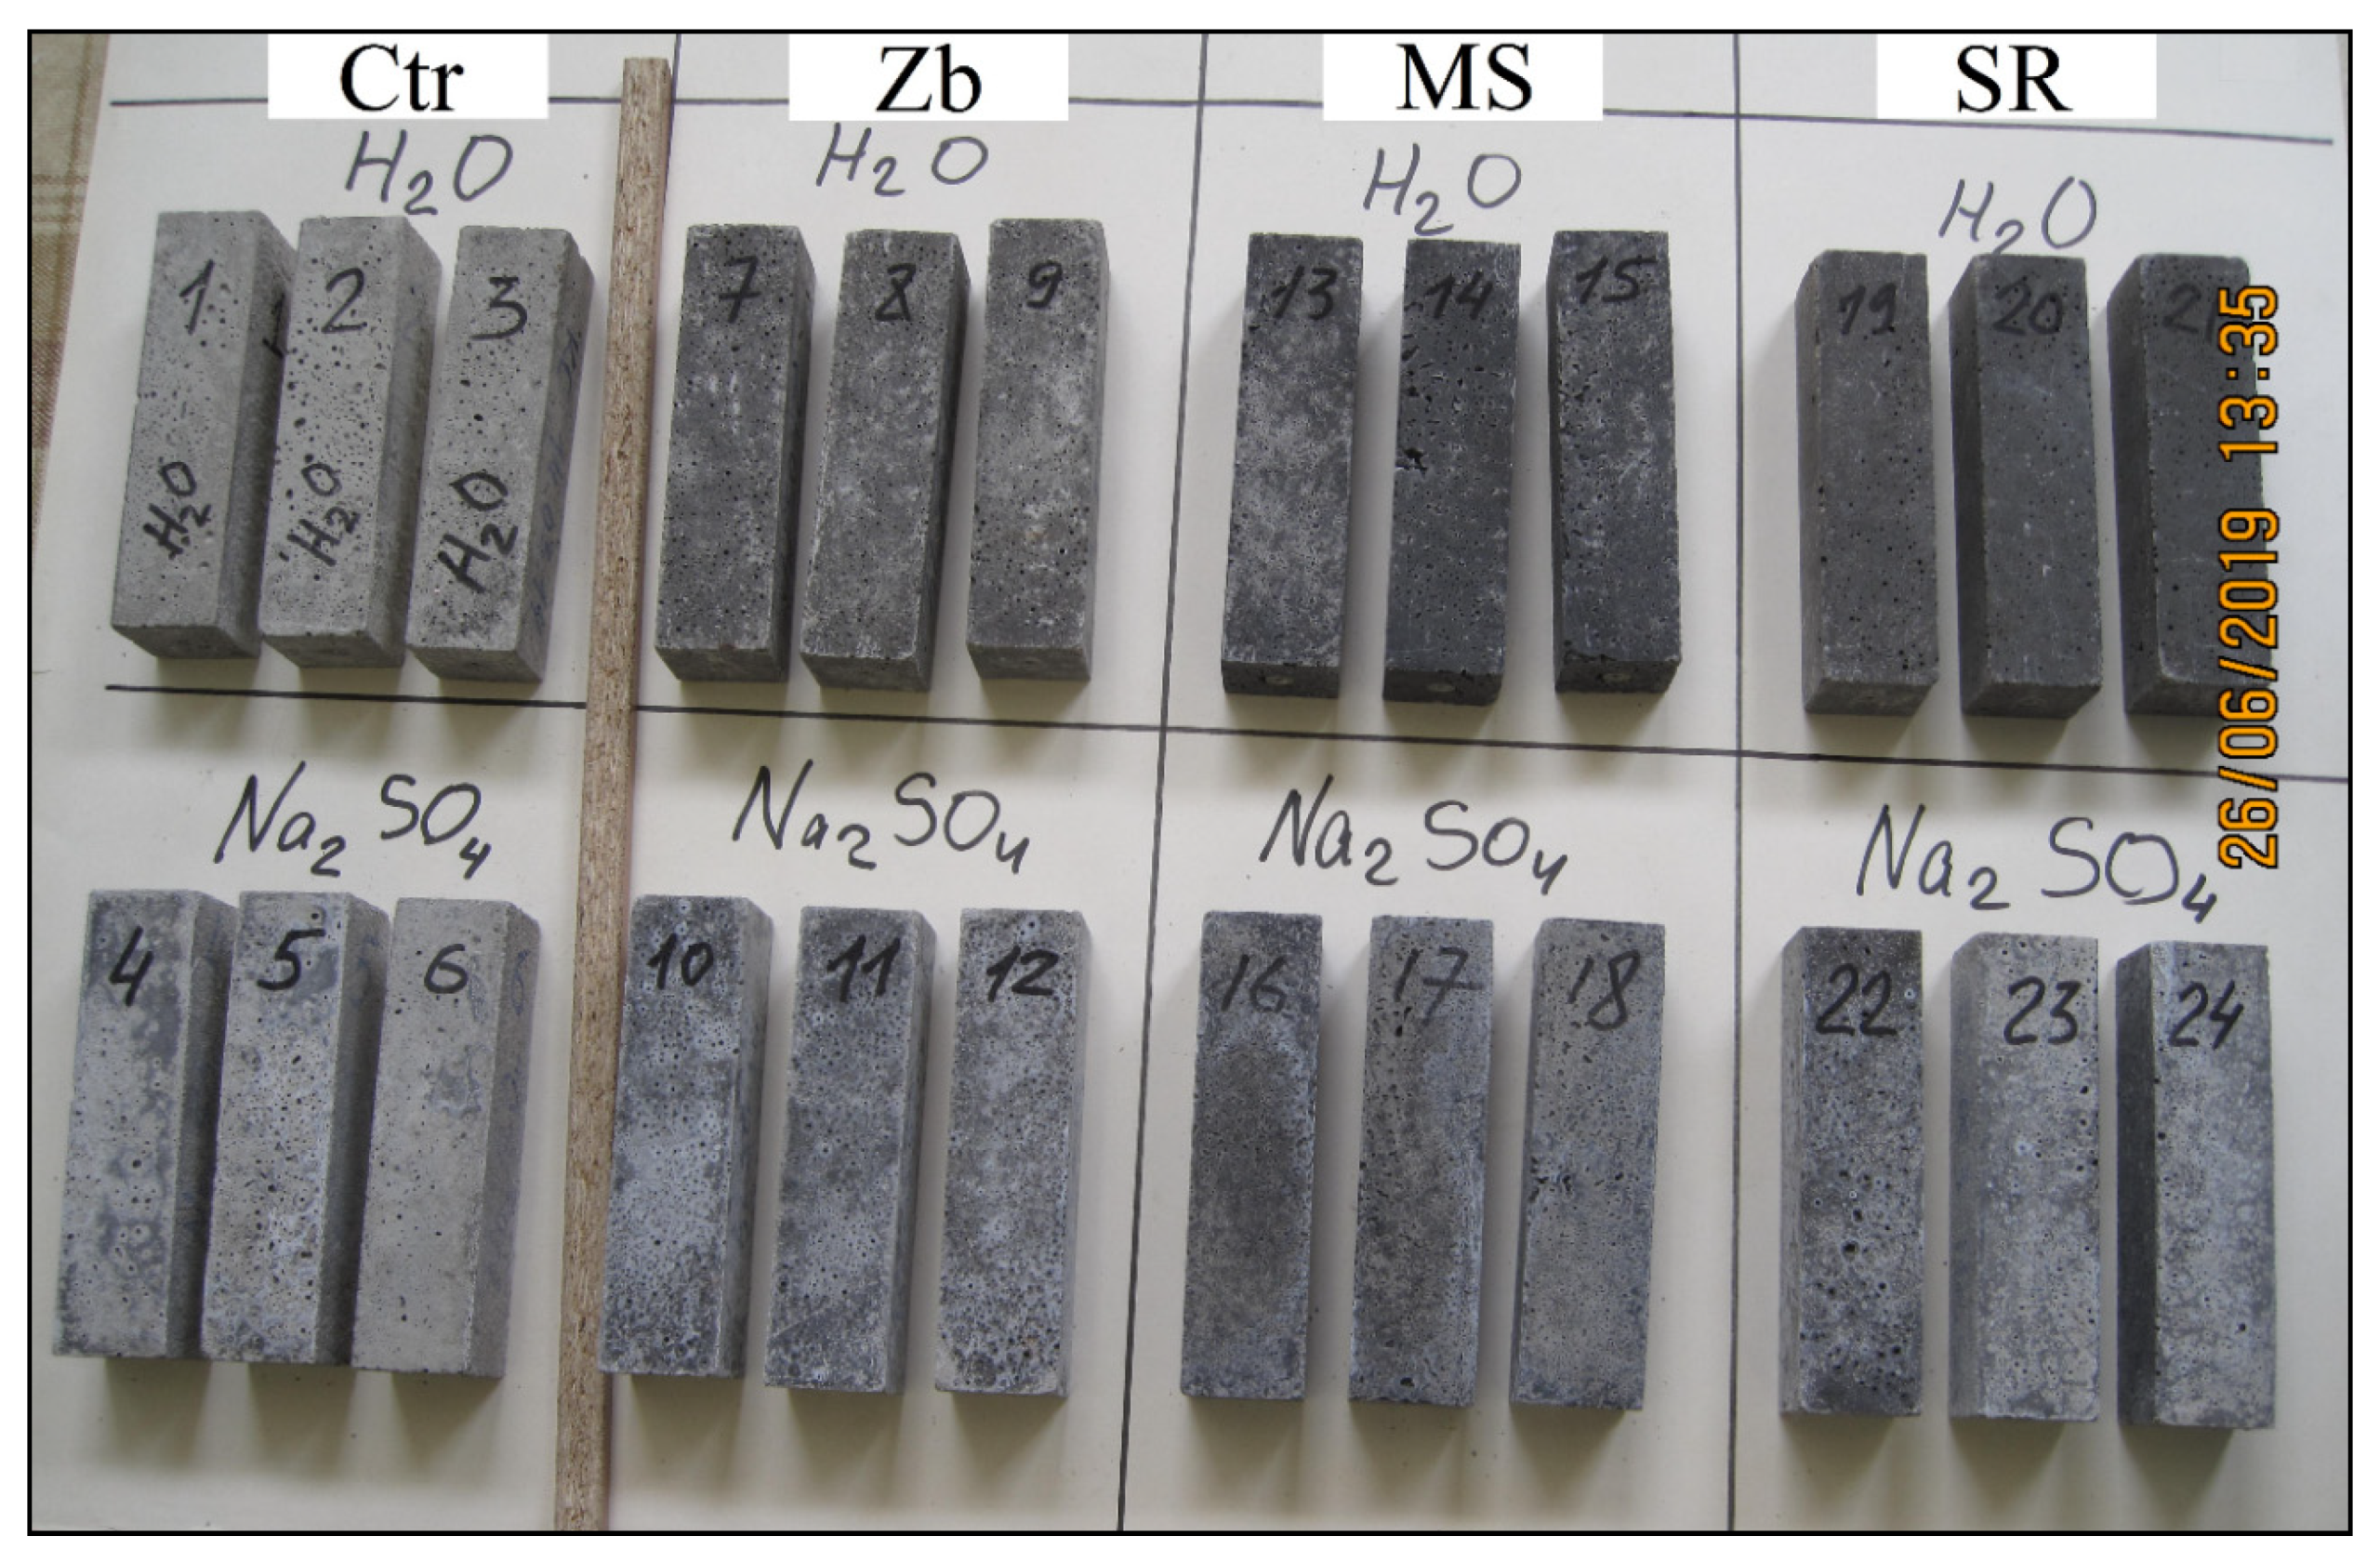
3.4. Assessment of the Appearance of Samples
The samples hardened in Na
2SO
4 solution, in contrast to the samples in water, have a lighter uneven color due to white efflorescence (see
Figure 7).
Structural damage in the form of cracks, delamination, and peeling of the surface were not found as a result of visual analysis of the samples.
4. Conclusions
1. The influence of the electrostatic precipitator ash “Zolest-bet” and silica fume on the sulfate resistance of Portland cement was studied. The evaluation criteria were the expansion, strength, density, and appearance of the samples, hardened in a 5% Na2SO4 solution starting from three days of age for 192 days at a temperature of 20 °C and 148 days at 40 °C. The test results were compared with the results of the mixture based on Portland cement without additives and a sulfate-resistant cement mixture.
2. A variable character of sample deformation was established, both in pure water and in a Na2SO4 solution. This consisted of a change in the periods of shrinkage and expansion, which may indicate competition between contraction shrinkage and expansion under the action of the formed compounds and the swelling gel. The degree of influence of Na2SO4 on expansion was estimated from the area between the deformation curves of the samples in a Na2SO4 solution and in pure water for 180 days. The mixture with the silica fume additive had the minimum expansion under the Na2SO4 action, and the mixture with the fly ash “Zolest-bet” additive had the greatest expansion according to this indicator.
3. A stable correlation between the expansion and the mass increment of the samples was not found in the experiments. A decrease in volume was observed when there was a mass increment. A directly proportional correlation between the values of mass increments in water and in Na2SO4 solution for the same mixtures at the same time points was established. There is no correlation between the values of the corresponding deformations in water and in solution.
4. Zolest-bet ash in pure water shrank the mixture by 0.19 mm/m by the end of the hardening period (180 days), and it gave a linear expansion of 0.23 mm/m (0.023%) in a Na2SO4 solution after hardening. The mixture can be considered sulfate resistant at a given value of linear expansion (norm ≤ 0.1%). All the more sulfate-resistant mixtures should be considered, as the remaining ones had less expansion than the fly ash mixture. Despite the greatest expansion, the compressive strength of the samples with the Zolest-bet additive was found to be the highest after hardening in both environments. The flexural strength was found to be the highest after being in Na2SO4 solution.
5. The sulfate resistance of the mixture with silica fume additive was higher than that of the mixture based on sulfate-resistant cement. This mixture did not expand in comparison with the initial length, but, on the contrary, it shrank, while the expansion of sulfate-resistant cement was 0.006% over the control period. The compressive strength of the mixture with the silica fume additive was slightly inferior to the strength of the mixture with Zolest-bet ash.

 ,
, 


