Article

The Use of Ultra-Small Fe3O4 Magnetic Nanoparticles for Hydrothermal Synthesis of Fe3+-Doped Titanate Nanotubes

by
Maciej Marć
1,*,
Lidia Najder-Kozdrowska
1,
Nikos Guskos
2,
Grzegorz Żołnierkiewicz
2,
Ana Maria Montero
3 and
Mirosław Roman Dudek
1
1
Institute of Physics, University of Zielona Góra, ul. Szafrana 4a, 65-069 Zielona Góra, Poland
2
Institute of Physics, West Pomeranian University of Technology, Al. Piastów 17, 70-310 Szczecin, Poland
3
Aachen Institute for Advanced Study in Computational Engineering Science, RWTH, 52062 Aachen, Germany
*
Author to whom correspondence should be addressed.
Materials 2020, 13(20), 4612; https://doi.org/10.3390/ma13204612
Submission received: 8 September 2020 / Revised: 25 September 2020 / Accepted: 12 October 2020 / Published: 16 October 2020

Abstract

:
A method of the hydrothermal synthesis of Fe3+-doped titanate nanotubes (TNT) is reported in which the ultra-small Fe3O4 nanoparticles are used as the sources of Fe3+ ions. The magnetic nanoparticles with a diameter of about 2 nm are added during the washing stage of the hydrothermal procedure. During washing, they gradually degrade and at the same time, the titanate product is transformed into nanotubes. The obtained nanotubes were characterized by structural and magnetic measurements. It was found that, depending on the value of the external magnetic field, they may show the property of room temperature ferromagnetism, paramagnetism or they may be diamagnetic. It was also shown that the modified TNTs have greater photocatalytic activity compared to unmodified TNTs.

1. Introduction

Simple and low cost methods of preparing various forms of titanium dioxide (TiO2), such as nanoparticles, flakes, or nanotube structures and a wide spectrum of applications for them cause a growing interest in these materials [1,2]. The attractiveness of TiO2-based materials increased significantly due to the possibility of using them for the conversion of solar energy to chemical one. Currently, issues related to their use for solar cells [3,4], photocatalysis [5,6,7] or degradation of organic compounds [8] are the subjects of very intense research. It is worth to add that TiO2 is widely regarded as not harmful to human health [9]. It represents n-type semiconductor but the certain disadvantage is the presence of a large bandgap moving the edge of light absorption towards the ultraviolet region. The bandgap is 3.0 eV and 3.2 eV for bulk forms of rutile and anatase, respectively, and increases for nanostructures, e.g., it is equal to 3.3 eV for titanate nanotubes [10,11]. In TiO2, the lowest energy edge in the conduction band is due to vacant Ti4+ bands and the upper energy edge of the valence band is determined by the filled O 2 bands [12,13]. Recently, there have appeared numerous publications showing the possibility of decreasing the width of the bandgap by using the appropriate doping procedures [11,13,14,15,16]. In particular, the substitutional Fe3+ ions are charge compensated by the oxygen vacancies and move Fermi level, EF, towards valence band [13,17,18,19]. In [20], it was shown that at a high concentration of Fe3+, TiO2 may even behave like a p-type semiconductor.
In this work, we focus on Fe3+-doping of titanate nanotubes (TNTs). The nanotubes are prepared by an alkaline hydrothermal method [21] which is commonly used next to the anodization method [22] and template method [23]. A wide discussion on the hydrothermal treatment of TiO2 nanoparticles can be found in [10,24,25,26]. Transforming TiO2 nanopowder into TNTs yields a material with very large specific surface area [27] which, also possesses an ion-exchangeable layered structure [28]. Further modifications of TNTs by ion doping or decorating its surface with organic molecules and nanoparticles can enhance the adsorption properties of TNTs [29,30,31]. An additional advantage is that the titanate nanotubes does not contain toxic substances, as shown by recent studies [32,33].
The methods of doping titanate nanotubes with ions depend on the specific application. The examples of ions that are often used are Fe3+ [34,35,36,37,38], Co2+ [39,40,41], Ni2+ [39], Mn2+ [42], Gd3+ [43], Yb3+ [44], Nd3+ [44], Au3+ [45], Pt2+ [45]. They show how diverse the methods of doping TiO2 nanotubes are. It should be noted that ion doping methods can also apply to TiO2 material in the form of nanoparticles, e.g., Fe3+-doping [46,47,48,49,50]. In the present work, we suggest a method for Fe3+-doping titanate nanotubes using ultra-small Fe3O4 nanoparticles with a diameter of about 2 nm. Such an extremely small size of nanoparticles causes that they quickly degrade in an acidic environment, even at a very low acid concentration. As a consequence, at the stage of the washing procedure, previously added nanoparticles degrade and become sources of high concentration of iron ions located on the surface of nanotubes. This is a novelty of this method compared to others that use ultra-small iron oxide nanoparticles deposited on the surface of titanate nanotubes. An example may be the paper [51], where nanoparticles with an average size of 10 nm were used to coat titanate nanotubes. In this case, the nanoparticles did not degrade and they influenced the diameter of the nanotubes. Our method is also complementary to the methods of delivering iron ions directly from aqueous iron (III) chloride solution as in paper [34] where a microwave-assisted hydrothermal method was used. It is also worth mentioning the method which is a combination of the sol-gel method which produces Fe-doped TiO2 powder and the hydrothermal method for the synthesis of nanotubes as in the publication [35].

2. Materials and Methods

2.1. Synthesis of TNTs

Titanate nanotubes were prepared by the alkaline hydrothermal method [21]. In this study, TiO2 pigments supplied by Police Chemical Factory (Police, Poland), Tytanpol A11 was used as starting material. TiO2-A11, like TiO2-P25 produced by Degussa AG (Essen, Germany) is a commercially available photocatalyst. Both photocatalysts are mixtures of two phases, anatase and rutile, but the content of rutile is around 1.6% for TiO2-A11 and 18.3% for TiO2-P25 [52,53]. 200 mg of the TiO2-A11 nanopowder was added to 35 mL of 10 M NaOH (aq.) and sonicated for 30 min. Subsequently, the suspension was transferred to Teflon-lined autoclave and heated at 150 °C for 24 h. The obtained product was sonicated for 30 min and washed with distilled water to lower pH. In the next step, 0.1 M HCl (aq) was gradually added to the system until pH reached 4 and the suspension was washed with distilled water. Obtained TNTs was dried in temperature 55 °C. The resulting powder represents the sample which in this study is denoted as S1.

2.2. Modified TNTs

Synthesis of TNTs was modified by adding ultra-small magnetite nanoparticles Fe3O4 at the stage of washing procedure. Magnetic nanoparticles with an average diameter of about 2 nm were prepared by coprecipitation of Fe2+ and Fe3+ chlorides (in molar ratio 1:2) in ammonium solution directly in the pores of mesoporous silica MCM-41 (Sigma-Aldrich Sp. z o.o., Poznan, Poland). The details of this method and characteristic of the magnetic material are presented in the previous work [54]. It is important to mention that the use of this method of synthesis of ultra-small magnetic nanoparticles Fe3O4 makes it possible to appear of a small fraction of γ -Fe2O3 nanoparticles [54]. The magnetic nanoparticles were extracted from silica by dissolving it in 4 M NaOH (aq.). The solution was sonicated for 60 min and next centrifuged. The supernatant including 2.4 mg of Fe3O4 nanoparticles (determined with the thiocyanate method) was added during the washing procedure, after the hydrothermal process. All next steps were repeated as in the case of titanate nanotubes synthesis. The resulting powder represents the sample denoted as S2.

2.3. Photocatalytic Examination

The photocatalytic activity of TNTs was tested with methylene blue (MB), which is a commonly used substance for that kind of process [55,56]. First, 10 mg of sample (S1, S2) was dispersed in 130 mL of 20 mg/L MB water solution with a pH value of 7 at room temperature. Subsequently, the suspension was mixed (600 rpm) for 60 min in the dark and irradiated with UV light using a high-pressure mercury lamp (Philips, Amsterdam, Holand, 150 W). During the stirring, at various periods, approximately 2 mL of suspension was taken out and centrifuged (14,000 rpm). The absorbance of the supernatant was measured using a UV-Vis spectrophotometer at a certain wavelength λ = 664 nm.

2.4. Measuring Techniques

Titanate nanotubes were investigated with the help of the following measurement techniques:
-
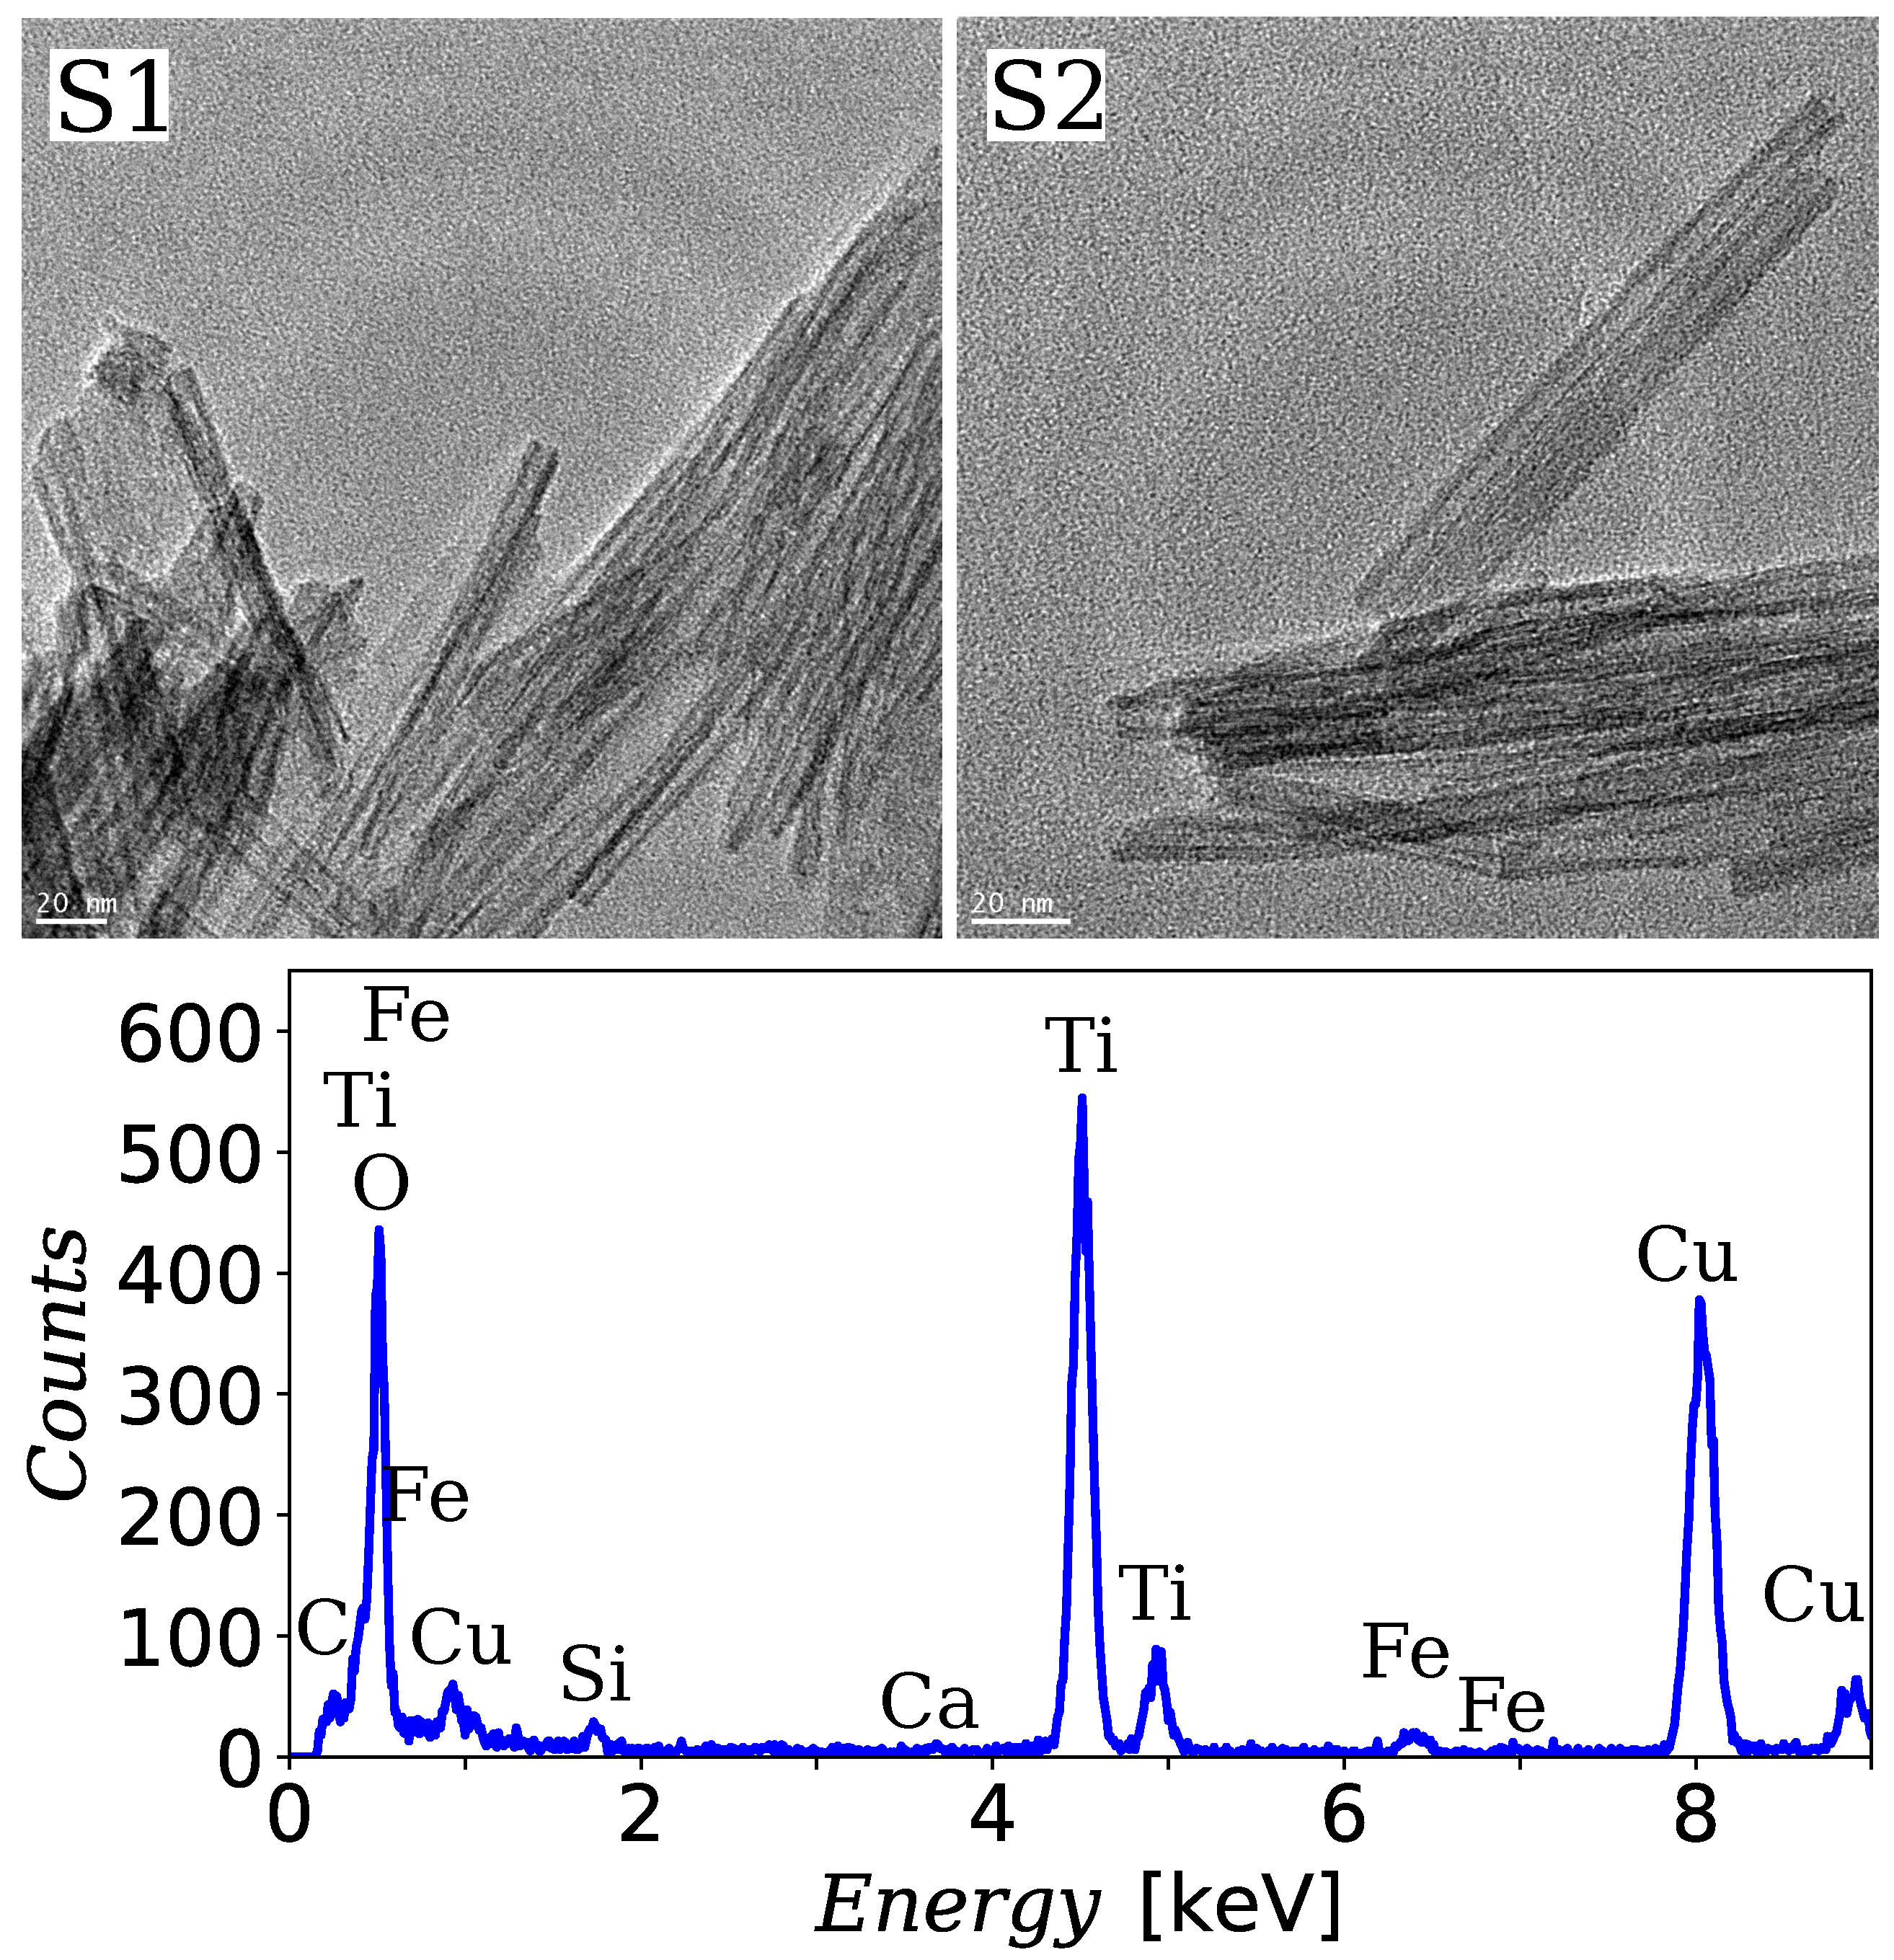
transmission electron microscopy (TEM) by using the Fei Tecnai G2 F20 S Twin transmission electron microscope (Hillsboro, OR, USA) was used,
-
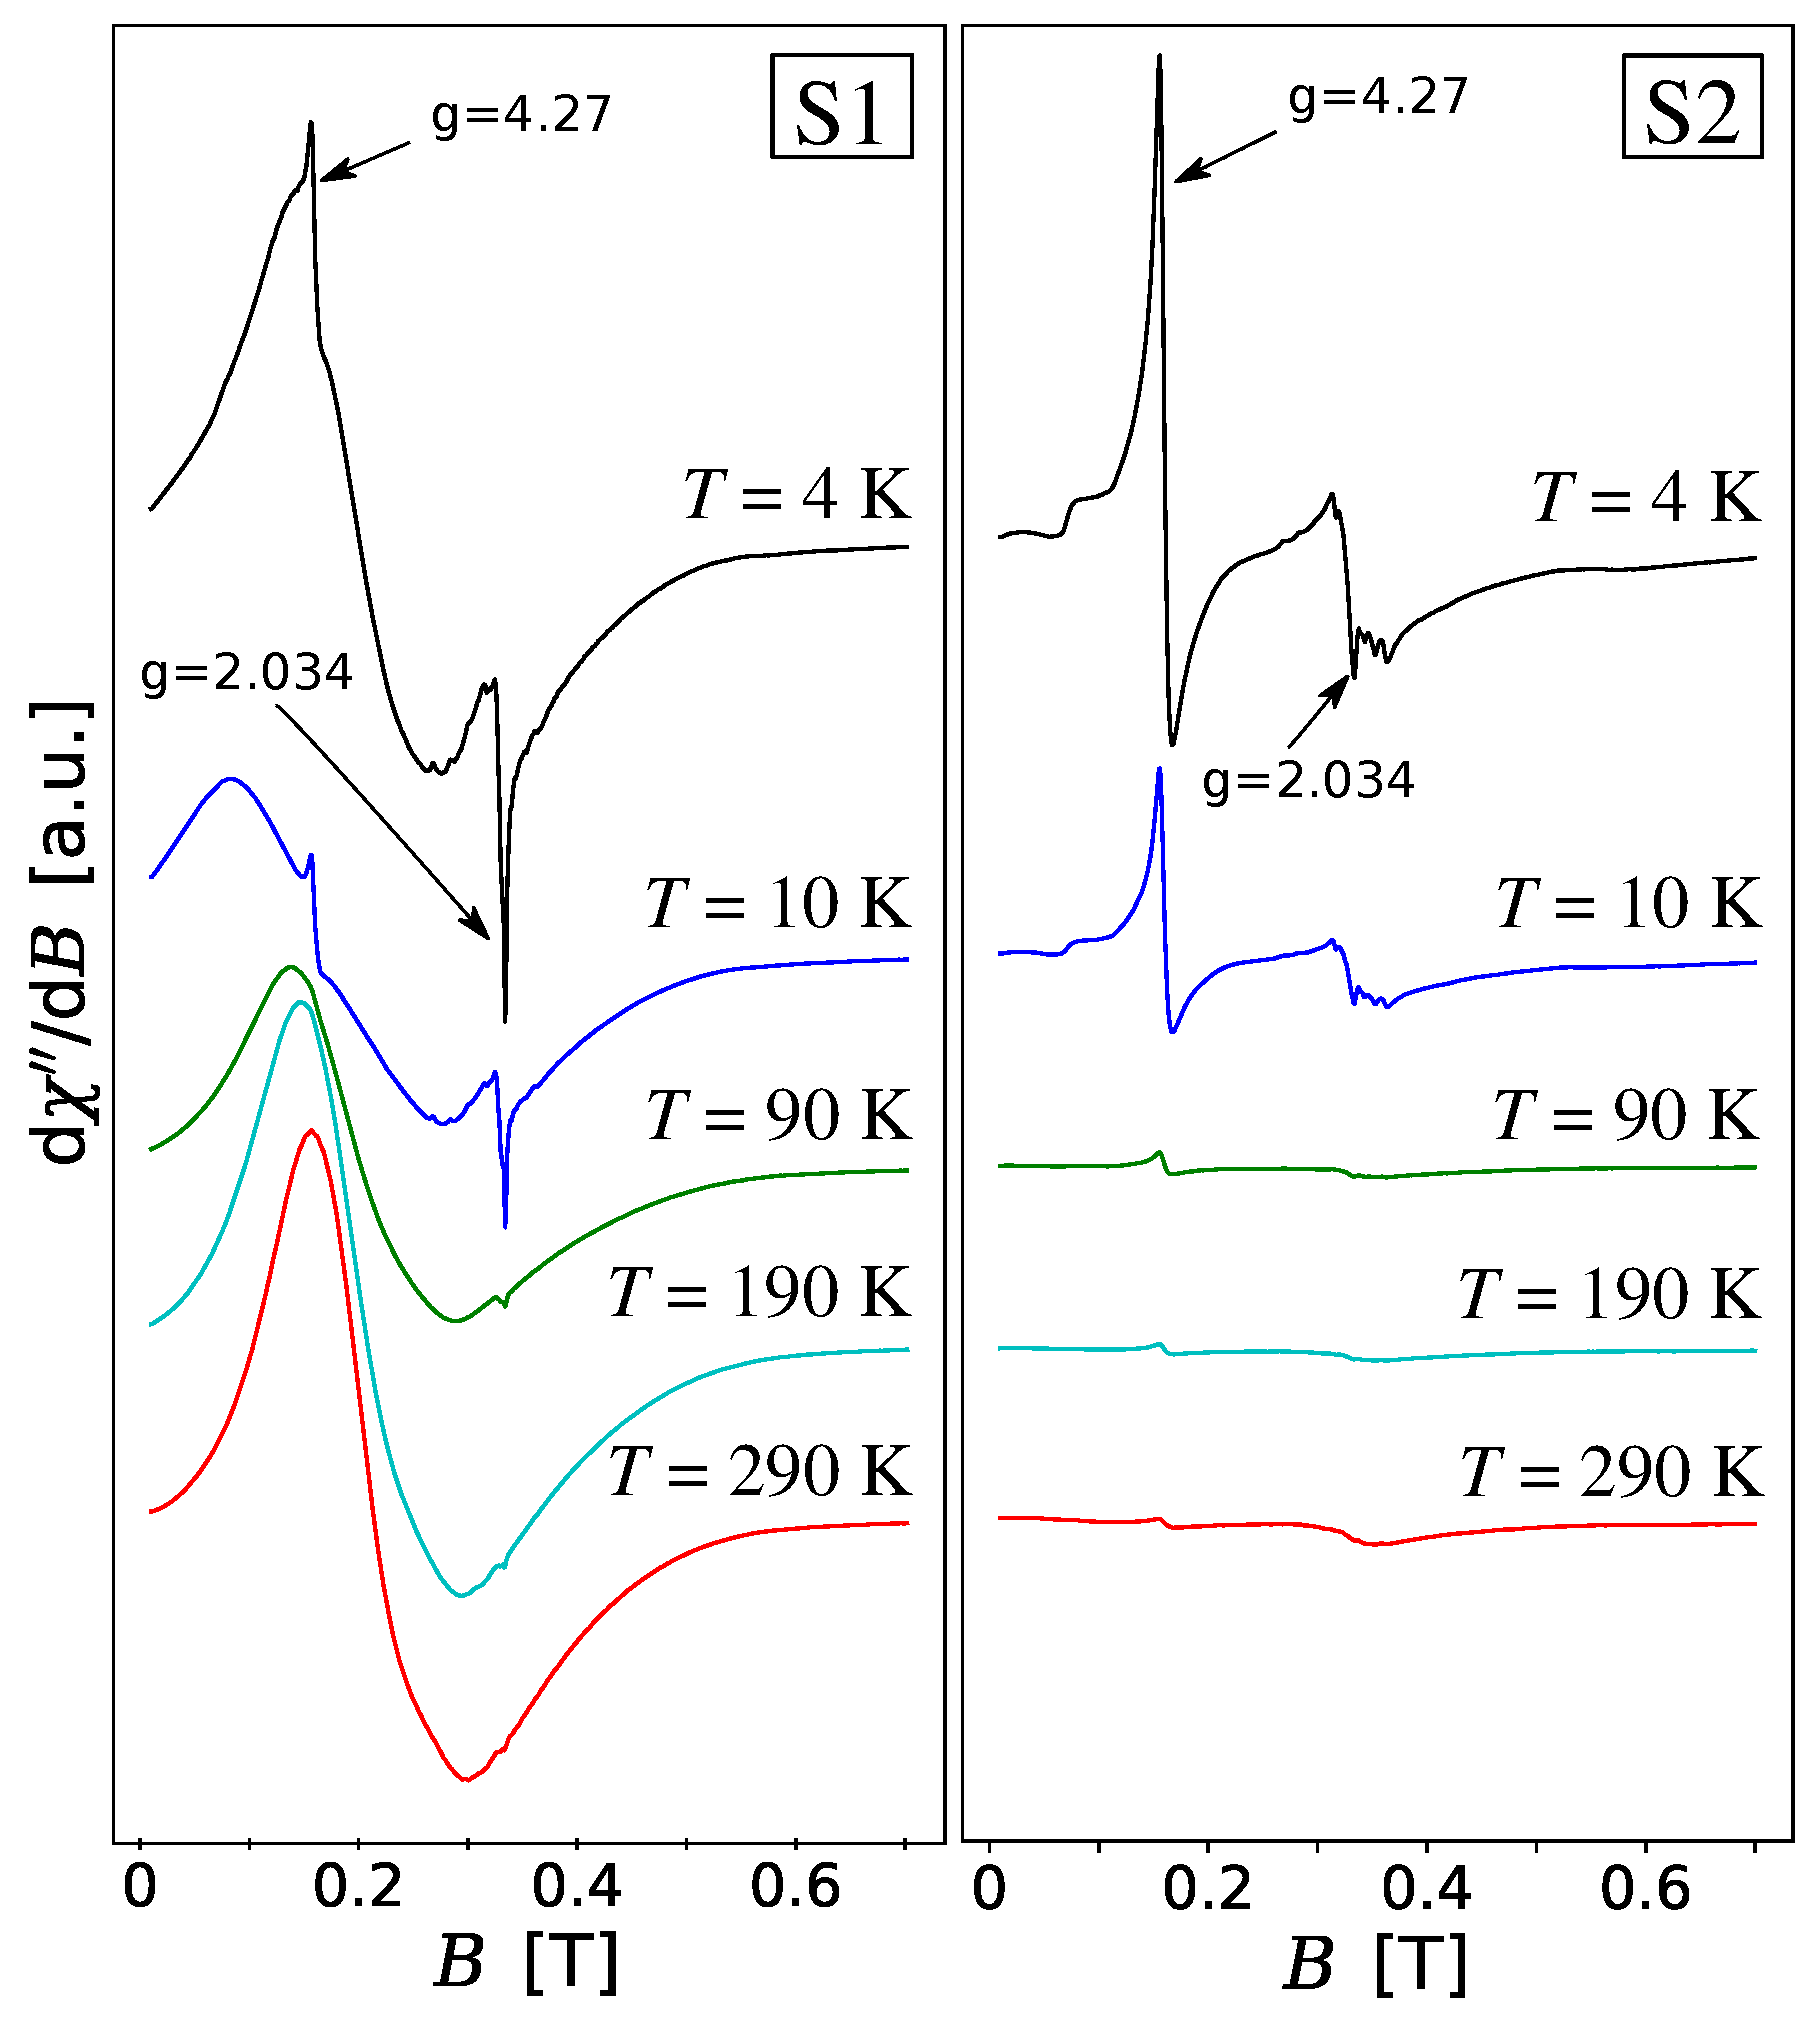
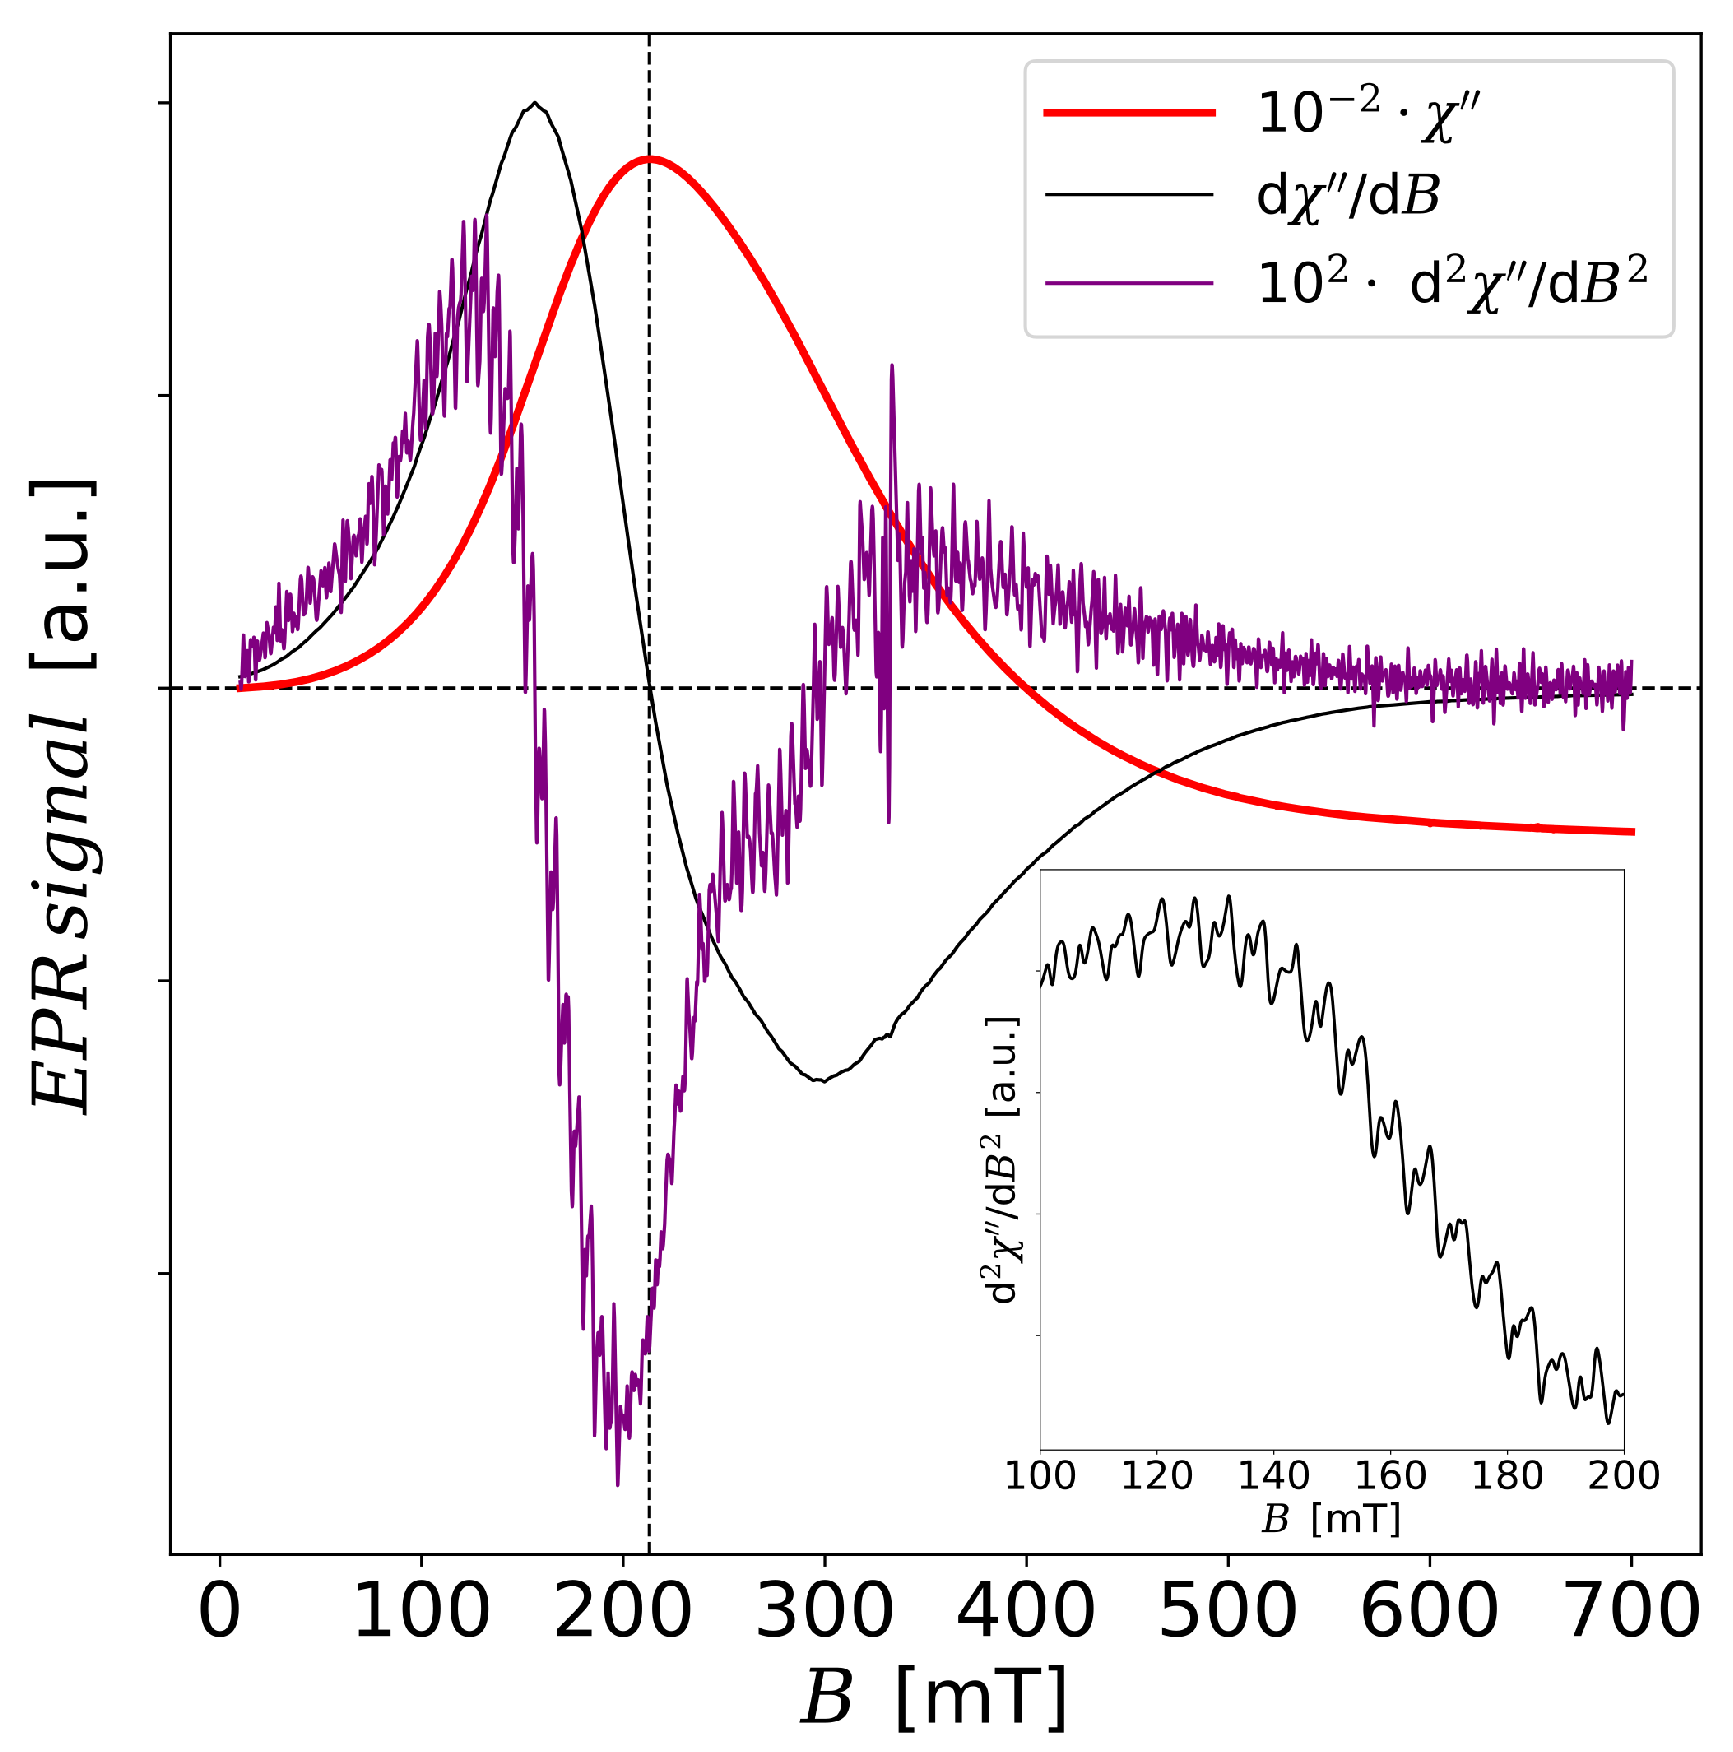
EPR measurements by using the BRUKER E500 EPR spectrometer (Billerica, MA, USA) working at 9.4 GHz (X-band) with 100 kHz magnetic field modulation,
-
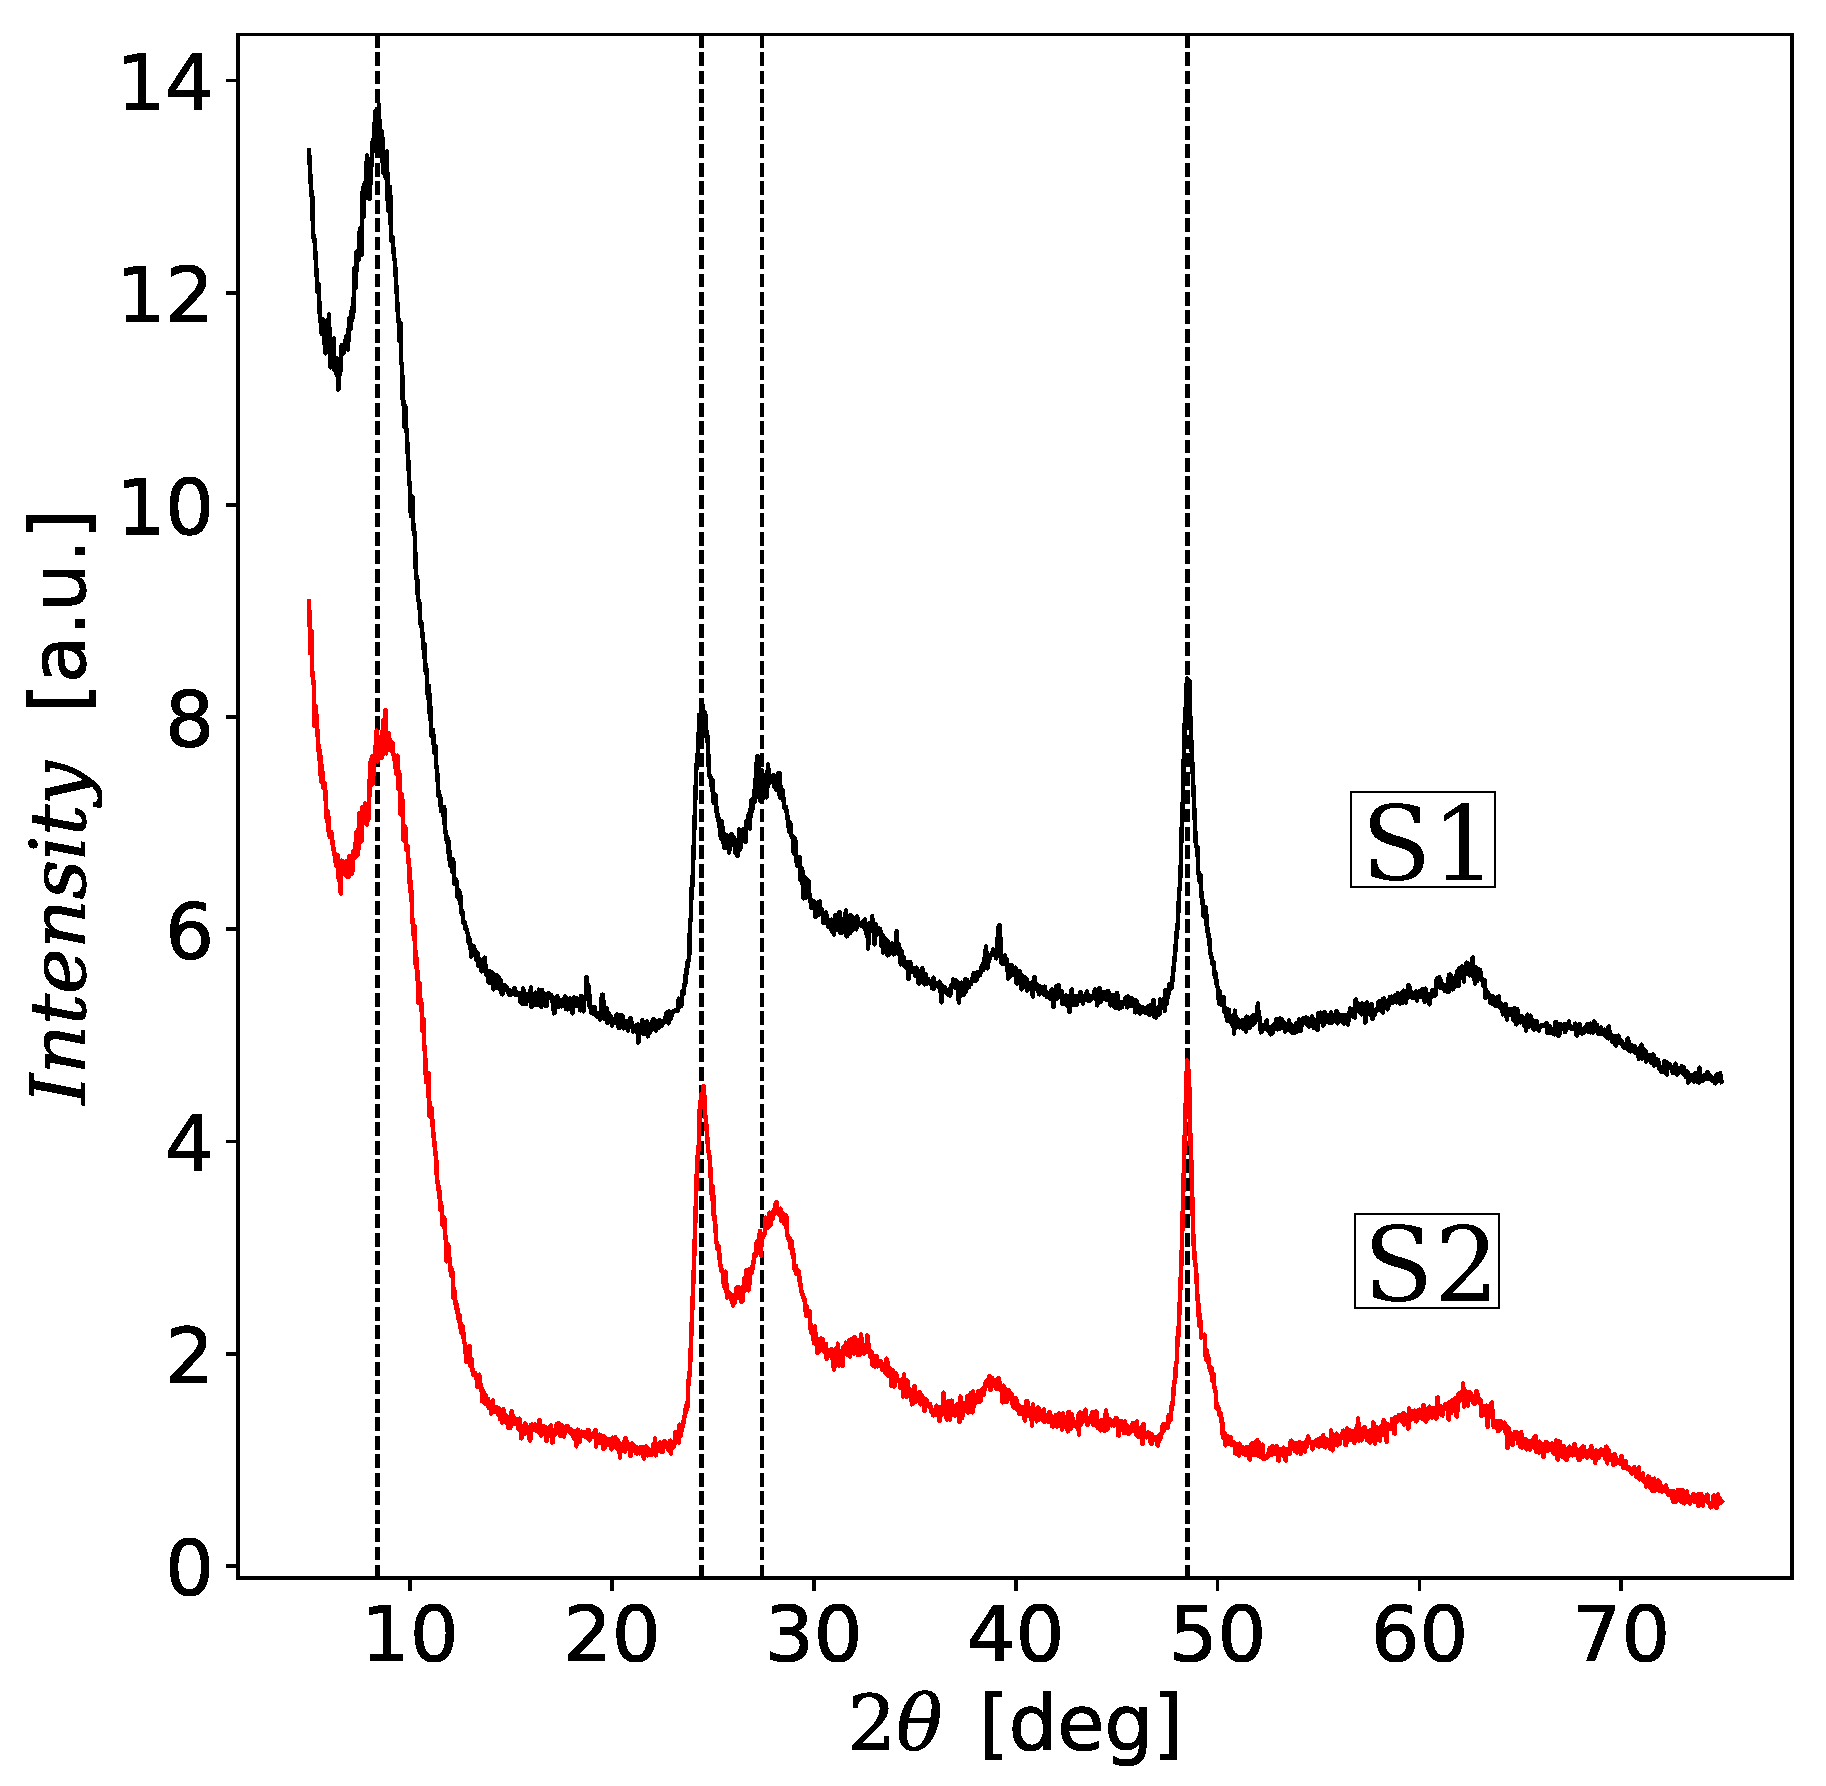
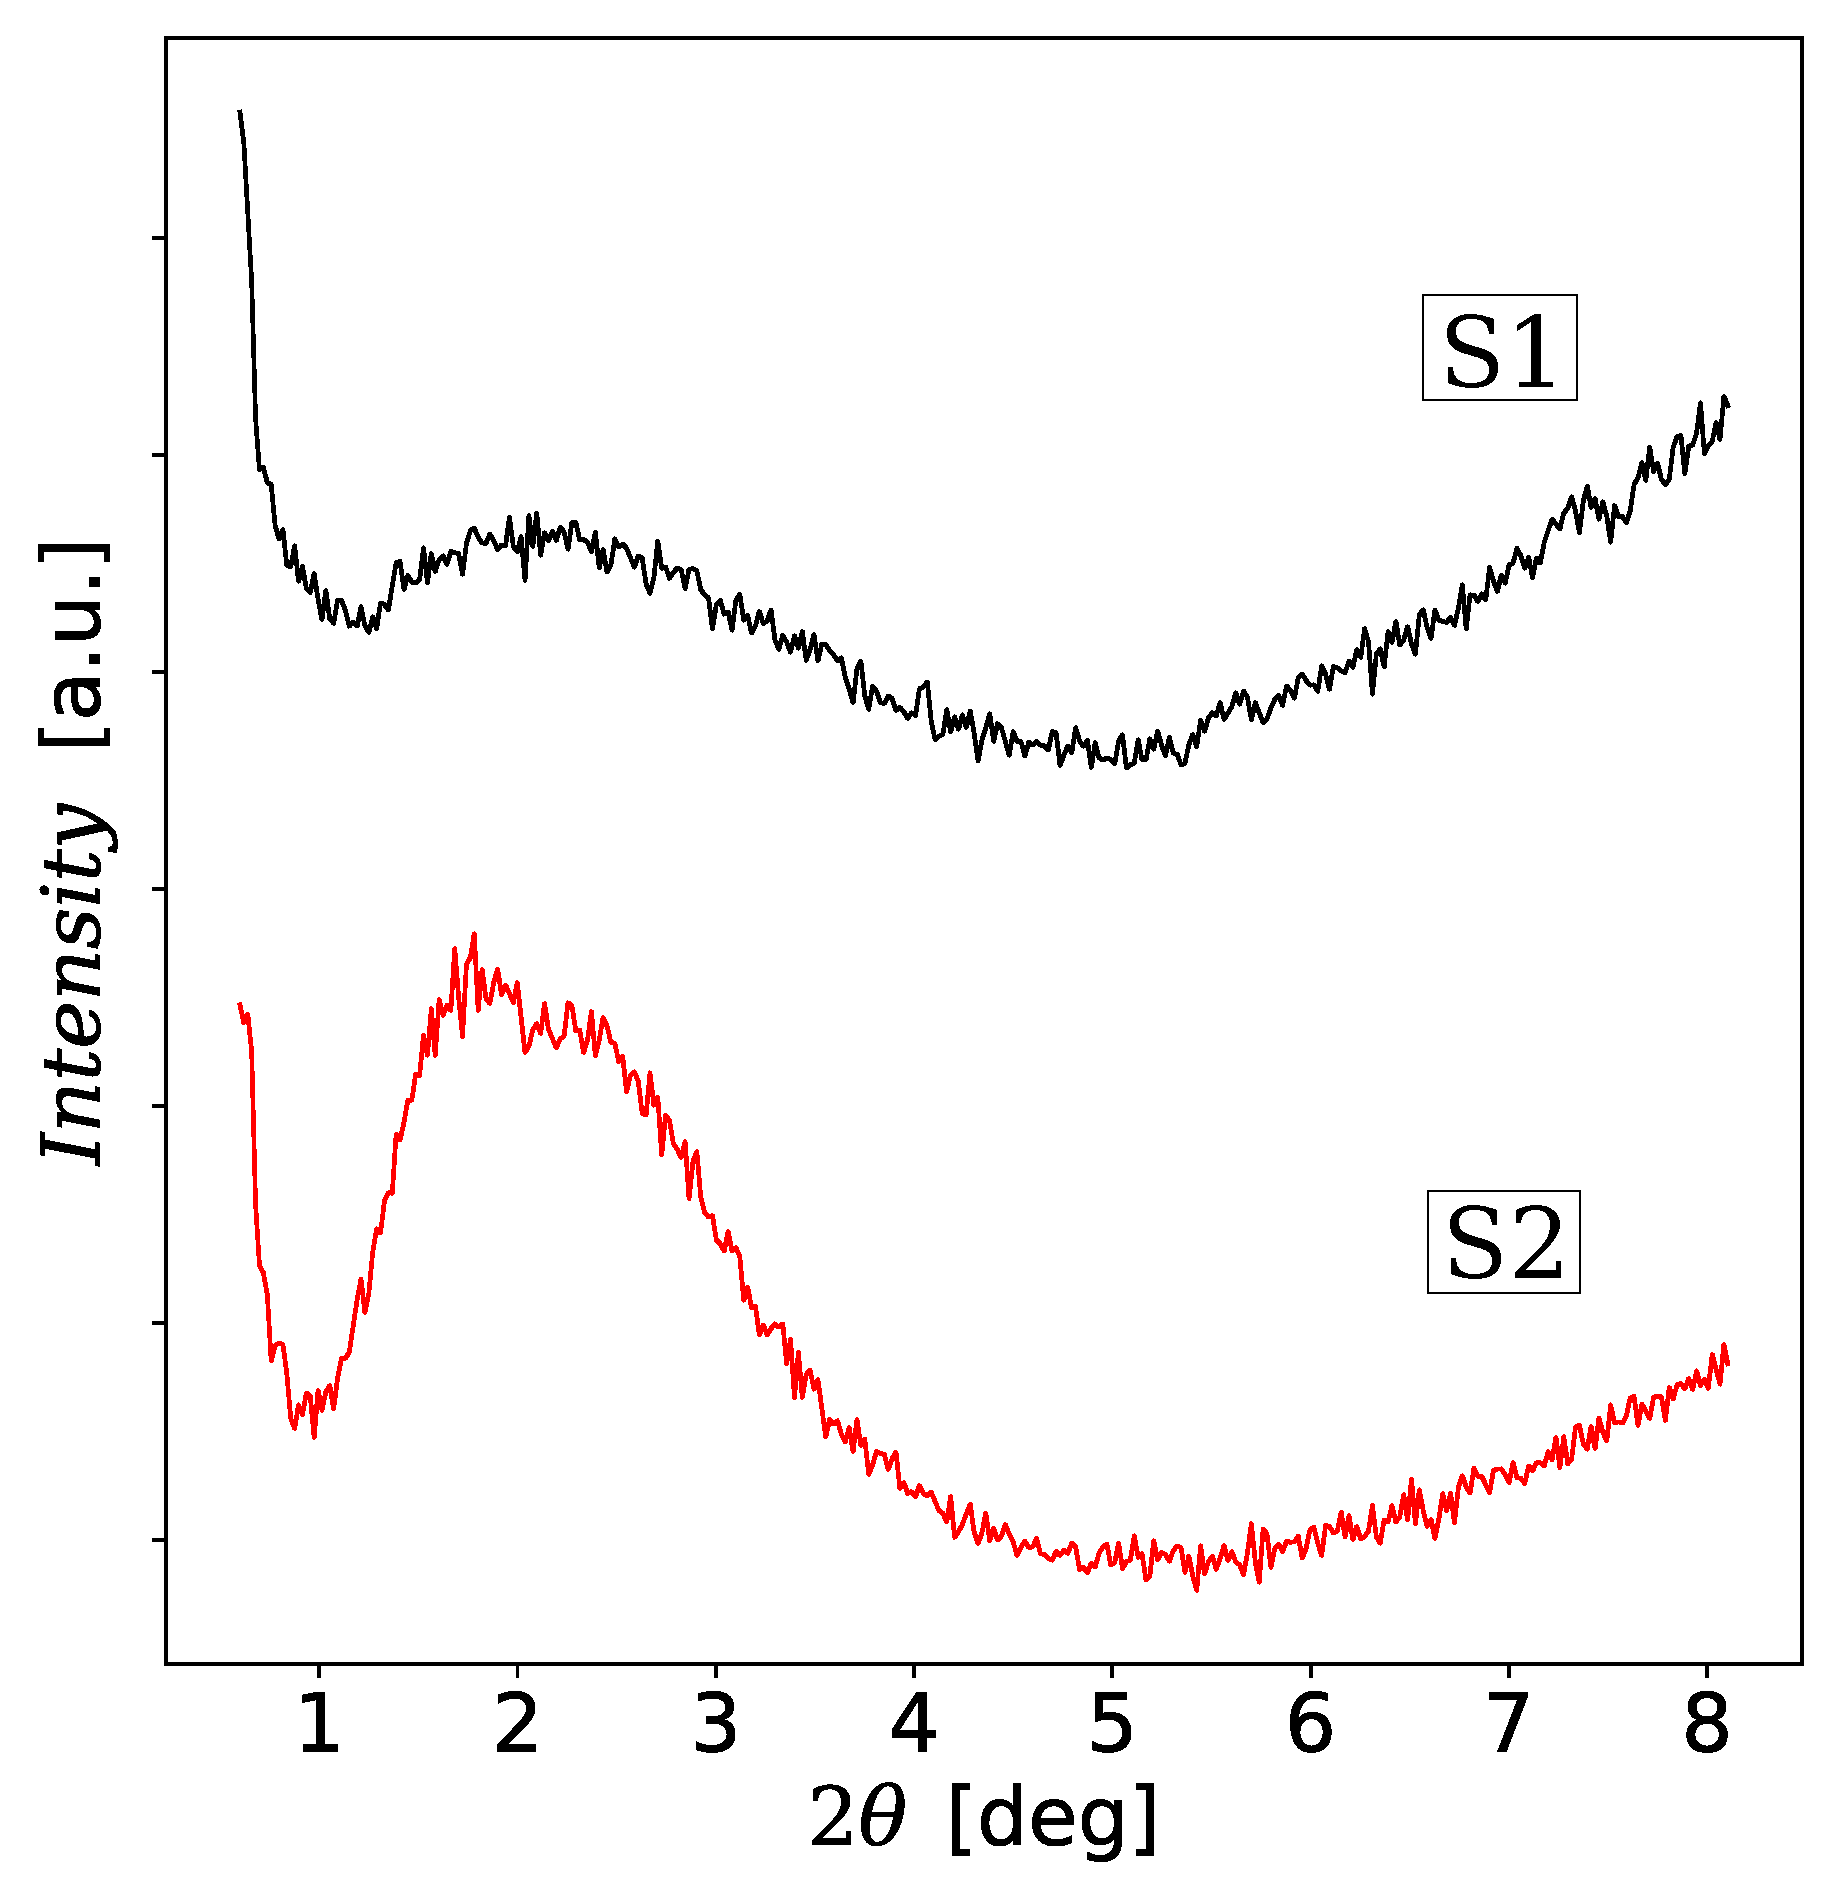
XRD measurements were performed using a Bruker D8 Advance (Billerica, MA, USA) with Johansson monochromator ( λ Cu K ff 1 = 1.5406 Å) and detector LynxEye.
-
dc magnetization was measured using a Quantum Design Magnetic Property Measurements System MPMS XL-7 (Quantum Design Inc, San Diego, CA, USA) with a superconducting quantum interference device magnetometer (SQUID).

3. Results and Discussion

The following subsections present the effect of Fe3+-doping on titanate nanotubes using several measurement methods, TEM/EDS microscopy, electron paramagnetic resonance (EPR), Zero Field Cooled/Field Cooled (ZFC/FC) measurements and the photocatalytic properties of modified nanotubes.

3.1. TEM Analysis

TNT product resulting from the hydrothermally changed TiO2 nanoparticles is represented by an open-ended multiwall tubelike structure with the spiral cross-section. In this study, the outer and inner diameter of the synthesized nanotubes is about 10 nm and 4 nm, respectively. The length of the nanotube can reach about several hundred nanometers. In Figure 1, the representative TEM images of the prepared titanate nanotubes are shown in the case of the sample S1 and S2. Besides, the results of the elemental analysis of sample S2 provided by the TEM microscopy is presented on the bottom panel. TEM images do not show any difference between nanotubes from samples S1 and S2. In particular, the presence of magnetic nanoparticles cannot be seen in the image of the S2 sample. This may suggest that magnetic nanoparticles that were added to the TiO2 material at the stage of the washing procedure simply were absorbed into the structure of the forming nanotubes or they were dissolved in the washing solution. However, the thiocyanate method did not show iron in the supernatant after centrifugation.

3.2. Powder XRD Analysis

Samples S1 and S2 were also analyzed using the wide-range and low-range X-ray diffraction methods (XRD) which are presented in Figure 2 and Figure 3. The XRD patterns in Figure 2 contain characteristic broadened peaks that resemble the XRD pattern of the trititanic acid (H2Ti3O7). The diffraction pattern of S1 is consistent with the studies by Chen et al. [57] for unmodified TNTs. Some differences can be seen between the diffraction spectra for S1 and S2. The largest differences are marked with vertical lines. In particular, the diffraction peak near 2 θ = 10 ° which represents the interlayer distance of TNT is shifted from 2 θ = 8.48 ° for S1 to 8.79° for S2, i.e., the interlayer distance in the modified TNT decreased. This result is opposite to the observation of the increase in the distance between the interlayer layers of Fe-TNT prepared by the method published in paper [37]. However, in the paper [37] no hydrochloric acid solution was used during the washing procedure, which is crucial for the degradation of iron oxide nanoparticles, which become a source of embedded iron ions. Consequently, we also did not observe additional peaks at 2 θ near 33.6°, 35.6°, 40.0°, 44.7°, 62.5° and 64.0° evident in XRD pattern for Fe-TNTs which were assigned to α-Fe2O3 phase [37]. It should be noted that the low-range XRD patterns in Figure 3 also do not show the evidence for loading magnetic nanoparticles into the interior pore structure of TNT. The intensity of the main diffraction peak increased instead. This could mean that there are fewer defects, e.g., in the form of not fully formed nanotubes. All this suggests that the magnetic nanoparticles have degraded during the washing stage of the hydrothermal synthesis giving a contribution to Fe3+ substitutional ions doping TNT.

3.3. EPR Analysis

The electron paramagnetic resonance (EPR) investigations on TiO2 based materials have been carried out for many years [58,59,60]. EPR is a spectroscopic method used to detect unpaired electrons in materials. Commonly studied defects in TiO2 by this method are oxygen vacancies, interstitial titanium ions and impurities. The most common impurities in TiO2 are Fe3+, Cr3+, Cu2+ and Mn2+. In Figure 4, the EPR spectra for samples S1 and S2 have been shown in a wide temperature range from 4 K to 290 K. At low temperatures, two main EPR signals from isolated defects with Fe3+ ions and oxygen vacancies are very clearly visible. The intense signal on the left with g-factor equal to 4.27 (resonance field B 158 mT) suggests the existence of Fe3+ substitution ions for Ti4+ whereas the EPR signal with g = 2.034 (resonance field B 332 mT) can be due to Fe3+ ions coupled by exchange interaction with oxygen vacancies. For both samples, the location of the signal Fe3+ does not depend on temperature, but its intensity does. At low temperatures, Cu+2 impurities are well visible on both samples S1 and S2. Their EPR signals have a characteristic hyperfine structure which does not affect the main peaks and which provides g-factor values of approximately 2.5, 2.4 2.3, 2.1 with A 15 mT. The additional six signals with A 9 mT around the line with g = 2.034 are also evident at low temperatures on both samples S1 and S2. They result from the oxygen vacancies with trapped electrons and they may originate from the other electron trapping sites. The analogous six signals around the line with g = 2.034 were observed in [61] for TiO2 and Fe-TiO2-delaminated clays. It was suggested that they result from the hyperfine interactions between trapped electrons and titanium nuclei. The question arises whether these six signals can be caused by Mn2+ impurities which can often be found in TiO2 materials. However, in this case, A 11 mT instead of the observed value of about 9 mT. Example of research with the use of EPR analysis of hydrothermally synthesized Mn2+-doped titanate nanotubes can be found in paper [42].
The shape of EPR spectral lines measured for samples S1 and S2 changes with temperature but they are qualitatively different. The absorption line derivatives measured for sample S1 at higher temperatures become similar to the spectrum typical for a system with ferromagnetic interactions. It can be observed that the absorption peak ( χ ) is transforming into one broad peak with a maximum in B 213 mT where g 3.17 . It represents a multimodal signal as seen in Figure 5 using the second derivative from the absorption line d 2 χ /d B 2 . These peaks are located centrally on two main lines with g = 4.27 and g = 2.034 in a form of two series of peaks where the distance between the neighboring peaks is equal to about 6 mT. The presence of these equidistant signals suggests the appearance of structural defects in nanotubes. Probably they arise during the washing process in the hydrothermal method when titanate flakes undergo conversion into the multilayer nanotubes with a spirallike crossection. The nanotubes in sample S1 show a room temperature ferromagnetism which can be observed also for the values of the magnetic field B in the region of the main EPR resonances (see Section 3.4). In consequence, the additional demagnetization field B d should be included in the magnetic resonance condition, i.e., h ν = g μ B ( B + B d ) . In the particular case of a long cylinder and magnetic field B oriented in the z-direction B d = 2 π M z where M z denotes sample magnetization in z-direction. The presence of the equidistant EPR signals would mean the presence of the fractions of the correlated spins giving a collective contribution to nanotube magnetization. We should note that sample S2 also shows the ferromagnetic behavior at room temperature. However, for the values of B near EPR resonances, the sample is paramagnetic (see Section 3.4). The resulting EPR signal is noisy but it does not show the periodicity observed in S1. Two main resonance lines with g = 4.27 and g = 2.034 are well distinguished also at higher temperatures.

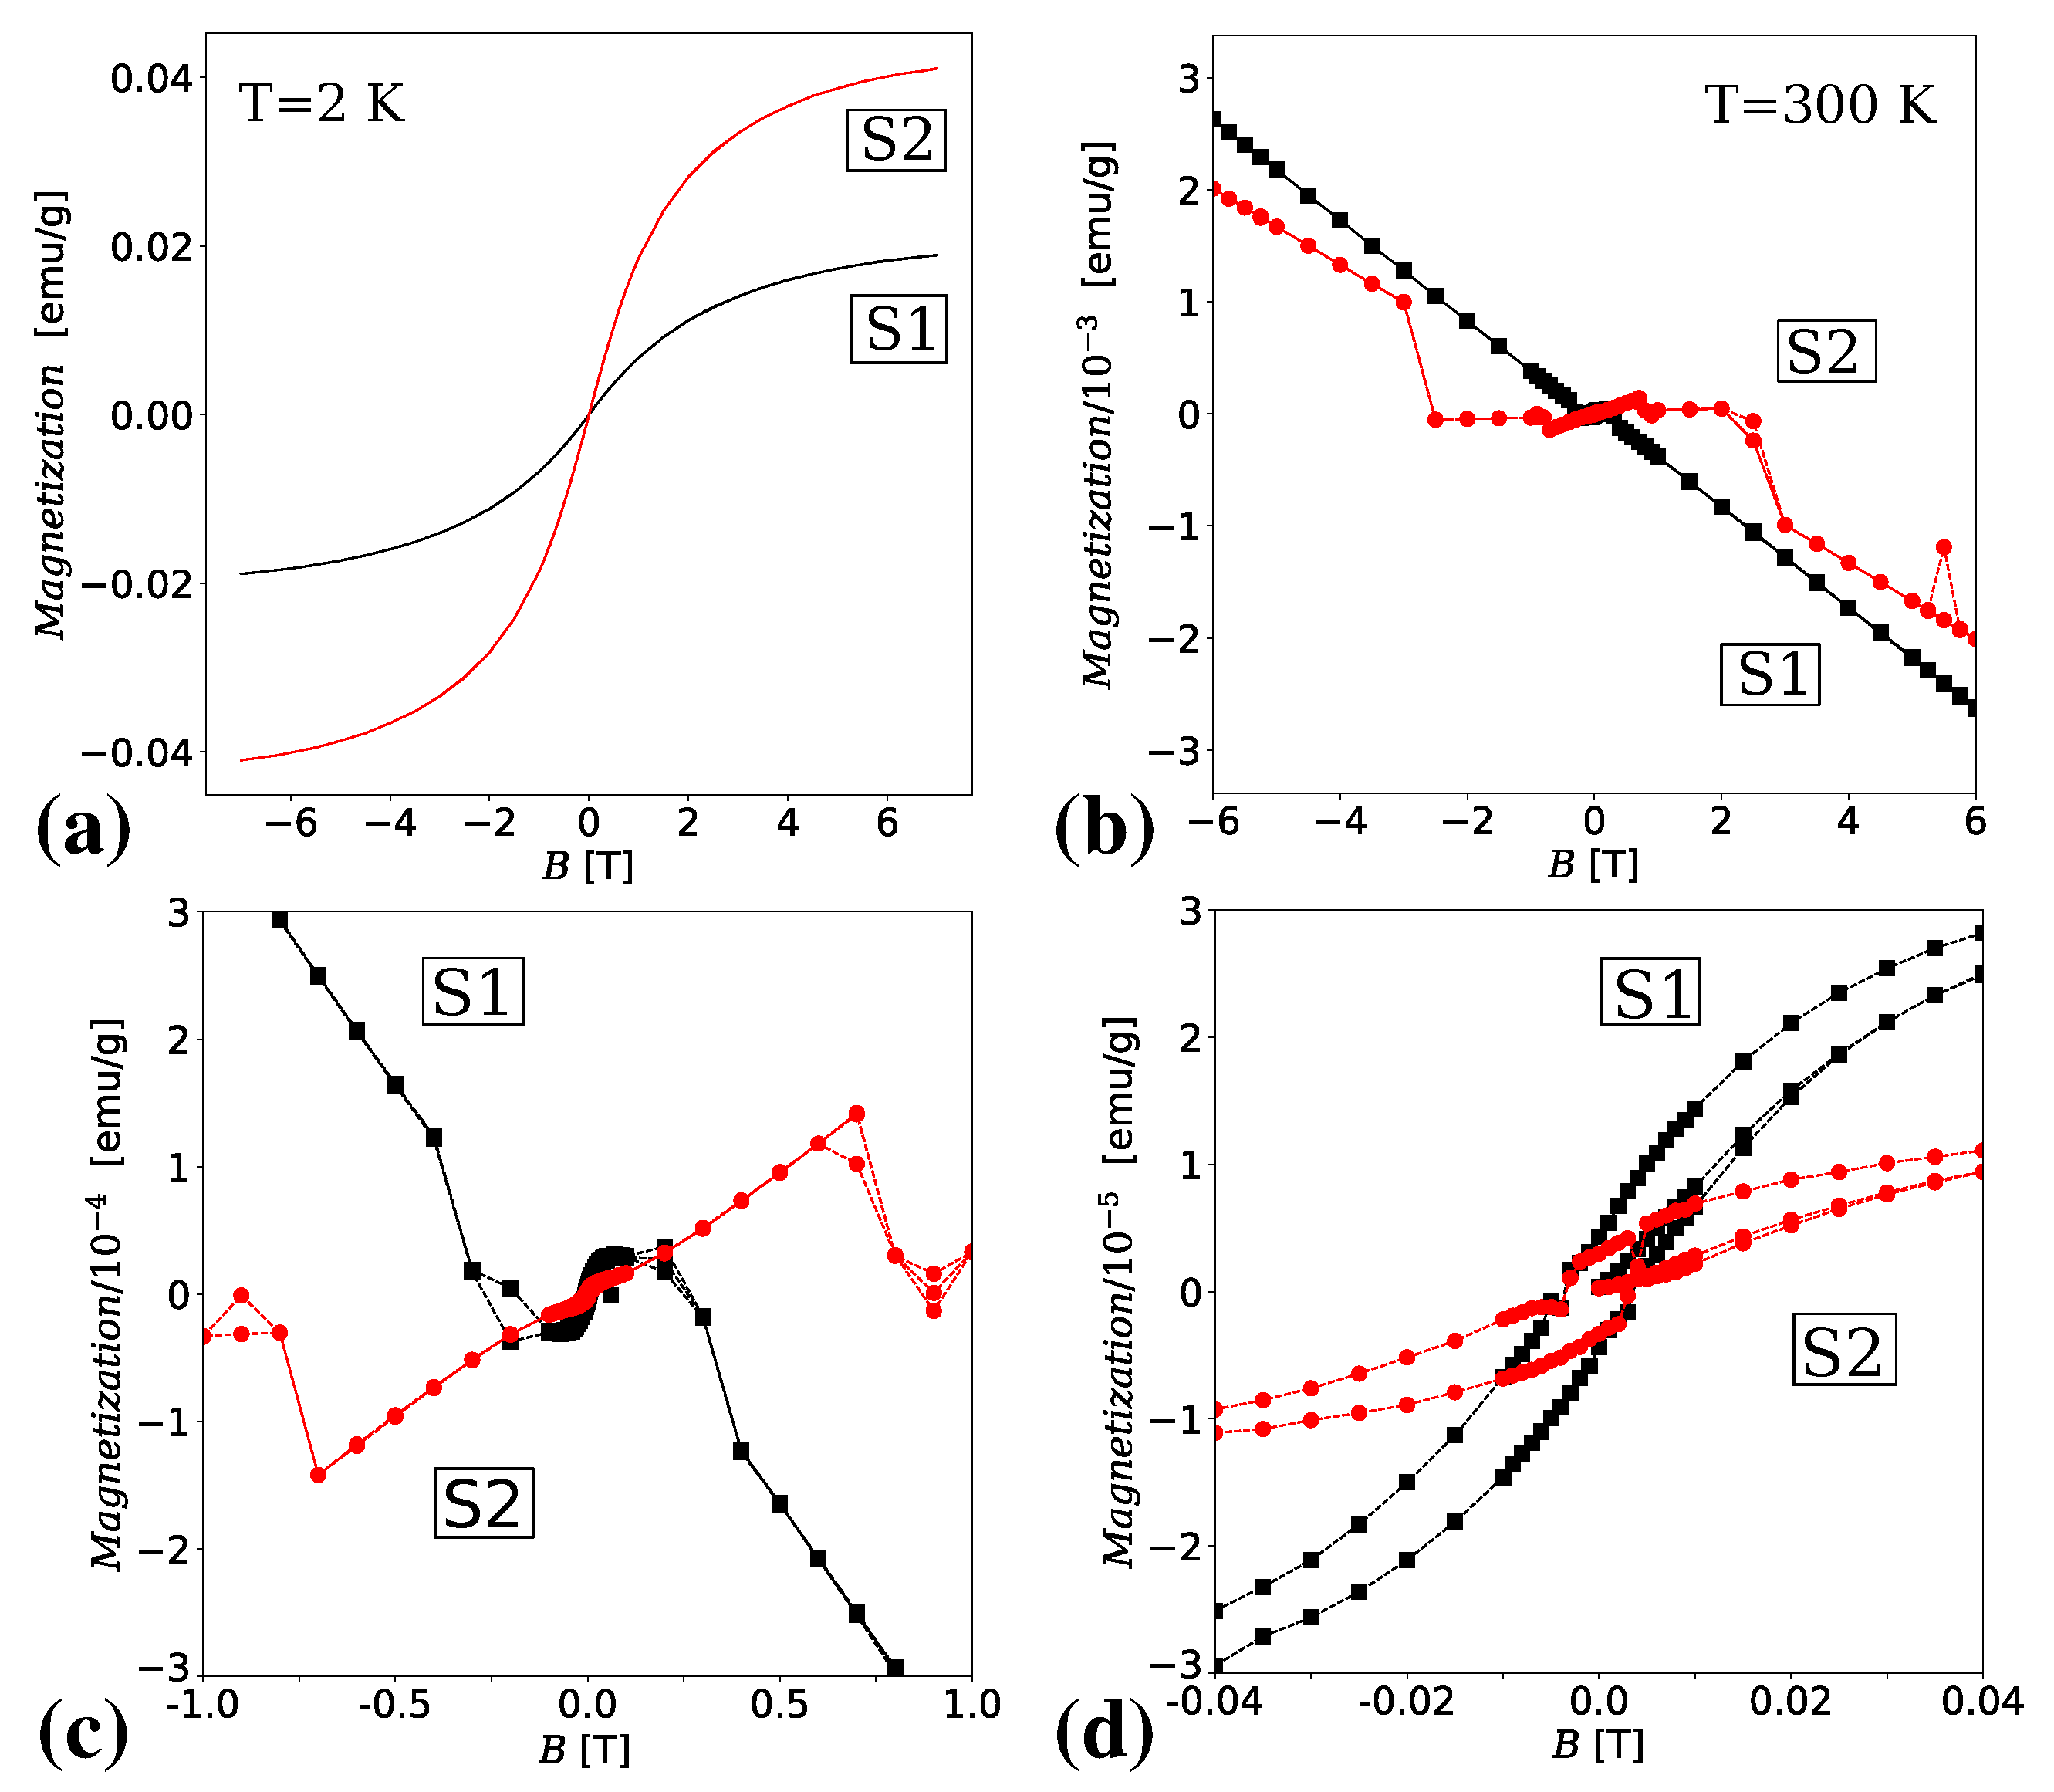
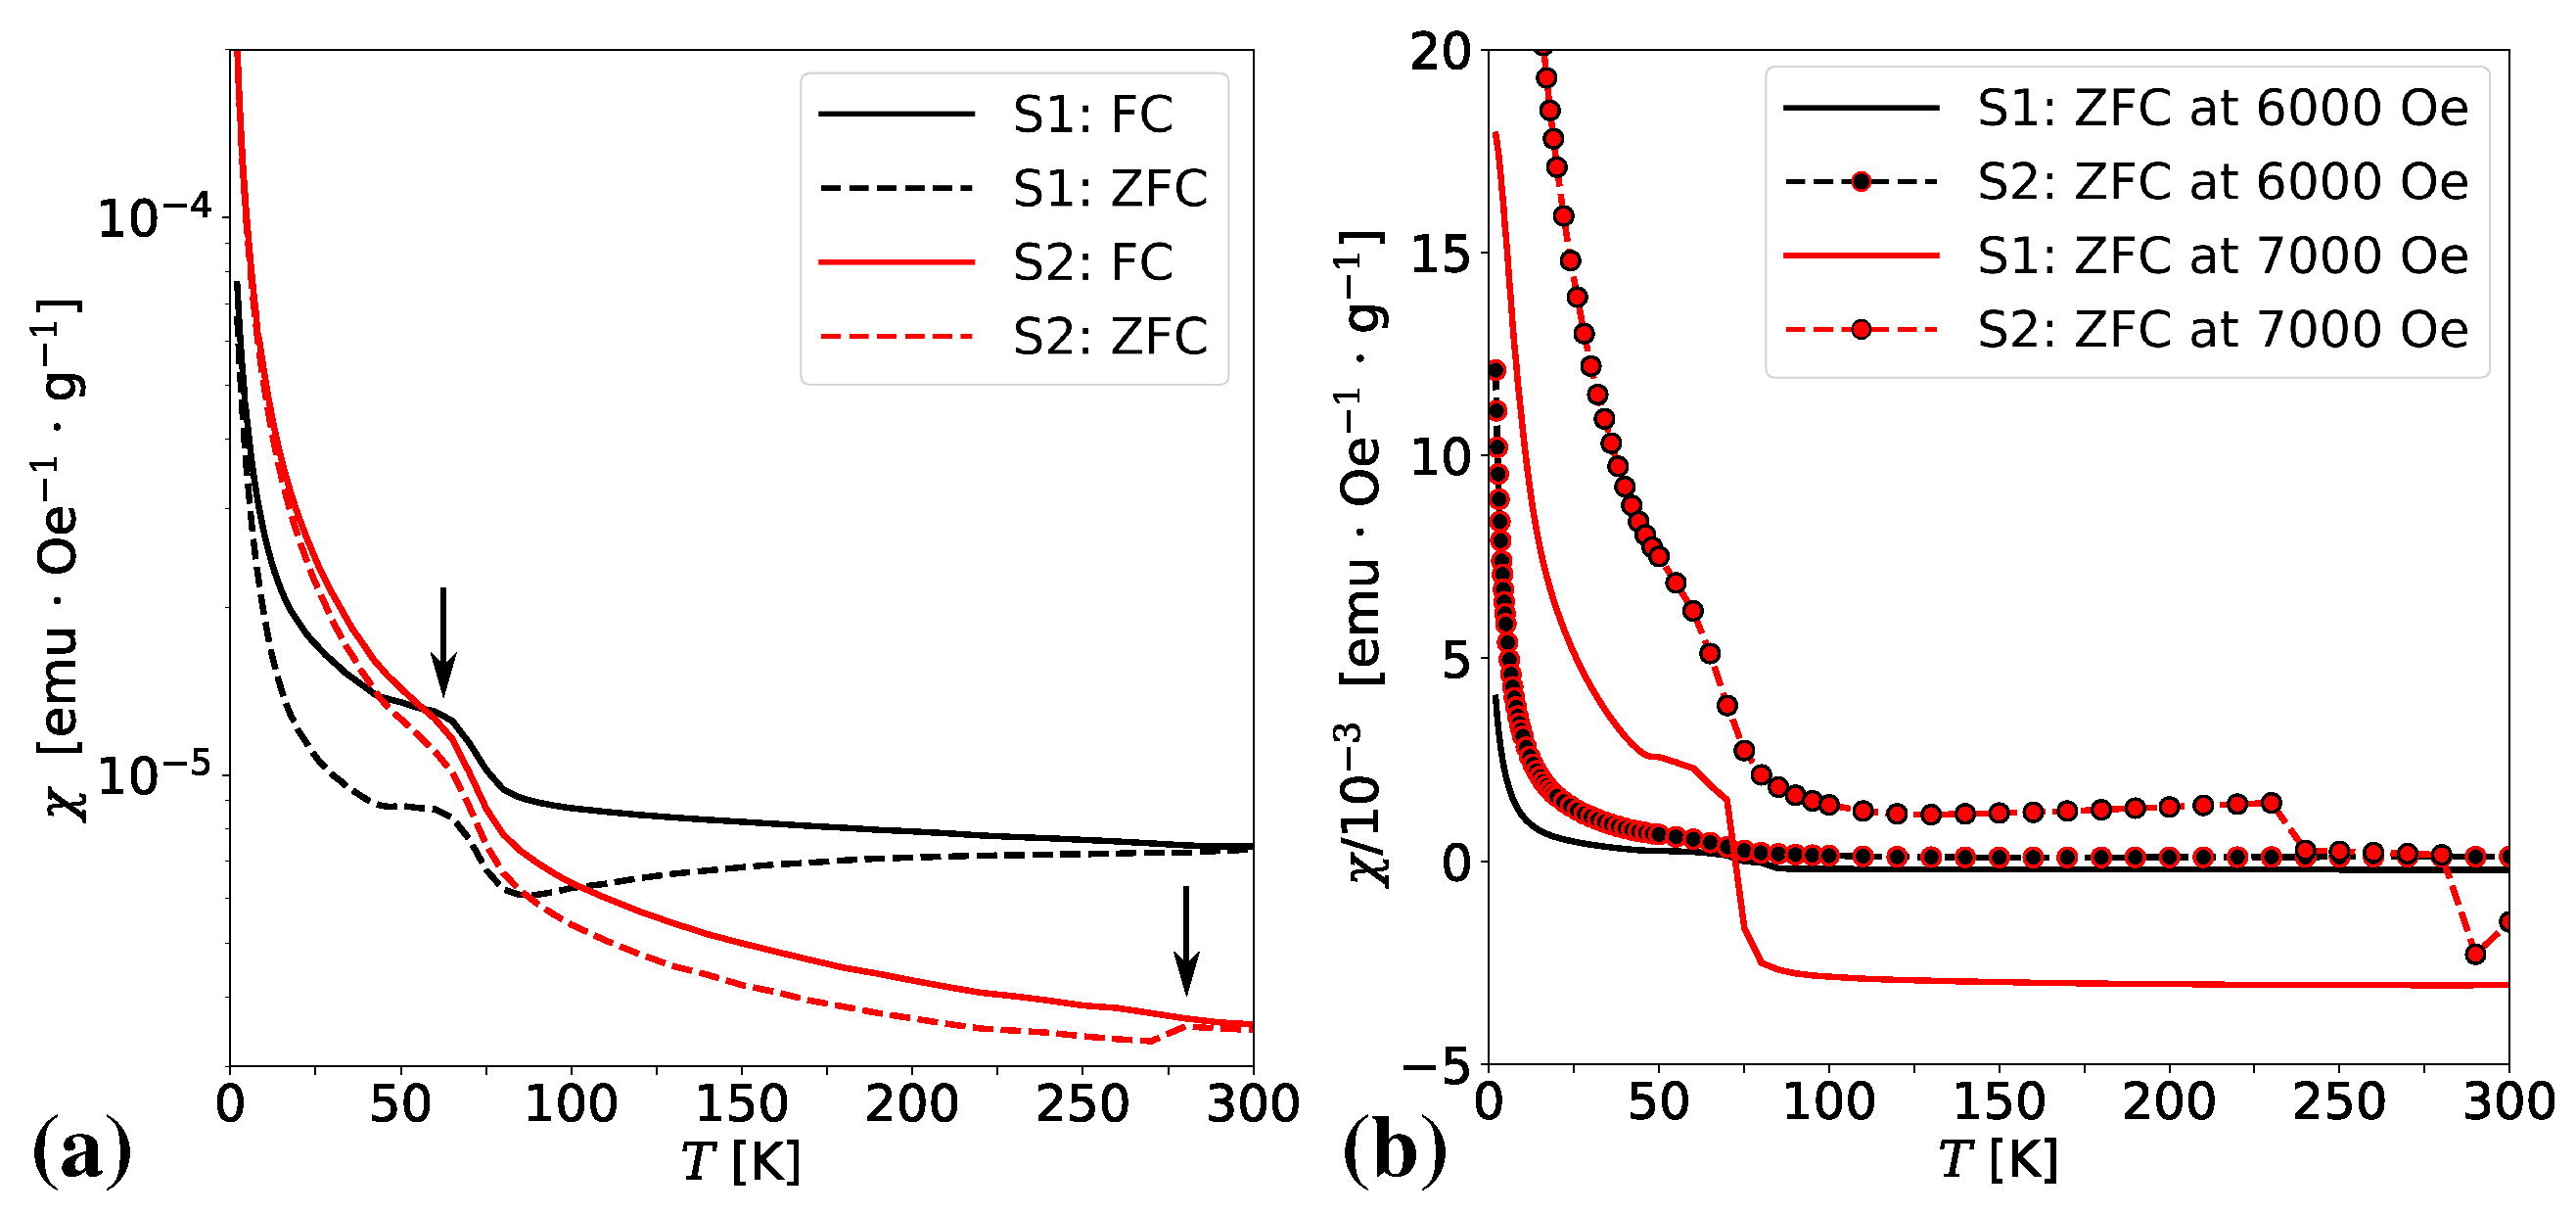
3.4. Magnetic Properties

Magnetic properties of S1 and S2 samples at temperatures T = 2 K and T = 300 K are shown in Figure 6 through the plots of their magnetization as a function of the external dc magnetic field B. These plots suggest paramagnetic properties at low temperatures (no hysteresis loop) for both samples. If we compare magnetization in sample S2 with the magnetization of 2 nm magnetic nanoparticles Fe3O4 in mesoporous silica (see Figure 6 in paper [54]), it can be seen that the magnetization values per gram for S2 are smaller by two orders of magnitude in the examined magnetic field range. This is one more confirmation explaining the lack of magnetic nanoparticles in TEM images for S2. However, the magnetization of TNTs in S2 is about twice as high at T = 2 K compared to S1.
It is evident from panel (b) in Figure 6 that the magnetic properties of S1 and S2 at room temperature are much more complex. Both samples show diamagnetic response to the high value of the external magnetic field. However, they show different behavior for low field values. In the case of S1 the diamagnetic response to the applied magnetic field is changed to the ferromagnetic one for a weak magnetic field with the values of B ranging from −300 mT to 300 mT. However, there can be observed two different ferromagnetic responses for the values of B from −100 mT to 100 mT and beyond these values. The ferromagnetic behavior can be observed also in the case of sample S2 but it is preceded by two different paramagnetic responses to the applied magnetic field with the values in the regions of B ± 0.5 T and B ± 2 T. The magnified fragment of the hysteresis loop diagram for S2 in panel (d) shows discontinuity. Note its absence in sample S1. The discontinuous magnetic response to the applied magnetic field is also suggested in Figure 7 where semi-logarithmic plots of zero-field-cooling (ZFC) and field-cooling (FC) magnetic susceptibilities were shown for samples S1 and S2. The semi-logarithmic scale was used to simultaneously show details of the ZFC/FC relationship for samples S1 and S2. Right arrow around T 270 K suggests a first-order phase transition. Its origin can be the antiferromagnetic superexchange interaction between Fe3+ ions by analogy to the ordering mechanism in hematite (α-Fe2O3) [62].
Panel (a) in Figure 7 shows the temperature dependence of ZFC and FC magnetic susceptibility plots at a magnetic field equal to 0.01 T (100 Oe) with the evident splitting between ZFC and FC curves. For both samples S1 and S2, qualitatively the same behavior below the temperature of about 70 K (pointed by the left arrow) can be observed, i.e., a sharp increase in the magnetic susceptibility of both ZFC and FC. This property usually applies to paramagnetic systems and is a surface effect. In the case of samples S1 and S2, it is the surface effect on the non-interacting magnetic moments suggesting the presence of a paramagnetic phase. Applying stronger magnetic fields to the system causes the ZFC and FC curves to overlap. Panel (b) in Figure 7 shows the dependence of ZFC/ FC magnetic susceptibility on temperature for large magnetic field values equal to 0.6 T and 0.7 T, respectively. The temperature T 70 K becomes a transition temperature between a paramagnetic response to the applied magnetic field and diamagnetic one of sample S1.
Since the discovery of room temperature ferromagnetism in Co-doped TiO2 thin films [63] understanding the causes of ferromagnetism in TiO2 materials is a subject of lively discussion [64,65,66,67,68,69]. The hysteresis loop diagram for S1 resembles the results obtained in paper [70] for TiO2 single crystals annealed in a high vacuum where the investigated samples were diamagnetic at room temperature with a characteristic low-field ferromagnetic behavior. In paper [70], it was concluded that the unpaired 3d electrons in Ti3+ ions can be responsible for the observed room temperature ferromagnetism. In sample S1, a similar mechanism can explain its ferromagnetic properties at a weak magnetic field. The appearance of the equidistant signals on EPR spectral lines with g-factors equal to 4.27 and 2.034 can suggest the presence of defects caused by the nanotubular form of TNT.
The magnetic properties of ion-doped titanate nanotubes strongly depend on the method of their preparation and the type of ions used. For example, Fe3+-doping method presented in [34] yields hysteresis loops suggesting both paramagnetic and ferromagnetic contributions, the Co-doped titanate nanotubes in [41] show room temperature ferromagnetism, Gd3+-doped titanate nanotubes in [43] show low-temperature paramagnetism, Mn2+-doped titanate nanotubes in [42] show room temperature ferromagnetism.
The modified titanate nanotubes exhibiting room temperature ferromagnetism, cause interest in the applications of them in spintronics, e.g., Co-doped nanotubes [41]. Another potential field to be used in applications is the exploitation of the magnetocaloric potential of the modified nanotubes. The particular example can be the Gd3+-doped titanate nanotubes which were suggested in [43] to be used as a magnetic refrigerant in the temperature range from 5 to 100 K. In the case of S2 nanotubes, their magnetic properties at room temperature are more promising for potential magnetocaloric applications. This may be suggested by the results of the magnetization measurements in Figure 6 which show that a small value of the applied field can change the type of magnetic response from paramagnetic to ferromagnetic and vice versa.

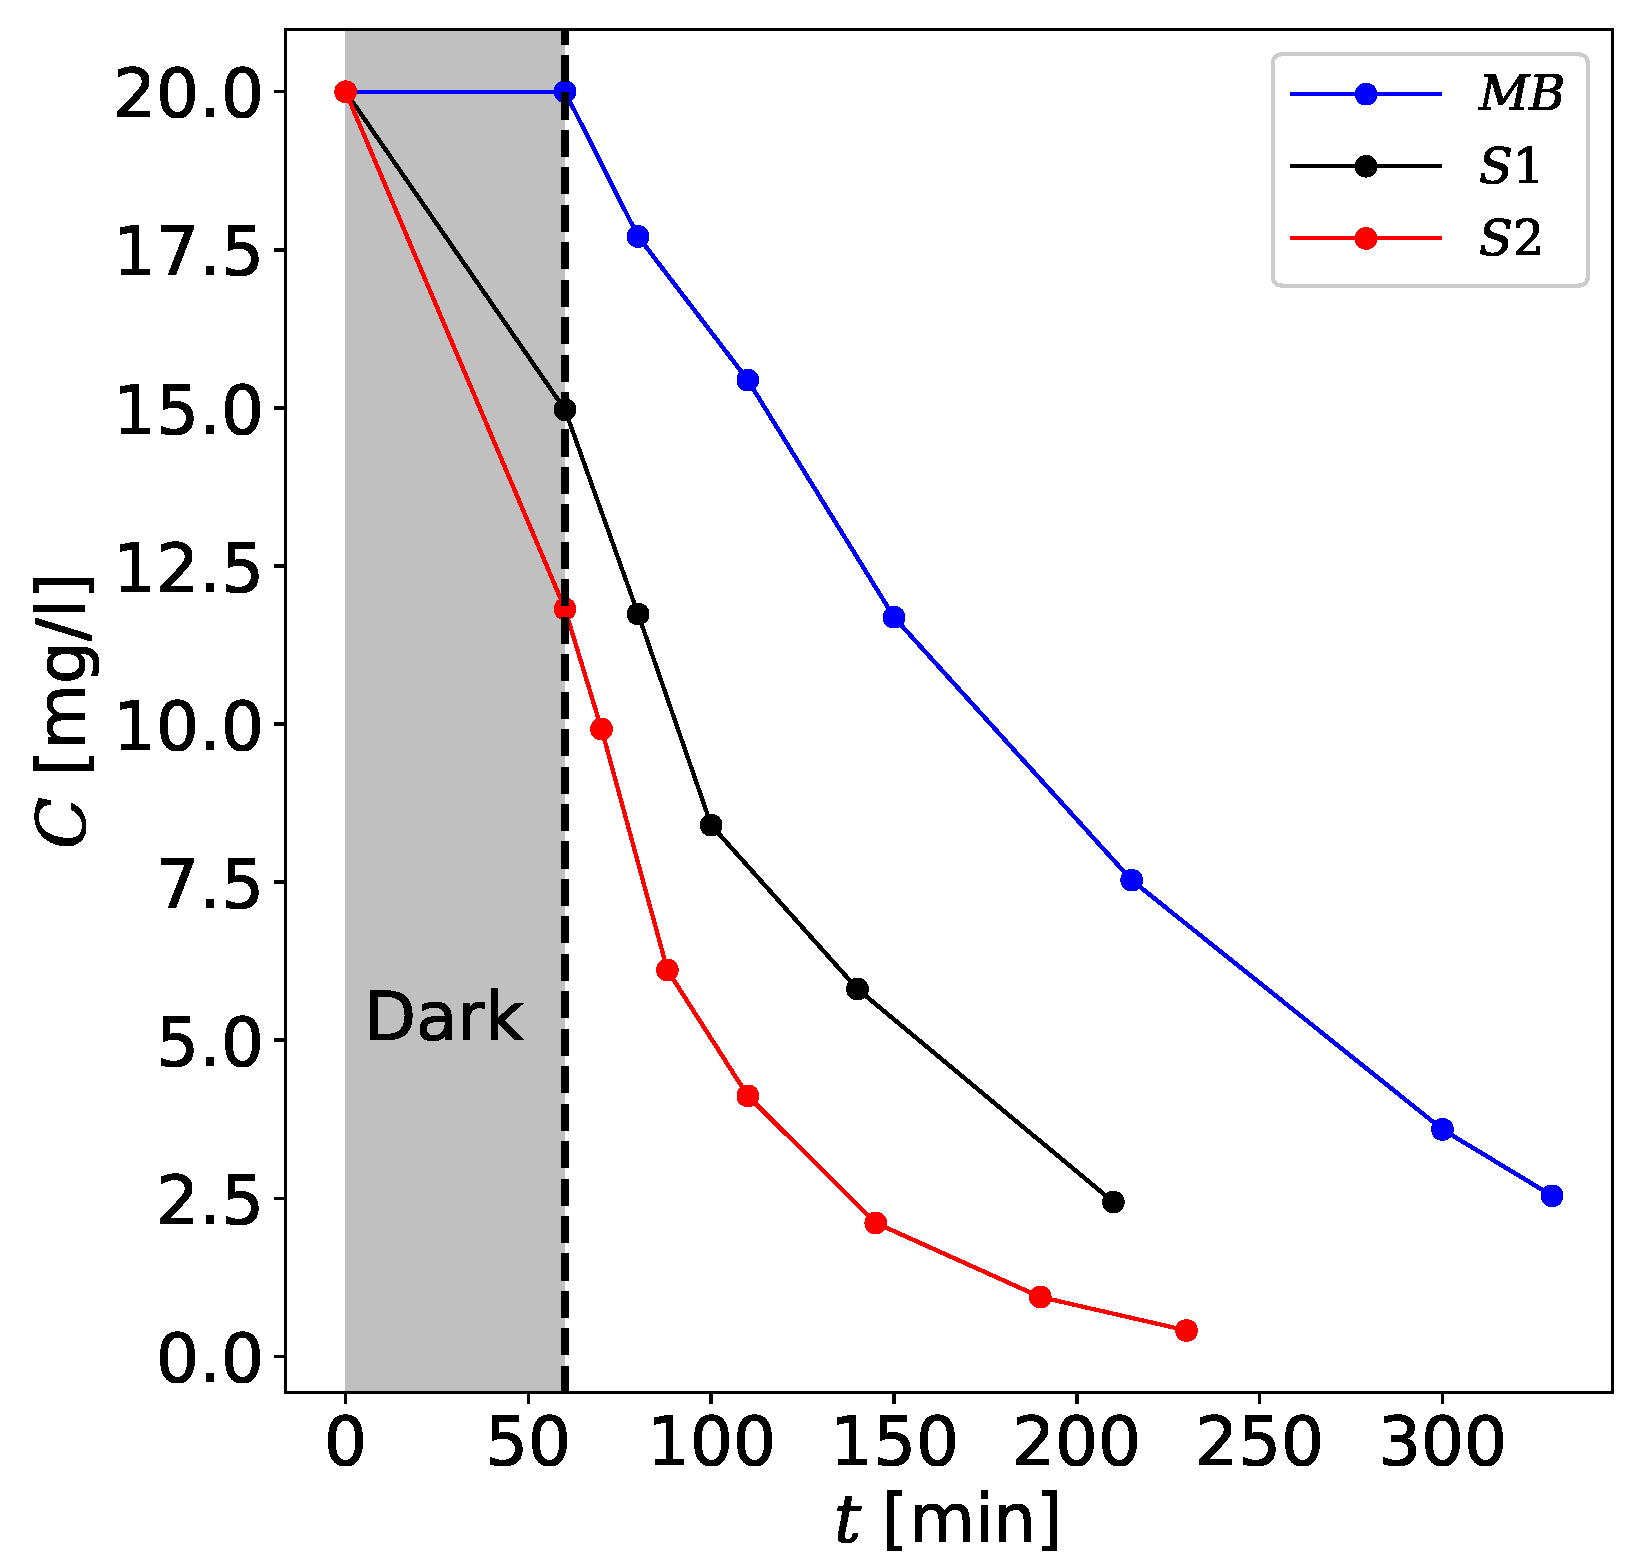
3.5. Photocatalytic Effect

Quality of photocatalytic properties can be another test to differentiate samples S1 and S2. For this purpose, the results of the experiment with the degradation of methylene blue (MB) are discussed in the presence of photocatalysts S1 and S2 and without them. They are presented in Figure 8 in terms of the dependence of MB concentration on time in the dark and in the case of irradiation with a UV lamp. Three plots represent the degradation of MB without photocatalysts (effect of photolysis [71]), degradation of MB in the presence of sample S1, and the presence of sample S2, respectively.
The kinetics of photocatalytic decomposition of organic dyes can by successfully represented with the Langmuir-Hinshelwood model [72]. In the case of dilute solutions:
ln ( C 0 C ) = k a p p t ,
where k a p p is the apparent rate constant of a reaction of pseudo-first-order, C 0 is the initial pollutant concentration (mg/L) and C is the concentration (mg/L) of pollutant at reaction time t.
Fe3+-doped nanotubes in sample S1 have greater photocatalytic degradability compared to unmodified TNTs in sample S2 [see Table 1]. One of the reasons is moving the edge of light absorption towards the visible light region. The density functional (DFT) calculations performed by Wang et al. [73] showed that transition metal atoms with unpaired electrons in the 3d orbital or 4d orbital contribute to narrowing the bandgap and providing an intermediate energy level. In our case, the light source is a high-pressure mercury lamp and its spectrum contains visible light. Moreover, the Fe3+ doping can promote the trapping of the charge carriers. Mahmoud et al. [74] showed that the presence of Fe3+ in the titanate nanotube acts as an electron-acceptor and hole-donor. Hence, the lifetime of the electron-hole separation in titanate material increases significantly. In some cases, the presence of Fe3+ ions in the structure of titanate nanotubes can drastically lower photocatalytic activity. Jang et al. [75] showed a lower rate of both hydrogen evolution and dye decomposition of Fe-intercalated TNTs than unmodified TNTs. It is worth to mention that the process of TNTs modification, which was used by them, was conducted during hydrothermal synthesis. However, the amount of iron was an order greater than in the present study. It should be noted that the efficiency of photocatalytic processes strongly depends on the concentration of Fe3+ ions. Yu et al. [76] noticed that an optimal Fe concentration in Fe-TiO2 nanorods is 0.5 atomic%.

4. Conclusions

Various forms of TiO2-based semiconductor materials such as crystal forms, nanoparticles, flakes or their nanotube forms have been known and studied for many years. These materials are easy to synthesize but the product strongly depends on its preparation. It is the reason for observing different magnetic properties of TNTs for different preparation methods. The results of introducing iron substitutional defects into TNTs show both the presence of the paramagnetic properties of TNTs at low temperatures but also a number of different magnetic responses for different values of the applied magnetic field at room temperature. The room temperature magnetic properties are the most promising for potential applications because the value of the magnetic field driving the magnetization to change from paramagnetic to ferromagnetic behavior and vice versa is relatively small (∼0.07 T). The obtained material with Fe-doped titanate nanotubes also shows increased photocatalytic properties compared to unmodified nanotubes.

Author Contributions

Conceptualization, M.M., M.R.D.; methodology, M.M., M.R.D. and N.G.; investigation, M.M., G.Ż., A.M.M., original draft preparation, M.M., L.N.-K. and M.R.D.; editing and final draft preparation, M.M., L.N.-K., N.G., G.Ż., A.M.M. and M.R.D.; visualization, M.M., M.R.D. All authors have read and agreed to the published version of the manuscript.

Funding

This research received no external funding.

Acknowledgments

We thank W. Wolak for a discussion on XRD results. M.R.D., M.M. and L.N.-K. acknowledge the financial support from the program of the Polish Ministry of Science and Higher Education under the name “Regional Initiative of Excellence” in 2019–2022, project no. 003/RID/2018/19, funding amount 11 936 596.10 PLN.

Conflicts of Interest

The authors declare no conflict of interest. The funders had no role in the design of the study; in the collection, analyses, or interpretation of data; in the writing of the manuscript, or in the decision to publish the results.

Abbreviations

The following abbreviations are used in this manuscript:
EDSEnergy Dispersive X-ray spectroscopy
MBMethylene Blue
MCM-41Mobil Composition of Matter No. 41
DFTDensity Functional Theory
EPRElectron Paramagnetic Resonance
TEMTransmission Electron Microscopy
TNTTitanate Nanotubes
XRDX-ray Powder Diffraction
UV-VisUltraviolet - Visible
ZFC/FCZero Field Cooled/Field Cooled

References

  1. Çeşmeli, S.; Biray Avci, C. Application of titanium dioxide (TiO2) nanoparticles in cancer therapies. J. Drug Target. 2019, 27, 762–766. [Google Scholar] [CrossRef] [PubMed]
  2. Rodriguez-Gonzalez, L.; Pettit, S.L.; Zhao, W.; Michaels, J.T.; Kuhn, J.N.; Alcantar, N.A.; Ergas, S.J. Oxidation of off flavor compounds in recirculating aquaculture systems using UV-TiO2 photocatalysis. Aquaculture 2019, 502, 32–39. [Google Scholar] [CrossRef]
  3. Pignanelli, F.; Fernández-Werner, L.; Romero, M.; Mombrú, D.; Tumelero, M.A.; Pasa, A.A.; Germán, E.; Faccio, R.; Mombrú, Á.W. Hydrogen titanate nanotubes for dye sensitized solar cells applications: Experimental and theoretical study. Mater. Res. Bull. 2018, 106, 40–48. [Google Scholar] [CrossRef]
  4. Chen, H.; Wu, Y.H.; Ma, H.; Shi, J.B.; Pan, X.W.; Lei, B.X.; Sun, Z.F. Dye-sensitized titanium dioxide nanotube array solar cells with superior performance induced by ferroelectric barium titanate. Thin Solid Films 2020, 709, 138205. [Google Scholar] [CrossRef]
  5. Sang, N.X.; Minh, V.C. Thermal annealing-induced self-junction of hydrothermal titanate nanotubes/TiO2 nanoparticles with enhanced photocatalytic activity. Nanotechnology 2020, 31, 435703. [Google Scholar] [CrossRef] [PubMed]
  6. Wang, Y.; He, J.; Wu, P.; Luo, D.; Yan, R.; Zhang, H.; Jiang, W. Simultaneous Removal of Tetracycline and Cu (II) in Hybrid Wastewater through Formic-Acid Assisted TiO2 Photocatalysis. Ind. Eng. Chem. Res. 2020, 59, 15098–15108. [Google Scholar] [CrossRef]
  7. Beketova, D.; Motola, M.; Sopha, H.; Michalicka, J.; Cicmancova, V.; Dvorak, F.; Hromadko, L.; Frumarova, B.; Stoica, M.; Macak, J.M. One-Step Decoration of TiO2 Nanotubes with Fe3O4 Nanoparticles: Synthesis and Photocatalytic and Magnetic Properties. ACS Appl. Nano Mater. 2020, 3, 1553–1563. [Google Scholar] [CrossRef]
  8. Zhao, X.; Du, P.; Cai, Z.; Wang, T.; Fu, J.; Liu, W. Photocatalysis of bisphenol A by an easy-settling titania/titanate composite: Effects of water chemistry factors, degradation pathway and theoretical calculation. Environ. Pollut. 2018, 232, 580–590. [Google Scholar] [CrossRef]
  9. Dudefoi, W.; Moniz, K.; Allen-Vercoe, E.; Ropers, M.H.; Walker, V.K. Impact of food grade and nano-TiO2 particles on a human intestinal community. Food Chem. Toxicol. 2017, 106, 242–249. [Google Scholar] [CrossRef]
  10. Muniyappan, S.; Solaiyammal, T.; Sudhakar, K.; Karthigeyan, A.; Murugakoothan, P. Conventional hydrothermal synthesis of titanate nanotubes: Systematic discussions on structural, optical, thermal and morphological properties. Mod. Electron. Mater. 2017, 3, 174–178. [Google Scholar] [CrossRef]
  11. Xu, X.; Ding, X.; Chen, Q.; Peng, L.M. Electronic, optical, and magnetic properties of Fe-intercalated H2Ti3O7 nanotubes: First-principles calculations and experiments. Phys. Rev. B 2006, 73, 165403. [Google Scholar] [CrossRef]
  12. Asahi, R.; Taga, Y.; Mannstadt, W.; Freeman, A.J. Electronic and optical properties of anatase TiO2. Phys. Rev. B 2000, 61, 7459. [Google Scholar] [CrossRef]
  13. Roose, B.; Pathak, S.; Steiner, U. Doping of TiO2 for sensitized solar cells. Chem. Soc. Rev. 2015, 44, 8326–8349. [Google Scholar] [CrossRef] [Green Version]
  14. Hoye, R.L.; Musselman, K.P.; MacManus-Driscoll, J.L. Research update: Doping ZnO and TiO2 for solar cells. APL Mater. 2013, 1, 060701. [Google Scholar] [CrossRef]
  15. Asahi, R.; Morikawa, T.; Ohwaki, T.; Aoki, K.; Taga, Y. Visible-light photocatalysis in nitrogen-doped titanium oxides. Science 2001, 293, 269–271. [Google Scholar] [CrossRef] [PubMed]
  16. Khan, S.U.; Al-Shahry, M.; Ingler, W.B. Efficient photochemical water splitting by a chemically modified n-TiO2. Science 2002, 297, 2243–2245. [Google Scholar] [CrossRef]
  17. Faughnan, B.; Kiss, Z. Photoinduced Reversible Charge-Transfer Processes in Transition-Metal-Doped Single-Crystal SrTiO3 and TiO2. Phys. Rev. Lett. 1968, 21, 1331. [Google Scholar] [CrossRef]
  18. Wu, Q.; Van De Krol, R. Selective photoreduction of nitric oxide to nitrogen by nanostructured TiO2 photocatalysts: Role of oxygen vacancies and iron dopant. J. Am. Chem. Soc. 2012, 134, 9369–9375. [Google Scholar] [CrossRef]
  19. Yang, C.K. A metallic graphene layer adsorbed with lithium. Appl. Phys. Lett. 2009, 95, 163115. [Google Scholar] [CrossRef]
  20. Liau, L.C.K.; Lin, C.C. Fabrication and characterization of Fe3+-doped titania semiconductor electrodes with p–n homojunction devices. Appl. Surf. Sci. 2007, 253, 8798–8801. [Google Scholar] [CrossRef]
  21. Kasuga, T.; Hiramatsu, M.; Hoson, A.; Sekino, T.; Niihara, K. Formation of titanium oxide nanotube. Langmuir 1998, 14, 3160–3163. [Google Scholar] [CrossRef]
  22. Yu, J.; Wu, Z.; Gong, C.; Xiao, W.; Sun, L.; Lin, C. Fe3+-doped TiO2 nanotube arrays on Ti-Fe alloys for enhanced photoelectrocatalytic activity. Nanomaterials 2016, 6, 107. [Google Scholar] [CrossRef] [PubMed]
  23. He, G.; Zhang, J.; Hu, Y.; Bai, Z.; Wei, C. Dual-template synthesis of mesoporous TiO2 nanotubes with structure-enhanced functional photocatalytic performance. Appl. Catal. B Environ. 2019, 250, 301–312. [Google Scholar] [CrossRef]
  24. Zavala, M.Á.L.; Morales, S.A.L.; Ávila-Santos, M. Synthesis of stable TiO2 nanotubes: Effect of hydrothermal treatment, acid washing and annealing temperature. Heliyon 2017, 3, e00456. [Google Scholar] [CrossRef]
  25. Zhang, S.; Chen, Q.; Peng, L.M. Structure and formation of H2Ti3O7 nanotubes in an alkali environment. Phys. Rev. B 2005, 71, 014104. [Google Scholar] [CrossRef]
  26. Hu, W.; Li, L.; Li, G.; Meng, J.; Tong, W. Synthesis of titanate-based nanotubes for one-dimensionally confined electrical properties. J. Phys. Chem. C 2009, 113, 16996–17001. [Google Scholar] [CrossRef]
  27. Ferreira, V.; Nunes, M.; Silvestre, A.J.; Monteiro, O. Synthesis and properties of Co-doped titanate nanotubes and their optical sensitization with methylene blue. Mater. Chem. Phys. 2013, 142, 355–362. [Google Scholar] [CrossRef] [Green Version]
  28. Szirmai, P.; Stevens, J.; Horváth, E.; Ćirić, L.; Kollár, M.; Forró, L.; Náfrádi, B. Competitive ion-exchange of manganese and gadolinium in titanate nanotubes. Catal. Today 2017, 284, 146–152. [Google Scholar] [CrossRef]
  29. Zhu, J.; Liu, Q.; Li, Z.; Liu, J.; Zhang, H.; Li, R.; Wang, J. Efficient extraction of uranium from aqueous solution using an amino-functionalized magnetic titanate nanotubes. J. Hazard. Mater. 2018, 353, 9–17. [Google Scholar] [CrossRef]
  30. Marć, M.; Dudek, M.R.; Kozioł, J.J.; Zapotoczny, B. Adsorption of methylene blue on titanate nanotubes synthesized with ultra-small Fe3O4 nanoparticles. Nano 2018, 13, 1850142. [Google Scholar] [CrossRef]
  31. Marques, T.M.; Sales, D.A.; Silva, L.S.; Bezerra, R.D.; Silva, M.S.; Osajima, J.A.; Ferreira, O.P.; Ghosh, A.; Silva Filho, E.C.; Viana, B.C.; et al. Amino-functionalized titanate nanotubes for highly efficient removal of anionic dye from aqueous solution. Appl. Surf. Sci. 2020, 512, 145659. [Google Scholar] [CrossRef]
  32. Sallem, F.; Boudon, J.; Heintz, O.; Séverin, I.; Megriche, A.; Millot, N. Synthesis and characterization of chitosan-coated titanate nanotubes: Towards a new safe nanocarrier. Dalton Trans. 2017, 46, 15386–15398. [Google Scholar] [CrossRef]
  33. Sruthi, S.; Loiseau, A.; Boudon, J.; Sallem, F.; Maurizi, L.; Mohanan, P.; Lizard, G.; Millot, N. In vitro interaction and biocompatibility of titanate nanotubes with microglial cells. Toxicol. Appl. Pharm. 2018, 353, 74–86. [Google Scholar] [CrossRef] [PubMed]
  34. Gusmão, S.B.; Ghosh, A.; Marques, T.M.; Gusmão, G.O.; Oliveira, T.G.; Cavalcante, L.C.D.; Vasconcelos, T.L.; Abreu, G.J.; Guerra, Y.; Peña-Garcia, R.; et al. Structural and magnetic properties of titanate nano-heterostructures decorated with iron based nanoparticles. J. Phys. Chem. Solids 2020, 145, 109561. [Google Scholar] [CrossRef]
  35. Deng, L.; Wang, S.; Liu, D.; Zhu, B.; Huang, W.; Wu, S.; Zhang, S. Synthesis, characterization of Fe-doped TiO2 nanotubes with high photocatalytic activity. Catal. Lett. 2009, 129, 513–518. [Google Scholar] [CrossRef]
  36. Han, W.Q.; Wen, W.; Yi, D.; Liu, Z.; Maye, M.M.; Lewis, L.; Hanson, J.; Gang, O. Fe-doped trititanate nanotubes: Formation, optical and magnetic properties, and catalytic applications. J. Phys. Chem. C 2007, 111, 14339–14342. [Google Scholar] [CrossRef]
  37. Liu, W.; Zhao, X.; Borthwick, A.G.; Wang, Y.; Ni, J. Dual-enhanced photocatalytic activity of Fe-deposited titanate nanotubes used for simultaneous removal of As (III) and As (V). ACS Appl. Mater. Interfaces 2015, 7, 19726–19735. [Google Scholar] [CrossRef] [Green Version]
  38. Zaki, A.; Hafiez, M.A.; El Rouby, W.M.; El-Dek, S.; Farghali, A. Novel magnetic standpoints in Na2Ti3O7 nanotubes. J. Magn. Magn. Mater. 2019, 476, 207–212. [Google Scholar] [CrossRef]
  39. Wang, X.; Gao, X.; Li, G.; Gao, L.; Yan, T.; Zhu, H.Y. Ferromagnetism of Co-doped TiO2 (B) nanotubes. Appl. Phys. Lett. 2007, 91, 143102. [Google Scholar] [CrossRef]
  40. Lu, C.; Guan, W.; Hoang, T.K.; Guo, J.; Gou, H.; Yao, Y. Visible-light-driven catalytic degradation of ciprofloxacin on metal (Fe, Co, Ni) doped titanate nanotubes synthesized by one-pot approach. J. Mater. Sci. Mater. Electron. 2016, 27, 1966–1973. [Google Scholar] [CrossRef]
  41. Huang, C.; Liu, X.; Kong, L.; Lan, W.; Su, Q.; Wang, Y. The structural and magnetic properties of Co-doped titanate nanotubes synthesized under hydrothermal conditions. Appl. Phys. A 2007, 87, 781–786. [Google Scholar] [CrossRef]
  42. Vranješ, M.; Jakovljević, J.K.; Milošević, M.; Ćirić Marjanović, G.; Stoiljković, M.; Konstantinović, Z.; Pavlović, V.; Milivojević, D.; Šaponjić, Z. Hydrothermal synthesis of Mn2+ doped titanate nanotubes: Investigation of their structure and room temperature ferromagnetic behavior. Solid State Sci. 2019, 94, 155–161. [Google Scholar] [CrossRef]
  43. Hafez, H.S.; Saif, M.; McLeskey, J.T.; Abdel-Mottaleb, M.; Yahia, I.; Story, T.; Knoff, W. Hydrothermal Preparation of Gd3+-Doped Titanate Nanotubes: Magnetic Properties and Photovoltaic Performance. Int. J. Photoenergy 2009, 2009, 240402. [Google Scholar] [CrossRef] [Green Version]
  44. Marques, T.M.; Luz-Lima, C.; Sacilloti, M.; Fujisawa, K.; Perea-Lopez, N.; Terrones, M.; Silva, E.N.; Ferreira, O.P.; Viana, B.C. Photoluminescence enhancement of titanate nanotubes by insertion of rare earth ions in their interlayer spaces. J. Nanomater. 2017, 2017, 3809807. [Google Scholar] [CrossRef]
  45. Bavykin, D.V.; Lapkin, A.A.; Plucinski, P.K.; Torrente-Murciano, L.; Friedrich, J.M.; Walsh, F.C. Deposition of Pt, Pd, Ru and Au on the surfaces of titanate nanotubes. Top. Catal. 2006, 39, 151–160. [Google Scholar] [CrossRef]
  46. Schneider, J.; Matsuoka, M.; Takeuchi, M.; Zhang, J.; Horiuchi, Y.; Anpo, M.; Bahnemann, D.W. Understanding TiO2 photocatalysis: Mechanisms and materials. Chem. Rev. 2014, 114, 9919–9986. [Google Scholar] [CrossRef] [PubMed]
  47. Bahnemann, D.W. Current challenges in photocatalysis: Improved photocatalysts and appropriate photoreactor engineering. Res. Chem. Intermediat. 2000, 26, 207–220. [Google Scholar] [CrossRef]
  48. Wang, C.y.; Pagel, R.; Bahnemann, D.W.; Dohrmann, J.K. Quantum yield of formaldehyde formation in the presence of colloidal TiO2-based photocatalysts: Effect of intermittent illumination, platinization, and deoxygenation. J. Phys. Chem. B 2004, 108, 14082–14092. [Google Scholar] [CrossRef]
  49. Hufschmidt, D.; Bahnemann, D.; Testa, J.J.; Emilio, C.A.; Litter, M.I. Enhancement of the photocatalytic activity of various TiO2 materials by platinisation. J. Photochem. Photobiol. A 2002, 148, 223–231. [Google Scholar] [CrossRef]
  50. Kokorin, A.; Amal, R.; Teoh, W.; Kulak, A. Studies of Nanosized Iron-Doped TiO2 Photocatalysts by Spectroscopic Methods. Appl. Magn. Reson. 2017, 48, 447–459. [Google Scholar] [CrossRef]
  51. Papa, A.L.; Maurizi, L.; Vandroux, D.; Walker, P.; Millot, N. Synthesis of titanate nanotubes directly coated with USPIO in hydrothermal conditions: A new detectable nanocarrier. J. Phys. Chem. C 2011, 115, 19012–19017. [Google Scholar] [CrossRef]
  52. Grzechulska-Damszel, J.; Morawski, A.W.; Grzmil, B. Thermally modified titania photocatalysts for phenol removal from water. Int. J. Photoenergy 2006, 2006. [Google Scholar] [CrossRef]
  53. Mozia, S.; Tomaszewska, M.; Morawski, A.W. Decomposition of nonionic surfactant in a labyrinth flow photoreactor with immobilized TiO2 bed. Appl. Catal. B Environ. 2005, 59, 155–160. [Google Scholar] [CrossRef]
  54. Zapotoczny, B.; Guskos, N.; Kozioł, J.; Dudek, M. Preparation of the narrow size distribution USPIO in mesoporous silica for magnetic field guided drug delivery and release. J. Magn. Magn. Mater. 2015, 374, 96–102. [Google Scholar] [CrossRef]
  55. Zhang, D.; Cong, T.; Xia, L.; Pan, L. Growth of black TiO2 nanowire/carbon fiber composites with dendritic structure for efficient visible-light-driven photocatalytic degradation of methylene blue. J. Mater. Sci. 2019, 54, 7576–7588. [Google Scholar] [CrossRef]
  56. Rahman, N.R.A.; Muniandy, L.; Adam, F.; Iqbal, A.; Ng, E.P.; Lee, H.L. Detailed photocatalytic study of alkaline titanates and its application for the degradation of methylene blue (MB) under solar irradiation. J. Photochem. Photobiol. A 2019, 375, 219–230. [Google Scholar] [CrossRef]
  57. Chen, Q.; Du, G.; Zhang, S.; Peng, L.M. The structure of trititanate nanotubes. Acta Crystallogr. B 2002, 58, 587–593. [Google Scholar] [CrossRef] [PubMed] [Green Version]
  58. Gerritsen, H.; Harrison, S.; Lewis, H.; Wittke, J. Fine Structure, Hyperfine Structure, and Relaxation Times of Cr3+ in TiO2 (Rutile). Phys. Rev. Lett. 1959, 2, 153. [Google Scholar] [CrossRef]
  59. Chester, P. Electron spin resonance in semiconducting rutile. J. Appl. Phys. 1961, 32, 2233–2236. [Google Scholar] [CrossRef]
  60. Golden, E.M.; Giles, N.C.; Yang, S.; Halliburton, L.E. Interstitial silicon ions in rutile TiO2 crystals. Phys. Rev. B 2015, 91, 134110. [Google Scholar] [CrossRef] [Green Version]
  61. Carriazo, J.; Ensuncho-Muñoz, A.; Almanza, O. Electron Paramagnetic Resonance (EPR) investigation of TiO2-delaminated clays. Rev. Mex. Ing. Quim. 2014, 13, 473–481. [Google Scholar]
  62. Naresh, N.; Bhowmik, R.; Ghosh, B.; Banerjee, S. Study of surface magnetism, exchange bias effect, and enhanced ferromagnetism in α-Fe1.4Ti0.6O3 alloy. J. Appl. Phys. 2011, 109, 093913. [Google Scholar] [CrossRef]
  63. Matsumoto, Y.; Murakami, M.; Shono, T.; Hasegawa, T.; Fukumura, T.; Kawasaki, M.; Ahmet, P.; Chikyow, T.; Koshihara, S.Y.; Koinuma, H. Room-temperature ferromagnetism in transparent transition metal-doped titanium dioxide. Science 2001, 291, 854–856. [Google Scholar] [CrossRef]
  64. Hong, N.H.; Sakai, J.; Poirot, N.; Brizé, V. Room-temperature ferromagnetism observed in undoped semiconducting and insulating oxide thin films. Phys. Rev. B 2006, 73, 132404. [Google Scholar] [CrossRef]
  65. Yoon, S.D.; Chen, Y.; Yang, A.; Goodrich, T.L.; Zuo, X.; Arena, D.A.; Ziemer, K.; Vittoria, C.; Harris, V.G. Oxygen-defect-induced magnetism to 880 K in semiconducting anatase TiO2-δ films. J. Phys. Condens. Matter 2006, 18, L355. [Google Scholar] [CrossRef] [Green Version]
  66. Pemmaraju, C.D.; Sanvito, S. Ferromagnetism driven by intrinsic point defects in HfO2. Phys. Rev. Lett. 2005, 94, 217205. [Google Scholar] [CrossRef]
  67. Sharma, S.; Chaudhary, S.; Kashyap, S.C.; Sharma, S.K. Room temperature ferromagnetism in Mn doped TiO2 thin films: Electronic structure and Raman investigations. J. Appl. Phys. 2011, 109, 083905. [Google Scholar] [CrossRef]
  68. Choudhury, B.; Choudhury, A. Room temperature ferromagnetism in defective TiO2 nanoparticles: Role of surface and grain boundary oxygen vacancies. J. Appl. Phys. 2013, 114, 203906. [Google Scholar] [CrossRef]
  69. Tang, A.S.; Pelliciari, J.; Song, Q.; Song, Q.; Ning, S.; Freeland, J.W.; Comin, R.; Ross, C.A. XMCD study of magnetism and valence state in iron-substituted strontium titanate. Phys. Rev. Mater. 2019, 3, 054408. [Google Scholar] [CrossRef] [Green Version]
  70. Li, D.-X.; Qin, X.-B.; Zheng, L.-R.; Li, Y.-X.; Cao, X.-Z.; Li, Z.-X.; Yang, J.; Wang, B.-Y. Defect types and room-temperature ferromagnetism in undoped rutile TiO2 single crystals. Chin. Phys. B 2013, 22, 037504. [Google Scholar] [CrossRef]
  71. Soltani, T.; Entezari, M.H. Photolysis and photocatalysis of methylene blue by ferrite bismuth nanoparticles under sunlight irradiation. J. Mol. Catal. A Chem. 2013, 377, 197–203. [Google Scholar] [CrossRef]
  72. Benhabiles, O.; Mahmoudi, H.; Lounici, H.; Goosen, M.F. Effectiveness of a photocatalytic organic membrane for solar degradation of methylene blue pollutant. Desalination Water Treat. 2016, 57, 14067–14076. [Google Scholar] [CrossRef]
  73. Wang, Y.; Zhang, R.; Li, J.; Li, L.; Lin, S. First-principles study on transition metal-doped anatase TiO2. Nanoscale Res. Lett. 2014, 9, 46. [Google Scholar] [CrossRef] [Green Version]
  74. Mahmoud, M.S.; Ahmed, E.; Farghali, A.; Zaki, A.; Barakat, N.A. Synthesis of Fe/Co-doped titanate nanotube as redox catalyst for photon-induced water splitting. Mater. Chem. Phys. 2018, 217, 125–132. [Google Scholar] [CrossRef]
  75. Jang, J.S.; Kim, D.H.; Choi, S.H.; Jang, J.W.; Kim, H.G.; Lee, J.S. In-situ synthesis, local structure, photoelectrochemical property of Fe-intercalated titanate nanotube. Int. J. Hydrog. Energy 2012, 37, 11081–11089. [Google Scholar] [CrossRef]
  76. Yu, J.; Xiang, Q.; Zhou, M. Preparation, characterization and visible-light-driven photocatalytic activity of Fe-doped titania nanorods and first-principles study for electronic structures. Appl. Catal. B Environ. 2009, 90, 595–602. [Google Scholar] [CrossRef]
Figure 1. The upper two panels show representative transmission electron microscopy (TEM) images of samples S1 and S2. The lower panel shows the EDS spectrum for the S2 sample with characteristic peaks indicating the presence of iron ions.
Materials 13 04612 g001
Figure 2. Wide-angle XRD patterns of unmodified titanate nanotubes (TNTs) (sample S1) and modified TNTs (sample S2). The plots have been shifted relative to each other for greater clarity. Dashed vertical lines indicate slight differences in the peaks between S1 and S2 samples such as their location, shape or height.
Materials 13 04612 g002
Figure 3. Low-angle XRD patterns of unmodified TNTs (sample S1) and modified TNTs (sample S2). The plots have been shifted relative to each other for greater clarity.
Materials 13 04612 g003
Figure 4. Absorption lines derivatives, d χ /dB, of the samples S1 and S2 at different temperatures. The plots have been shifted relative to each other for greater clarity.
Materials 13 04612 g004
Figure 5. EPR signals (absorption line, first and second order derivative of the absorption line) of sample S1 at temperature T = 290 K. The plots have been rescaled for greater clarity. The inset shows a fragment of the second derivative of the absorption line.
Materials 13 04612 g005
Figure 6. Magnetization vs. dc magnetic field B for samples S1 and S2 at temperature T = 2 K (a), and T = 300 K (b). Panels (c,d) show the enlarged fragments of the plots in panel (b) for B in the range of −1 to 1 T and −0.04 T to 0.04 T, respectively.
Materials 13 04612 g006
Figure 7. Temperature dependence of Zero Field Cooled/Field Cooled (ZFC/FC) magnetic susceptibility at 100 Oe for samples S1 and S2 (a), and temperature dependence of ZFC magnetic susceptibility at large values of the magnetic field, B = 6000 Oe and 7000 Oe (b). The arrows in (a) suggest the change of the type of magnetic response to the applied magnetic field.
Materials 13 04612 g007
Figure 8. MB concentration C as a function of during irradiation with a UV lamp. The plots represent degradation of MB with the photocatalysts S1 and S2, and without them. “Dark” denotes the period of time when the UV lamp was turned off.
Materials 13 04612 g008
Table 1. Rate constants k a p p of photocatalytic methylene blue (MB) degradation and linear regression corelation coefficients R 2 .
Sample k a p p × 10 3 [ min 1 ] R 2
MB7.5490.990
S111.9330.996
S219.5490.998
Publisher’s Note: MDPI stays neutral with regard to jurisdictional claims in published maps and institutional affiliations.

