Fatigue Behaviour of 7N01-T4 Aluminium Alloy Welded by Ultrasonic-Assisted Friction Stir Welding


Abstract
1. Introduction
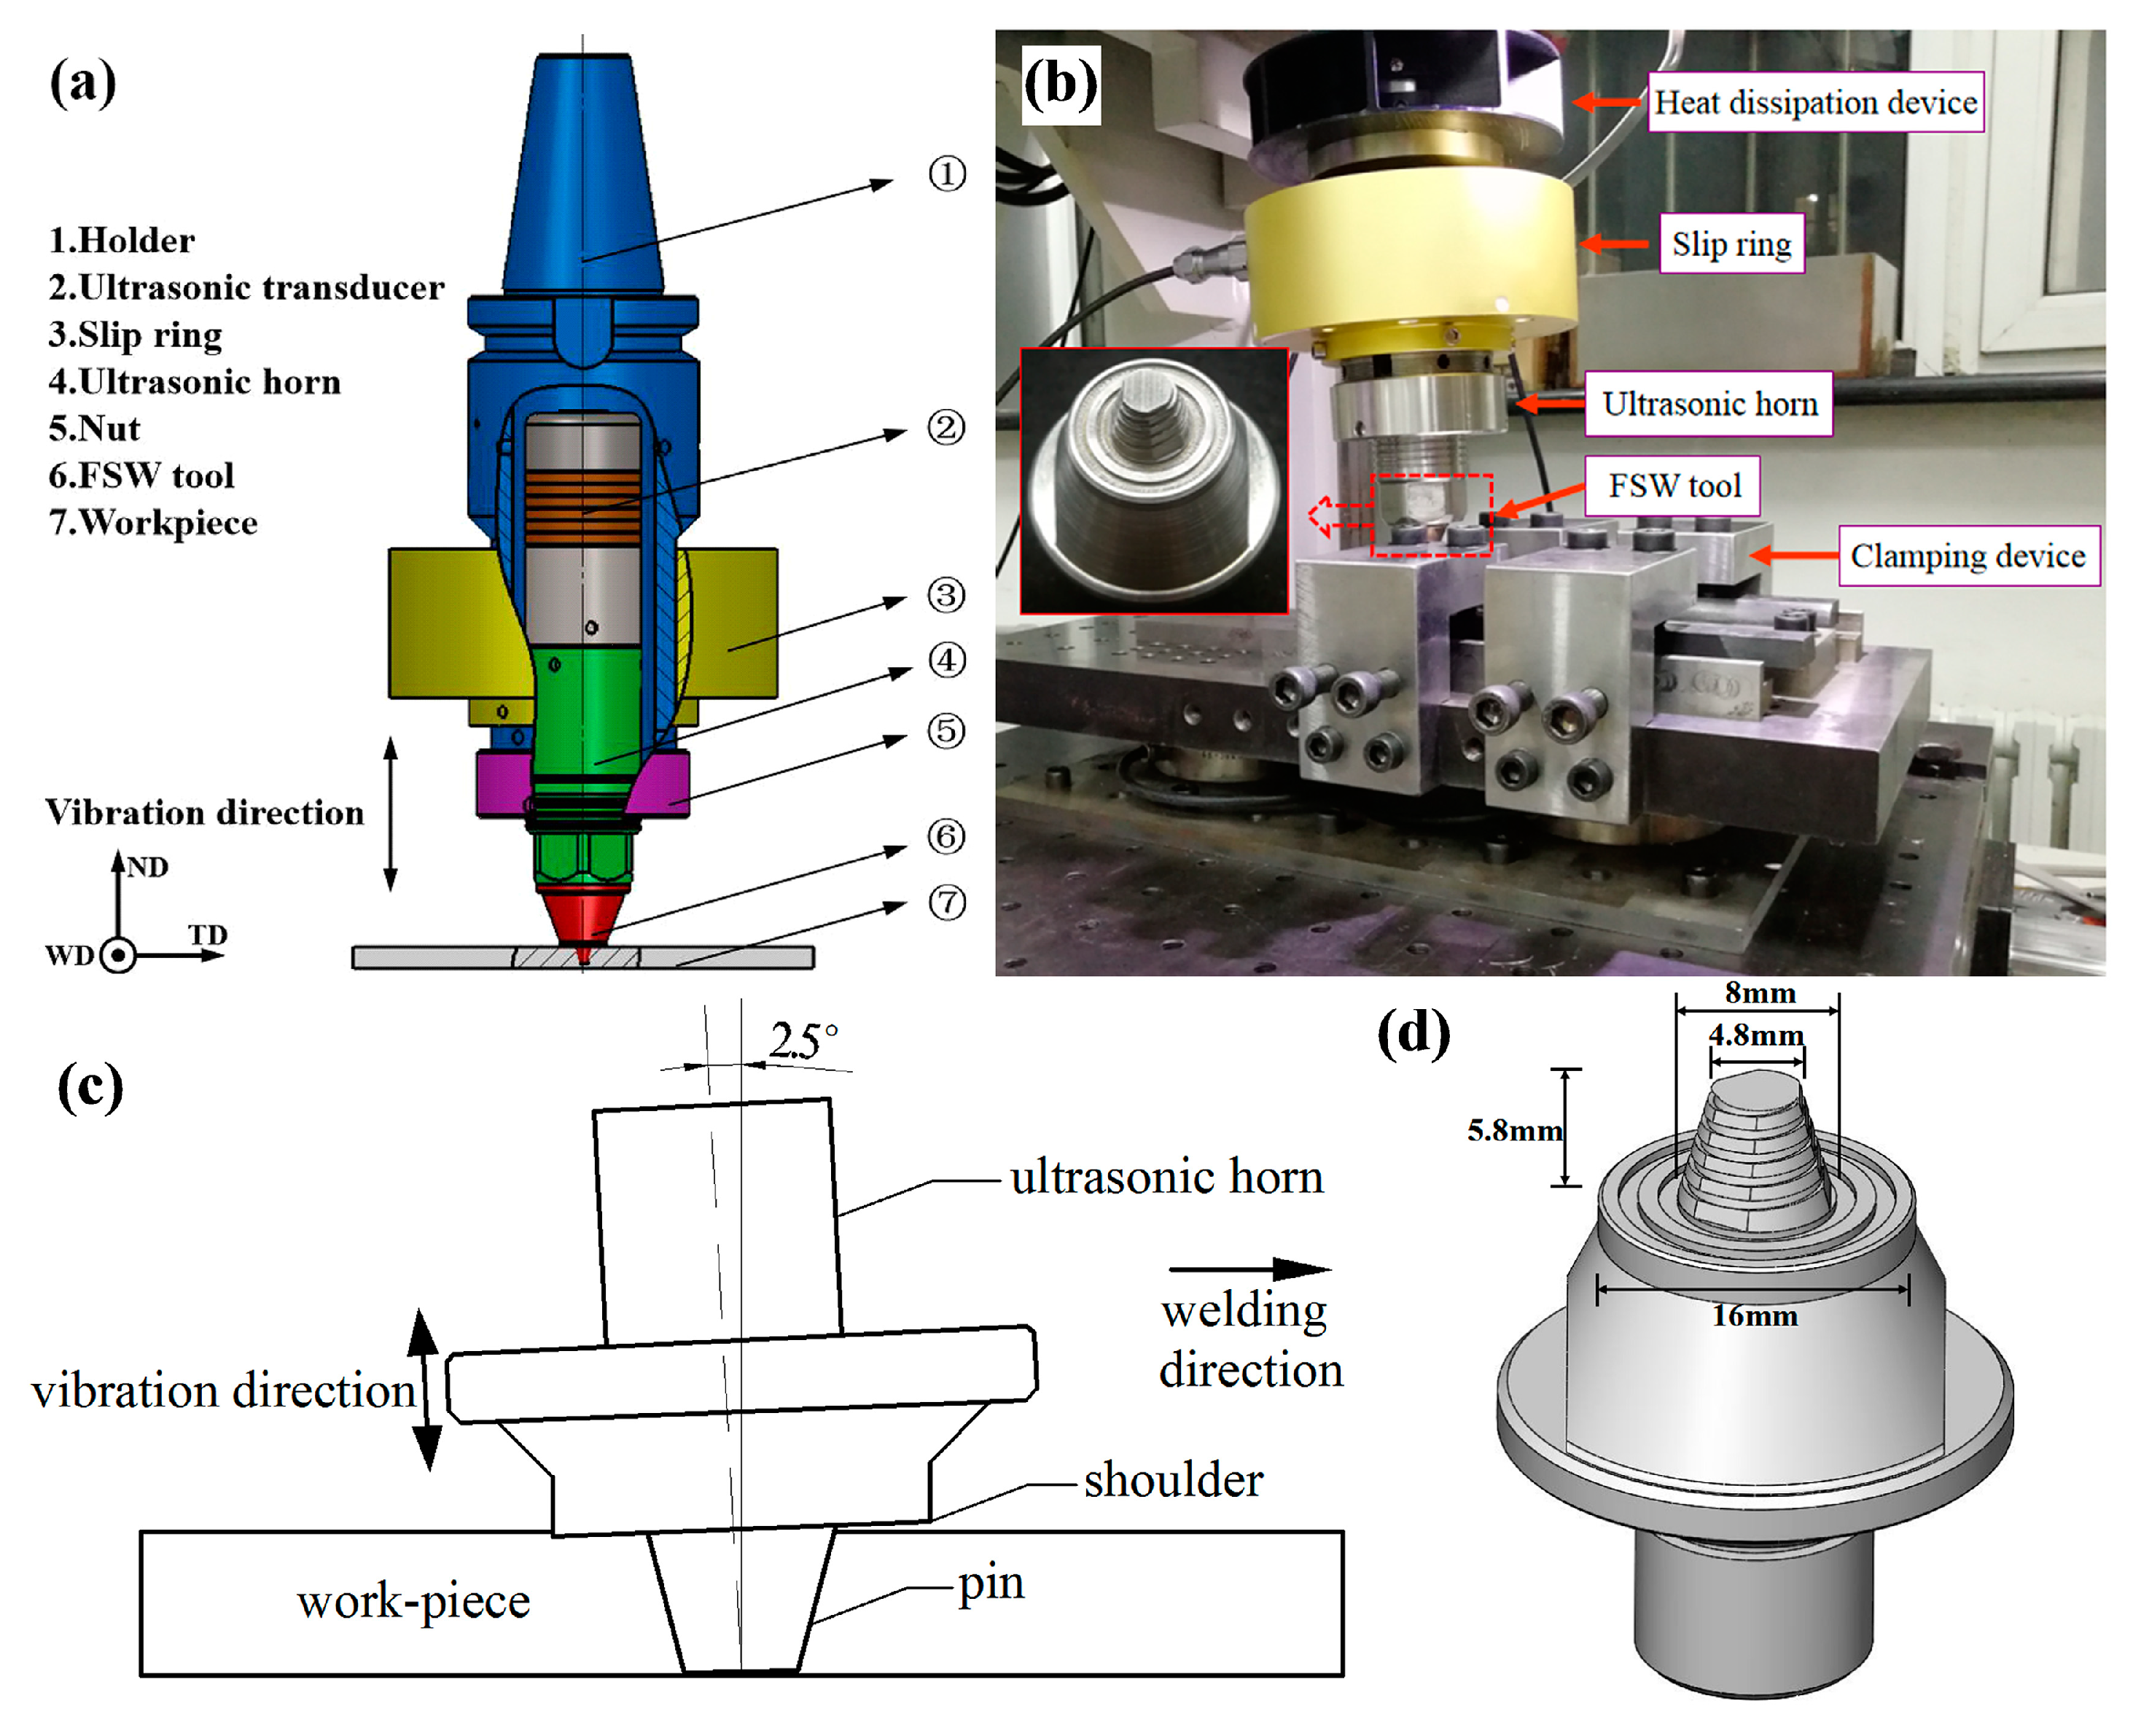
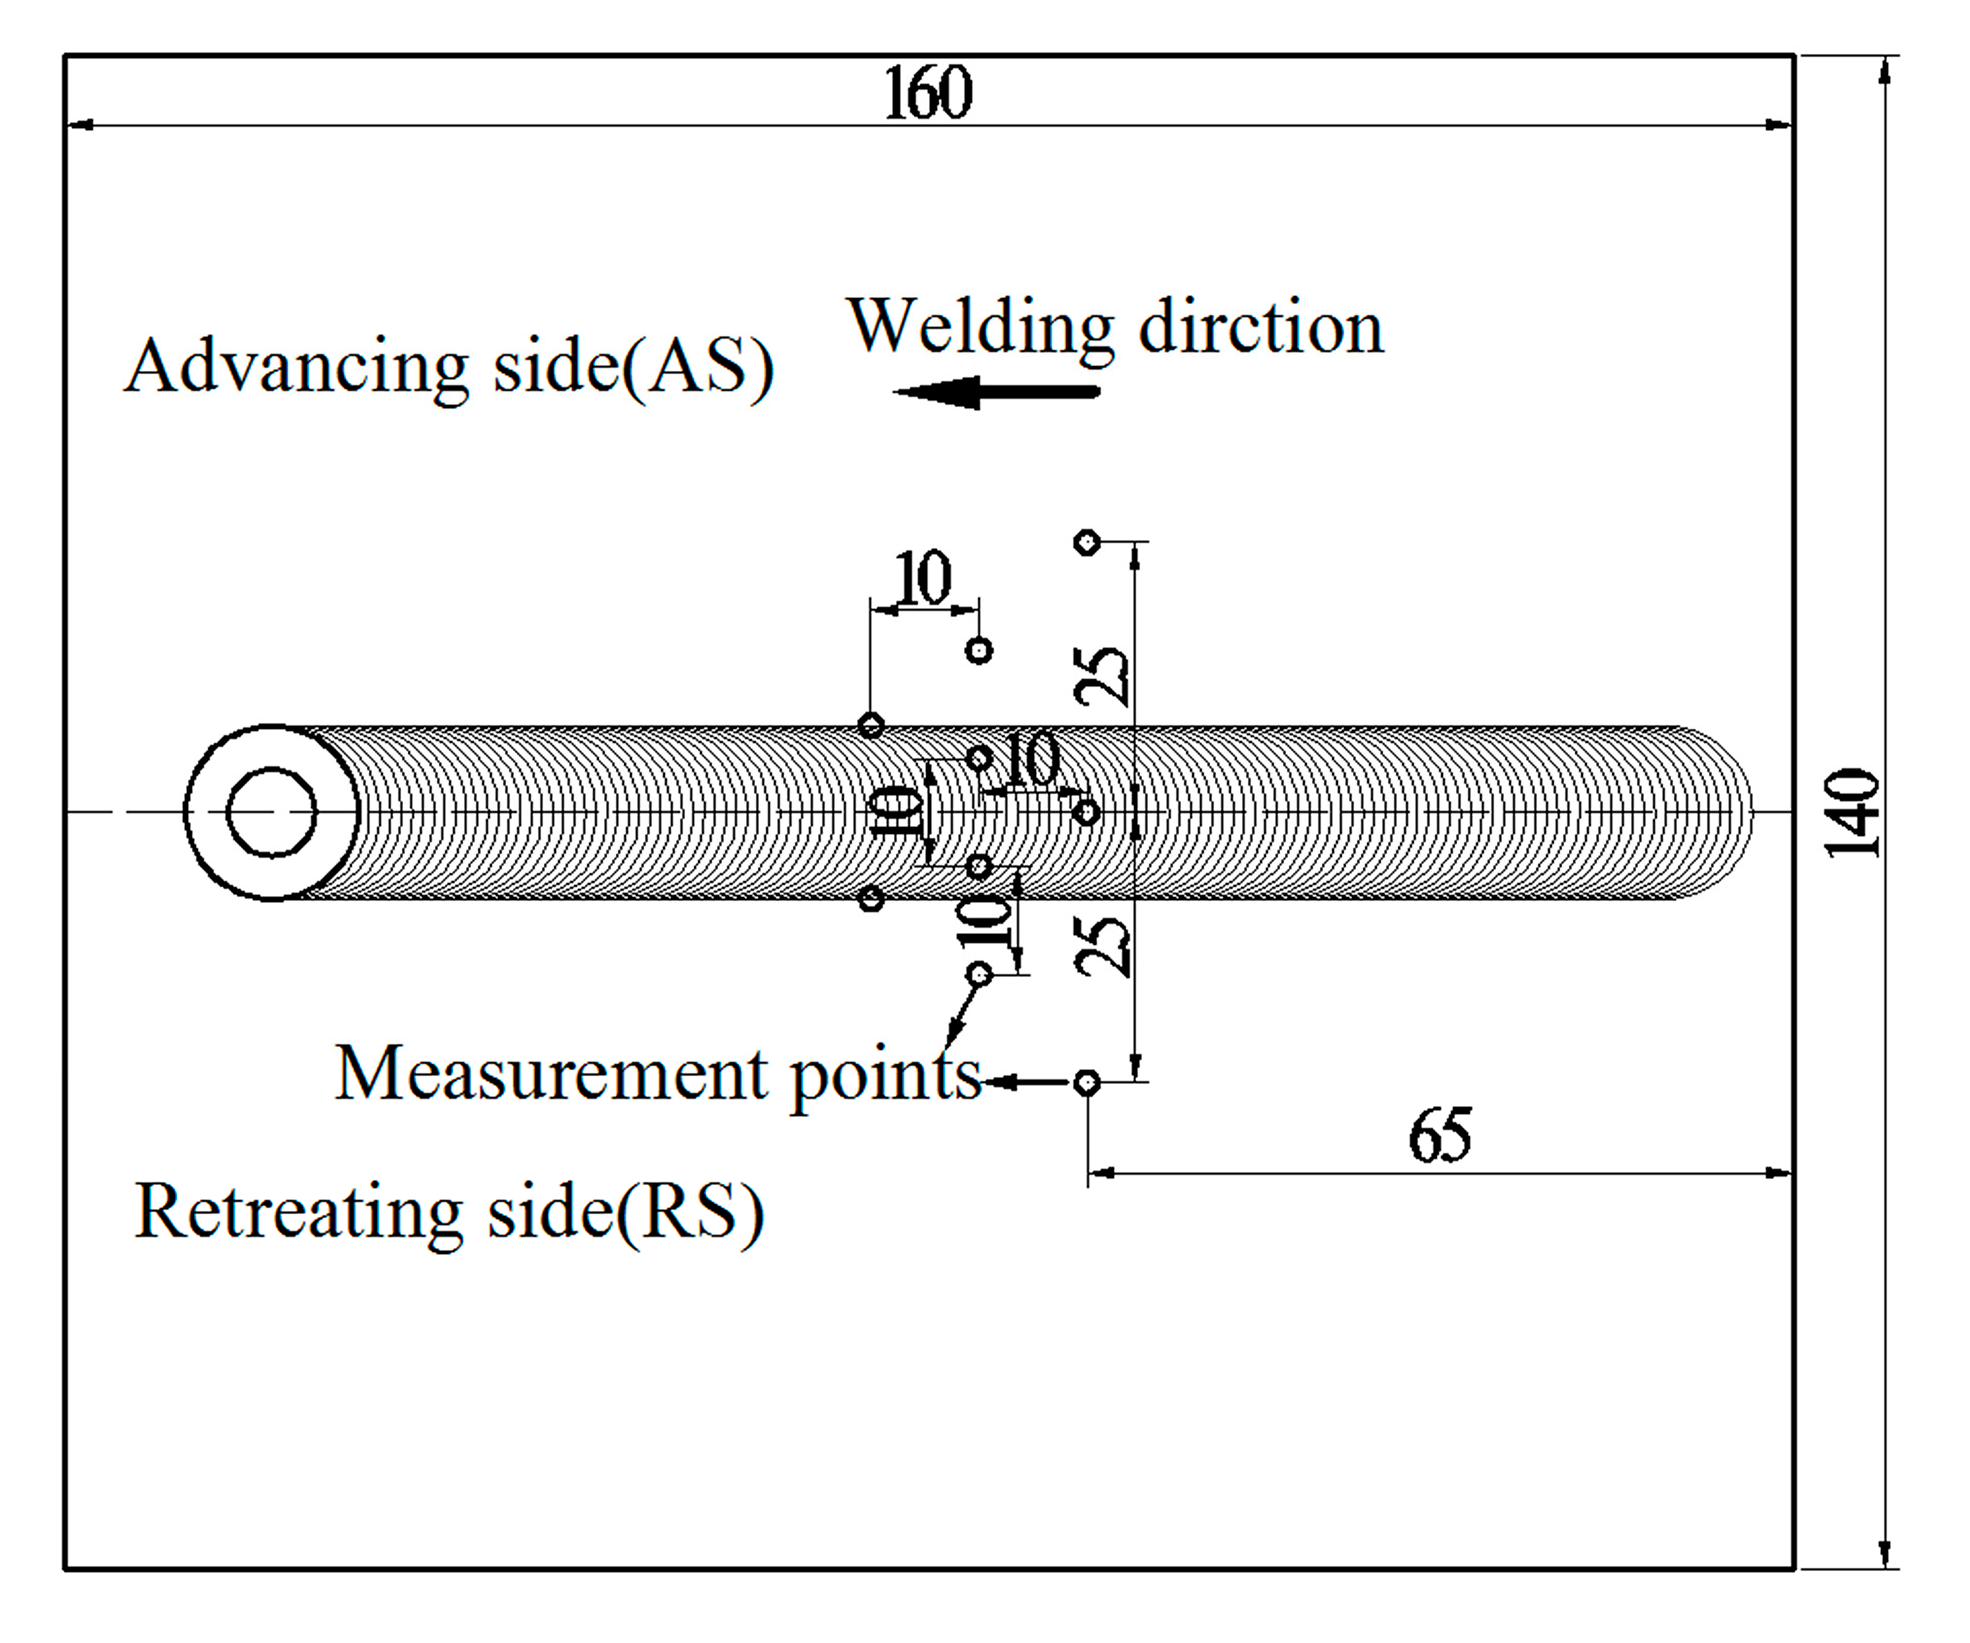
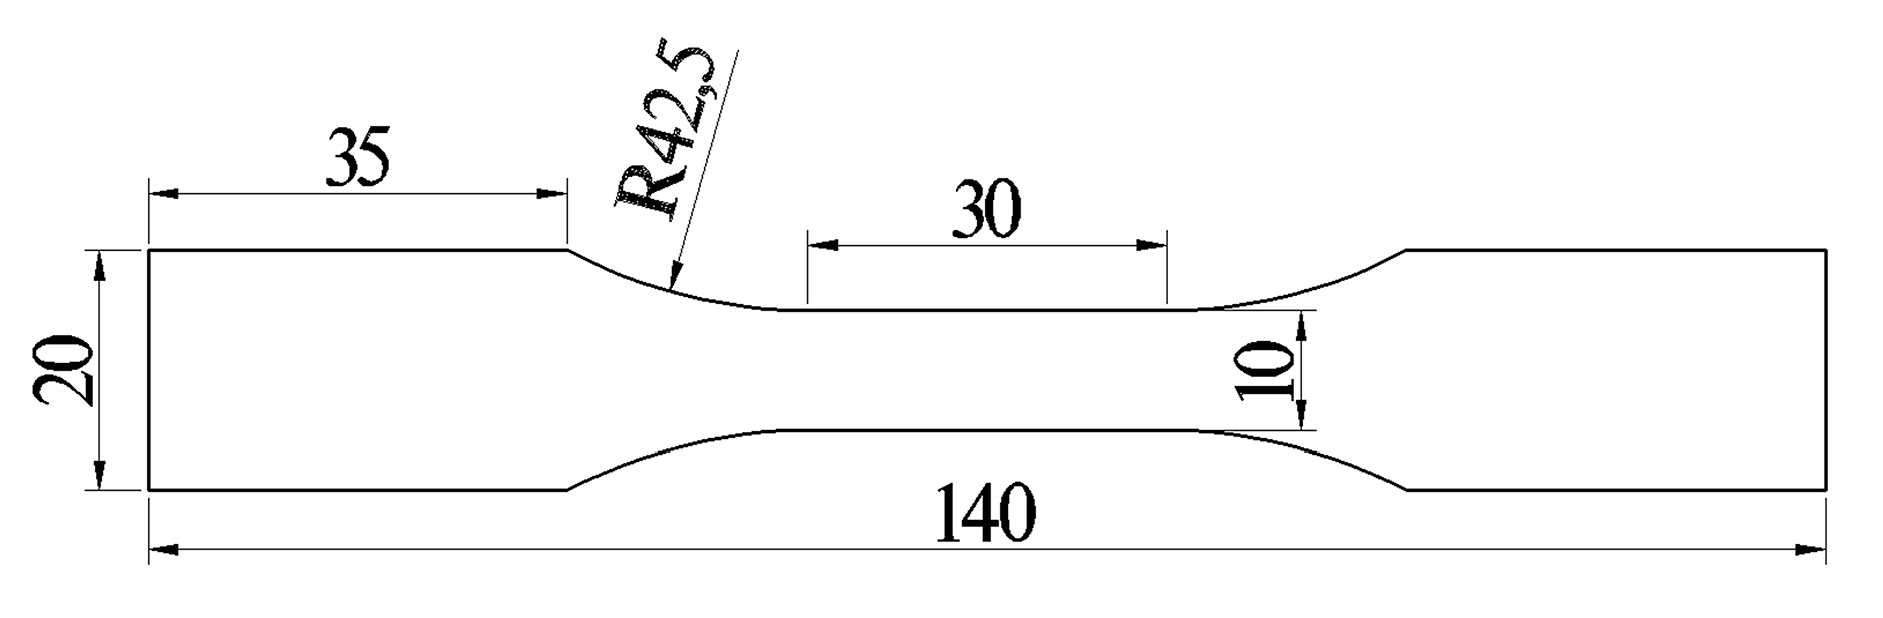
2. Materials and Methods
3. Results
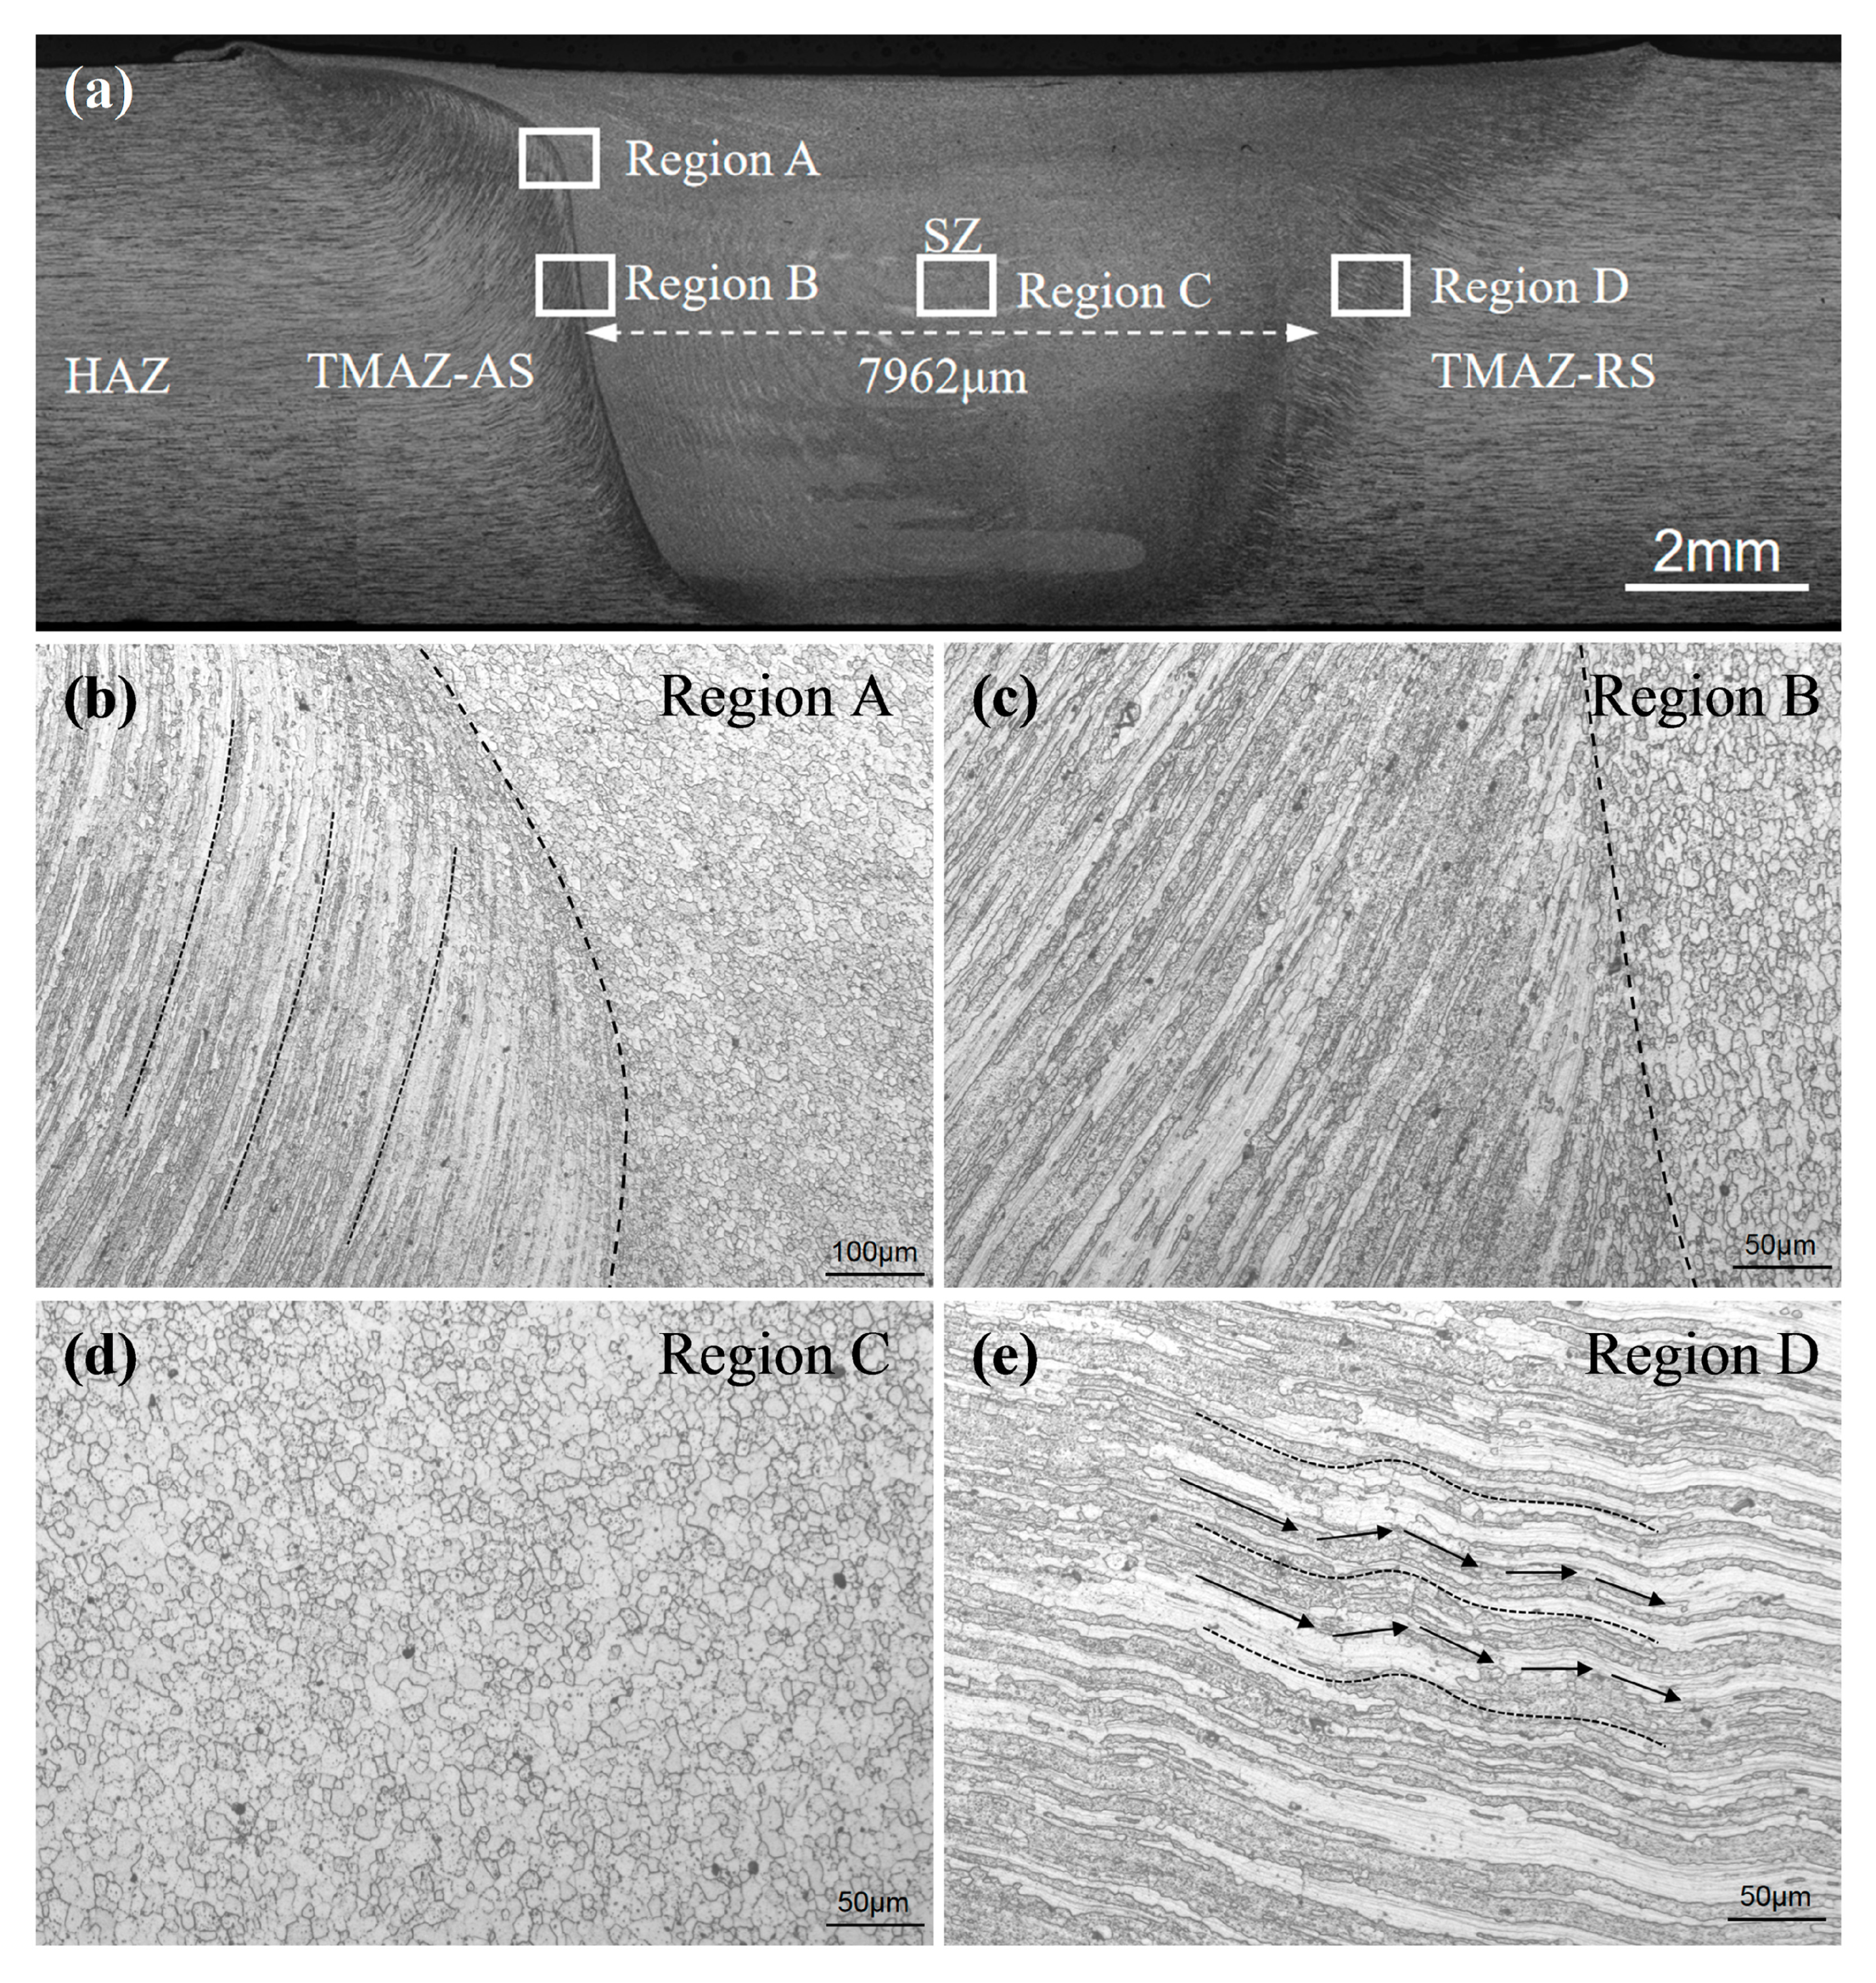
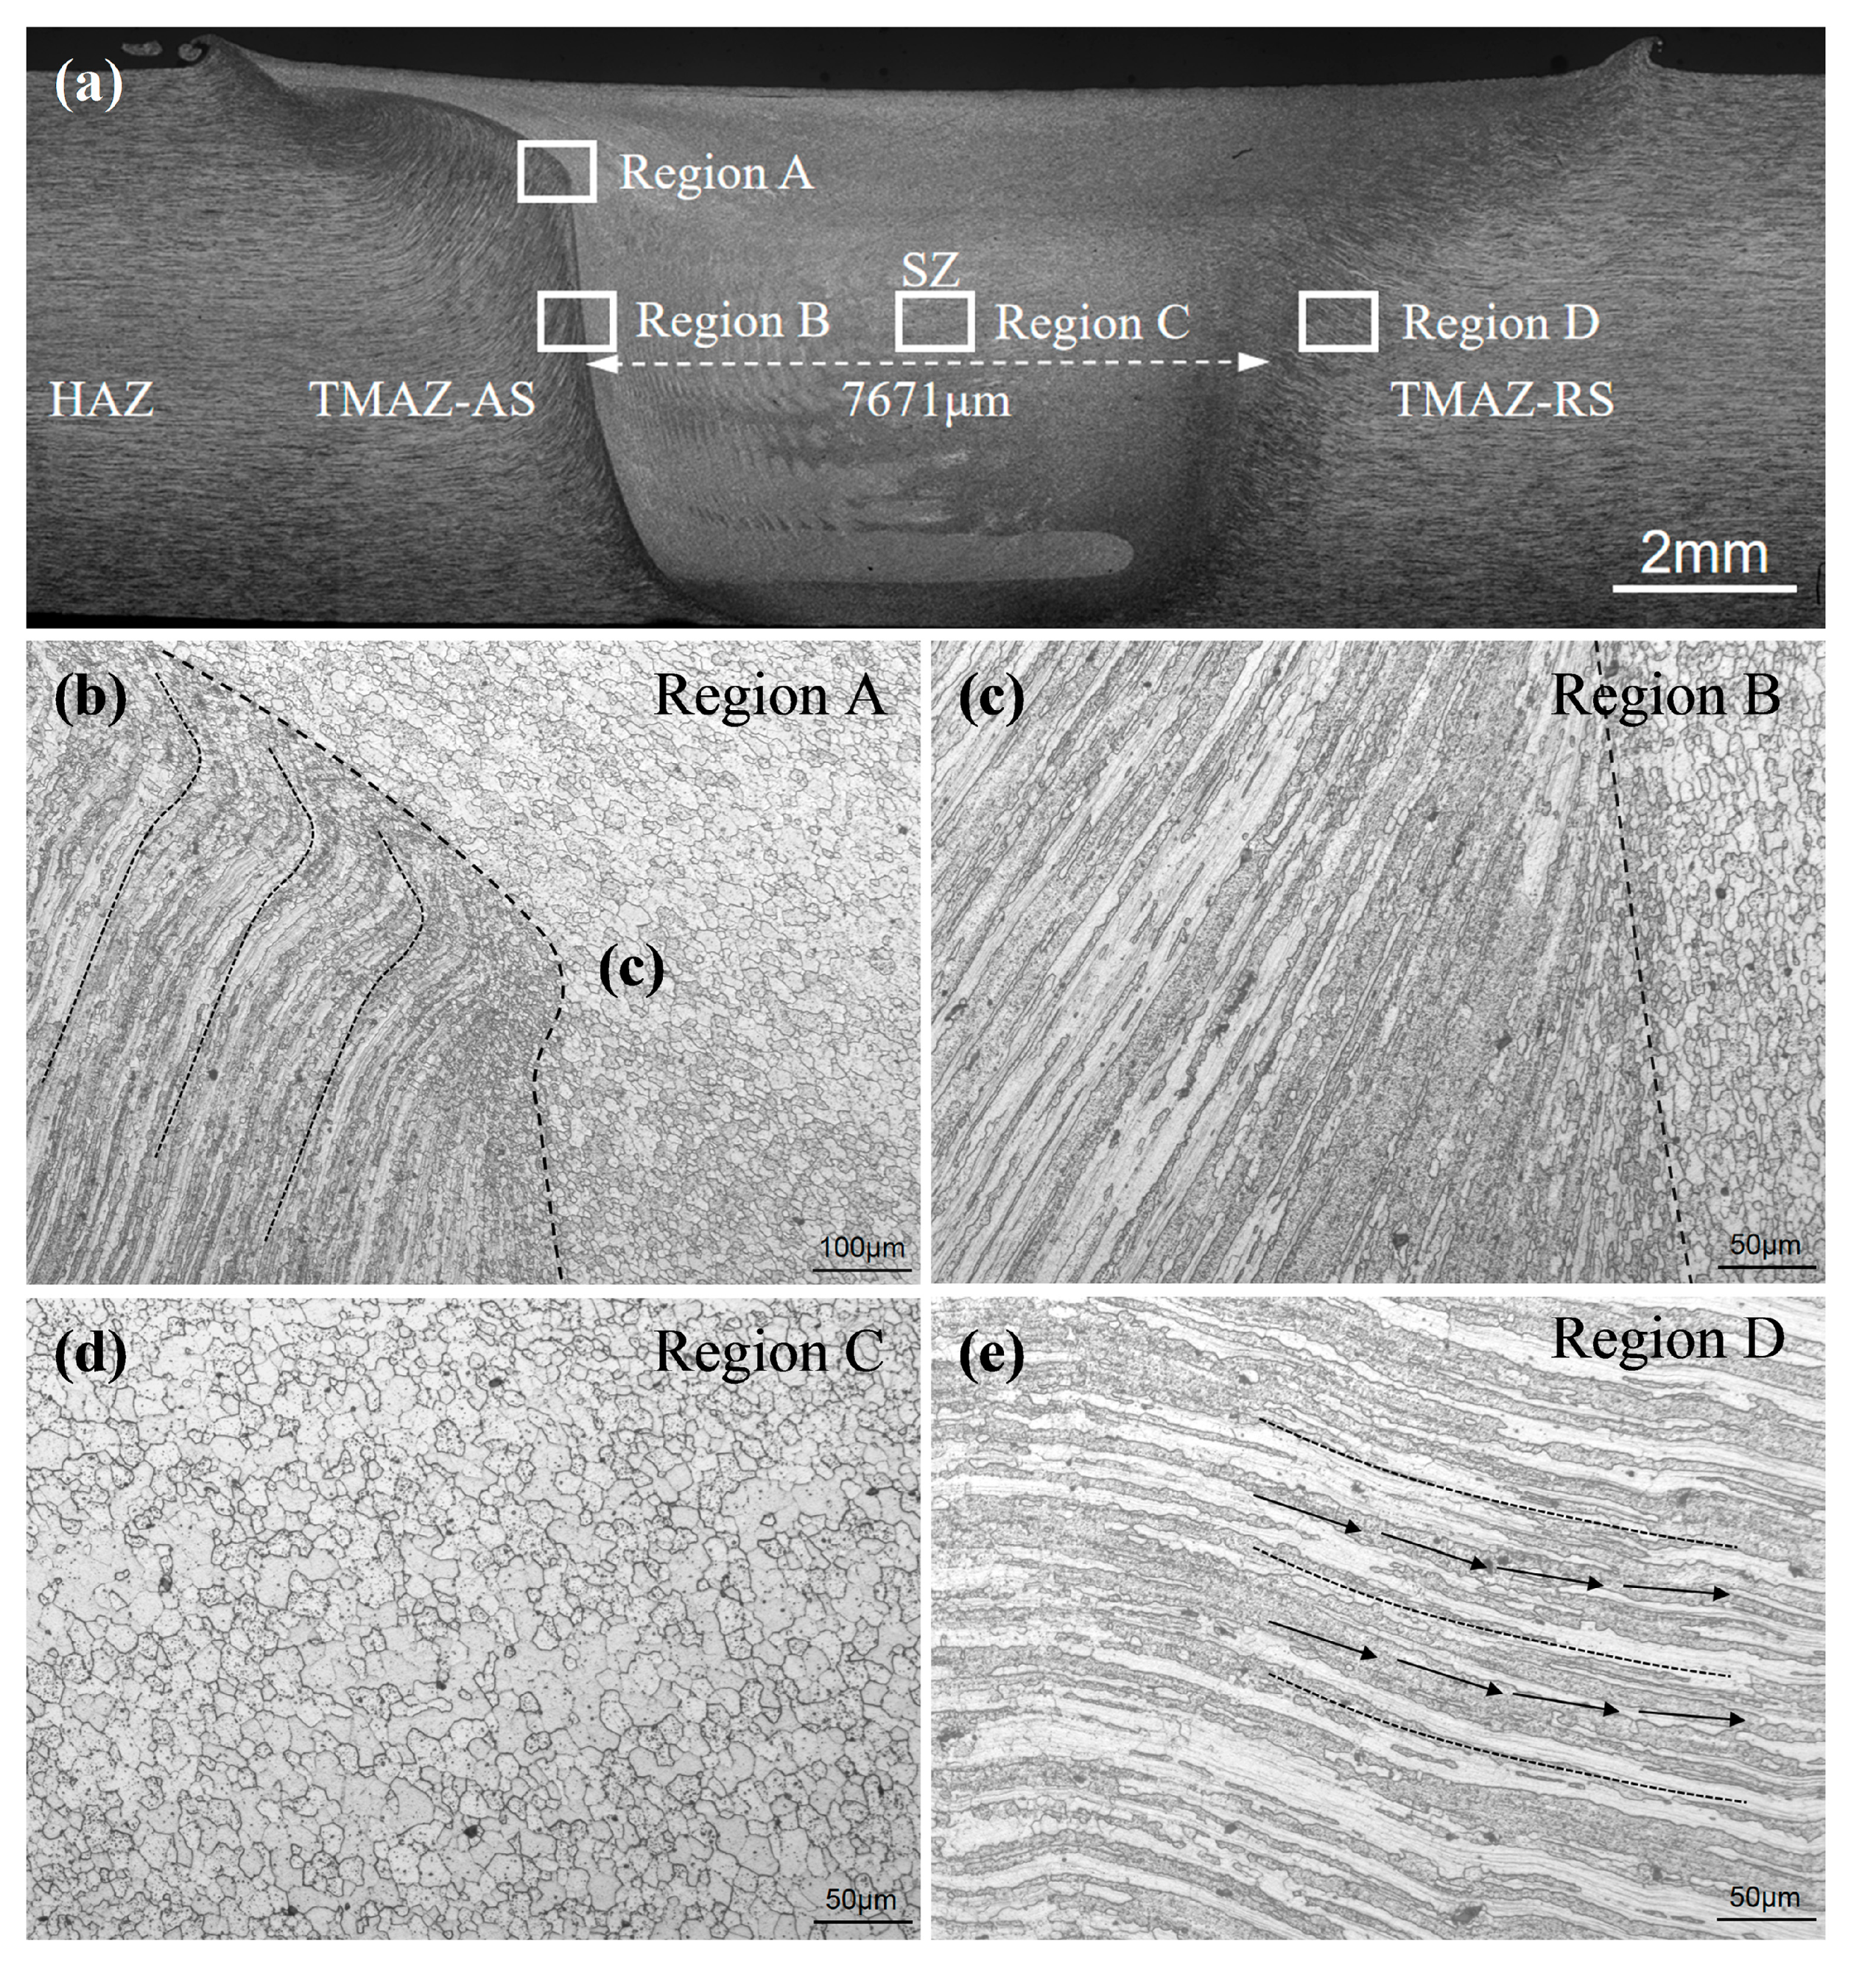
3.1. Microstructure
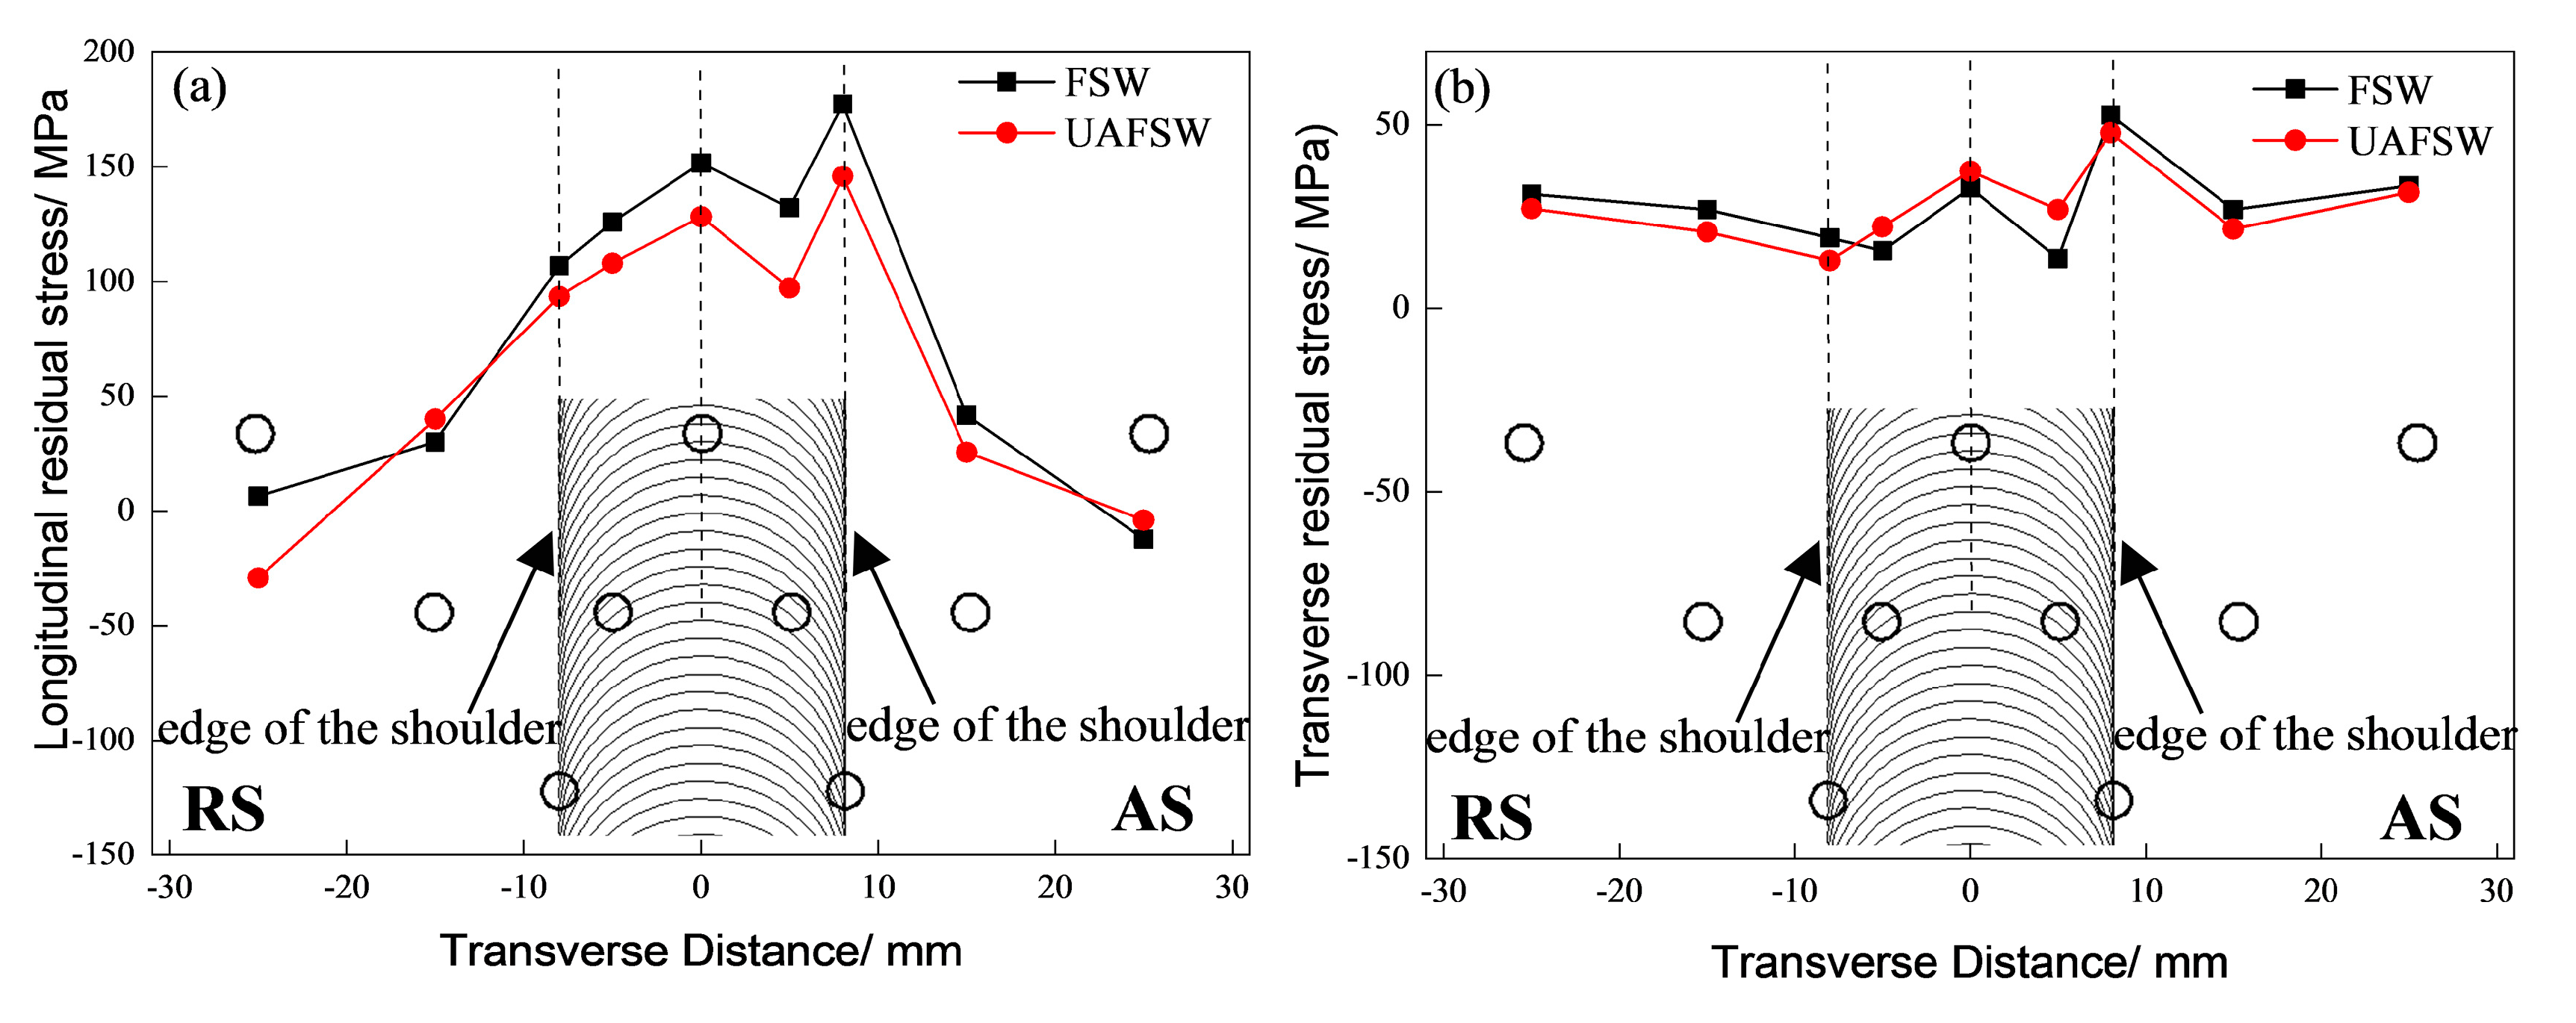
3.2. Residual Stresses Testing
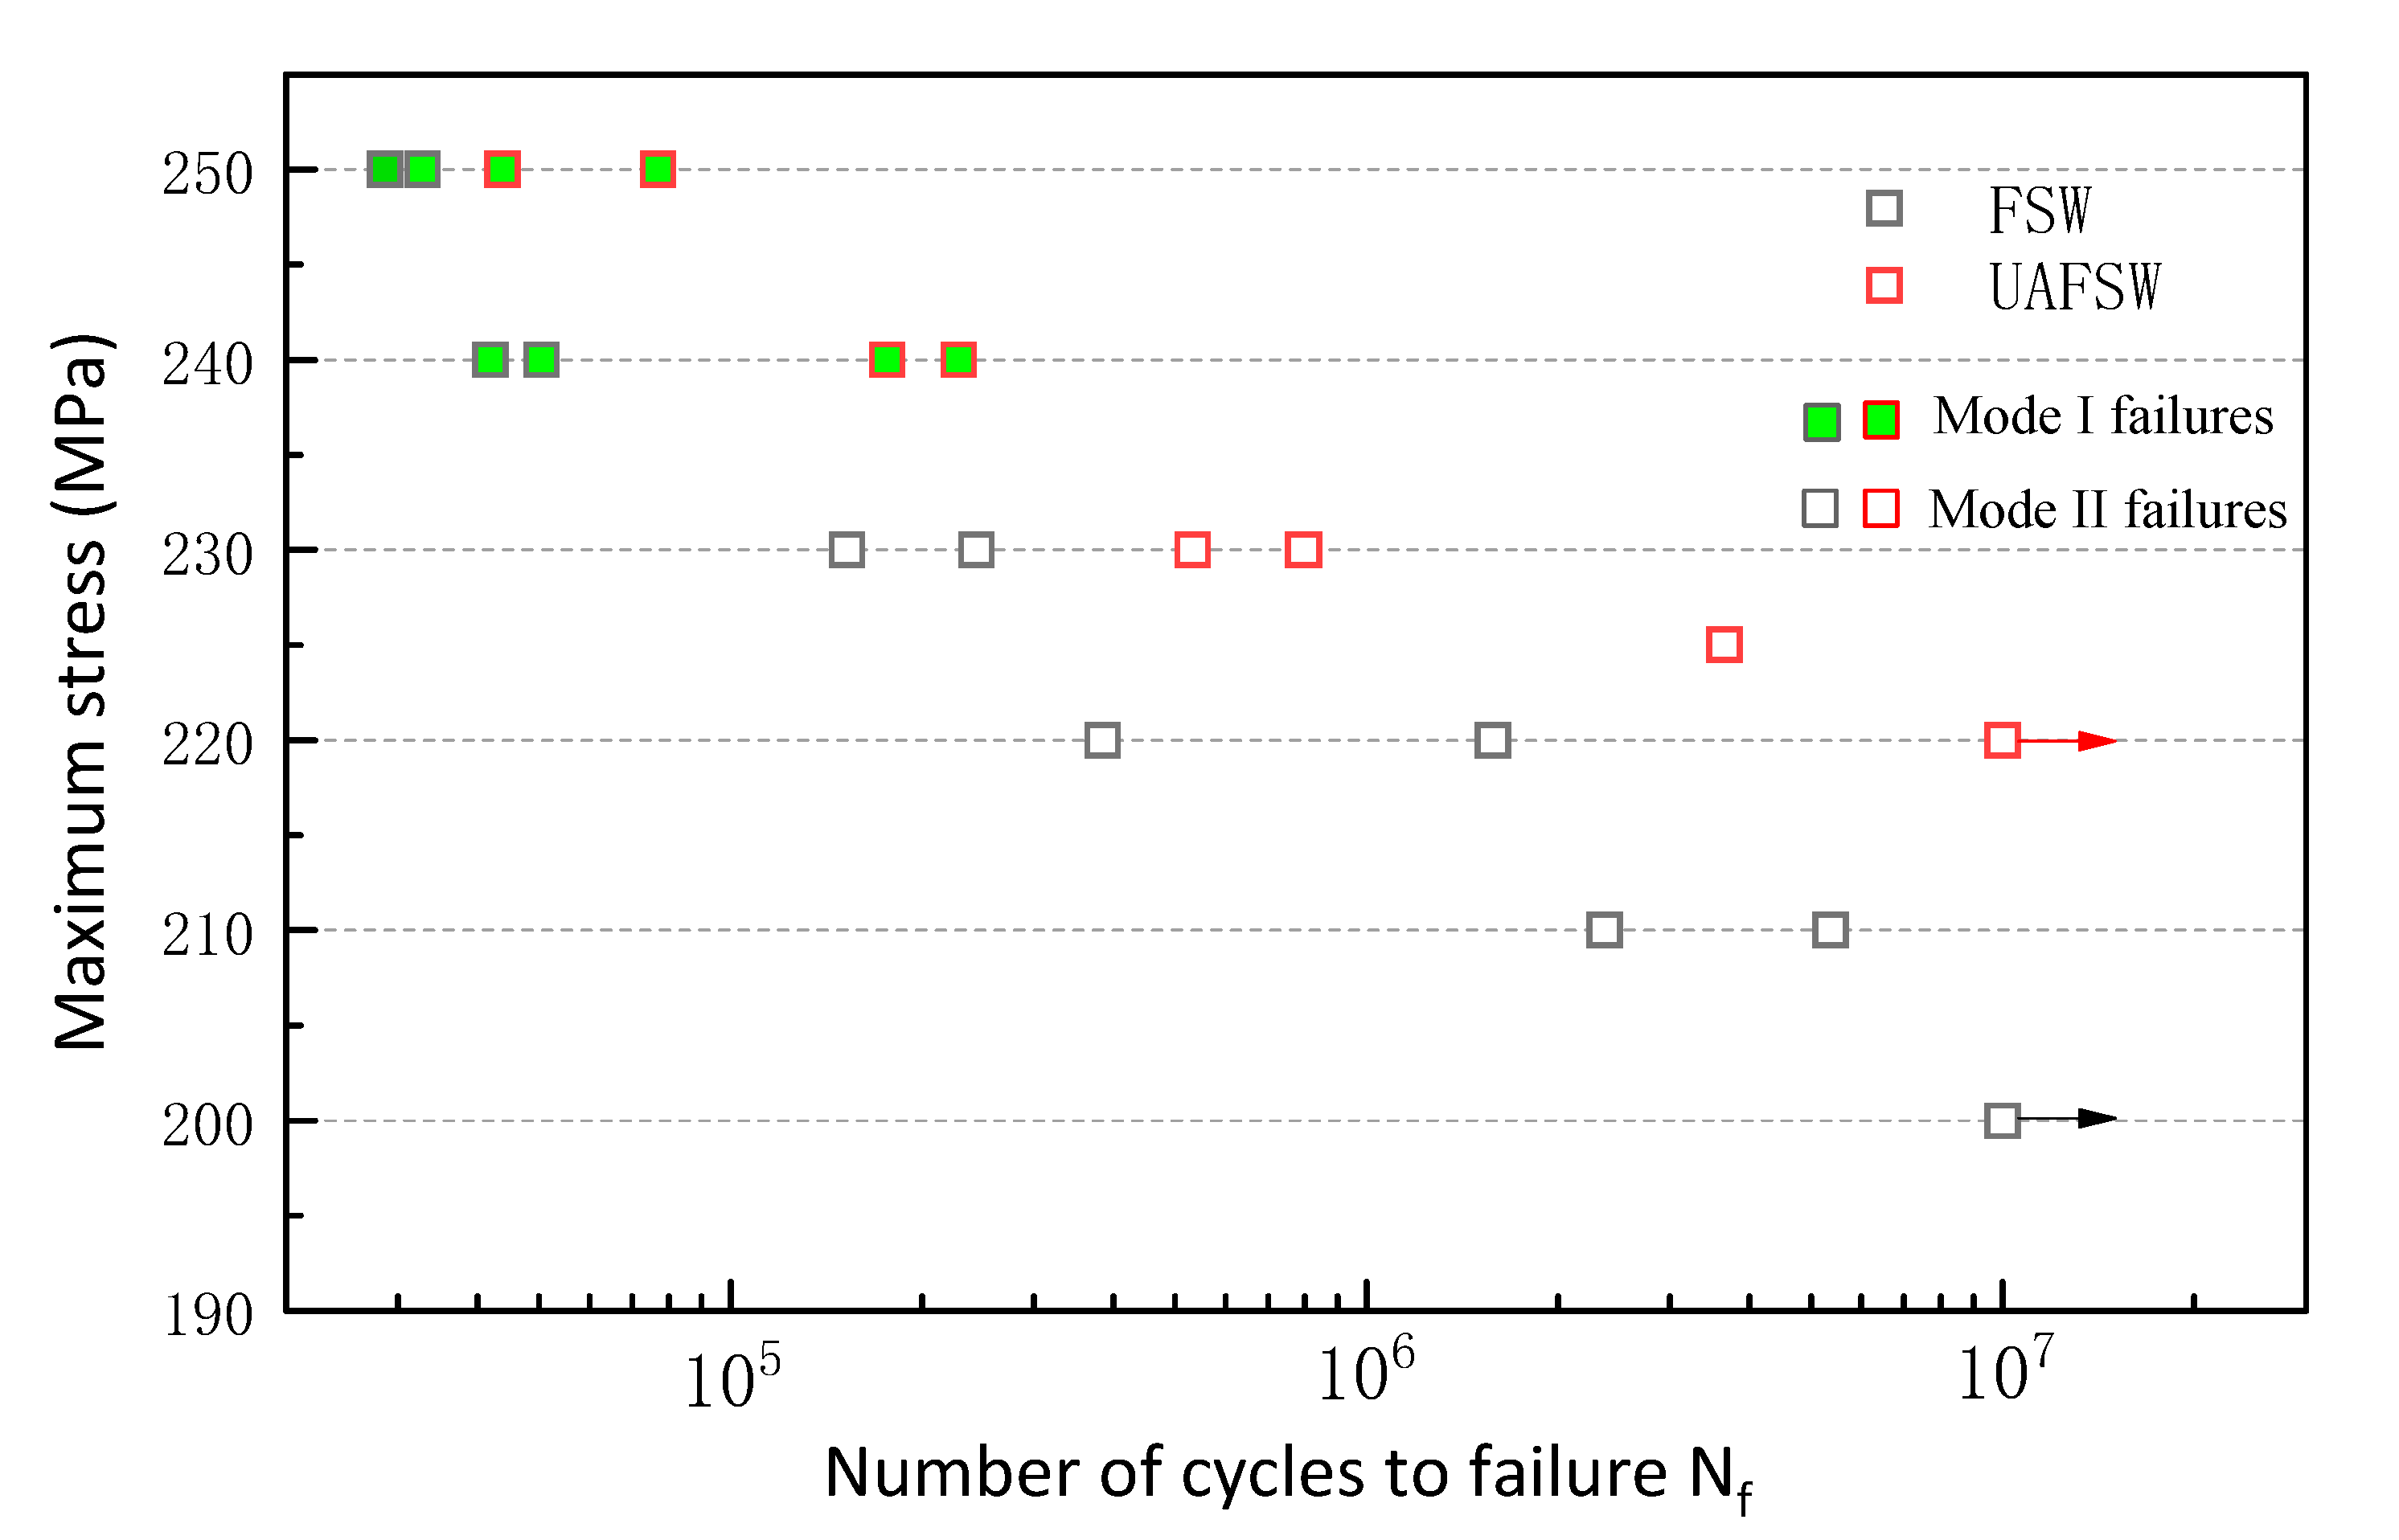
3.3. Fatigue Strength
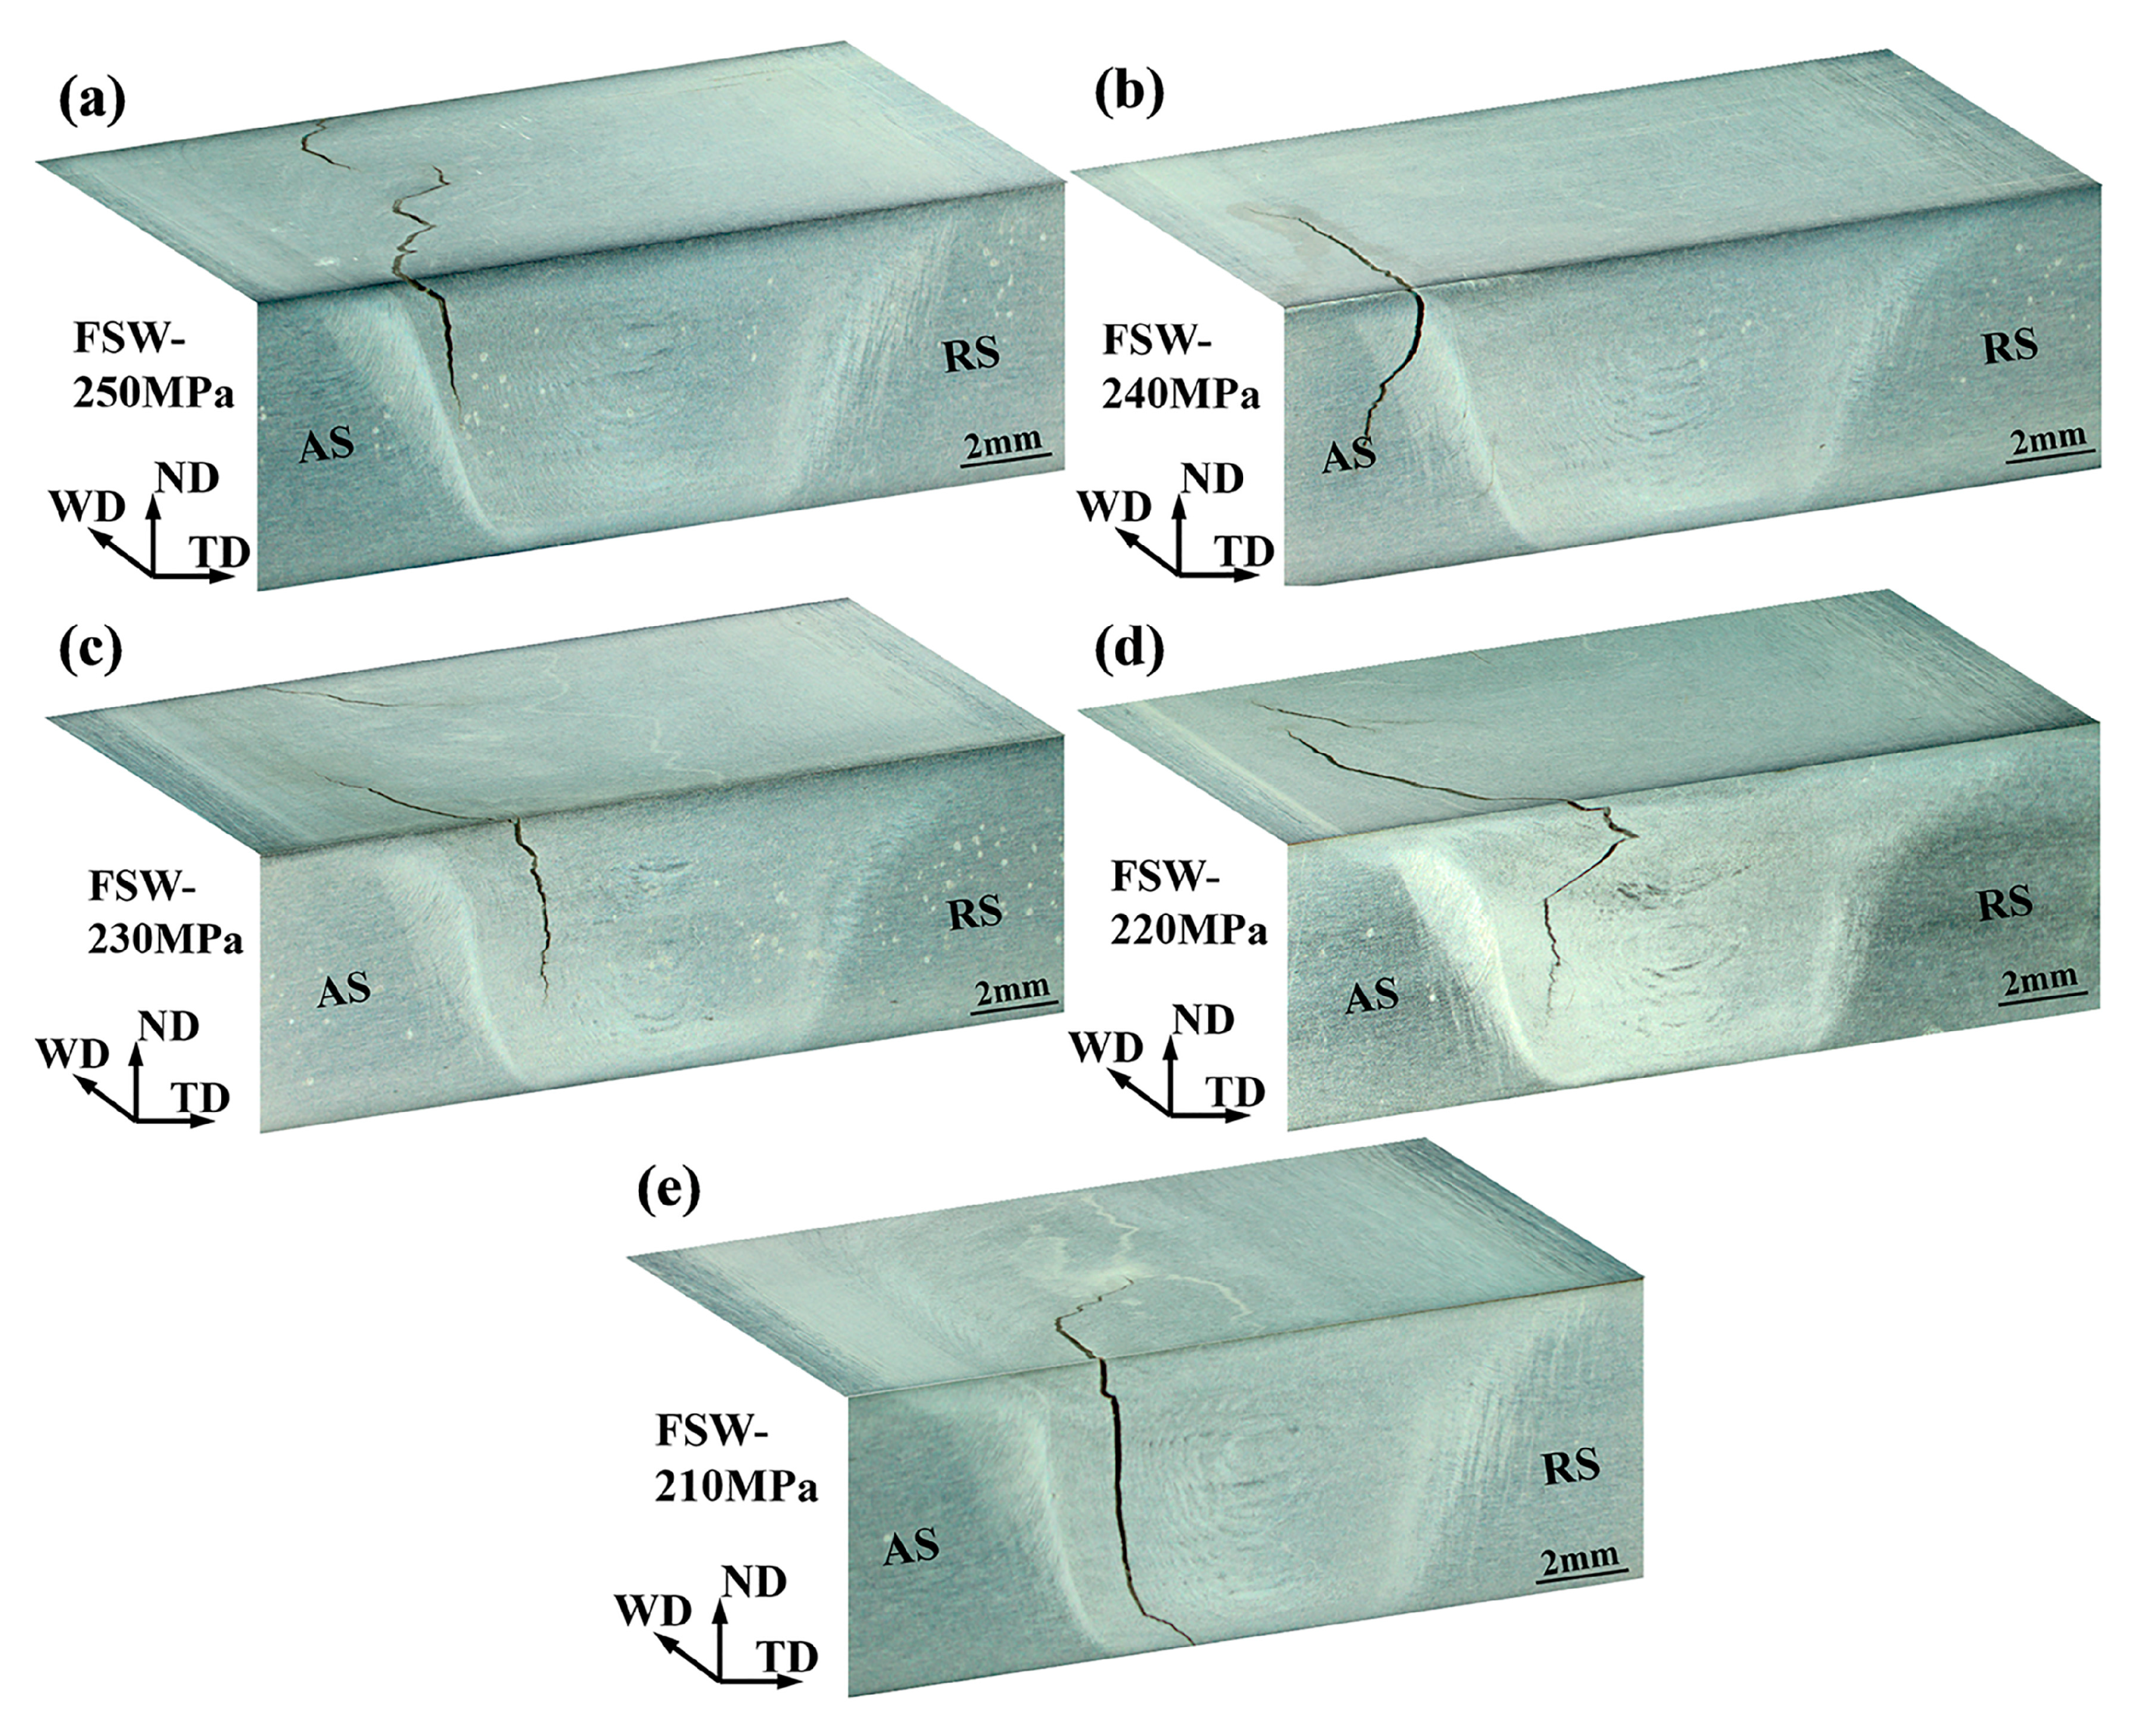
3.4. Fatigue Fracture Behaviour
4. Discussion
5. Conclusions
- (1)
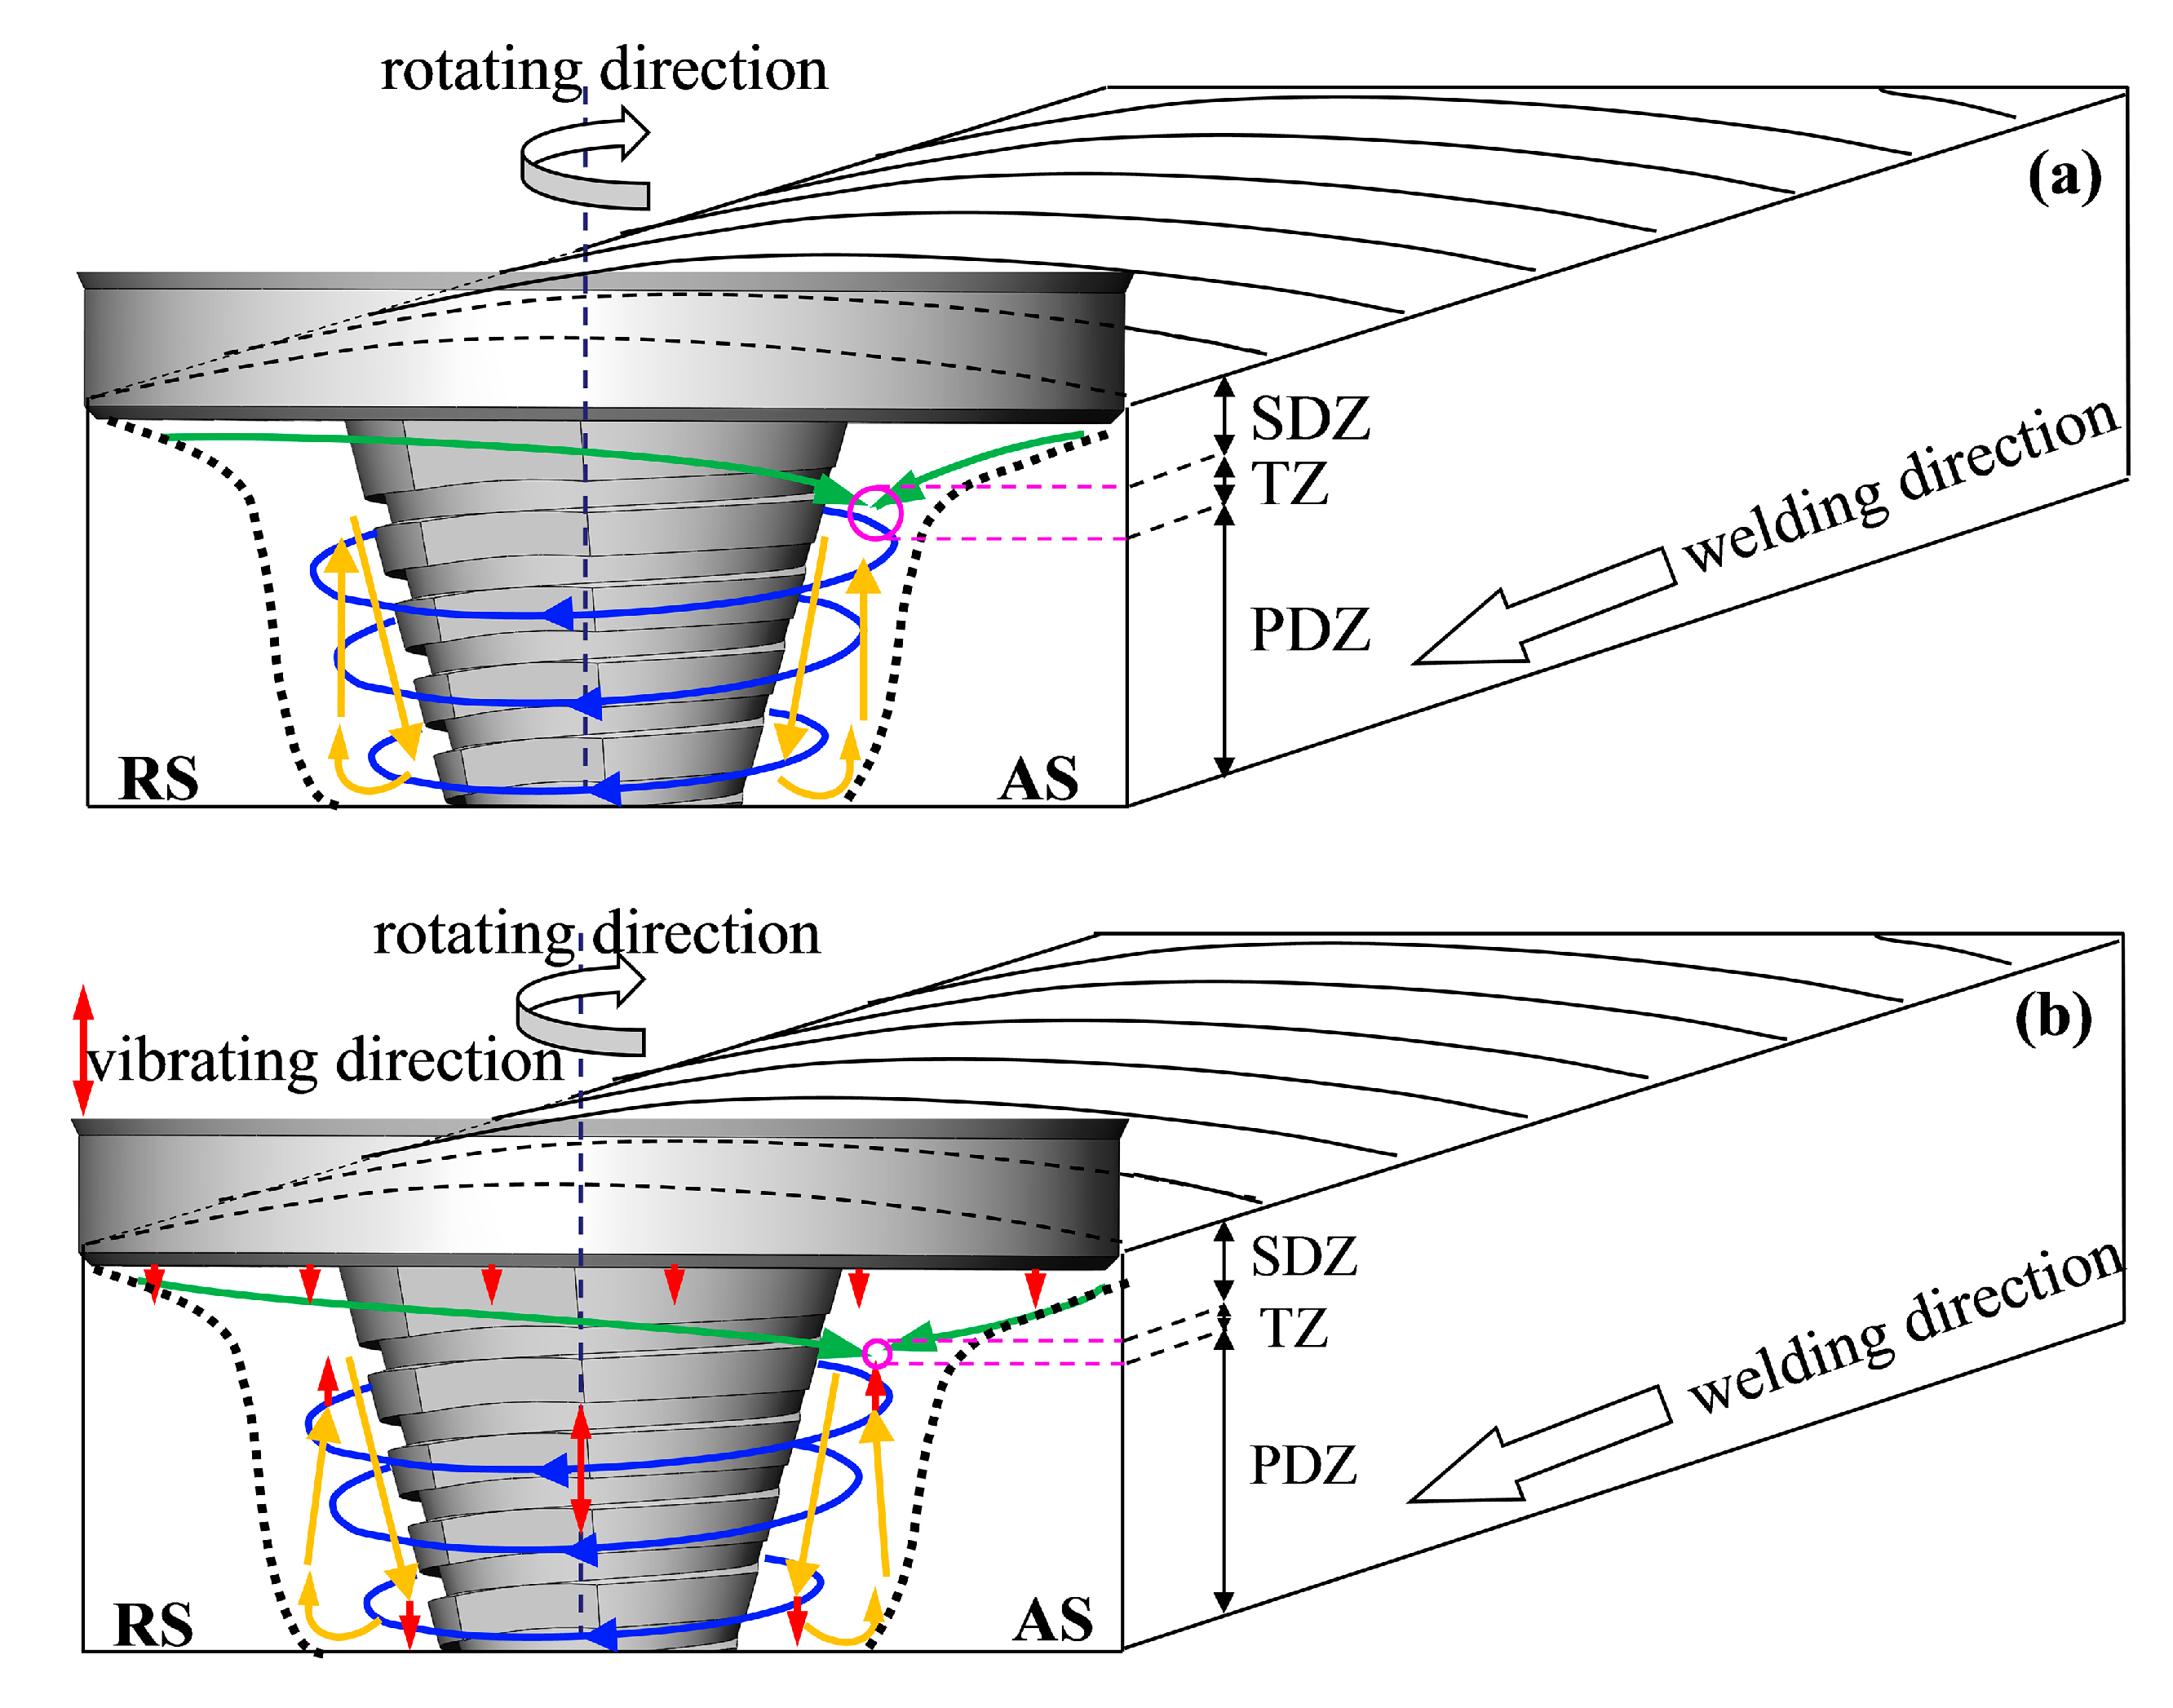
- The application of axial ultrasonic vibration can promote the metal flow of the SZ, resulting in a greater deformation of the SZ and an increased strain rate of the micro-regions for refining grains. Using the UAFSW method can significantly improve the fatigue performance of the welded joint. The fatigue limit of the UAFSW specimen is 220 MPa, which is 20 MPa higher than that of the FSW.
- (2)
- The difference in the transverse residual stresses between the FSW and the UAFSW is very small. The maximum longitudinal residual stresses of the two joints is located near the edge of the tool shoulder on the AS, which can be reduced by 17.8% by ultrasonic vibration. This may be mainly due to the reduction in the boundary distortion of SZ/TMAZ and the local heat generation by ultrasonic vibration.
- (3)
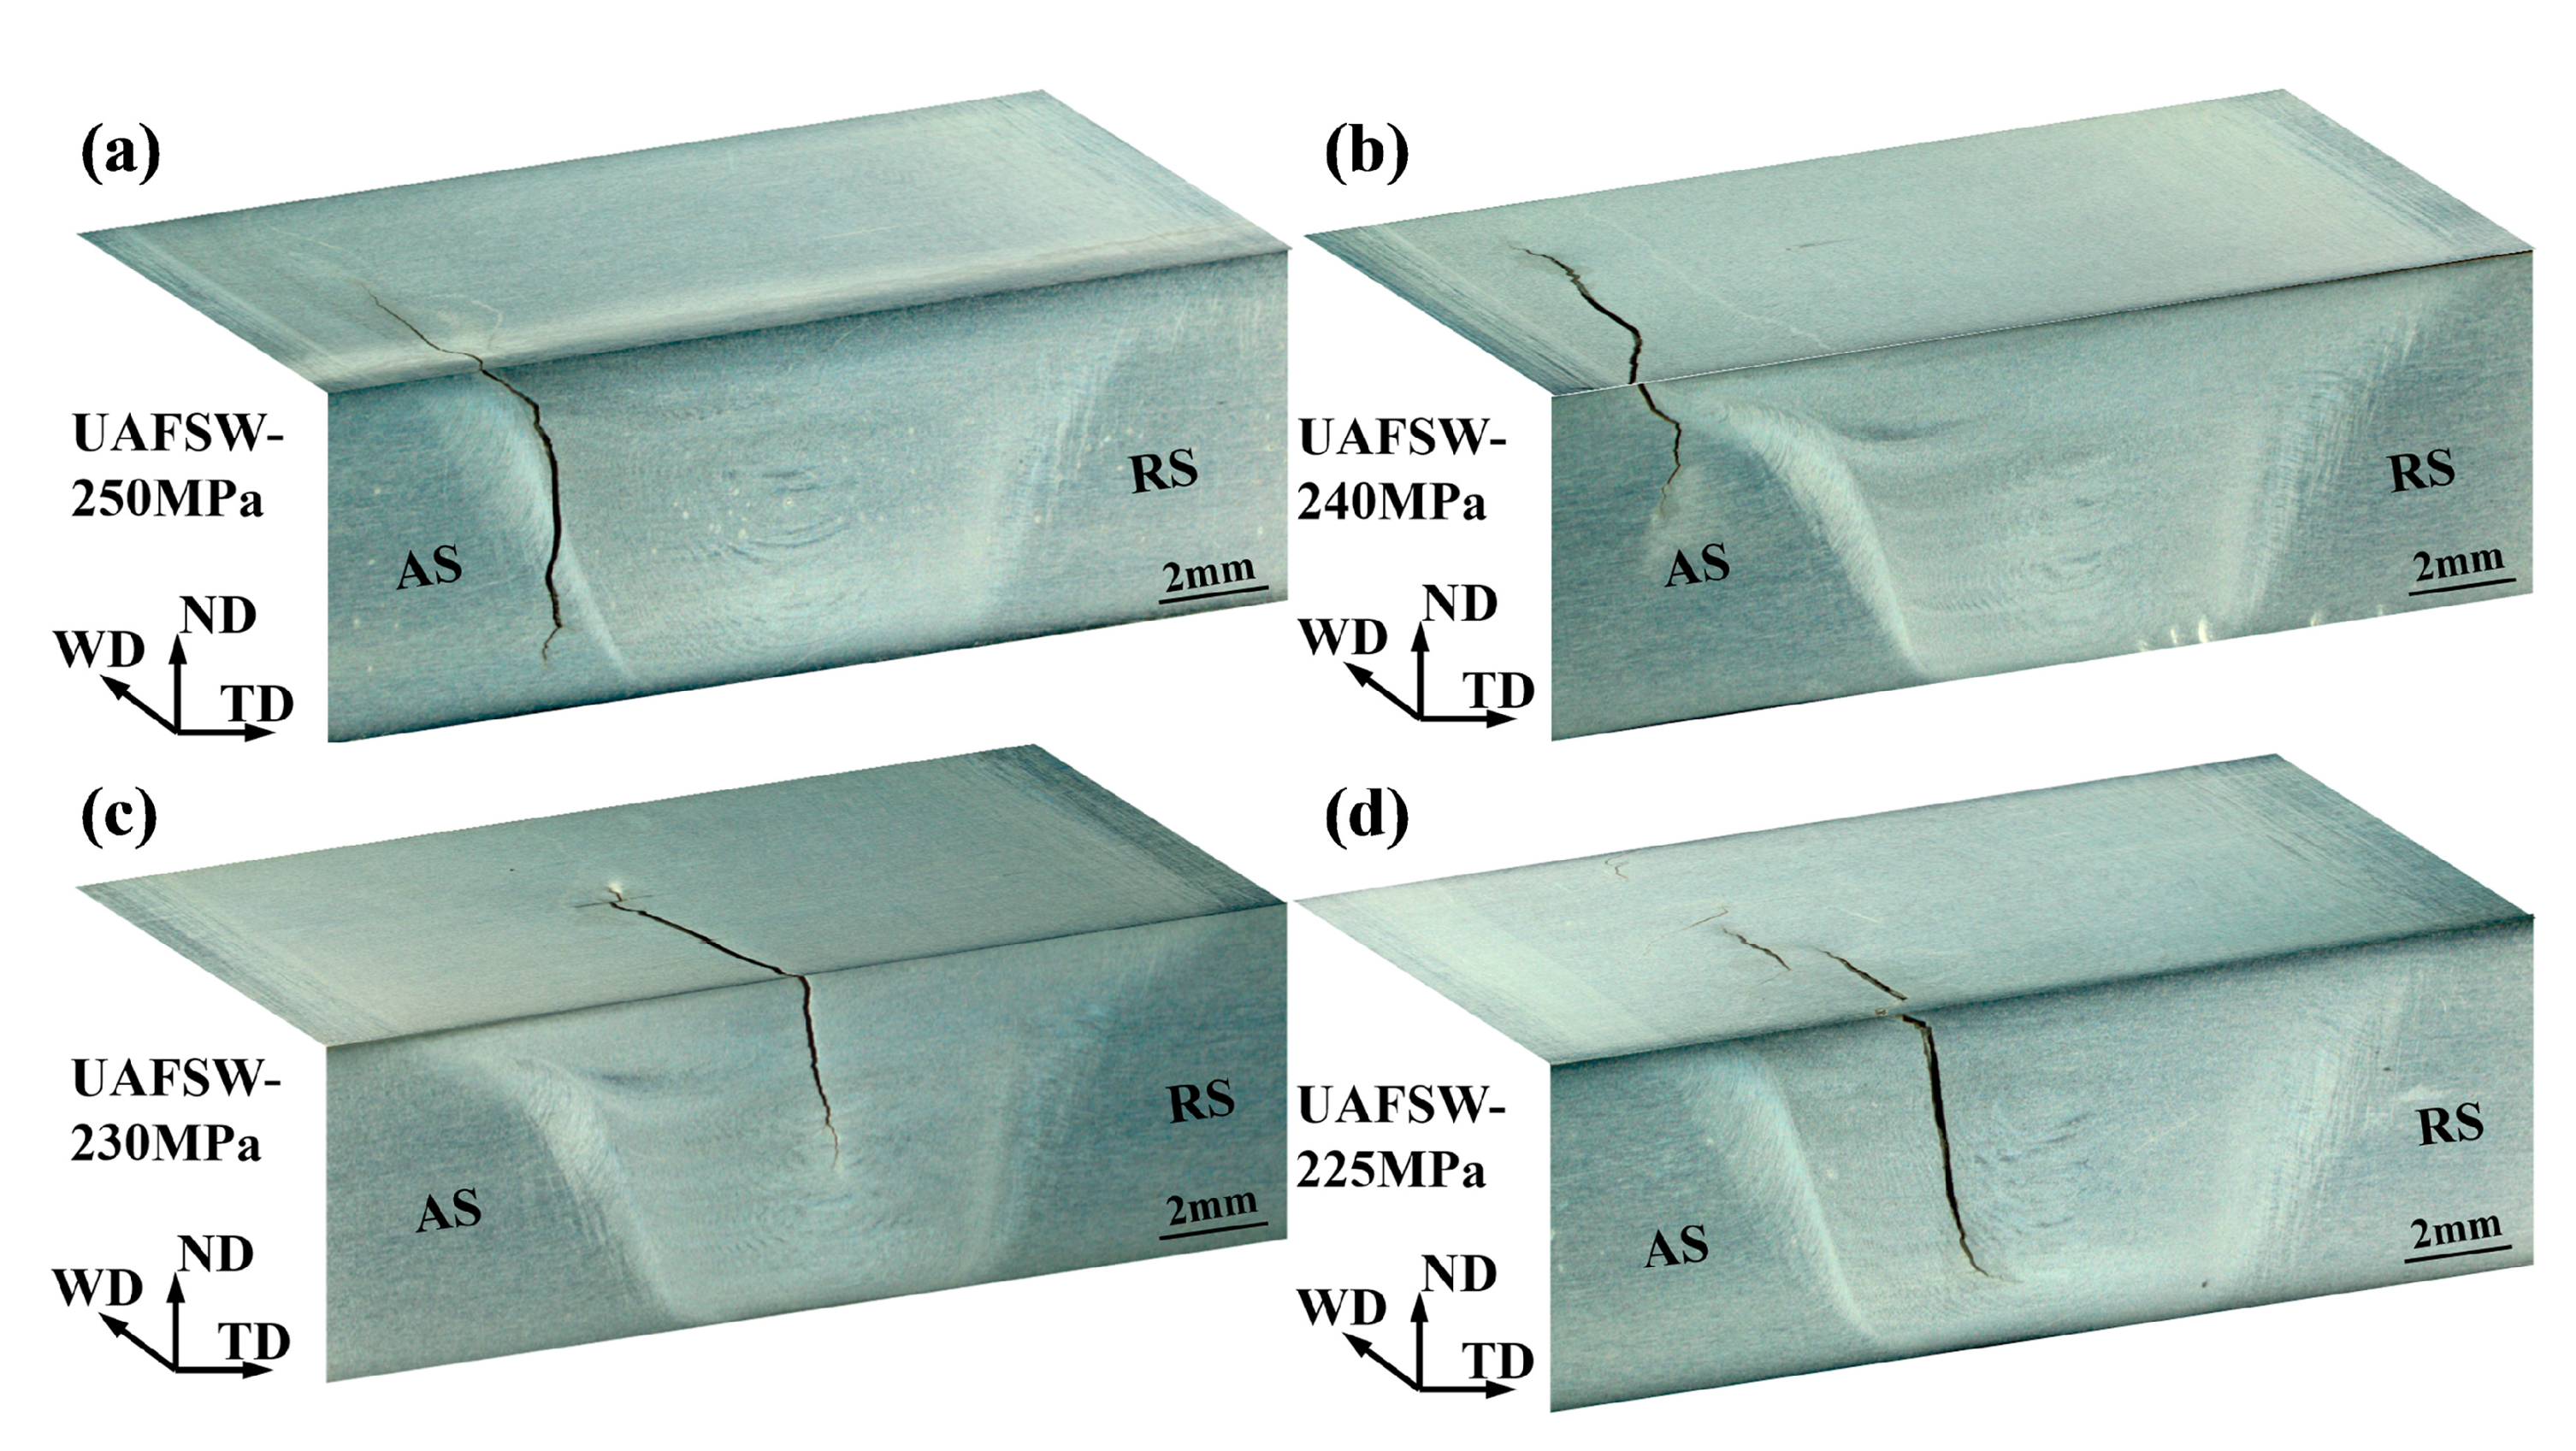
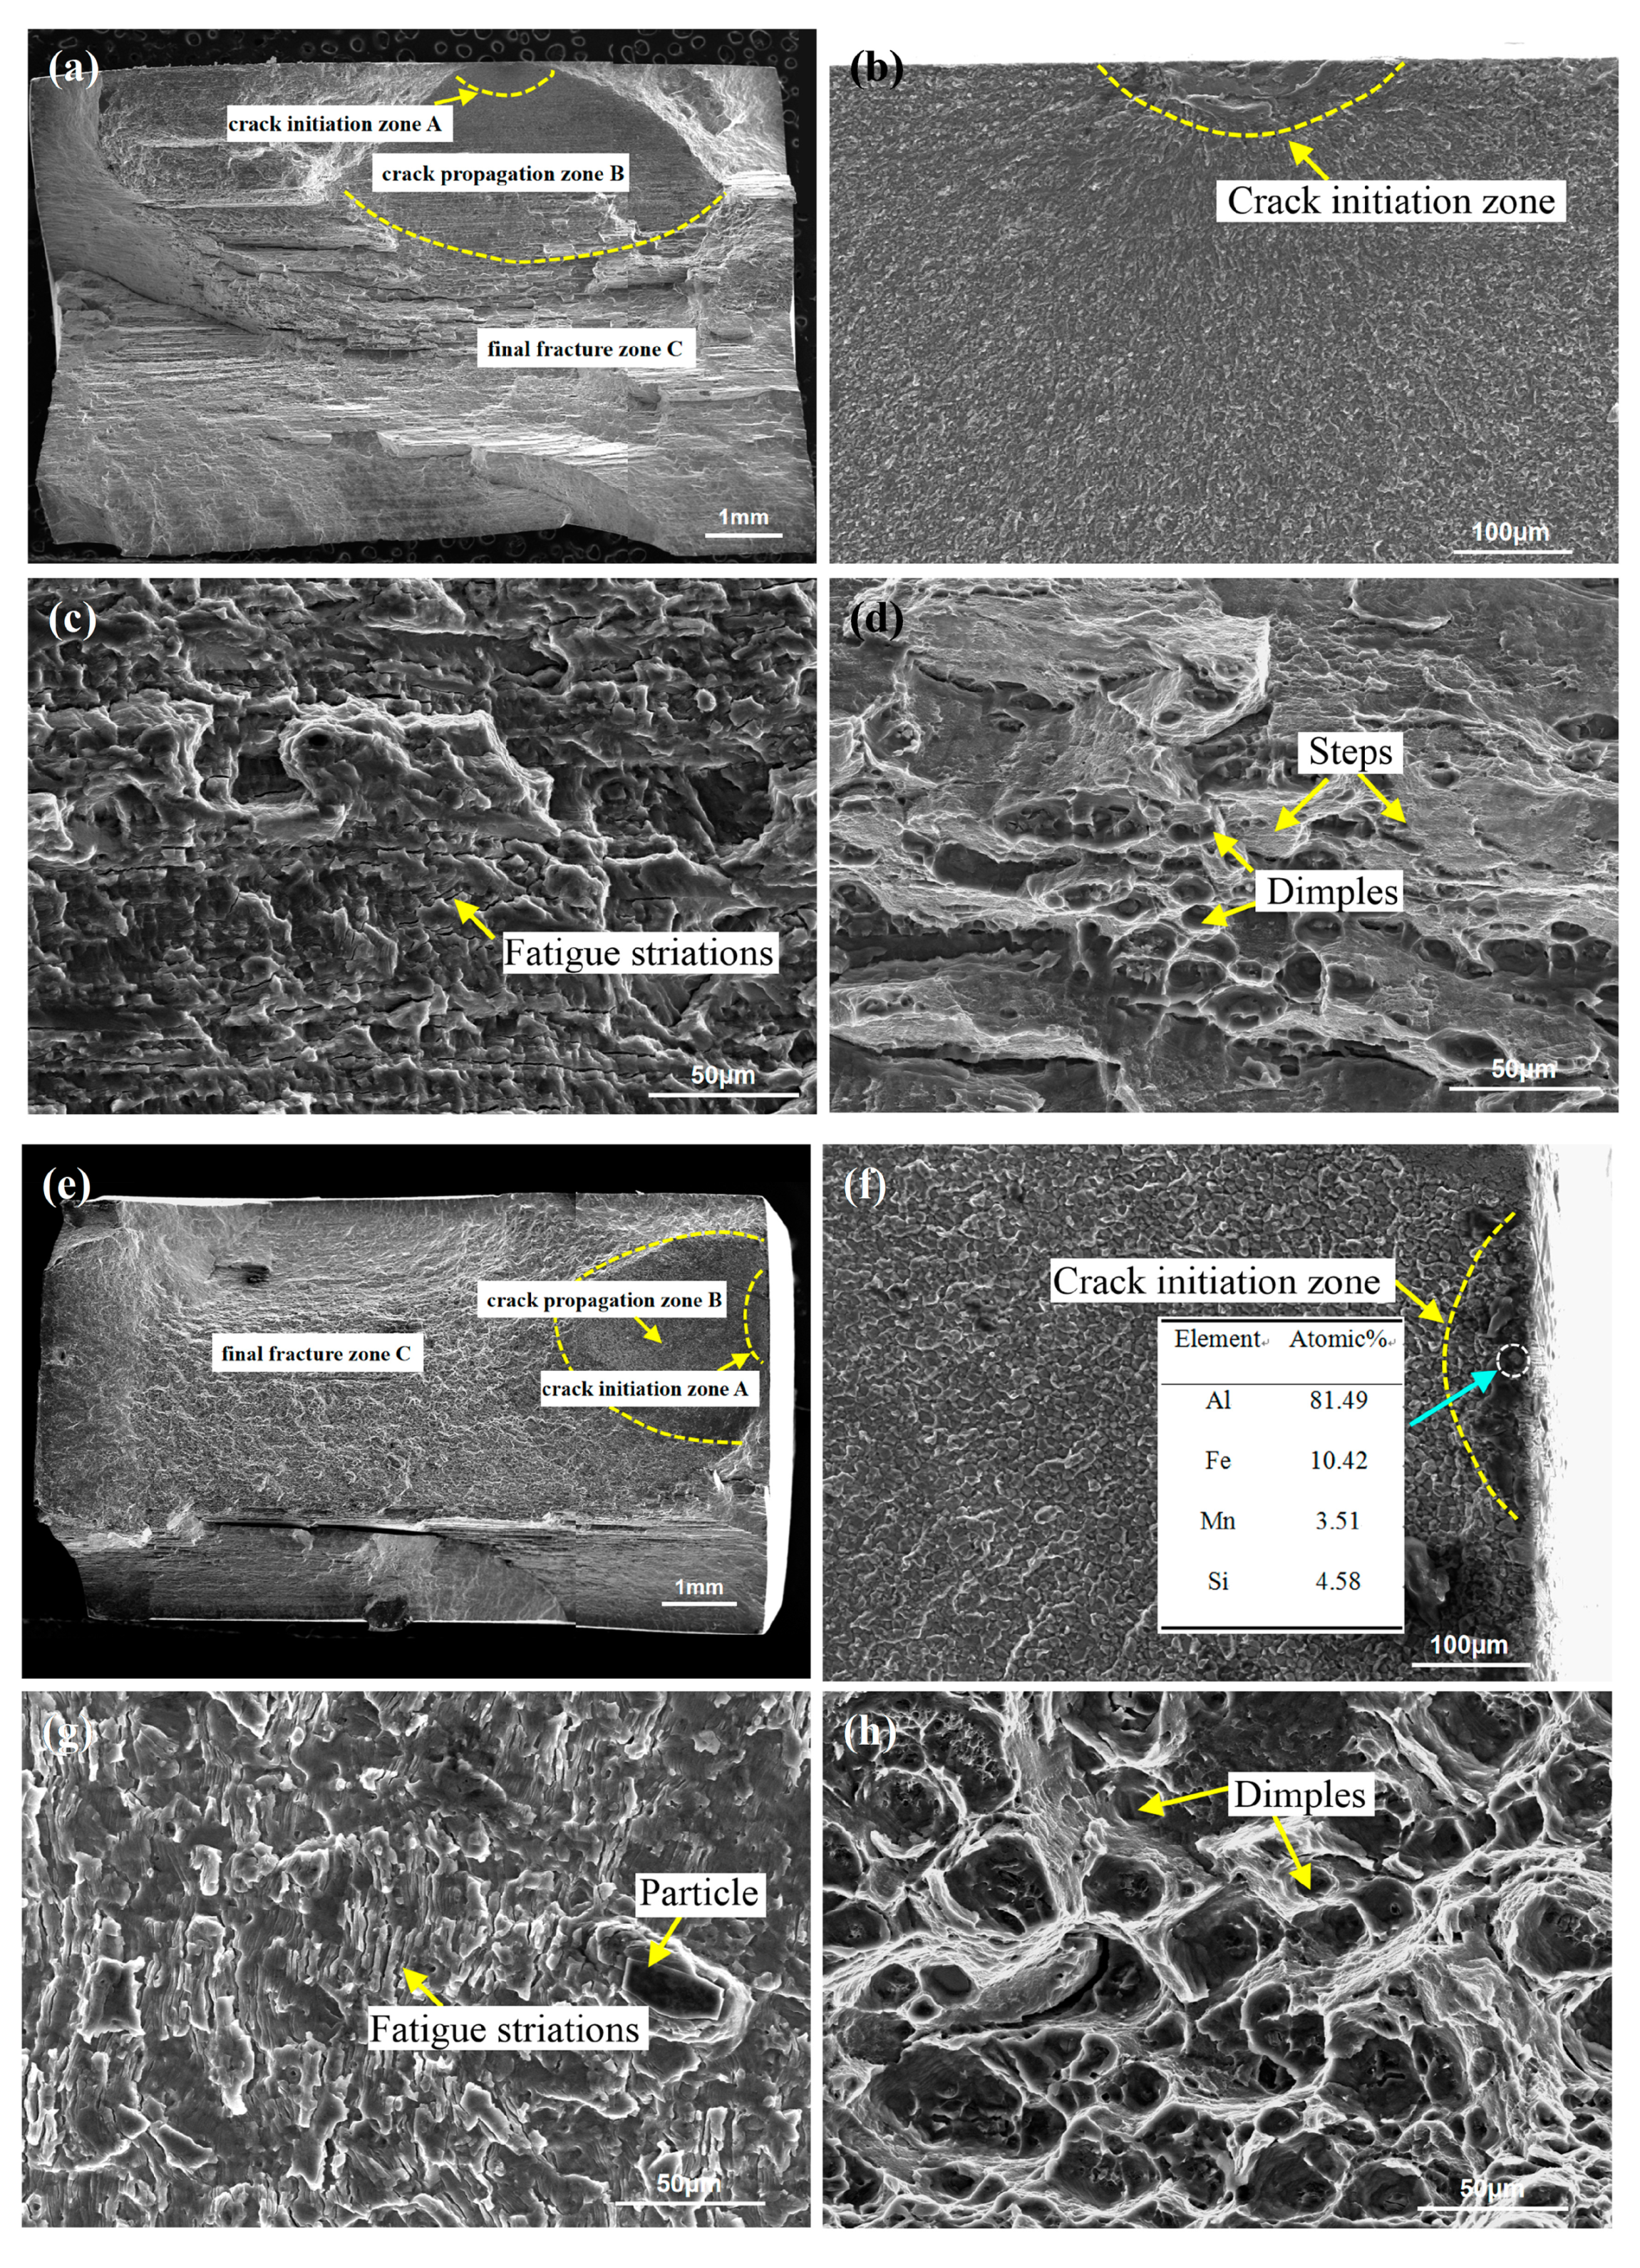
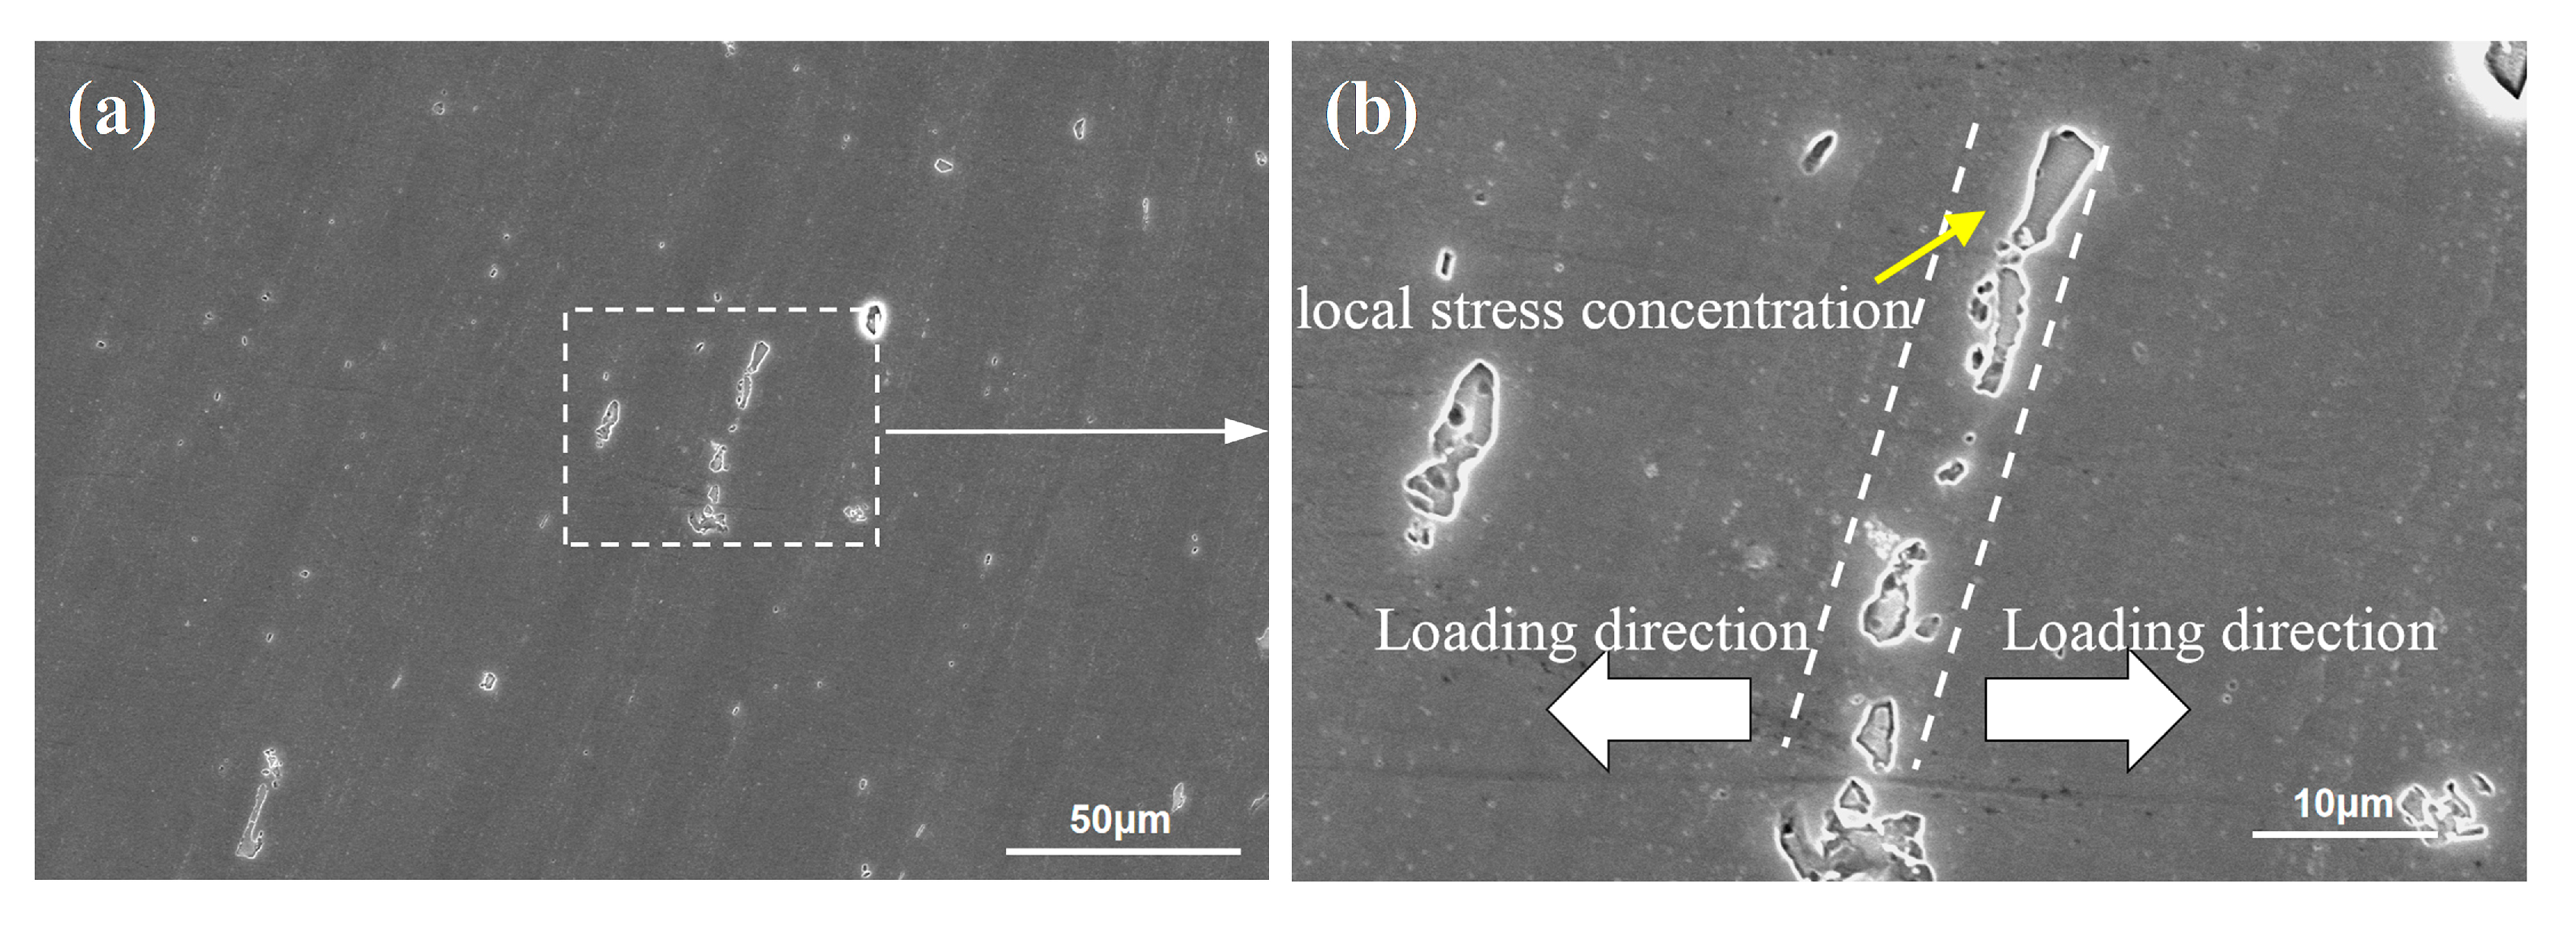
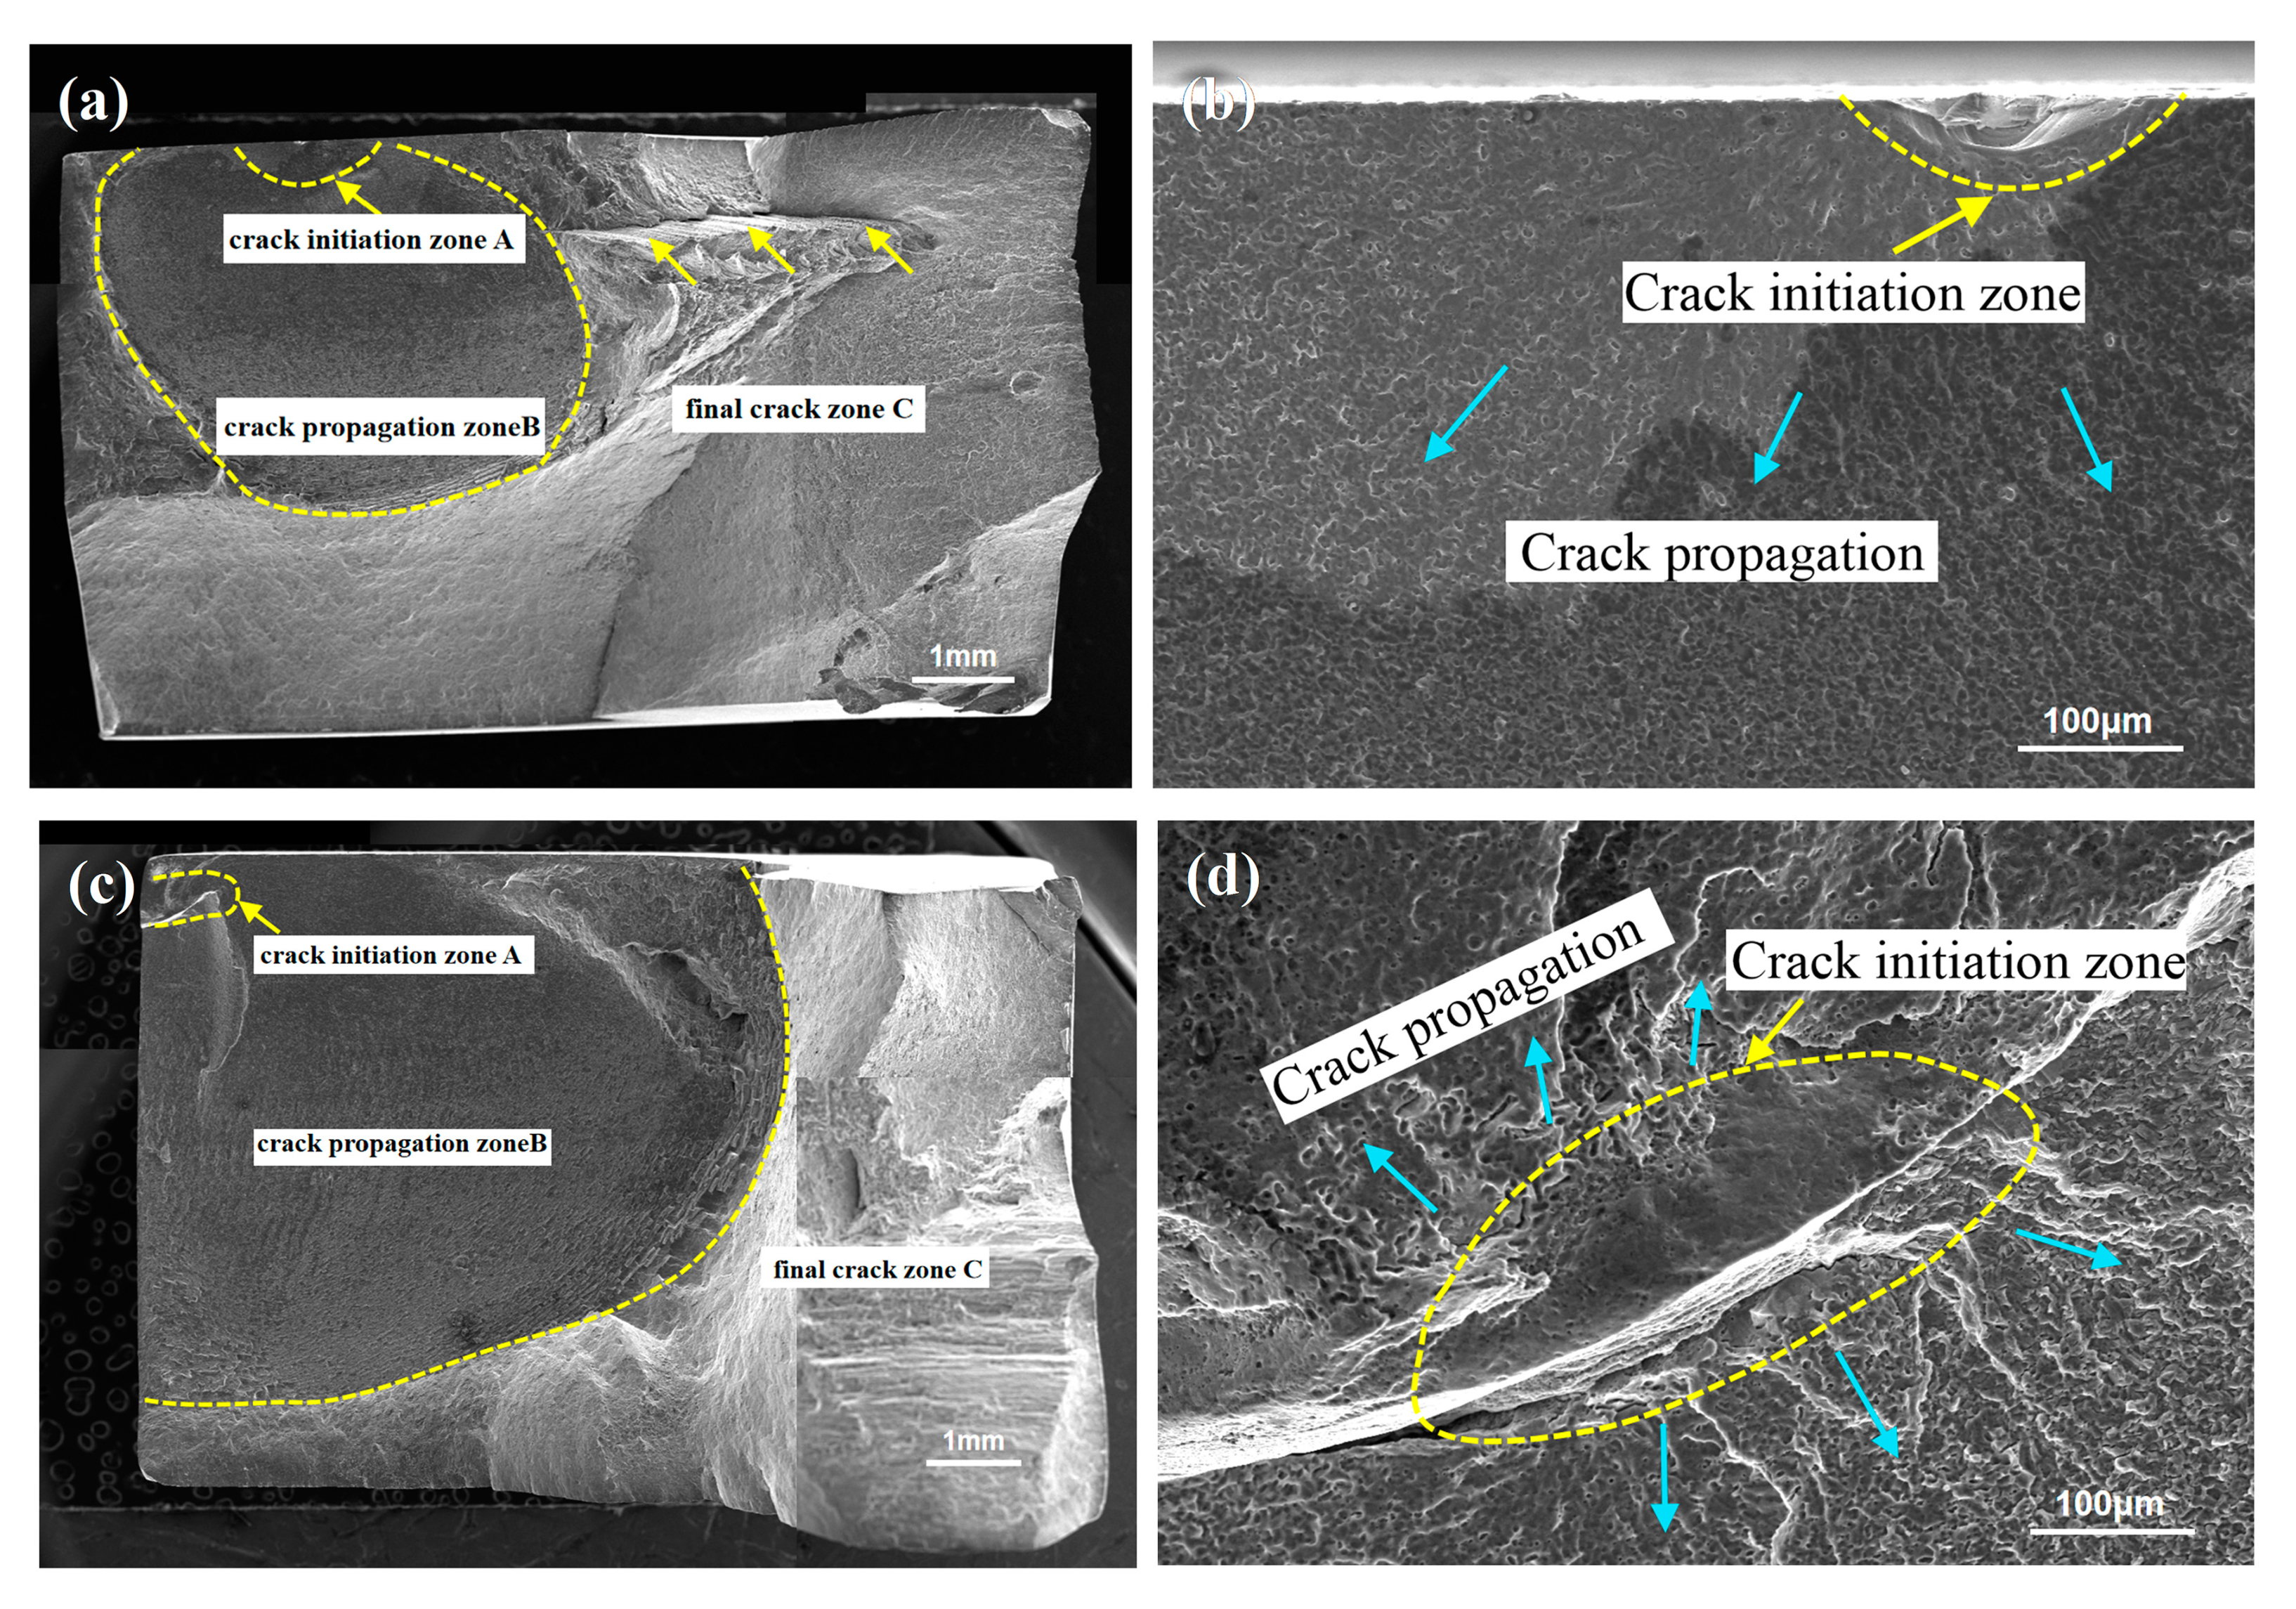
- The joints show different fracture modes under different stress conditions. Both FSW and UAFSW specimens fracture at the TMAZ-AS under high-stress levels. Under alternating loads, second-phase particles on the TMAZ grain boundary are likely to cause stress concentration. Moreover, micro-zone high residual stresses and SZ/TMAZ microstructure difference also aggravate the nonuniform deformation, leading to crack initiation.
- (4)
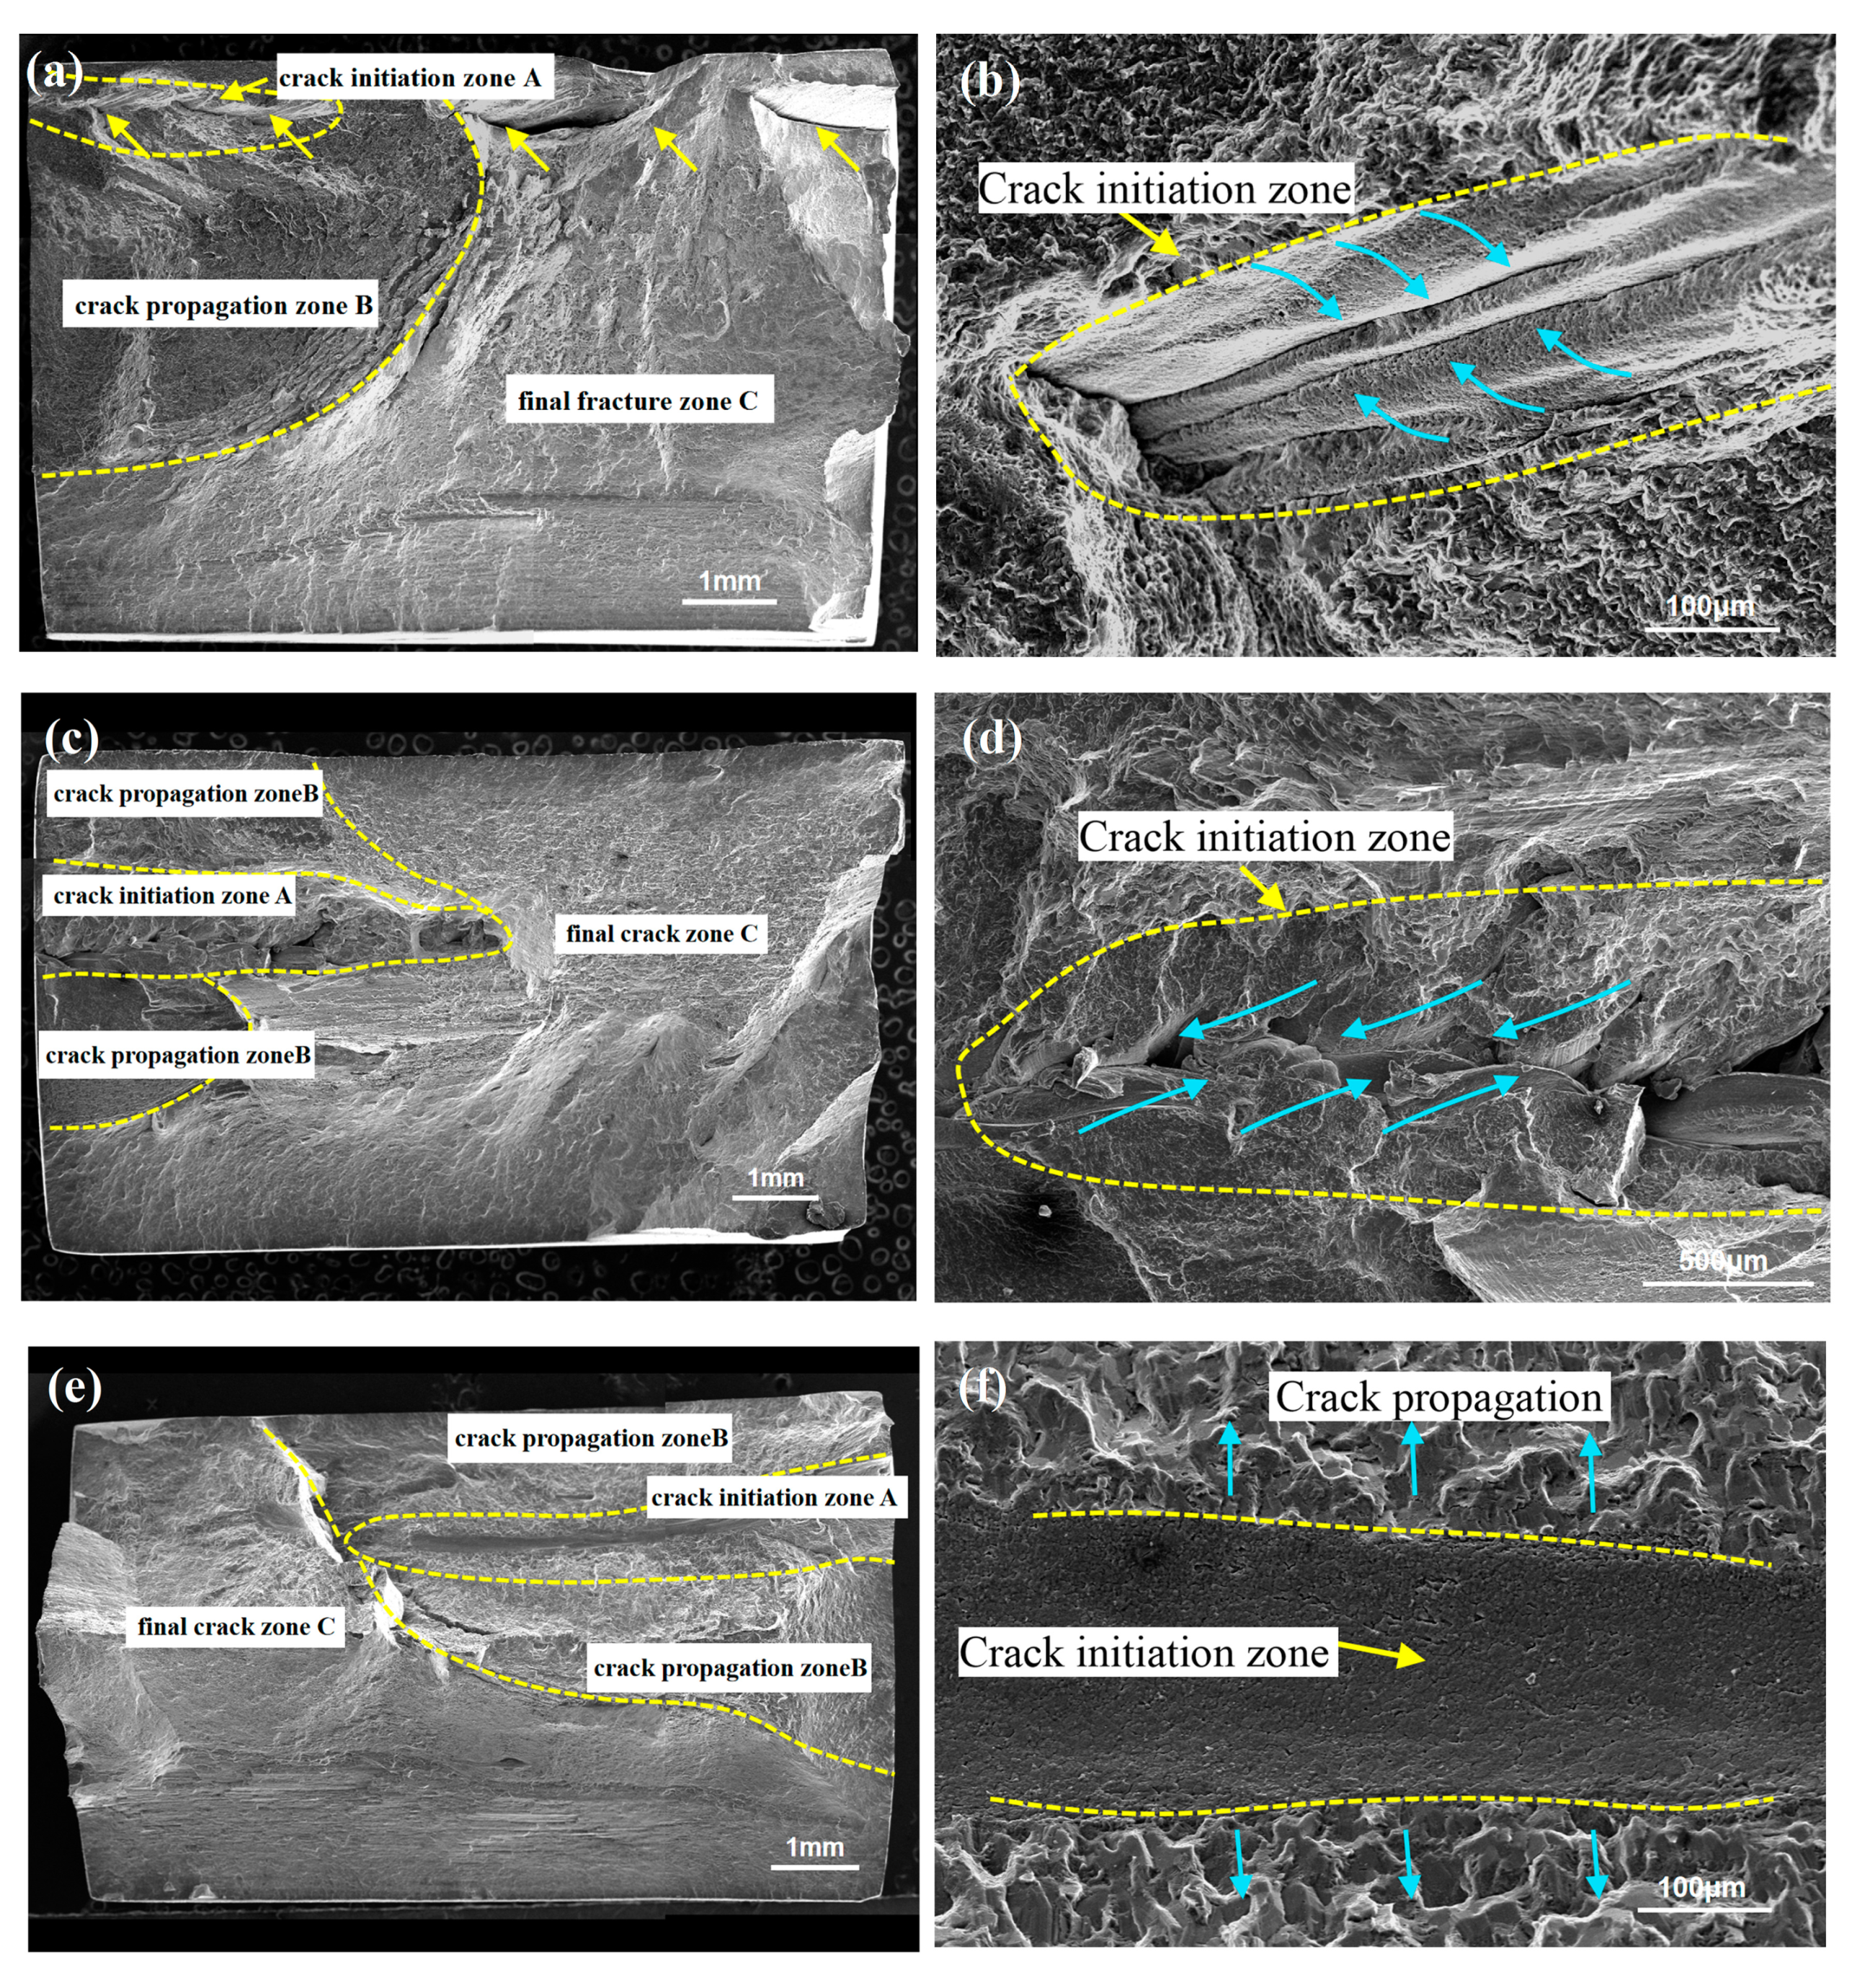
- Under low-stress levels, fatigue crack initiation is prone to occur near the TZ and eventually fracture in the SZ. Axial ultrasonic vibration promotes the metal convergence from the SDZ and the PDZ, resulting in a more uniform and denser microstructure of TZ, thereby reducing the probability of forming loose defects in the TZ and improving the fatigue life.
Author Contributions
Funding
Conflicts of Interest
References
- Rouhi, S.; Mostafapour, A.; Ashjari, M. Effects of welding environment on microstructure and mechanical properties of friction stir welded AZ91C magnesium alloy joints. Sci. Technol. Weld. Join. 2016, 21, 25–31. [Google Scholar] [CrossRef]
- De Filippis, L.A.; Serio, L.M.; Palumbo, D.; De Finis, R.; Galietti, U. Optimization and Characterization of the Friction Stir Welded Sheets of AA 5754-H111: Monitoring of the Quality of Joints with Thermographic Techniques. Materials 2017, 10, 1165. [Google Scholar] [CrossRef]
- Kosturek, R.; Śnieżek, L.; Torzewski, J.; Wachowski, M. Low cycle fatigue properties of Sc-modified AA2519-T62 extrusion. Materials 2020, 13, 220. [Google Scholar] [CrossRef]
- Abdulstaar, M.; Al-Fadhalah, K.J.; Wagner, L. Microstructural variation through weld thickness and mechanical properties of peened friction stir welded 6061 aluminium alloy joints. Mater. Charact. 2017, 126, 64–73. [Google Scholar] [CrossRef]
- Lomolinoa, S.; Tovob, R.; Dos Santos, J. On the fatigue behaviour and design curves of friction stir butt-welded Al alloys. Int. J. Fatigue 2005, 27, 305–316. [Google Scholar] [CrossRef]
- Kainuma, S.; Katsuki, H.; Iwai, I.; Kumagai, M. Evaluation of fatigue strength of friction stir butt-welded aluminium alloy joints inclined to applied cyclic stress. Int. J. Fatigue 2008, 30, 870–876. [Google Scholar] [CrossRef]
- Zhou, N.; Song, D.; Qi, W.; Li, X.; Zou, J.; Attallah, M.M. Influence of the kissing bond on the mechanical properties and fracture behaviour of AA5083-H112 friction stir welds. Mater. Sci. Eng. A 2018, 719, 12–20. [Google Scholar] [CrossRef]
- Kadlec, M.; Růžek, R.; Nováková, L. Mechanical behaviour of AA 7475 friction stir welds with the kissing bond defect. Int. J. Fatigue 2015, 74, 7–19. [Google Scholar] [CrossRef]
- Besel, Y.; Besel, M.; Mercado, U.; Kakiuchi, T.; Hirata, T.; Uematsu, Y. Influence of local fatigue damage evolution on crack initiation behavior in a friction stir welded Al-Mg-Sc alloy. Int. J. Fatigue 2017, 99, 151–162. [Google Scholar] [CrossRef]
- Krasnowski, K.; Dymek, S. A comparative analysis of the impact of tool design to fatigue behaviour of single-sided and double-sided welded butt joints of EN AW 6082-T6 alloy. J. Mater. Eng. Perform. 2013, 22, 3818–3824. [Google Scholar] [CrossRef]
- Lombard, H.; Hattingh, D.G.; Steuwer, A.; James, M.N. Effect of process parameters on the residual stresses in AA5083-H321 friction stir welds. Mater. Sci. Eng. A 2009, 501, 119–124. [Google Scholar] [CrossRef]
- Biro, A.L.; Chenelle, B.F.; Lados, D.A. Processing, microstructure, and residual stress effects on strength and fatigue crack growth properties in friction stir welding: A review. Metall. Mater. Trans. B 2012, 43, 1622–1637. [Google Scholar] [CrossRef]
- Sillapasa, K.; Surapunt, S.; Miyashita, Y.; Mutoh, Y.; Seo, N. Tensile and fatigue behaviour of SZ, HAZ and BM in friction stir welded joint of rolled 6N01 aluminium alloy plate. Int. J. Fatigue 2014, 63, 162–170. [Google Scholar] [CrossRef]
- He, C.; Liu, Y.; Dong, J.; Wang, Q.; Wagner, D.; Bathias, C. Fatigue crack initiation behaviours throughout friction stir welded joints in AA7075-T6 in ultrasonic fatigue. Int. J. Fatigue 2015, 81, 171–178. [Google Scholar] [CrossRef]
- Besel, M.; Besel, Y.; Mercado, U.A.; Kakiuchi, T.; Uematsu, Y. Fatigue behaviour of friction stir welded Al-Mg-Sc alloy. Int. J. Fatigue 2015, 77, 1–11. [Google Scholar] [CrossRef]
- Chen, Y.; Zhang, R.; He, C.; Liu, F.; Yang, K.; Wang, C.; Wang, Q.; Liu, Y. Effect of texture and banded structure on the crack initiation mechanism of a friction stir welded magnesium alloy joint in very high cycle fatigue regime. Int. J. Fatigue 2020, 136, 105617. [Google Scholar] [CrossRef]
- Yao, Z.; Kim, G.Y.; Faidley, L.; Zou, Q.; Mei, D.; Chen, Z. Effects of superimposed high-frequency vibration on deformation of aluminium in micro/meso-scale upsetting. J. Mater. Process. Technol. 2012, 212, 640–646. [Google Scholar] [CrossRef]
- Gao, S.; Wu, C.; Padhy, G. Process and joint quality of ultrasonic vibration enhanced friction stir lap welding. Sci. Technol. Weld. Join. 2018, 23, 693–703. [Google Scholar] [CrossRef]
- Ji, S.; Meng, X.; Liu, Z.; Huang, R.; Li, Z. Dissimilar friction stir welding of 6061 aluminium alloy and AZ31 magnesium alloy assisted with ultrasonic. Mater. Lett. 2017, 201, 173–176. [Google Scholar] [CrossRef]
- Thomä, M.; Wagner, G.; Straß, B.; Wolter, B.; Benfer, S.; Fürbeth, W. Ultrasound enhanced friction stir welding of aluminium and steel: Process and properties of EN AW 6061/DC04-Joints. J. Mater. Sci. Technol. 2018, 34, 163–172. [Google Scholar] [CrossRef]
- Liu, H.; Hu, Y.; Du, S.; Zhao, H. Microstructure characterization and mechanism of acoustoplastic effect in friction stir welding assisted by ultrasonic vibrations on the bottom surface of workpieces. J. Manuf. Process. 2019, 42, 159–166. [Google Scholar] [CrossRef]
- Muhammad, N.A.; Wu, C.; Tian, W. Effect of ultrasonic vibration on the intermetallic compound layer formation in Al/Cu friction stir weld joints. J. Alloys Compd. 2019, 785, 512–522. [Google Scholar] [CrossRef]
- Park, K. Development and Analysis of Ultrasonic Assisted Friction Stir Welding Process. Ph.D. Thesis, The University of Michigan, Ann Arbor, MI, USA, 2009. [Google Scholar]
- Lai, R.; He, D.; Liu, L.; Ye, S.; Yang, K. A study of the temperature field during ultrasonic-assisted friction-stir welding. Int. J. Adv. Manuf. Technol. 2014, 73, 321–327. [Google Scholar]
- Zhang, Z.; He, C.; Li, Y.; Yu, L.; Zhao, S.; Zhao, X. Effects of ultrasonic assisted friction stir welding on flow behaviour, microstructure and mechanical properties of 7N01-T4 aluminium alloy joints. J. Mater. Sci. Technol. 2020, 43, 1–13. [Google Scholar] [CrossRef]
- Wu, M.; Wu, C.; Gao, S. Effect of ultrasonic vibration on fatigue performance of AA2024-T3 friction stir weld joints. J. Manuf. Process. 2017, 29, 85–95. [Google Scholar] [CrossRef]
- Wang, X.; Li, B.; Li, M.; Huang, C.; Chen, H. Study of local-zone microstructure, strength and fracture toughness of hybrid laser-metal-inert-gas-welded A7N01 aluminum alloy joint. Mater. Sci. Eng. A 2017, 688, 114–122. [Google Scholar] [CrossRef]
- Su, J.; Nelson, T.; Mishra, R.; Mahoney, M. Microstructural investigation of friction stir welded 7050-T651 aluminium. Acta Mater. 2003, 51, 713–729. [Google Scholar] [CrossRef]
- Padhy, G.K.; Wu, C.S.; Gao, S. Subgrain formation in ultrasonic enhanced friction stir welding of aluminium alloy. Mater. Lett. 2016, 183, 34–39. [Google Scholar] [CrossRef]
- Xu, W.; Liu, J.; Zhu, H. Analysis of residual stresses in thick aluminium friction stir welded butt joints. Mater. Des. 2011, 32, 2000–2005. [Google Scholar] [CrossRef]
- Linton, V.M.; Ripley, M.I. Influence of time on residual stresses in friction stir welds in agehardenable 7xxx aluminium alloys. Acta Mater. 2008, 56, 4319–4327. [Google Scholar] [CrossRef]
- Sun, T.; Roy, M.J.; Strong, D.; Withers, P.J.; Prangnell, P.B. Comparison of residual stress distributions in conventional and stationary shoulder high-strength aluminium alloy friction stir welds. J. Manuf. Process. Technol. 2017, 242, 92–100. [Google Scholar] [CrossRef]
- Tao, Y.; Ni, D.R.; Xiao, B.L.; Ma, Z.Y.; Wu, W.; Zhang, R.X.; Zeng, Y.S. Origin of unusual fracture in stirred zone for friction stir welded 2198-T8 Al-Li alloy joints. Mater. Sci. Eng. A 2017, 693, 1–13. [Google Scholar] [CrossRef]
- Shi, L.; Wu, C.; Liu, X. Modeling the effects of ultrasonic vibration on friction stir welding. J. Mater. Process. Technol. 2015, 222, 91–102. [Google Scholar] [CrossRef]
- Doude, H.R.; Schneider, J.A.; Nunes, A.C. Influence of the tool shoulder contact conditions on the material flow during friction stir welding. Metall. Mater. Trans. A 2014, 45, 4411–4422. [Google Scholar] [CrossRef]
- Schneider, J.; Beshears, R.; Nunes, A. Interfacial sticking and slipping in the friction stir welding process. Mater. Sci. Eng. A 2006, 435, 297–304. [Google Scholar] [CrossRef]
- Huang, Y.; Wang, Y.; Wan, L.; Liu, H.; Shen, J.; Dos Santos, J.F.; Zhou, L.; Feng, J. Material-flow behaviour during friction-stir welding of 6082-T6 aluminium alloy. Int. J. Adv. Manuf. Technol. 2016, 87, 1115–1123. [Google Scholar] [CrossRef]
- Mao, Y.; Ke, L.; Liu, F.; Chen, Y.; Xing, L. Investigations on temperature distribution, microstructure evolution, and property variations along thickness in friction stir welded joints for thick AA7075-T6 plates. Int. J. Adv. Manuf. Technol. 2016, 86, 141–154. [Google Scholar]
- Kumar, K.; Kailas, S. The role of friction stir welding tool on material flow and weld formation. Mater. Sci. Eng. A 2008, 485, 367–374. [Google Scholar] [CrossRef]
- Wang, C.J.; Liu, Y.; Guo, B.; Shan, D.B.; Zhang, B. Acoustic softening and stress superposition in ultrasonic vibration assisted uniaxial tension of copper foil: Experiments and modeling. Mater. Des. 2016, 112, 246–253. [Google Scholar] [CrossRef]
- Shi, L.; Wu, C.; Padhy, G.; Gao, S. Numerical simulation of ultrasonic field and its acoustoplastic influence on friction stir welding. Mater. Des. 2016, 104, 102–115. [Google Scholar] [CrossRef]
- Chen, G.; Li, H.; Wang, G.; Guo, Z.; Zhang, S.; Dai, Q.; Wang, X.; Zhang, G.; Shi, Q. Effects of pin thread on the in-process material flow behavior during friction stir welding: A computational fluid dynamics study. Int. J. Mach. Tools Manuf. 2018, 124, 12–21. [Google Scholar] [CrossRef]


Publisher’s Note: MDPI stays neutral with regard to jurisdictional claims in published maps and institutional affiliations. |
© 2020 by the authors. Licensee MDPI, Basel, Switzerland. This article is an open access article distributed under the terms and conditions of the Creative Commons Attribution (CC BY) license (http://creativecommons.org/licenses/by/4.0/).
Share and Cite
Zhang, Z.; He, C.; Li, Y.; Wei, J.; Zhai, M.; Zhao, S.; Zhao, X. Fatigue Behaviour of 7N01-T4 Aluminium Alloy Welded by Ultrasonic-Assisted Friction Stir Welding. Materials 2020, 13, 4582. https://doi.org/10.3390/ma13204582
Zhang Z, He C, Li Y, Wei J, Zhai M, Zhao S, Zhao X. Fatigue Behaviour of 7N01-T4 Aluminium Alloy Welded by Ultrasonic-Assisted Friction Stir Welding. Materials. 2020; 13(20):4582. https://doi.org/10.3390/ma13204582
Chicago/Turabian StyleZhang, Zhiqiang, Changshu He, Ying Li, Jingxun Wei, Menggang Zhai, Su Zhao, and Xiang Zhao. 2020. "Fatigue Behaviour of 7N01-T4 Aluminium Alloy Welded by Ultrasonic-Assisted Friction Stir Welding" Materials 13, no. 20: 4582. https://doi.org/10.3390/ma13204582
APA StyleZhang, Z., He, C., Li, Y., Wei, J., Zhai, M., Zhao, S., & Zhao, X. (2020). Fatigue Behaviour of 7N01-T4 Aluminium Alloy Welded by Ultrasonic-Assisted Friction Stir Welding. Materials, 13(20), 4582. https://doi.org/10.3390/ma13204582