Abstract
Herein we present a study on polymer-derived silicon oxycarbide (SiOC)/graphite composites for a potential application as an electrode in high power energy storage devices, such as Lithium-Ion Capacitor (LIC). The composites were processed using high power ultrasound-assisted sol-gel synthesis followed by pyrolysis. The intensive sonication enhances gelation and drying process, improving the homogenous distribution of the graphitic flakes in the preceramic blends. The physicochemical investigation of SiOC/graphite composites using X-ray diffraction, 29Si solid state NMR and Raman spectroscopy indicated no reaction occurring between the components. The electrochemical measurements revealed enhanced capacity (by up to 63%) at high current rates (1.86 A g−1) recorded for SiOC/graphite composite compared to the pure components. Moreover, the addition of graphite to the SiOC matrix decreased the value of delithiation potential, which is a desirable feature for anodes in LIC.
1. Introduction
Over the past few years, there has been increasing interest in small high-power energy storage devices. For these applications electrochemical capacitors (ECs) are considered to be more suitable than conventional batteries. Unfortunately, ECs possess much lower energy density in comparison to batteries, namely 3–6 Wh kg−1 vs. 150–200 Wh kg−1, respectively [1,2], which severely limits their broader application. Many attempts have been made to enhance ECs energy density. Realizing an asymmetric system by employing a Faradaic, battery-like anode as a negative electrode is one of the most promising concepts. This idea was first presented by Amatucci in 2001 [3], and it is commonly known as an EC-battery hybrid or lithium-ion capacitor (LIC).
The main advantage of using a battery-like anode instead of the typical EC’s electrode is the extension of the overall potential difference. ECs operates from 0 to 2.7 V (in organic electrolytes) in charge/discharge processes, which results in diminishing potential difference between the electrodes during cycling and hence in limited energy density [4]. On the contrary, battery-like anodes hold constant potential during charge/discharge, which allows for keeping a higher potential difference over the entire cycling process. LIC preserves high power of EC thanks to processes separation—lithiation/delithiation occurs in anode and adsorption/desorption on cathode [5,6,7,8,9]. However, due to differences in electrochemical characteristics between electrodes, it is necessary to make proper electrodes matching in design.
On the anodic side, a few requirements must be met. The material should be characterized by a good conductivity, low lithiation/delithiation potential and provide sufficient capacity [3]. The capacity does not have to be exceptionally high, since it is often limited by the cathode [10,11], but at least 50 mAh g−1 should be available at potentials below 2 V vs. Li/Li+. The material should exhibit excellent rate capability to match the pace of cathodic reaction, and withstand polarization with 1–2 A g−1 for at least a few hundred cycles [11].
Having these requirements in mind, several solutions have been tested, specifically those originally applied in lithium-ion batteries. Various materials, based on Li4T5O12 (LTO) [3,12], transition metal oxides/graphene composites (Ni2O5, MnO2, CoO) [13,14,15], transition metal sulfides (MoS2, CoS) [16,17] or carbonaceous materials (hard carbon, soft carbon, graphite) [18,19,20] are reported as potential anodes for LIC. However, most of them, except for carbonaceous materials, exhibit a relatively high delithiation potential (approximately 1.5 V), which combined with low the capacity of a cathode does not provide high energy. Graphite exhibits very low lithiation potential: 0.005–0.25 V vs. Li/Li+. Moreover, graphite is abundant, non-toxic, has good cycle life and has a decent capacity for LIC applications. However, the performance of graphite in LIC is limited by its poor rate capability. Thus, many works have been focused on the improvement of the rate capability of graphite. To enhance the rate capability, various coatings [21], modifications of particle size, shape and porosity [22,23] or doping with various functional groups, nanoparticles or nanostructures have been reported [24,25]. Still, an unexplored solution is combining graphite with polymer-derived ceramics (PDCs). PDCs, including silicon oxycarbide (SiOC) and silicon carbon nitride (SiCN), are the materials consisting of SiCxOy or SiCxNy (x, y = 0–4) structural units, respectively, and a free carbon phase [26]. PDCs can be prepared by various routes, including liquid routes such as sol-gel, hydrosilylation or photocrosslinking, followed by a pyrolysis process. The liquid route allows facile mixing with other materials for making homogeneous composites. Pure PDCs have been tested as a material for lithium-ion batteries [27,28,29] and lithium-ion capacitors [30] as they exhibit high capacity up to 920 mAh g−1, good cyclability and good rate capability. PDCs have also been considered as an electrochemically active and mechanically resistant matrix for lithium-alloying compounds such silicon [31,32], tin [33,34] or antimony [35,36]. It has already been demonstrated by Kolb et al. [37] and Graczyk-Zajac et al. [38] that a combination with PDCs improves electrochemical properties of graphite. In this system, PDCs serve as a matrix, protecting graphite from deterioration. There are a number of works reporting the successful enhancement of materials’ energy storage properties via blending PDCs with carbonaceous materials, such as SiCN-graphite [37,38], SiCN-carbon nanotubes [39], SiCN-hard carbons [40,41], SiOC-carbon nanofibers [42], SiOC-CNTs [43] and SiOC-graphene [44]. However, to date there are still very few reports concerning SiOC-graphite composites and, to the best of our knowledge, no reports concerning the utilization of SiOC/graphite composite for LIC. The main advantage of SiOCs over SiCNs is the higher resistance of the preceramic polymer against oxidation, which facilitates material production [45,46].
In this work we investigate novel SiOC/graphite composites with phenyltriethoxysilane (PhTES) as the preceramic precursor. PhTES-based silicon oxycarbide exhibits high capacity and good rate capability [47]. We applied a new approach to blend the starting materials, namely, sol-gel synthesis enhanced by high-power ultrasounds. Sonication ensured good dispersion of graphite within the green body and accelerated gelation and drying processes. The new SiOC/graphite composite exhibited improved rate capability and high capacity in a lower potential range than pure SiOC, which makes it a promising candidate for negative electrodes in LIC.
2. Experimental Part
2.1. Synthesis of Composites
Silicon oxycarbide samples and the SiOC-based composites were synthesized by the sol-gel method, followed by pyrolysis. Phenyltriethoxysilane (PhTES) (>97%, Sigma Aldrich, Baden-Württemberg, Germany) was used as preceramic precursor. Different amounts of graphite powder (flakes, <20 µm, synthetic, Sigma Aldrich, Baden-Württemberg, Germany) were added to the synthesis solution to obtain SiOC/graphite composites of various carbon content. The synthesis procedure was as follows. First, graphite was poured into a three-neck flask. Graphite amount varied from 0 (pure ceramic sample—Denoted as SiOCPhTES), through 2, 4 and 10 g (composite samples denoted as SiOCPhTES/C2g, SiOCPhTES/C4g, and SiOCPhTES/C10g, respectively). Then, 17.3 g of PhTES and 6.6 g of absolute ethanol were added and carefully stirred. Next, 3.9 g of acidic water (pH = 4.5) were poured dropwise. Suspension was boiled for 1.5 h, then cooled down and transported into propylene test tubes. Afterwards, obtained sols were sonicated using high power homogenizer (UP200St, Hielscher Ultrasound Technology, Teltow, Germany) to obtain tar-like gel. Next, gels were dried for 5 days, with temperature increasing from 80 °C to 120 °C. The final step was pyrolysis at 1000 °C under argon atmosphere (heating ratio 100 °C/h, dwell time 1 h, constant Ar flow of 40 mL min−1).
2.2. Electrode Preparation and Electrochemical Measurements
Ceramic composites were ball milled (Mixer Mill, MM200, Retsch, Haan, Germany) to obtain fine powder. Then, powder was mixed with 10 wt.% solution of polyvinylidene fluoride (PVDF, Solef6020, Solvay, Rheinberg, Germany) dissolved in N-methyl 2-pyrrolidone (NMP) (BASF, Ludwigshafen, Germany) and Carbon Black Super P® (Imerys Graphite & Carbon, Bodio, Swizerland). The ratio between powder, PVDF and carbon black was 85:10:5. In addition, 1–2 g of NMP were added for proper consistency. As received slurry was uniformly distributed onto a copper foil (10 μm, Copper SE-Cu58 Schlenk Metallfolien GmbH & Co. KG, Roth, Germany) using the doctor blade technique to obtain ~100 µm thick layers. Layers were then dried at 80 °C and punched into 10 mm discs. So, prepared disc electrodes were further dried at 80 °C under vacuum and transferred into a glove box (MBraun Glove Box Systems) where the cells were assembled.
For electrochemical testing Swagelok® type two-electrode testing cells were assembled. In this system we used a disc electrode of the active material as a working electrode, a quartz filter paper MN GF-2 (45 µm, Macherey-Nagel GmbH & Co. KG, Roth, Germany) as a separator, a 1 M LiPF6 in 1:1 v/v ethylene carbonate:dimethyl carbonate (Sigma-Aldrich, Baden-Württemberg, Germany) as an electrolyte and a lithium foil (Sigma Aldrich, Baden-Württemberg, Germany) as a counter/reference electrode.
The materials were tested by cyclic voltammetry (CV) and galvanostatic charge–discharge (GCD) with potential limitation techniques. Electrochemical measurements were performed on the Biologic Potentiostat SP200 (BioLogic Science Instruments, Seyssinet-Pariset, France) while long-time cycle stability was conducted using a multichannel battery interface (Atlas 0961, Atlas Solllich, Rębiechowo, Poland). The potential window was set between 0.005 V and 3 V vs. Li/Li+ for both techniques. Materials were charged/discharged with the same current rate (Icharge = Idischarge). Cyclic voltammetry was carried out with a scan rate of 0.1 mV s−1.
2.3. Characterization Techniques
Elemental analysis was conducted on a carbon analyzer (Leco C-200, Leco Corporation, St. Joseph, MI, USA) and a nitrogen/oxygen analyzer (Leco TC-436, Leco Corporation, St. Joseph, MI, USA). Carbon and oxygen content were measured directly while the silicon content was calculated as a complement to 100%. Thermal gravimetric analysis was performed on the SDT 2960 Simultaneous (TA Instruments, New Castle, DE, USA). X-ray diffraction spectra were obtained from the powder diffractometer Stoe STADI P equipped with a Mo Kα anode. Micro-Raman analysis within the wavenumber range of 100–3200 cm−1 was carried out using a confocal micro-Raman spectrometer (InVia, Renishaw, Wotton-under-Edge, UK) with an argon ion laser (514 nm). Raman spectra were deconvoluted using the OriginPro2016 software after the background subtraction. All the bands were fitted using Lorentzian peaks, except the D3 band, where a Gaussian curve was used. XPS analysis was carried out on the Escalab 250Xi spectroscope (Thermo-Fischer Scientific, Waltham, MA, USA) with a monochromatic Al Kα source. The morphology was characterized by a transmission electron microscope TEM (FEI, G2 F20X-Twin 200 kV, FEG, Hillsboro, OR, USA). Energy-dispersive X-ray spectroscopy EDS (EDAX, RTEM model SN9577, 134 eV) was used to identify the chemical elements in designated areas. Measurements were made in the TEM mode (bright-field) and the STEM mode (HAADF and EDX detectors). Preparation of the samples was as follows: a few milligrams of the powder were dispersed in ethanol (99.8% anhydrous) with the aid of ultrasounds for 5 s, and a drop of the dispersion (5 mL) was applied on a carbon-coated copper mesh with holes (Lacey type Cu 400 mesh, Plano, TX, USA), and stored in the room temperature until the complete evaporation of solvent. MAS-NMR measurements were performed on the Bruker Avance Ultrashield 500 MHz spectrometer. 29Si NMR spectra were recorded with the following parameters: single pulse sequence, 29Si frequency: 139.11 MHz, π/8 pulse length: 2.5 ms, recycle delay: 100 s, 1k scans, external secondary reference: DSS. 3.2 mm zirconia rotors filled with samples were spun at 8 kHz under air flow.
3. Results and Discussion
Figure 1 presents the thermographs of the investigated materials, i.e., SiOCPhTES, SiOCPhTES/C2g, SiOCPhTES/C4g, and SiOCPhTES/C10g. The analysis provides information about mass loss during the pyrolysis process. It shows the influence of graphite addition on a thermal conversion yield of polymer/graphite blends. Pure SiOCPhTES exhibited two significant mass losses: the first one between 50 °C and 350 °C, and the second one in the temperature range of 400–600 °C. The first one is attributed to the release of by-products of the polycondensation reaction and the residual EtOH/H2O. The second one is related to the mass loss occurring during the redistribution reaction, i.e., the exchange of Si-O bonds with Si-H and/or Si-C bonds, with the simultaneous release of volatile compounds, mainly H2, CH4 or C2H2 [48,49]. The overall ceramic yield of SiOCPhTES was around 60.9%, which stays in accordance with the literature [47,50]. When graphite was added to the material, we observed a proportional increase of the mass yield during pyrolysis. The mass yield of SiOCPhTES/C2g, SiOCPhTES/C4g and SiOCPhTES/C10g was equal to 77.4%, 79.5% and 83.7%, respectively. This is mostly related to a smaller mass loss in the temperature range of 400–500 °C, which is a consequence of a lower PhTES content in the preceramic polymer/graphite blends. These results indicate that the content of graphite in the preceramic matrix did not change during pyrolysis in an argon atmosphere, and the final mass yield was directly related to the starting material composition.
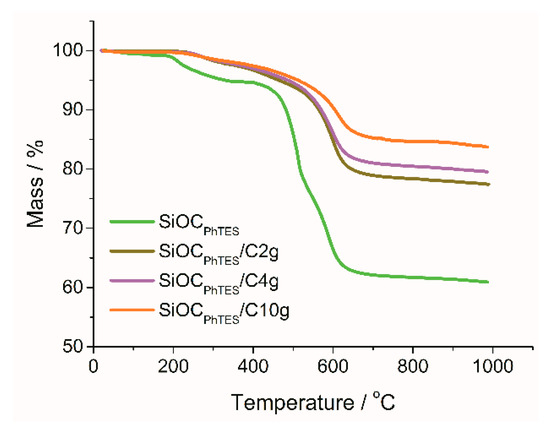
Figure 1.
Dependence of the mass yield on the temperature of the SiOC/graphite composites.
The TGA results stay in agreement with the results of the elemental analysis shown in Table 1. As expected, the increase in the amount of graphite in the preceramic blends led to a higher amount of carbon in a final ceramic composite. Free carbon content in the pure SiOCPhTES ceramic, calculated using the approach of Soraru et al. [51], was 34.2 wt.%, which represents 91% of the total carbon in the sample. For the SiOC/graphite composites, the free carbon phase constituted from 95% (for SiOCPhTES/C2g) to almost 100% (for SiOCPhTES/C10g) of the total carbon.

Table 1.
Results of elemental analysis of SiOCPhTES and SiOCPhTES/graphite composites.
29Silicon Solid-state NMR measurements (29Si MAS-NMR) were conducted in order to determine the change in the redistribution of various SiOxCy tetrahedra units resulting from the addition of graphite. Figure 2 shows the corresponding 29Si MAS-NMR spectra of SiOCPhTES and SiOCPhTES/C2g. The 29Si MAS-NMR spectrum of the SiOCPhTES/C2g composite exhibits broader peaks at approximately −109, −73 and −48 ppm, and higher noise than the spectrum of the pure SiOCPhTES ceramic sample. However, the share of SiO4 and mixed bonds SiO3C, SiO2C2 tetrahedra is comparable for both samples (Table 2 and ref. [47]). SiO4 tetrahedra dominate in both samples (76%–78%), and the mixed bonds constitute from several up to over a dozen percent. This suggests that there was no reaction between the preceramic polymer and graphite at any of the stages of preparation of the composites, namely during hydrolysis and condensation reactions, high-power ultrasound-assisted gelation process, nor pyrolysis at 1000 °C.
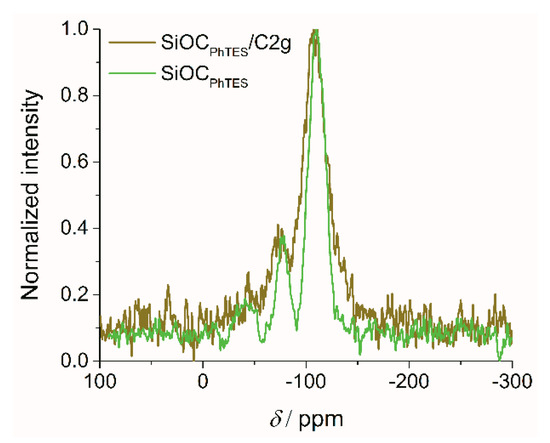
Figure 2.
29Si MAS-NMR spectra of the SiOCPhTES and SiOCPhTES/C2g samples.
Table 2.
Data obtained from fitting of 29Si MAS-NMR spectra of the pure ceramic and the composite samples.
XPS results (presented in Supplementary Materials—SM, Figure S1) confirm the collected NMR data. XPS Si2p spectra of pure ceramic and the composite samples look almost the same. A broad peak fitted with the Si2p3/2 and Si2p1/2 doublet at binding energies of 103.2–103.4 and 103.7–103.8 eV, respectively, corresponding to SiO4 tetrahedra [52,53] is observed. On the other hand, the C1s spectra of the pure ceramic sample and SiOC/graphite composite show some differences in the share of particular bonds. Both C1s spectra (Figure S2) were deconvoluted with four peaks at BE: 284.0–284.4 eV, 285.2–285.4 eV, 286.5–286.7 eV and 288.8–289.2 eV, which may be attributed to C-Si/C=C, C-C/C-H, C-O and C=O bonds, respectively [54,55,56,57]. However, the C1s spectrum of the SiOC/graphite composite shows a significantly larger peak corresponding to the C-C bond, and smaller peaks assigned to the C-Si, C-O and C=O bonds, which is related to a high graphite content in the composite.
The homogenization method applied for blending of the materials requires high power ultrasound, which can have a destructive effect on the graphite structure. To evaluate possible changes in the graphite lattice XRD measurements were performed. Figure 3 shows the diffractograms of pure graphite, ceramic, and SiOCPhTES/graphite composites. For the graphite sample sharp peaks at 12°, 19.1°, 20.1° and 33.5° (2θ Mo Kα, which correspond to 26.2, 42.2, 44.5 and 77.4 for Cu Kα) can be distinguished, described in literature as [2], [100], [101] and [110] Bragg peaks of typical hexagonal graphite [58,59]. In contrast, pure SiOCPhTES diffractograms show only a broad halo typical for amorphous materials [51,60], while for the SiOC/graphite composites the peaks typical for graphite appear. The higher amount of graphite in the composite, the more pronounced reflexes in the diffractograms are detected. The diffractogram of SiOCPhTES/C10g exhibits sharp peaks, which indicate that the skeleton of the graphite structure was preserved despite the usage of high-power ultrasounds during the synthesis.
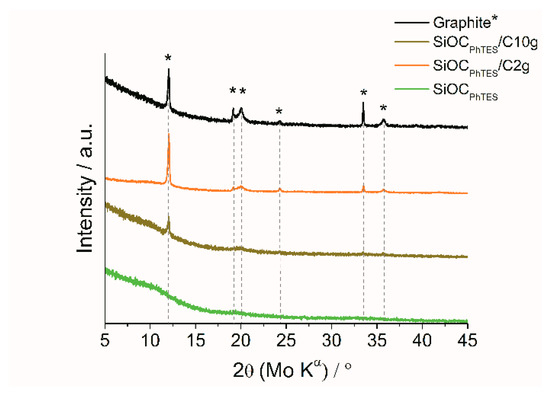
Figure 3.
Diffractograms of pure graphite, ceramic and SiOC/graphite composites. * is in the legend of the graph, meaning the diffraction peaks for graphite.
More detailed analysis of the carbon microstructure was performed by means of Raman spectroscopy. Figure 4a depicts Raman spectra of the investigated samples recorded in the range of 500–3000 cm−1 after the background subtraction. Two characteristic bands in the first-order spectra, namely the D-band at approximately 1333 cm−1, and the G-band at 1575 cm−1, representing disordered and graphitic carbon, respectively, appear for all of the investigated composites. In order to perform a quantitative analysis of the measured spectra, we deconvoluted the first-order Raman signals into five peaks (Figure 4b–e), namely D1, D2, D3, D4 and G according to [61,62].
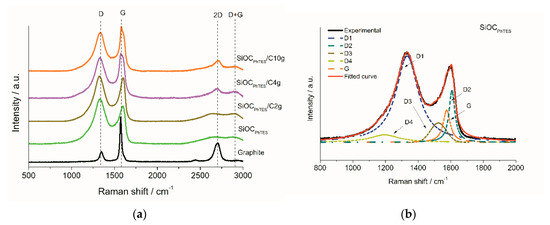
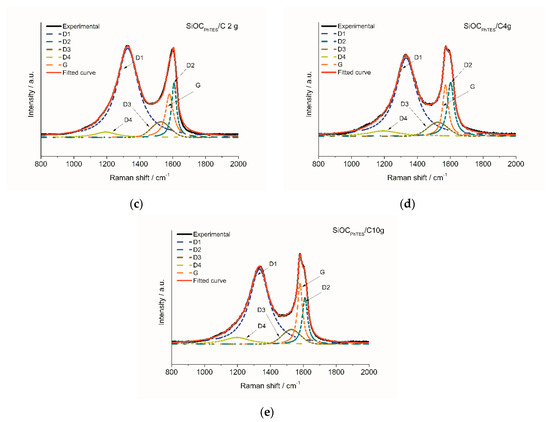
Figure 4.
(a) Comparison of Raman spectra recorded for investigated samples. Fitting of the Raman spectra of: (b) SiOCPhTES, (c) SiOCPhTES/C2g, (d) SiOCPhTES/C4g and (e) SiOCPhTES/C10g samples.
In the spectra of the pure ceramic and the composites samples, the D band is separated into a main D1 peak and a small shoulder marked as D4. Both peaks, i.e., D1 and D4, result from a graphitic lattice vibration mode with A1g-symmetry, which is typical for disordered carbons. D1 is assigned to graphene edges [63,64,65] while the D4 is related to Csp2-Csp3 bonds [66] or ionic impurities [67]. The G band was deconvoluted into a G peak, arising from stretching vibrations of the sp2-carbon bond in the ideal graphitic lattice (E2g symmetry), and a D2 peak, related to the defected graphitic lattice (also E2g symmetry) [61,64,65] and Stone–Wales defects [68], which is also present in the deconvoluted spectrum of the pure graphite sample (Figure S3a in Supplementary Materials). Moreover, between the D1 and G bands another band, namely a D3 band at ~1525 cm−1, sp2 amorphous forms of carbon [61,62], is detected. Detailed information on band parameters is given in Table 3 and Table S1 in the Supplementary Materials.
Table 3.
Data obtained from the Raman spectra deconvolution of the investigated samples, band positions, band intensities (I) (height of the fitted peak) and intensity ratio (ID1/IG and ID2/IG).
With the increasing amount of graphite in the composites one can notice a significant rise in the G band intensity, from 0.36 for the pure ceramic SiOCPhTES to 0.68 for SiOCPhTES/C10g, along with a decrease in the intensity of the D1 and D4 bands, from 0.98 to 0.84 and from 0.084 to 0.075 for these materials, respectively. These differences are even more pronounced when we compare the ID1/IG and ID2/IG intensity ratios that decreased with the increasing graphite content in the ceramic matrix. The ID1/IG ratio dropped from 2.69 for the pure ceramic to 1.24 for the SiOCPhTES/C10g sample, whereas ID2/IG decreased from 1.61 to 0.76. Moreover, composites with graphite exhibit lower intensity of the D3 band compared to the pure ceramics. These results prove that the addition of graphite to the composites increased the content of the ordered carbon phase in the material, suggesting that the graphitic structure was hardly affected by the ultrasound treatment.
Furthermore, we tested the influence of ultrasounds on the size of graphite flakes used for the synthesis of the composites. In that case, we immersed graphitic powder into test tubes with isopropanol and subjected it to ultrasounds for a time of up to 2 h (analogous to the time used for composite blending). After drying, the morphology of the graphite powder was examined by SEM and no changes with respect to the pristine graphitic morphology were identified (see SEM Figure S4a,b, Supplementary Materials). This suggests that the structure of graphite was preserved in the composites.
In the second-order Raman spectra, the bands at 2700 cm−1 (2D) and 2900 cm−1 (D + G) were detected, i.e., the overtones of D-band along with combined D and G bands, respectively. The 2D band correlates with the number of stacked carbon layers that make up graphite clusters. The second-order Raman spectra are presented in more detail in Figure S3b (Supplementary Materials). Graphite exhibits a very pronounced 2D peak at 2702 cm−1, indicating stacked undamaged graphene layers. In contrast, the SiOCPhTES shows an asymmetric and blurred 2D peak, indicating high disorder in the carbon structure. With increasing graphite content in the composites, the 2D band becomes narrower and more intense, signifying increased content of a more ordered carbon phase. The overall Raman results do not indicate any damages in the graphitic structure provoked by the ultrasound-assisted synthesis method, confirming the results obtained by NMR and XRD analysis.
TEM imaging was performed in order to investigate more deeply the microstructure of the composites. Figure 5a,b show TEM images of the amorphous organization of SiOCPhTES sample, (typical for pure silicon oxycarbide pyrolyzed at 1000 °C). On the other hand, two separate phases, representing the amorphous SiOC and the more ordered carbon material, are observed for the SiOCPhTES/C10g sample (Figure 5c,d).
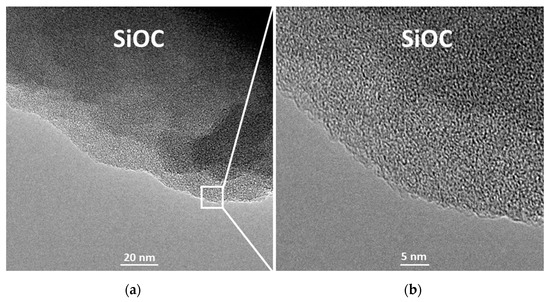
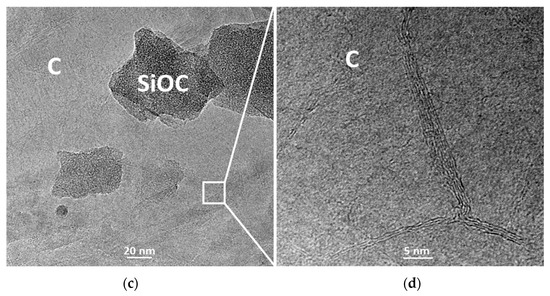
Figure 5.
TEM images of: (a), (b) SiOCPhTES and (c), (d) SiOCPhTES/C10g samples.
STEM-EDX measurements confirm the presence of a uniform silicon oxycarbide phase for the SiOCPhTES sample, and two separate phases for the SiOCPhTES/C10g composite one, where only carbon is identified, and the second one, where carbon, silicon and oxygen dominate (Figure 6a,b).
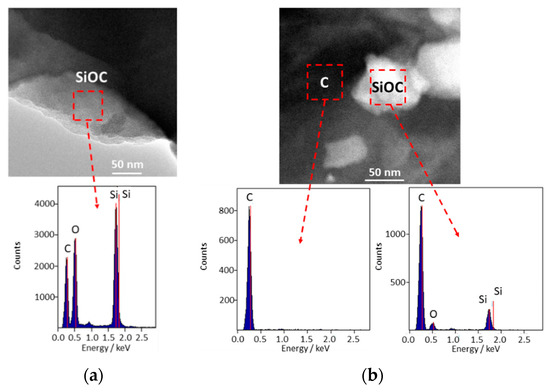
Figure 6.
TEM images of: (a) SiOCPhTES and (b) SiOCPhTES/C10g samples.
4. Electrochemical Testing
Figure 7a,b show CV plots obtained for the SiOCPhTES/graphite composites and pure components for comparison. During the first cycle, all the composites and pristine ceramic materials exhibited a small cathodic peak at 0.7 V (marked as (I) on the plot), which disappear in the following cycles. This corresponds to the formation of the solid-electrolyte interface (SEI) on the boundaries of the ceramic phase [69,70]. Further on the CV curves of the SiOC-based materials, a broad peak between 0 and 0.3 V (II), which corresponds to lithium insertion into the ceramic [29,69,71], is present. The cathodic current in this range decreases with the increasing graphite content in the composites, but there are no pronounced peaks at 0.16 and 0.05 V as registered for pure graphite. The intensity of the peak (II) is dropping in the following cycles (Figure 7b), which corresponds to the stabilization of the lithium insertion [72]. On the anodic site of the CV of the composites, we observe peaks between 0 and 0.25 V (III) corresponding to graphite delithiation [73] and a broad plateau-like peak (IV) characteristic for a typical lithium extraction from the ceramic [71]. The intensity of the peaks observed on CV curves depends on the composition of the material and follows the trend of increasing graphite content. For graphite-rich composites, one may identify more pronounced peaks (III), while for graphite-poor composites the peak (IV) is more intense.
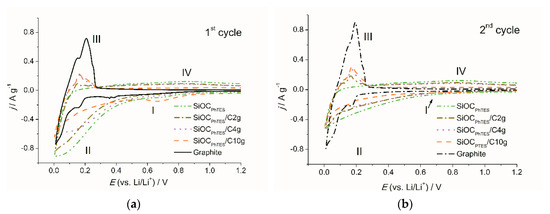
Figure 7.
Cyclic voltammetry curves of the investigated materials: (a) first cycle, (b) second cycle; scan rate 0.1 mV s−1.
The capacity distribution over the potential range of 0–3 V and the Coulombic efficiencies were assessed from charge/discharge profiles. Figure 8a,b show charge/discharge curves of the first and second cycles, respectively, while more detailed information is presented in Table 4. The first cycle lithiation profiles of the SiOCPhTES, SiOCPhTES/C2g and SiOCPhTES/C4g samples are very similar. A different curve shape with a quasi-plateau at around 0.7 V, related to SEI formation, is noticed for the SiOCPhTES/C10g sample. Galvanostatic charge–discharge curves correspond well to the cyclic voltammetry curves. The trends of increasing length of the plateau, corresponding to delithiation of the graphitic phase, and a decrease in the delithiation potential with increasing graphite content in the ceramic matrix can be identified. A low delithiation potential is one of the features expected for LIC anodes. The curves of the SiOCPhTES/C2g and SiOCPhTES/C4g samples exhibit small plateaus in the 0.11–0.15 V voltage range, followed by a more rapid voltage increase, while the plateau recorded for the SiOCPhTES/C10g composite is significantly longer, and the onset of the faster voltage rise is observed at 0.2 V. This results in the higher capacity recovered below 0.5 V for the SiOCPhTES/C10g sample compared to the composites and the pure ceramics.
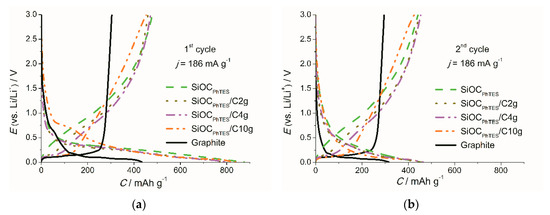
Figure 8.
Galvanostatic charge–discharge curves of the investigated materials recorded at the current density (j) of 186 mA g−1: (a) first, (b) second cycle.
Table 4.
Reversible Crev and irreversible Cirrev capacity values of the first cycle upon polarization with 0.186 A g−1, Coulombic efficiency of the first cycle η and the average delithiation capacities CD of graphite, ceramic and composite samples measured at different current rates (average capacity values calculated from data presented in Figure 9).
The electrochemical contribution of both components, namely SiOC and graphite, is unambiguously exposed on charge–discharge curves of the investigated composites, and the contribution of each part is proportional to its content. For graphite-poor samples, a small plateau originating from graphite, and a long ascending curve typical for ceramics can be noticed, while in the case of graphite-rich sample a much larger plateau is observed.
The charge/discharge profile allows one to evaluate the Coulombic efficiency of the material. One could expect that the first cycle efficiency (FCE) should increase with the addition of graphite to the composites. However, the graphite flakes used for composite preparation exhibit relatively low Coulombic efficiency of the first cycle (lower than reported by electrode suppliers [74,75] or in literature [76,77]). This may be caused by lower crystallinity and higher surface area of the flakes than of graphite used in commercial batteries. Addition of small quantities of graphite seems to slightly increase the FCE (59.6% and 57.8% for the SiOCPhTES/C2g and SiOCPhTES/C4g, respectively, compared to 54.7% for the pure ceramic). However, the sample with the highest graphite content, i.e., the SiOCPhTES/C10g, showed the FCE of only 53.9%. This may be caused by higher activity at 0.7 V observed on the CV and GCD curves during the first cycle. In the following cycles, all studied materials show efficiency of over 99%. Extended cycling of the electrodes at the C/2 and 5C current rates (C = 372 mA g−1) is presented in Figure 9. All the SiOC-based materials show better electrochemical performance than graphite. The difference is even more pronounced at high current rates. Note that for the C/2 rate the highest capacity is recorded for the composite with the lowest graphite content (423 mAh g−1 for SiOCPhTES/C2g), while for the 5C rate, the graphite-rich composite has the highest capacity (293 mAh g−1 for SiOCPhTES/C10g compared to 218 mAh g−1 for the pure ceramic SiOCPhTES and only 108 mAh g−1 for the graphite electrode). High capacity is another feature of anodes that are suitable for high power energy devices. Better electrochemical performance of the SiOCPhTES/C10g sample compared to the SiOCPhTES one may follow from the carbon content in these materials. According to elemental analysis (Table 1), the amount of carbon increases from 37.4 wt.% for pure ceramic to 68.7 wt.% for the composites with the highest graphite content. A higher amount of carbon in the ceramic matrix leads to a higher electronic conductivity and a larger number of diffusion paths for lithium ions, crucial upon polarization with high currents. Slightly lower capacity showed by the SiOCPhTES/C10g composites compared to the pure ceramic at the C/2 rate is probably due to a lower share of the active sites for lithium storage present in the ceramics [78]. Low capacity of pure graphite at a high current rate is often explained by material exfoliation caused by electrolyte penetration along with lithium ions [79].
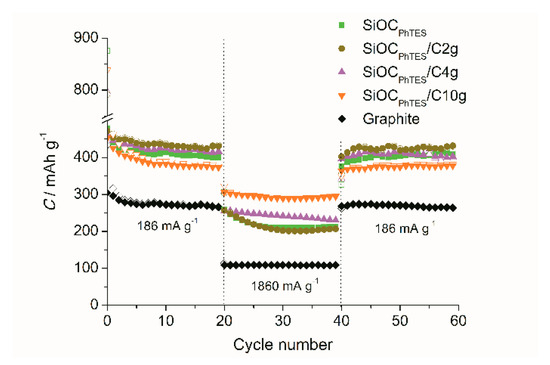
Figure 9.
Lithiation (empty symbol) and delithiation (solid symbol) capacity upon extended cycling at C/2 and 5C rate for the investigated materials.
To examine the phenomenon of high capacity at high currents for graphite rich composite, we took a closer look at the charge/discharge profiles collected upon polarization at a 5C rate (Figure 10). GCD curves presented in Figure 10 were recorded after 20 cycles at a C/2 rate in order to show a stable response of the electrodes with Coulombic efficiency of over 99%. The shape of the composite curves at 5C exhibits the same tendency as the curves recorded at a C/2 rate (more extended plateau and a lower delithiation voltage for graphite-rich samples), except for the capacity value, which is the highest for the SiOCPhTES/C10g electrode. These features make the material promising for the application in LIC. What is also essential for the potential application in LIC, is that this composite delivers the highest capacity below 0.5 V.
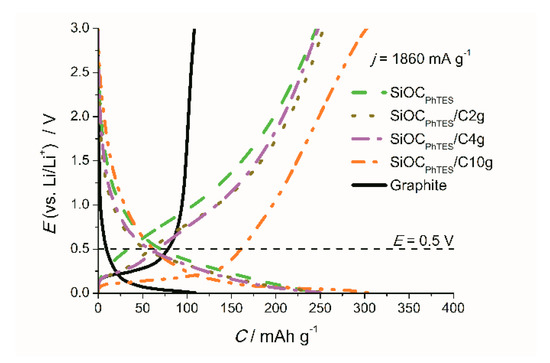
Figure 10.
Galvanostatic charge–discharge curves of the investigated materials recorded at 1860 mA g−1.
In Table 5, the capacity values of the most popular potential anodes for LIC reported in the literature are presented. The focus was on the capacity measured at a 2 A g−1 current rate typical for testing of LIC [4], and voltage range below 0.5 V. To the best of our knowledge, the SiOCPhTES/C10g composite exhibits the highest capacity upon these conditions among all popular LIC anode materials. Our composite exhibits twice as high capacity as the competitive materials. Considering the potential range (0–3 V), our composite also shows a satisfactory capacity of almost 300 mAh g−1.
Table 5.
Capacity recovered below 0.5 V at high current rates for LIC anodic materials.
5. Conclusions
In this work, we evaluated various graphite-ceramic based composites with different graphite content for potential application as anodes in LIC. The materials were prepared by a novel method utilizing high power ultrasounds. Sonication facilitates the gelation process and uniform distribution of graphite flakes within the preceramic polymer. Silicon oxycarbide is an electrochemically active component contributing to the capacity of composites and plays the additional role of a matrix for graphitic flakes, causing the stabilization of the electrochemical response at high current rates. Moreover, the addition of graphite to SiOC shifts lithiation and delithiation processes towards lower potentials in comparison to the pure SiOC. The best performing material seems to be the SiOCPhTES/C10g one, i.e., the composite with the highest investigated graphite content. This material is characterized by a high capacity of 294 mAh g−1 at a 5C current rate, among which over 160 mAh g−1 is recovered below 0.5 V vs. Li/Li+. This makes the SiOCPhTES/C10g material a potential candidate for anodes used in high power energy storage devices, e.g., lithium-ion capacitors.
Supplementary Materials
The following are available online at https://www.mdpi.com/1996-1944/13/19/4302/s1, Figure S1: XPS Si2p spectra of (a) SiOCPhTES and (b) SiOCPhTES/C10g samples., Figure S2: XPS C1s spectra of (a) SiOCPhTES and (b) SiOCPhTES/C10g samples., Figure S3: (a) Deconvolution of Raman spectra of the pure graphite, (b) second-order Raman spectra of graphite, ceramic and SiOC/graphite composites, Figure S4: pictures of (a) graphite flakes, (b) graphite flakes after 2 h sonication in isopropanol, Table S1: Data obtained from the deconvolution of Raman spectra.
Author Contributions
Conceptualization, M.W.-Z.; methodology, D.K., M.G.-Z., G.T., M.W.-Z.; formal analysis, D.K., M.G.-Z., G.T., M.W.-Z.; investigation, D.K., M.G.-Z., M.W.-Z.; resources, M.G.-Z., M.W.-Z.; data curation, D.K. M.W.-Z; writing—original draft preparation, D.K., M.G.-Z., G.T., M.W.-Z.; writing—review and editing, D.K., M.G.-Z. M.W.-Z.; visualization, D.K., G.T., M.W.-Z.; supervision, M.W.-Z.; project administration, M.W.-Z.; funding acquisition, M.W.-Z. All authors have read and agreed to the published version of the manuscript.
Funding
This work is supported by Foundation for Polish Science under REINTEGRATION programme, project No POIR.04.04.00-00-4582/17-00.
Conflicts of Interest
The authors declare no conflict of interest.
References
- Service, R.F. New “Supercapacitor” Promises to Pack More Electrical Punch. Science 2006, 313, 902. [Google Scholar] [CrossRef] [PubMed]
- González, A.; Goikolea, E.; Barrena, J.A.; Mysyk, R. Review on supercapacitors: Technologies and materials. Renew. Sustain. Energy Rev. 2016, 58, 1189–1206. [Google Scholar] [CrossRef]
- Amatucci, G.G.; Badway, F.; Du Pasquier, A.; Zheng, T. An Asymmetric Hybrid Nonaqueous Energy Storage Cell. J. Electrochem. Soc. 2001, 148, A930–A939. [Google Scholar] [CrossRef]
- Stoller, M.D.; Ruoff, R.S. Best practice methods for determining an electrode material’s performance for ultracapacitors. Energy Environ. Sci. 2010, 3, 1294–1301. [Google Scholar] [CrossRef]
- Wang, G.; Zhang, L.; Zhang, J. A review of electrode materials for electrochemical supercapacitors. Chem. Soc. Rev. 2012, 41, 797–828. [Google Scholar] [CrossRef] [PubMed]
- Vol’fkovich, Y.M.; Serdyuk, T.M. Electrochemical Capacitors. Russ. J. Electrochem. 2002, 38, 1043–1068. [Google Scholar] [CrossRef]
- Augustyn, V.; Simon, P.; Dunn, B. Pseudocapacitive oxide materials for high-rate electrochemical energy storage. Energy Environ. Sci. 2014, 7, 1597–1614. [Google Scholar] [CrossRef]
- Naoi, K.; Ishimoto, S.; Miyamoto, J.I.; Naoi, W. Second generation “nanohybrid supercapacitor”: Evolution of capacitive energy storage devices. Energy Environ. Sci. 2012, 5, 9363–9373. [Google Scholar] [CrossRef]
- Li, B.; Zheng, J.; Zhang, H.; Jin, L.; Yang, D.; Lv, H.; Shen, C.; Shellikeri, A.; Zheng, Y.; Gong, R.; et al. Electrode Materials, Electrolytes, and Challenges in Nonaqueous Lithium-Ion Capacitors. Adv. Mater. 2018, 30, 1705670. [Google Scholar] [CrossRef]
- Li, G.; Yang, Z.; Yin, Z.; Guo, H.; Wang, Z.; Yan, G.; Liu, Y.; Li, L.; Wang, J. Non-aqueous dual-carbon lithium-ion capacitors: A review. J. Mater. Chem. A 2019, 7, 15541–15563. [Google Scholar] [CrossRef]
- Wang, H.; Zhu, C.; Chao, D.; Yan, Q.; Fan, H.J. Nonaqueous Hybrid Lithium-Ion and Sodium-Ion Capacitors. Adv. Mater. 2017, 29, 1702093. [Google Scholar] [CrossRef] [PubMed]
- Xu, N.; Sun, X.; Zhang, X.; Wang, K.; Ma, Y. A two-step method for preparing Li4Ti5O12-graphene as an anode material for lithium-ion hybrid capacitors. RSC Adv. 2015, 5, 94361–94368. [Google Scholar] [CrossRef]
- Li, Y.; Wang, R.; Zheng, W.; Zhao, Q.; Sun, S.; Ji, G.; Li, S.; Fan, X.; Xu, C. Design of Nb2O5/graphene hybrid aerogel as polymer binder-free electrodes for lithium-ion capacitors. Mater. Technol. 2020, 35, 625–634. [Google Scholar] [CrossRef]
- Yang, H.; Zhang, C.; Meng, Q.; Cao, B.; Tian, G. Pre-lithiated manganous oxide/graphene aerogel composites as anode materials for high energy density lithium ion capacitors. J. Power Sources 2019, 431, 114–124. [Google Scholar] [CrossRef]
- Zhao, X.; Zhang, X.; Li, C.; Sun, X.; Liu, J.; Wang, K.; Ma, Y. High-Performance Lithium-Ion Capacitors Based on CoO-Graphene Composite Anode and Holey Carbon Nanolayer Cathode. ACS Sustain. Chem. Eng. 2019, 7, 11275–11283. [Google Scholar] [CrossRef]
- Gao, J.; Li, Y.; Liu, Y.; Jiao, S.; Li, J.; Wang, G.; Zeng, S.; Zhang, G. The dual-function sacrificing template directed formation of MoS2/C hybrid nanotubes enabling highly stable and ultrafast sodium storage. J. Mater. Chem. A 2019, 7, 18828–18834. [Google Scholar] [CrossRef]
- Chen, H.; Zhu, X.; Chang, Y.; Cai, J.; Zhao, R. 3D flower-like CoS hierarchitectures recycled from spent LiCoO2 batteries and its application in electrochemical capacitor. Mater. Lett. 2018, 218, 40–43. [Google Scholar] [CrossRef]
- Cao, W.J.; Zheng, J.P. Li-ion capacitors with carbon cathode and hard carbon/stabilized lithium metal powder anode electrodes. J. Power Sources 2012, 213, 180–185. [Google Scholar] [CrossRef]
- Schroeder, M.; Winter, M.; Passerini, S.; Balducci, A. On the cycling stability of lithium-ion capacitors containing soft carbon as anodic material. J. Power Sources 2013, 238, 388–394. [Google Scholar] [CrossRef]
- Khomenko, V.; Raymundo-Piñero, E.; Béguin, F. High-energy density graphite/AC capacitor in organic electrolyte. J. Power Sources 2008, 177, 643–651. [Google Scholar] [CrossRef]
- Kottegoda, I.R.M.; Kadoma, Y.; Ikuta, H.; Uchimoto, Y.; Wakihara, M. Enhancement of rate capability in graphite anode by surface modification with zirconia. Electrochem. Solid-State Lett. 2002, 5, A275–A278. [Google Scholar] [CrossRef]
- Sivakkumar, S.R.; Nerkar, J.Y.; Pandolfo, A.G. Rate capability of graphite materials as negative electrodes in lithium-ion capacitors. Electrochim. Acta 2010, 55, 3330–3335. [Google Scholar] [CrossRef]
- Buqa, H.; Goers, D.; Holzapfel, M.; Spahr, M.E.; Novák, P. High Rate Capability of Graphite Negative Electrodes for Lithium-Ion Batteries. J. Electrochem. Soc. 2005, 152, A474–A481. [Google Scholar] [CrossRef]
- Ma, C.; Zhao, Y.; Li, J.; Song, Y.; Shi, J.; Guo, Q.; Liu, L. Synthesis and electrochemical properties of artificial graphite as an anode for high-performance lithium-ion batteries. Carbon 2013, 64, 553–556. [Google Scholar] [CrossRef]
- Yeo, J.S.; Park, T.H.; Seo, M.H.; Miyawaki, J.; Mochida, I.; Yoon, S.H. Enhancement of the rate capability of graphite via the introduction of boron-oxygen functional groups. Int. J. Electrochem. Sci. 2013, 8, 1308–1315. [Google Scholar]
- Mera, G.; Navrotsky, A.; Sen, S.; Kleebe, H.J.; Riedel, R. Polymer-derived SiCN and SiOC ceramics-structure and energetics at the nanoscale. J. Mater. Chem. A 2013, 1, 3826–3836. [Google Scholar] [CrossRef]
- Pradeep, V.S.; Graczyk-Zajac, M.; Riedel, R.; Soraru, G.D. New insights in to the lithium storage mechanism in polymer derived SiOC anode materials. Electrochim. Acta 2014, 119, 78–85. [Google Scholar] [CrossRef]
- Pradeep, V.S.; Graczyk-Zajac, M.; Wilamowska, M.; Riedel, R.; Soraru, G.D. Influence of pyrolysis atmosphere on the lithium storage properties of carbon-rich polymer derived SiOC ceramic anodes. Solid State Ion. 2014, 262, 22–24. [Google Scholar] [CrossRef]
- Wilamowska-Zawlocka, M.; Puczkarski, P.; Grabowska, Z.; Kaspar, J.; Graczyk-Zajac, M.; Riedel, R.; Sorarù, G.D. Silicon oxycarbide ceramics as anodes for lithium ion batteries: Influence of carbon content on lithium storage capacity. RSC Adv. 2016, 6, 104597–104607. [Google Scholar] [CrossRef]
- Halim, M.; Liu, G.; Ardhi, R.E.A.; Hudaya, C.; Wijaya, O.; Lee, S.H.; Kim, A.Y.; Lee, J.K. Pseudocapacitive Characteristics of Low-Carbon Silicon Oxycarbide for Lithium-Ion Capacitors. ACS Appl. Mater. Interfaces 2017, 9, 20566–20576. [Google Scholar] [CrossRef]
- Jang, J.; Kim, H.; Lim, H.; jae Kim, K.; Jung, H.G.; Kim, S.O.; Choi, W. Surfactant-based selective assembly approach for Si-embedded silicon oxycarbide composite materials in lithium-ion batteries. Chem. Eng. J. 2020, 401, 126091. [Google Scholar] [CrossRef]
- Kaspar, J.; Graczyk-Zajac, M.; Lauterbach, S.; Kleebe, H.J.; Riedel, R. Silicon oxycarbide/nano-silicon composite anodes for Li-ion batteries: Considerable influence of nano-crystalline vs. nano-amorphous silicon embedment on the electrochemical properties. J. Power Sources 2014, 269, 164–172. [Google Scholar] [CrossRef]
- Tolosa, A.; Widmaier, M.; Krüner, B.; Griffin, J.M.; Presser, V. Continuous silicon oxycarbide fiber mats with tin nanoparticles as a high capacity anode for lithium-ion batteries. Sustain. Energy Fuels 2018, 2, 215–228. [Google Scholar] [CrossRef]
- Dubey, R.J.-C.; Sasikumar, P.V.W.; Krumeich, F.; Blugan, G.; Kuebler, J.; Kravchyk, K.V.; Graule, T.; Kovalenko, M.V. Silicon Oxycarbide—Tin Nanocomposite as a High-Power-Density Anode for Li-Ion Batteries. Adv. Sci. 2019, 6, 1901220. [Google Scholar] [CrossRef] [PubMed]
- Dubey, R.J.C.; Sasikumar, P.V.W.; Cerboni, N.; Aebli, M.; Krumeich, F.; Blugan, G.; Kravchyk, K.V.; Graule, T.; Kovalenko, M.V. Silicon oxycarbide-antimony nanocomposites for high-performance Li-ion battery anodes. Nanoscale 2020, 12, 13540–13547. [Google Scholar] [CrossRef]
- Lee, Y.; Lee, K.Y.; Choi, W. One-Pot Synthesis of Antimony-Embedded Silicon Oxycarbide Materials for High-Performance Sodium-Ion Batteries. Adv. Funct. Mater. 2017, 27, 1702607. [Google Scholar] [CrossRef]
- Kolb, R.; Fasel, C.; Liebau-Kunzmann, V.; Riedel, R. SiCN/C-ceramic composite as anode material for lithium ion batteries. J. Eur. Ceram. Soc. 2006, 26, 3903–3908. [Google Scholar] [CrossRef]
- Graczyk-Zajac, M.; Fasel, C.; Riedel, R. Polymer-derived-SiCN ceramic/graphite composite as anode material with enhanced rate capability for lithium ion batteries. J. Power Sources 2011, 196, 6412–6418. [Google Scholar] [CrossRef]
- Lehman, J.H.; Hurst, K.E.; Singh, G.; Mansfield, E.; Perkins, J.D.; Cromer, C.L. Core-shell composite of SiCN and multiwalled carbon nanotubes from toluene dispersion. J. Mater. Sci. 2010, 45, 4251–4254. [Google Scholar] [CrossRef]
- Nowak, A.P.; Wicikowska, B.; Lisowska-Oleksiak, A. New ceramic materials derived from pyrolyzed poly(1,2-dimethylsilazane) and starch as a potential anode for Li-ion batteries. Solid State Ionics 2014, 263, 131–139. [Google Scholar] [CrossRef]
- Wilamowska, M.; Graczyk-Zajac, M.; Riedel, R. Composite materials based on polymer-derived SiCN ceramic and disordered hard carbons as anodes for lithium-ion batteries. J. Power Sources 2013, 244, 80–86. [Google Scholar] [CrossRef]
- Li, Y.; Hu, Y.; Lu, Y.; Zhang, S.; Xu, G.; Fu, K.; Li, S.; Chen, C.; Zhou, L.; Xia, X.; et al. One-dimensional SiOC/C composite nanofibers as binder-free anodes for lithium-ion batteries. J. Power Sources 2014, 254, 33–38. [Google Scholar] [CrossRef]
- Bhandavat, R.; Singh, G. Stable and efficient li-ion battery anodes prepared from polymer-derived silicon oxycarbide-carbon nanotube shell/core composites. J. Phys. Chem. C 2013, 117, 11899–11905. [Google Scholar] [CrossRef]
- David, L.; Bhandavat, R.; Barrera, U.; Singh, G. Silicon oxycarbide glass-graphene composite paper electrode for long-cycle lithium-ion batteries. Nat. Commun. 2016, 7, 10998. [Google Scholar] [CrossRef] [PubMed]
- Ahn, D.; Raj, R. Cyclic stability and C-rate performance of amorphous silicon and carbon based anodes for electrochemical storage of lithium. J. Power Sources 2011, 196, 2179–2186. [Google Scholar] [CrossRef]
- Wen, Q.; Yu, Z.; Riedel, R. The fate and role of in situ formed carbon in polymer-derived ceramics. Prog. Mater. Sci. 2020, 109, 100623. [Google Scholar] [CrossRef]
- Wilamowska, M.; Pradeep, V.S.; Graczyk-Zajac, M.; Riedel, R.; Sorarù, G.D. Tailoring of SiOC composition as a way to better performing anodes for Li-ion batteries. Solid State Ion. 2014, 260, 94–100. [Google Scholar] [CrossRef]
- Bahloul-Hourlier, D.; Latournerie, J.; Dempsey, P. Reaction pathways during the thermal conversion of polysiloxane precursors into oxycarbide ceramics. J. Eur. Ceram. Soc. 2005, 25, 979–985. [Google Scholar] [CrossRef]
- Liu, C.; Meng, X.; Zhang, X.; Hong, C.; Han, J.; Han, W.; Xu, B.; Dong, S.; Du, S. High temperature structure evolution of macroporous SiOC ceramics prepared by a sol-gel method. Ceram. Int. 2015, 41, 11091–11096. [Google Scholar] [CrossRef]
- Latournerie, J.; Dempsey, P.; Hourlier-Bahloul, D.; Bonnet, J.P. Silicon oxycarbide glasses: Part 1-thermochemical stability. J. Am. Ceram. Soc. 2006, 89, 1485–1491. [Google Scholar] [CrossRef]
- Sorarù, G.D.; Modena, S.; Guadagnino, E.; Colombo, P.; Egan, J.; Pantano, C. Chemical Durability of Silicon Oxycarbide Glasses. J. Am. Ceram. Soc. 2002, 85, 1529–1536. [Google Scholar] [CrossRef]
- Önneby, C.; Pantano, C.G. Silicon oxycarbide formation on SiC surfaces and at the SiC/SiO2 interface. J. Vac. Sci. Technol. A Vac. Surf. Film 1997, 15, 1597–1602. [Google Scholar] [CrossRef]
- Meera, K.; Yang, C.S.; Choi, C.K. Bonding structure and electrical properties of SiOC(-H) films deposited with a methyltrimethoxysilane precursor by using inductively coupled plasma chemical vapor deposition. J. Korean Phys. Soc. 2006, 48, 1713–1718. [Google Scholar]
- Bashouti, M.Y.; Paska, Y.; Puniredd, R.; Stelzner, T. Silicon nanowires terminated with methyl functionalities exhibit stronger Si–C bonds than equivalent 2D surfaces. Phys. Chem. Chem. Phys. 2009, 11, 3845–3848. [Google Scholar] [CrossRef] [PubMed]
- Blyth, R.I.R.; Buqa, H.; Netzer, F.P.; Ramsey, M.G.; Besenhard, J.O. XPS studies of graphite electrode materials for lithium ion batteries. Appl. Surf. Sci. 2000, 167, 99–106. [Google Scholar] [CrossRef]
- Abass, M.A.; Syed, A.A.; Gervais, C.; Singh, G. Synthesis and electrochemical performance of a polymer-derived silicon oxycarbide/boron nitride nanotube composite. RSC Adv. 2017, 7, 21576–21584. [Google Scholar] [CrossRef]
- Renlund, G.M.; Prochazka, S.; Doremus, R.H. Silicon oxycarbide glasses: Part II. Structure and properties. J. Mater. Res. 1991, 6, 2723–2734. [Google Scholar] [CrossRef]
- Wu, N.L.; Phillips, J. XRD evidence of preferental orientation of platinium crystallites on graphite. Surf. Sci. 1987, 184, 463–482. [Google Scholar] [CrossRef]
- Liou, Y.J.; Huang, W.J. High Temperature Phase Transitions of Graphene Oxide Paper from Graphite Oxide Solution. J. Mater. Sci. Technol. 2014, 30, 1088–1091. [Google Scholar] [CrossRef]
- Li, J.; Lu, K.; Lin, T.; Shen, F. Preparation of Micro-/Mesoporous SiOC Bulk Ceramics. J. Am. Ceram. Soc. 2015, 98, 1753–1761. [Google Scholar] [CrossRef]
- Sadezky, A.; Muckenhuber, H.; Grothe, H.; Niessner, R.; Pöschl, U. Raman microspectroscopy of soot and related carbonaceous materials: Spectral analysis and structural information. Carbon 2005, 43, 1731–1742. [Google Scholar] [CrossRef]
- Zhao, D.; Zhang, J.; Wang, G.; Xu, R.; Wang, H.; Zhong, J. Carbon structure in blast furnace dusts characterized by raman spectroscope and its links with combustion reactivity. In Advances in Materials Science for Environmental and Energy Technologies VI: Ceramic Transactions; Ohji, T., Matyas, J., Colorado, H., Kanakala, R., Eds.; Wiley Online Library: Hoboken, NJ, USA, 2017; Volume 262, pp. 69–75. [Google Scholar]
- Tuinstra, F.; Koenig, J. Raman Spectrum of Graphite. J. Chem. Phys. 1970, 53, 1126–1130. [Google Scholar] [CrossRef]
- Wang, Y.; Alsmeyer, D.C.; McCreery, R.L. Raman Spectroscopy of Carbon Materials: Structural Basis of Observed Spectra. Chem. Mater. 1990, 2, 557–563. [Google Scholar] [CrossRef]
- Rosenburg, F.; Ionescu, E.; Nicoloso, N.; Riedel, R. High-temperature Raman spectroscopy of nano-crystalline carbon in silicon oxycarbide. Materials 2018, 11, 93. [Google Scholar] [CrossRef] [PubMed]
- Dippel, B.; Jander, H.; Heintzenberg, J. NIR FT Raman spectroscopic study of flame soot. Phys. Chem. Chem. Phys. 1999, 1, 4707–4712. [Google Scholar] [CrossRef]
- Cuesta, A.; Dhamelincourt, P.; Laureyns, J.; Martínez-Alonso, A.; Tascón, J.M.D. Raman microprobe studies on carbon materials. Carbon 1994, 32, 1523–1532. [Google Scholar] [CrossRef]
- Eckmann, A.; Felten, A.; Mishchenko, A.; Britnell, L.; Krupke, R.; Novoselov, K.S.; Casiraghi, C. Probing the nature of defects in graphene by Raman spectroscopy. Nano Lett. 2012, 12, 3925–3930. [Google Scholar] [CrossRef]
- Lv, P.; Zhao, H.; Gao, C.; Du, Z.; Wang, J.; Liu, X. SiOx-C dual-phase glass for lithium ion battery anode with high capacity and stable cycling performance. J. Power Sources 2015, 274, 542–550. [Google Scholar] [CrossRef]
- Xia, K.; Wu, Z.; Xuan, C.; Xiao, W.; Wang, J.; Wang, D. Effect of KOH etching on the structure and electrochemical performance of SiOC anodes for lithium-ion batteries. Electrochim. Acta 2017, 245, 287–295. [Google Scholar] [CrossRef]
- Graczyk-Zajac, M.; Toma, L.; Fasel, C.; Riedel, R. Carbon-rich SiOC anodes for lithium-ion batteries: Part I. Influence of material UV-pre-treatment on high power properties. Solid State Ion. 2012, 225, 522–526. [Google Scholar] [CrossRef]
- Fukui, H.; Harimoto, Y.; Akasaka, M.; Eguchi, K. Lithium Species in Electrochemically Lithiated and Delithiated Silicon Oxycarbides. Appl. Mater. Interfaces 2014, 6, 12827–12836. [Google Scholar] [CrossRef]
- Levi, M.D.; Aurbach, D. Simultaneous measurements and modeling of the electrochemical impedance and the cyclic voltammetric characteristics of graphite electrodes doped with lithium. J. Phys. Chem. B 1997, 101, 4630–4640. [Google Scholar] [CrossRef]
- MSE Supplies LLC. Natural Graphite Product Information. Available online: https://www.msesupplies.com/products/natural-graphite-powder-lithium-ion-battery-anode-a?variant=7138017860 (accessed on 4 March 2020).
- Pyrotek Inc. Battery-Grade Graphite Product Information. Available online: https://www.pyrotek.com/primary-solutions/battery-materials (accessed on 4 March 2020).
- Mao, C.; Wood, M.; David, L.; An, S.J.; Sheng, Y.; Du, Z.; Meyer, H.M.; Ruther, R.E.; Wood, D.L. Selecting the Best Graphite for Long-Life, High-Energy Li-Ion Batteries. J. Electrochem. Soc. 2018, 165, A1837–A1845. [Google Scholar] [CrossRef]
- Bai, L.Z.; Zhao, D.L.; Zhang, T.M.; Xie, W.G.; Zhang, J.M.; Shen, Z.M. A comparative study of electrochemical performance of graphene sheets, expanded graphite and natural graphite as anode materials for lithium-ion batteries. Electrochim. Acta 2013, 107, 555–561. [Google Scholar] [CrossRef]
- Graczyk-Zajac, M.; Reinold, L.M.; Kaspar, J.; Sasikumar, P.V.W.; Soraru, G.D.; Riedel, R. New insights into understanding irreversible and reversible lithium storage within SIOC and SICN ceramics. Nanomaterials 2015, 5, 233–245. [Google Scholar] [CrossRef] [PubMed]
- Aurbach, D.; Zinigrad, E.; Cohen, Y.; Teller, H. A short review of failure mechanisms of lithium metal and lithiated graphite anodes in liquid electrolyte solutions. Solid State Ion. 2002, 148, 405–416. [Google Scholar] [CrossRef]
- Li, C.; Zhang, X.; Wang, K.; Sun, X.; Ma, Y. Accordion-like titanium carbide (MXene) with high crystallinity as fast intercalative anode for high-rate lithium-ion capacitors. Chinese Chem. Lett. 2020, 31, 1009–1013. [Google Scholar] [CrossRef]
- Deng, B.; Dong, H.; Lei, T.; Yue, N.; Xiao, L.; Liu, J. Post-annealing tailored 3D cross-linked TiNb2O7 nanorod electrode: Towards superior lithium storage for flexible lithium-ion capacitors. Sci. China Mater. 2020, 63, 492–504. [Google Scholar] [CrossRef]
- Luo, J.; Zhang, W.; Yuan, H.; Jin, C.; Zhang, L.; Huang, H.; Liang, C.; Xia, Y.; Zhang, J.; Gan, Y.; et al. Pillared Structure Design of MXene with Ultralarge Interlayer Spacing for High-Performance Lithium-Ion Capacitors. ACS Nano 2017, 11, 2459–2469. [Google Scholar] [CrossRef]
- Deng, B.; Lei, T.; Zhu, W.; Xiao, L.; Liu, J. In-Plane Assembled Orthorhombic Nb2O5 Nanorod Films with High-Rate Li+ Intercalation for High-Performance Flexible Li-Ion Capacitors. Adv. Funct. Mater. 2018, 28, 1704330. [Google Scholar] [CrossRef]
- Wang, G.; Lu, C.; Zhang, X.; Liu, B.; Xia, M.; Gou, H.; Xin, G.; Lian, J.; Zhang, Y. Toward Ultrafast Lithium Ion Capacitors: A Novel Atomic Layer Deposition Seeded Preparation of Li4Ti5O12 /Graphene Anode. Nano Energy 2017, 36, 46–57. [Google Scholar] [CrossRef]
- Wang, R.; Zhao, Q.; Zheng, W.; Ren, Z.; Hu, X.; Li, J.; Lu, L.; Hu, N.; Molenda, J.; Liu, X.; et al. Achieving high energy density in a 4.5 v all nitrogen-doped graphene based lithium-ion capacitor. J. Mater. Chem. A 2019, 7, 19909–19921. [Google Scholar] [CrossRef]
- Lee, W.S.V.; Peng, E.; Li, M.; Huang, X.; Xue, J.M. Rational design of stable 4 V lithium ion capacitor. Nano Energy 2016, 27, 202–212. [Google Scholar] [CrossRef]
- Dubal, D.P.; Jayaramulu, K.; Zboril, R.; Fischer, R.A.; Gomez-Romero, P. Unveiling BiVO4 nanorods as a novel anode material for high performance lithium ion capacitors: Beyond intercalation strategies. J. Mater. Chem. A 2018, 6, 6096–6106. [Google Scholar] [CrossRef]
- Han, C.; Xu, L.; Li, H.; Shi, R.; Zhang, T.; Li, J.; Wong, C.P.; Kang, F.; Lin, Z.; Li, B. Biopolymer-assisted synthesis of 3D interconnected Fe3O4@carbon core@shell as anode for asymmetric lithium ion capacitors. Carbon 2018, 140, 296–305. [Google Scholar] [CrossRef]
© 2020 by the authors. Licensee MDPI, Basel, Switzerland. This article is an open access article distributed under the terms and conditions of the Creative Commons Attribution (CC BY) license (http://creativecommons.org/licenses/by/4.0/).