Behavior of a Two-Way Lightweight Steel–Concrete Composite Slab Voided with Thin-Walled Core Boxes towards Sustainable Construction


Abstract
1. Introduction
2. Experimental Methods
2.1. General
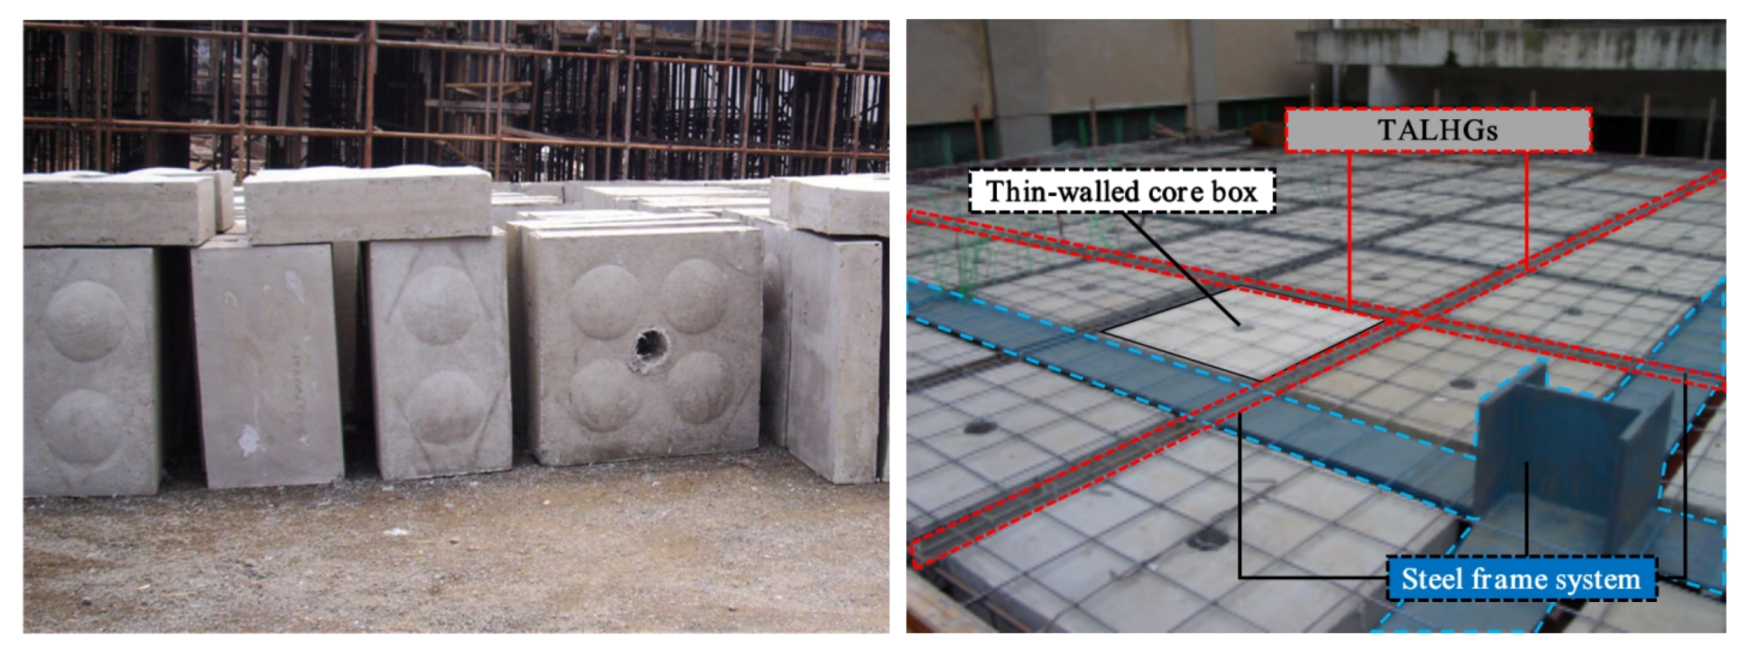
2.2. Specimen
2.3. Material Properties
2.4. Instrumentation and Testing Procedure
3. Experimental Results and Discussion
3.1. Experimental Observations
3.2. Load-Deflection Relationships
3.3. Load–Strain Curves and Strain Profiles
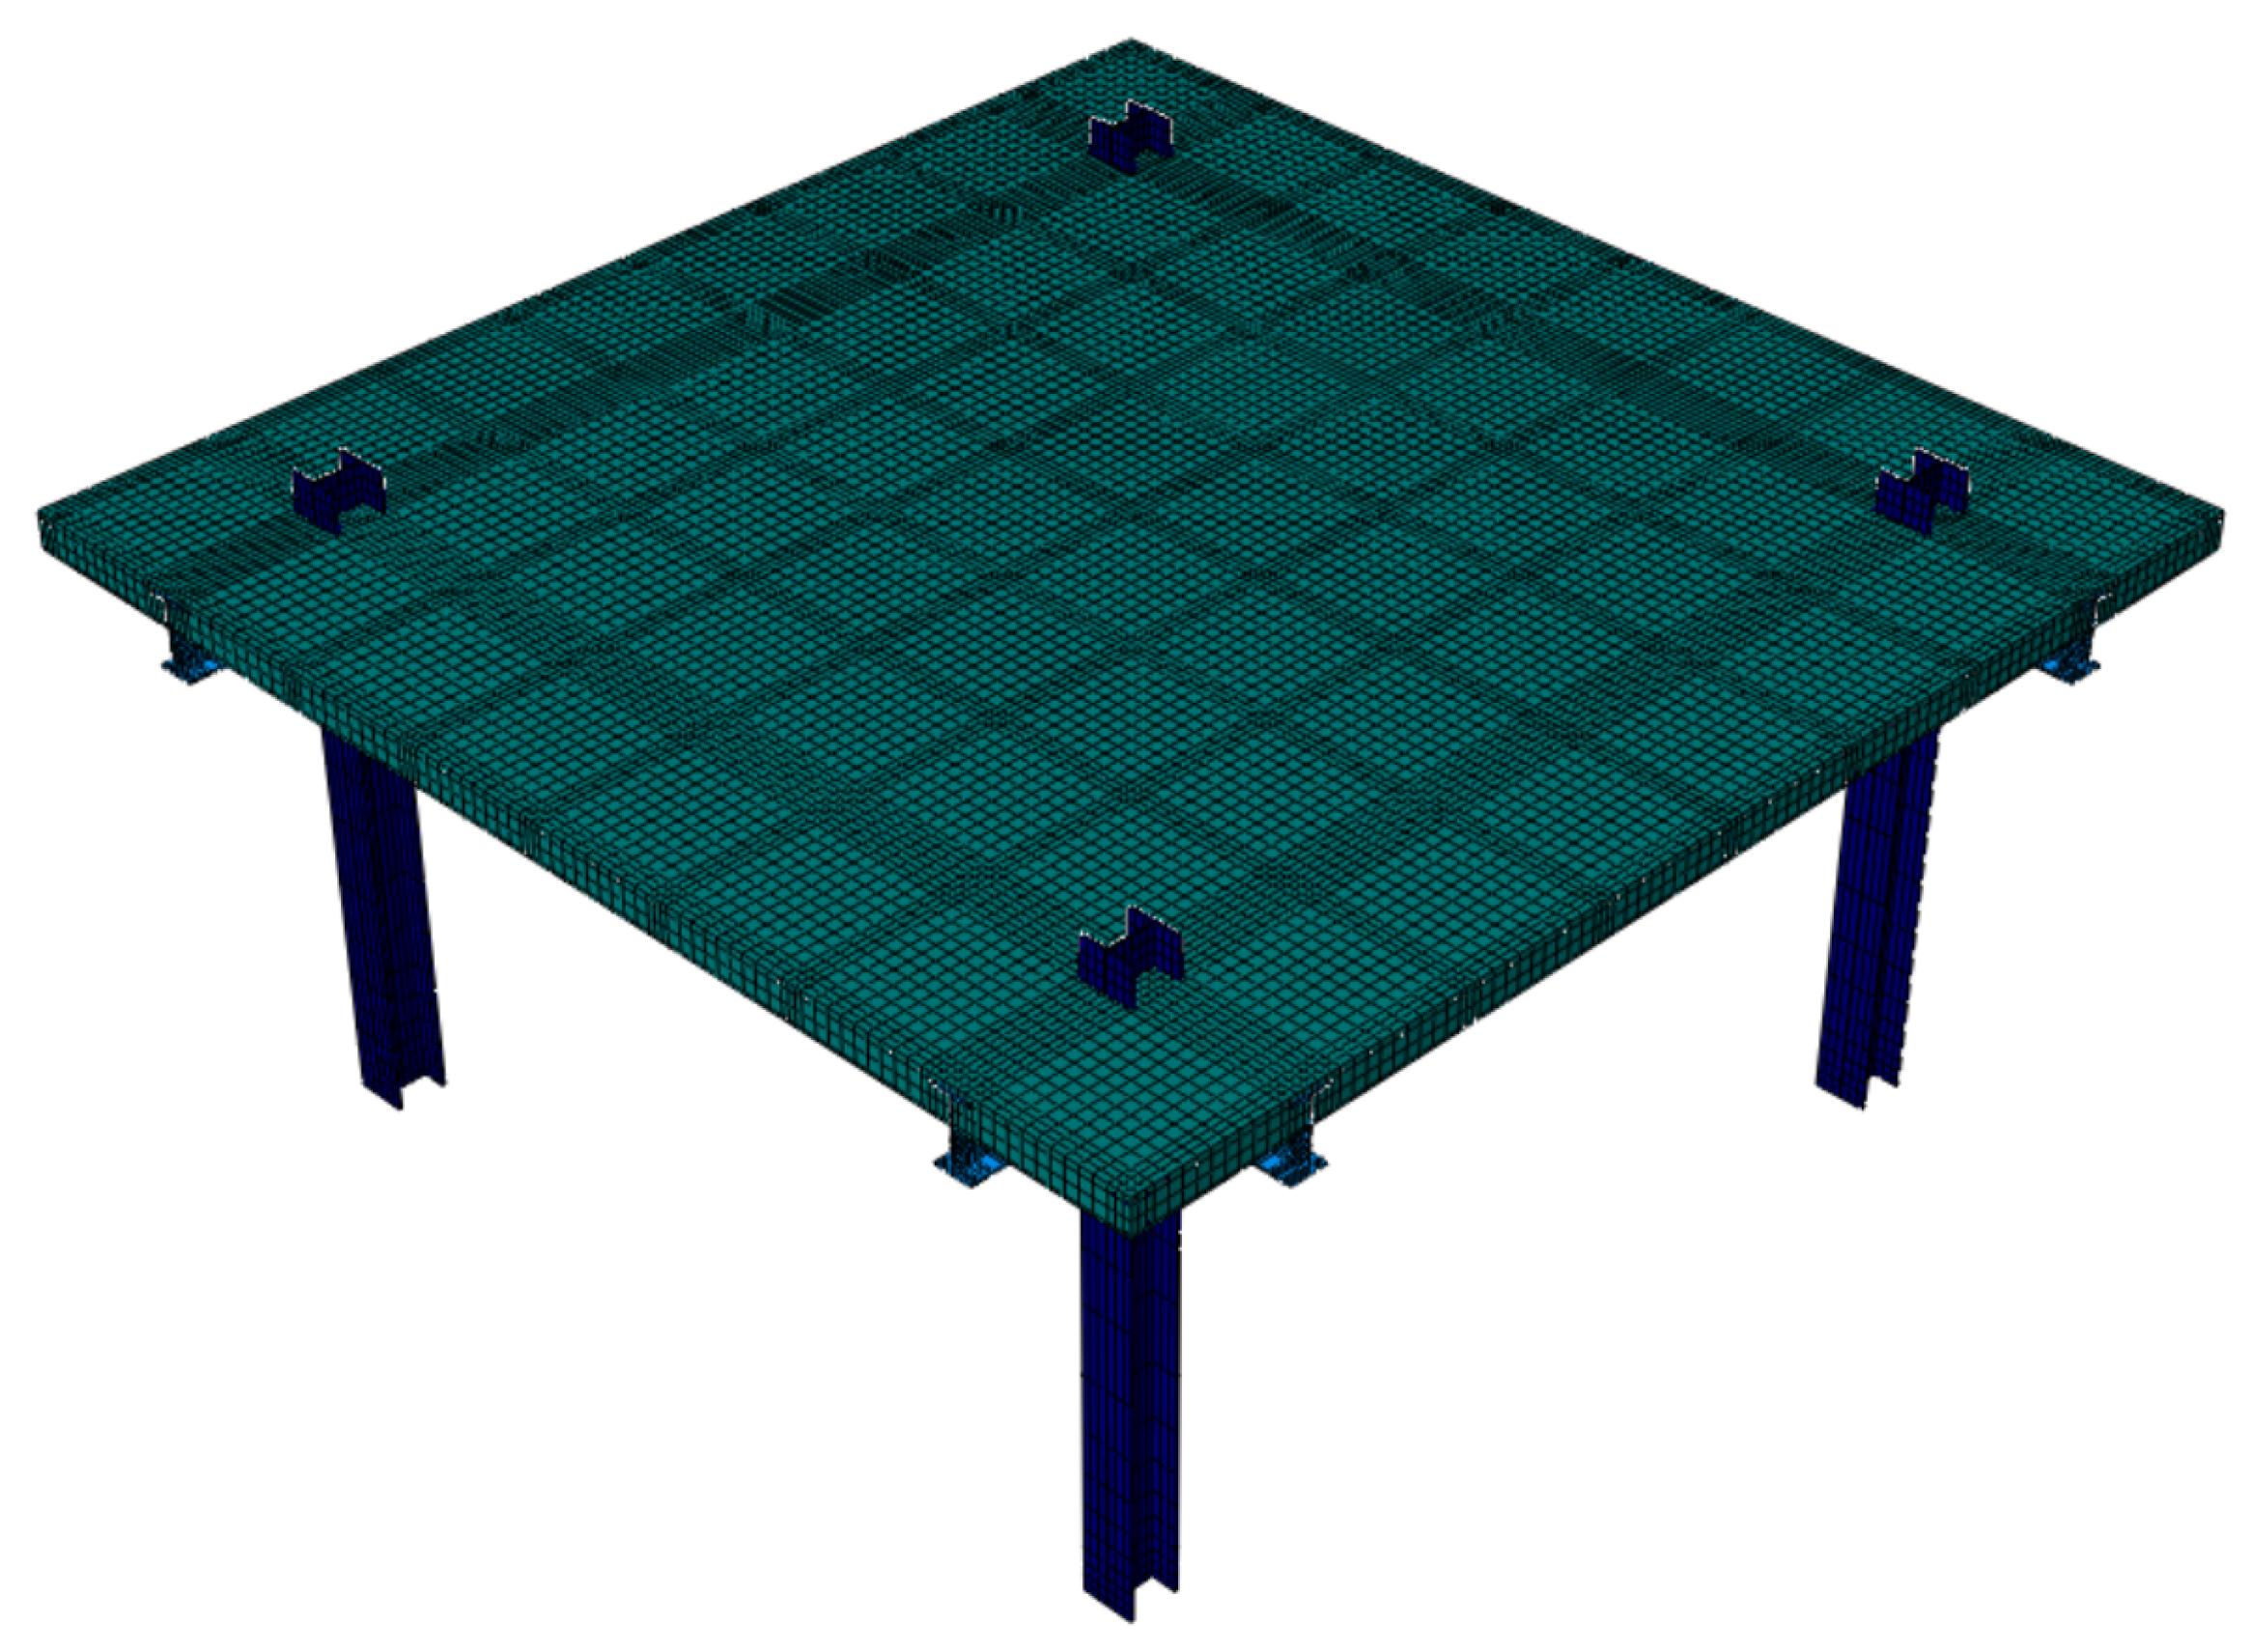
4. Finite Element Analysis of Flexural Deformation
4.1. Finite Element Model
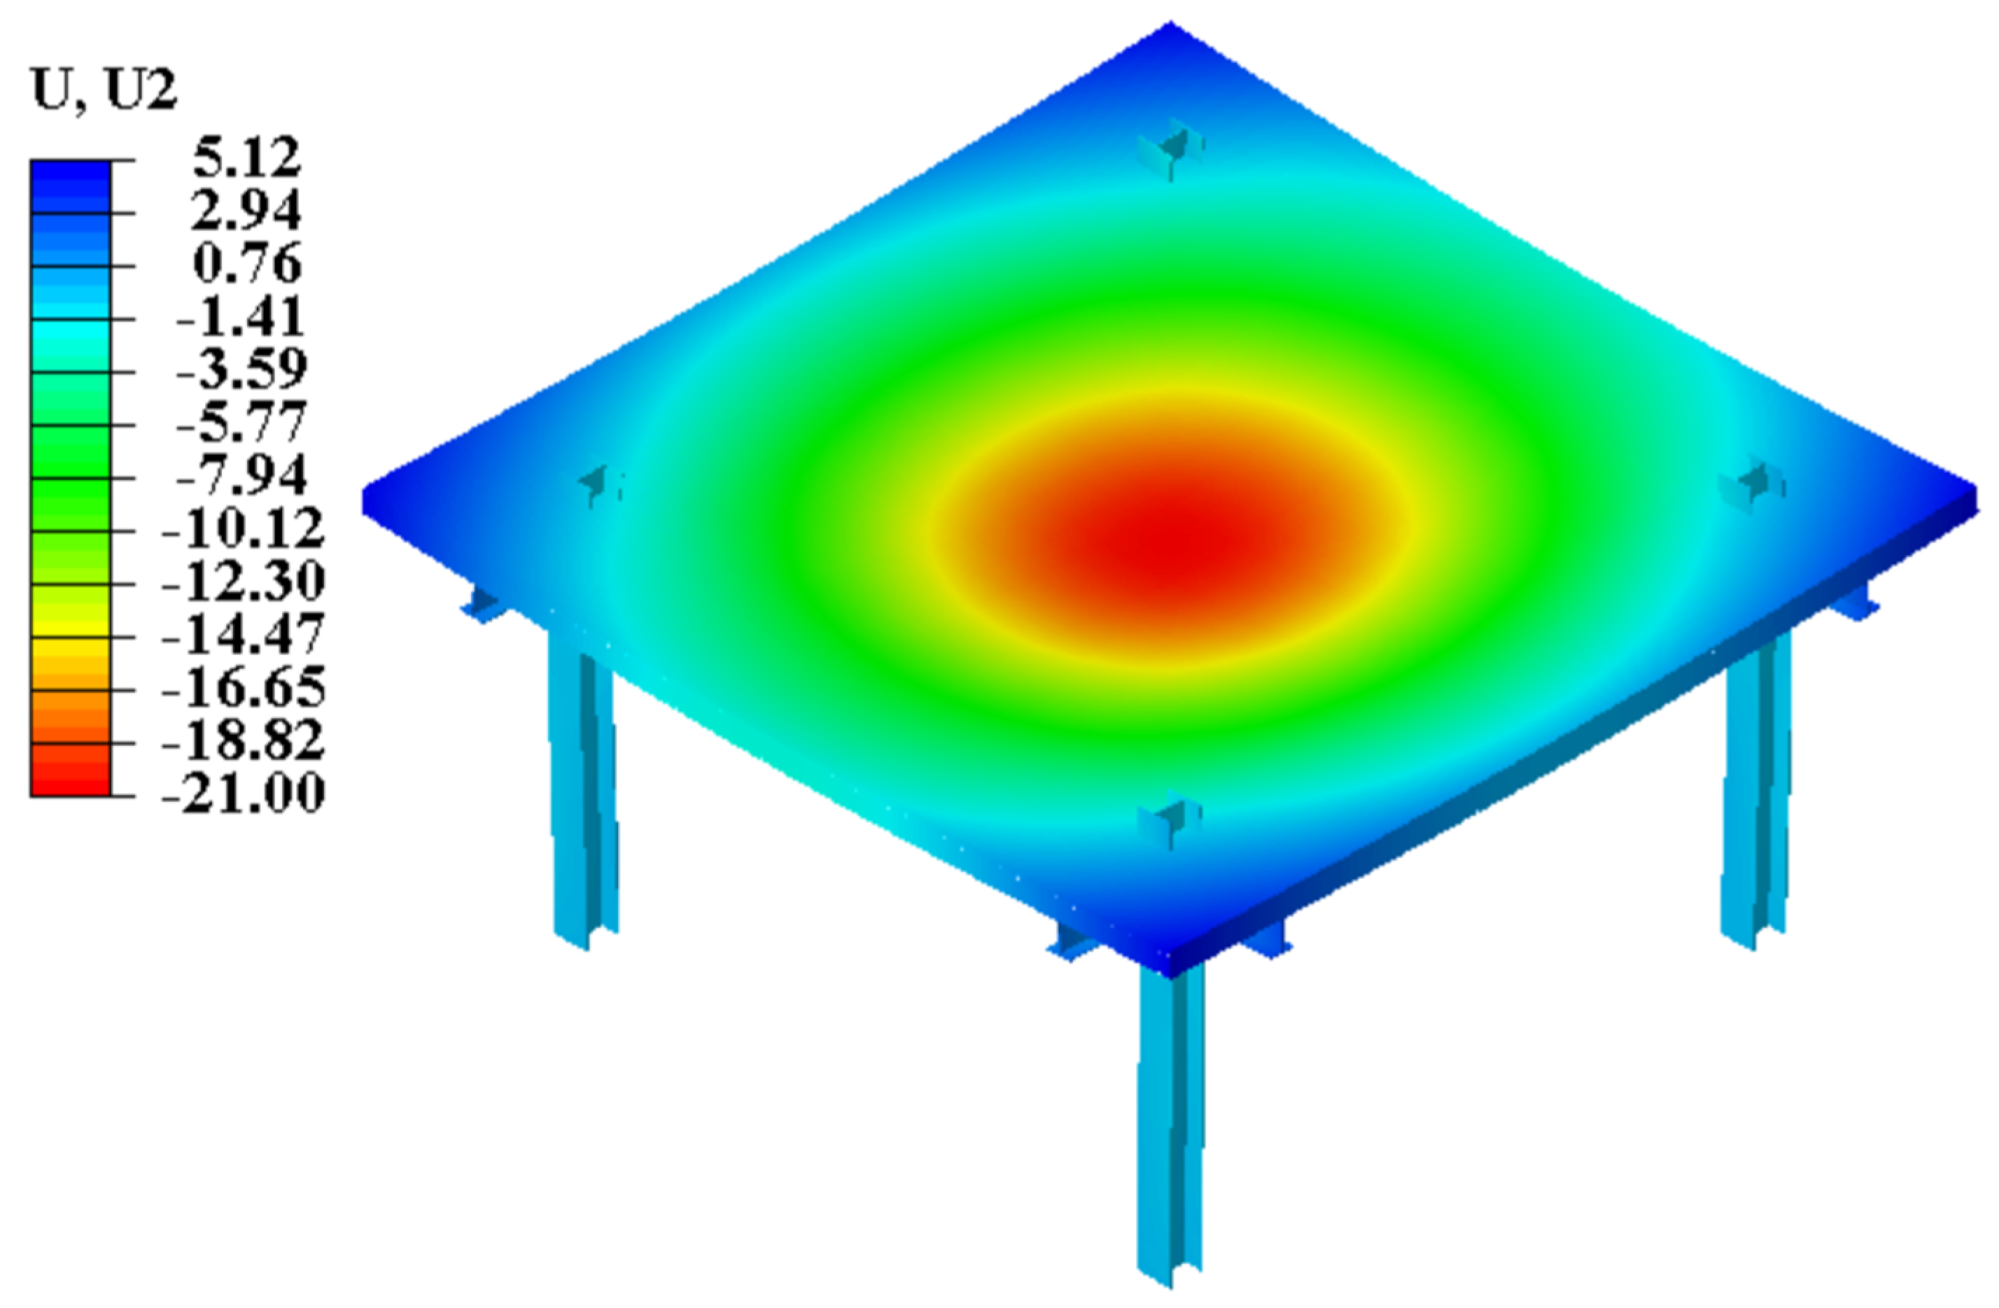
4.2. Finite Element Results and Discussion
5. Theoretical Analyses of Bearing Capacity
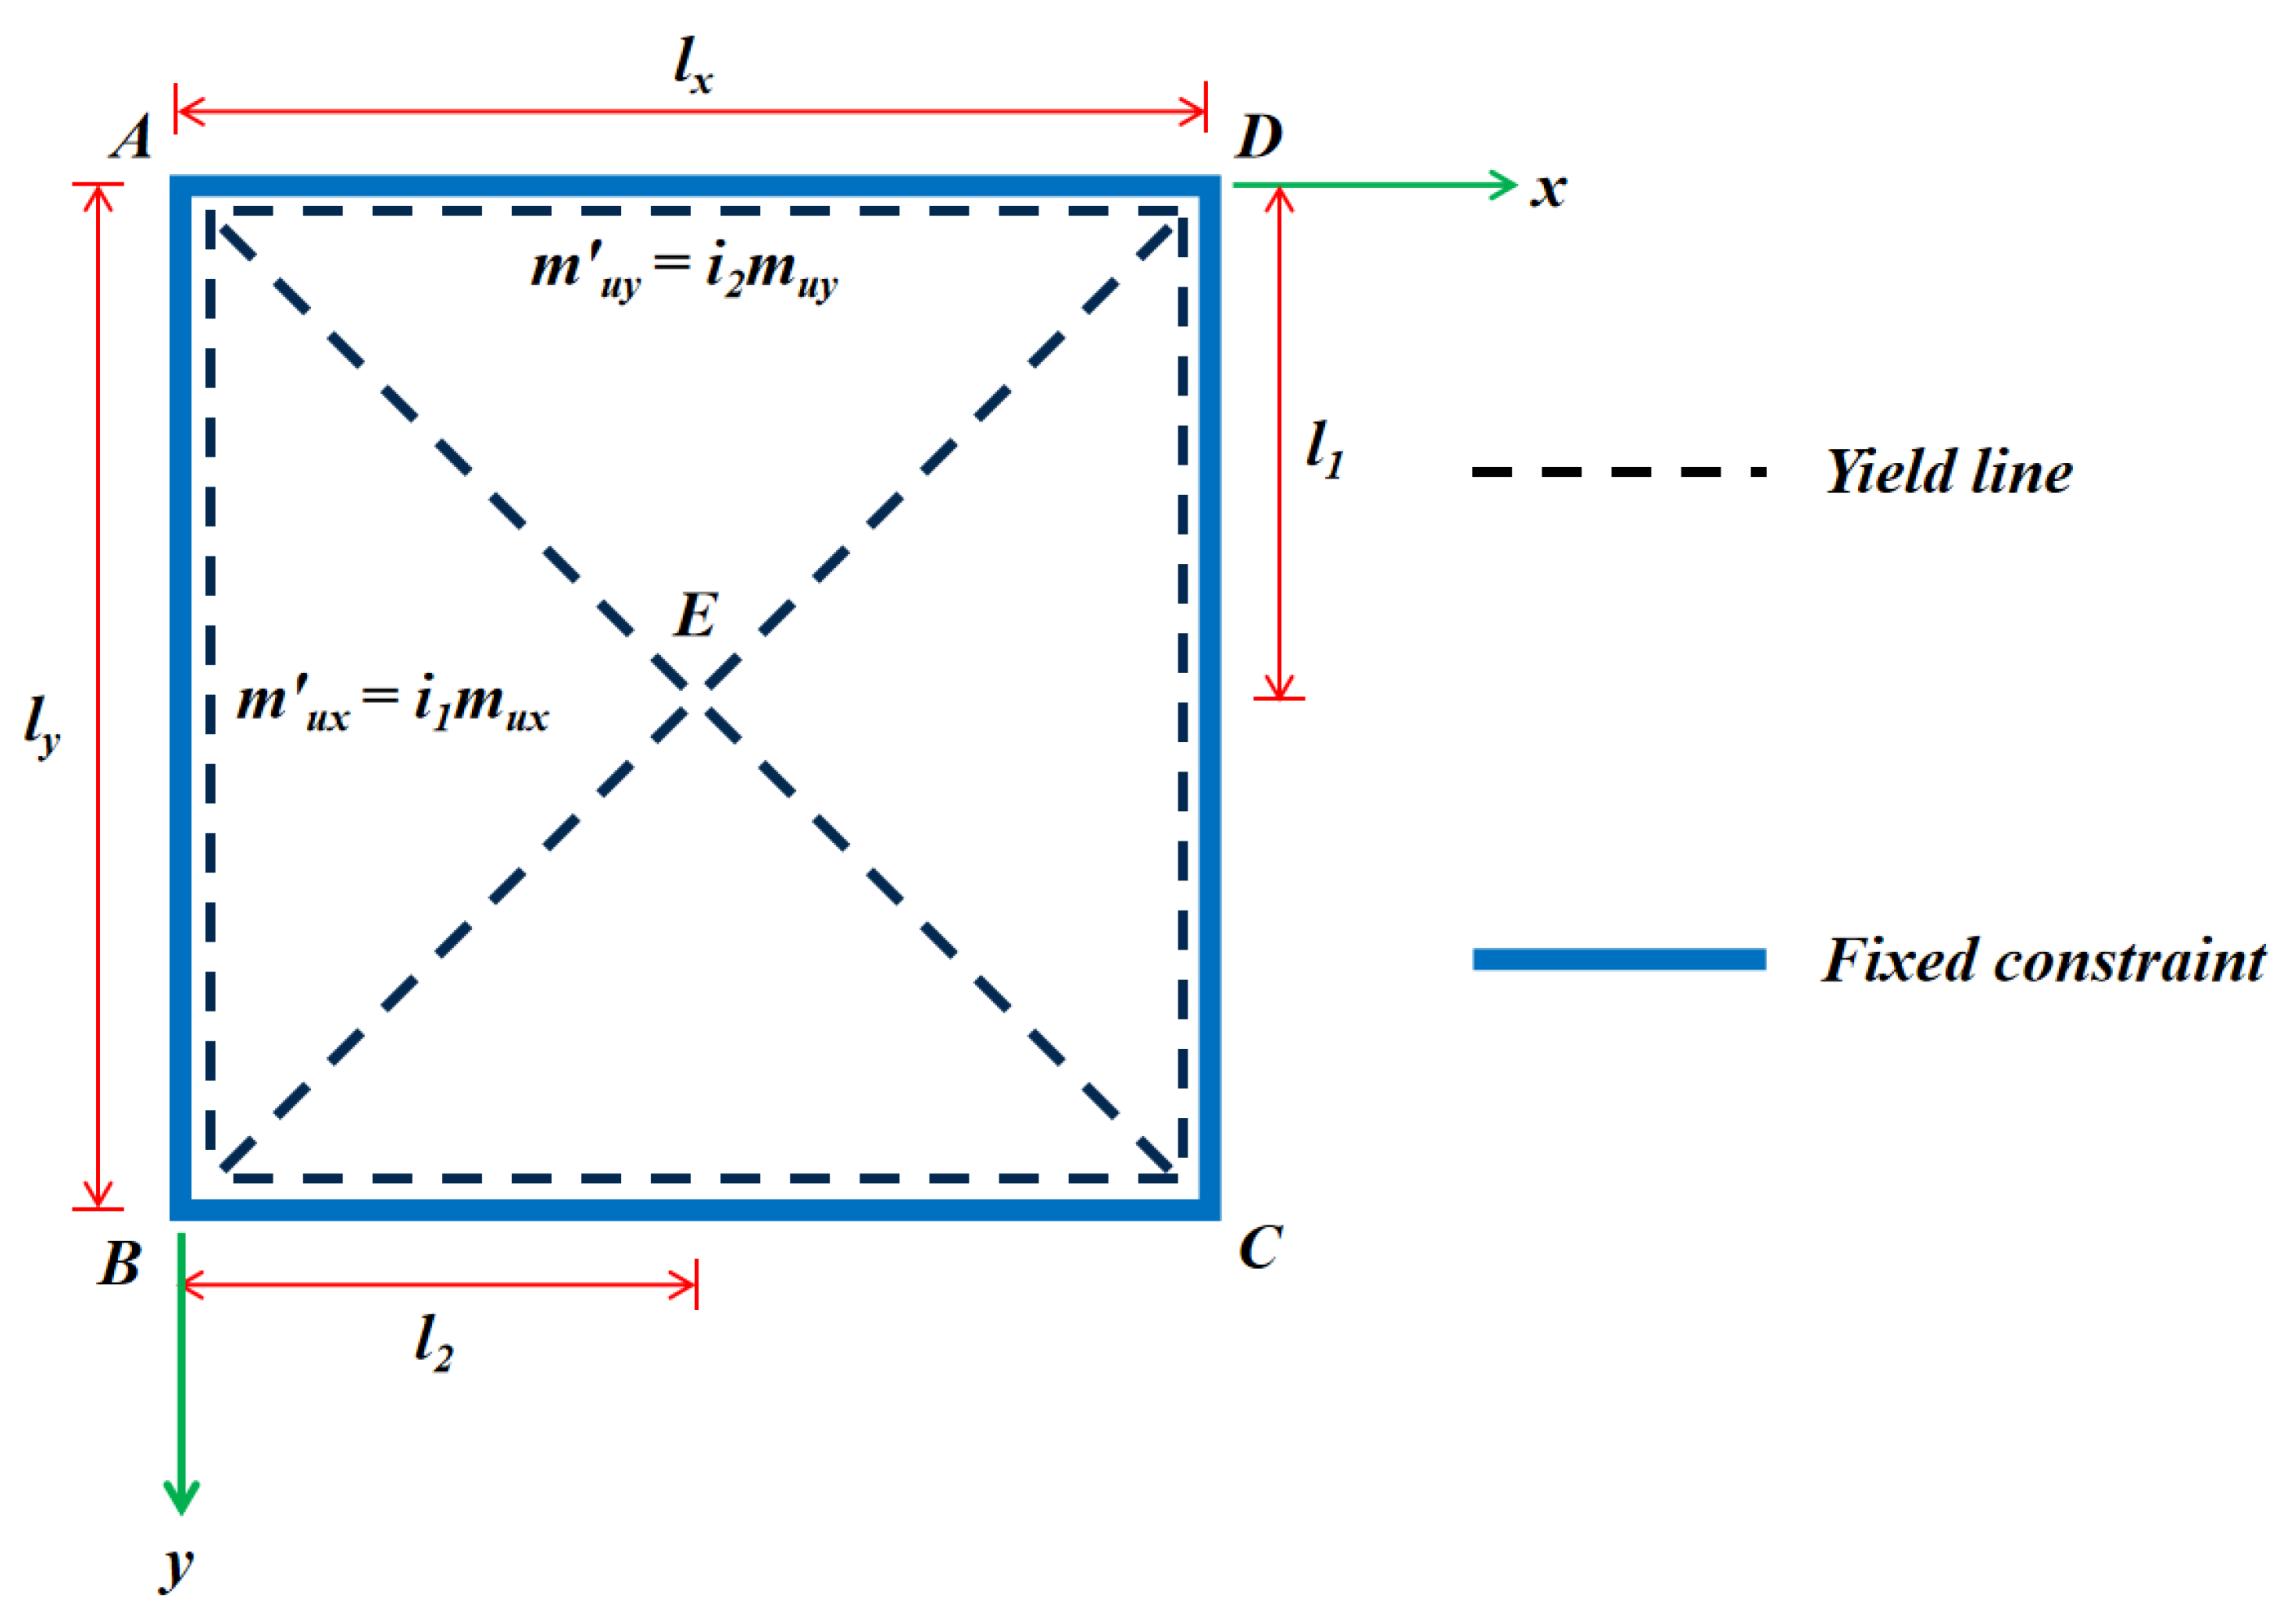
5.1. Predicted Equation Considering Limit Analysis Using the Upper-Bound Method
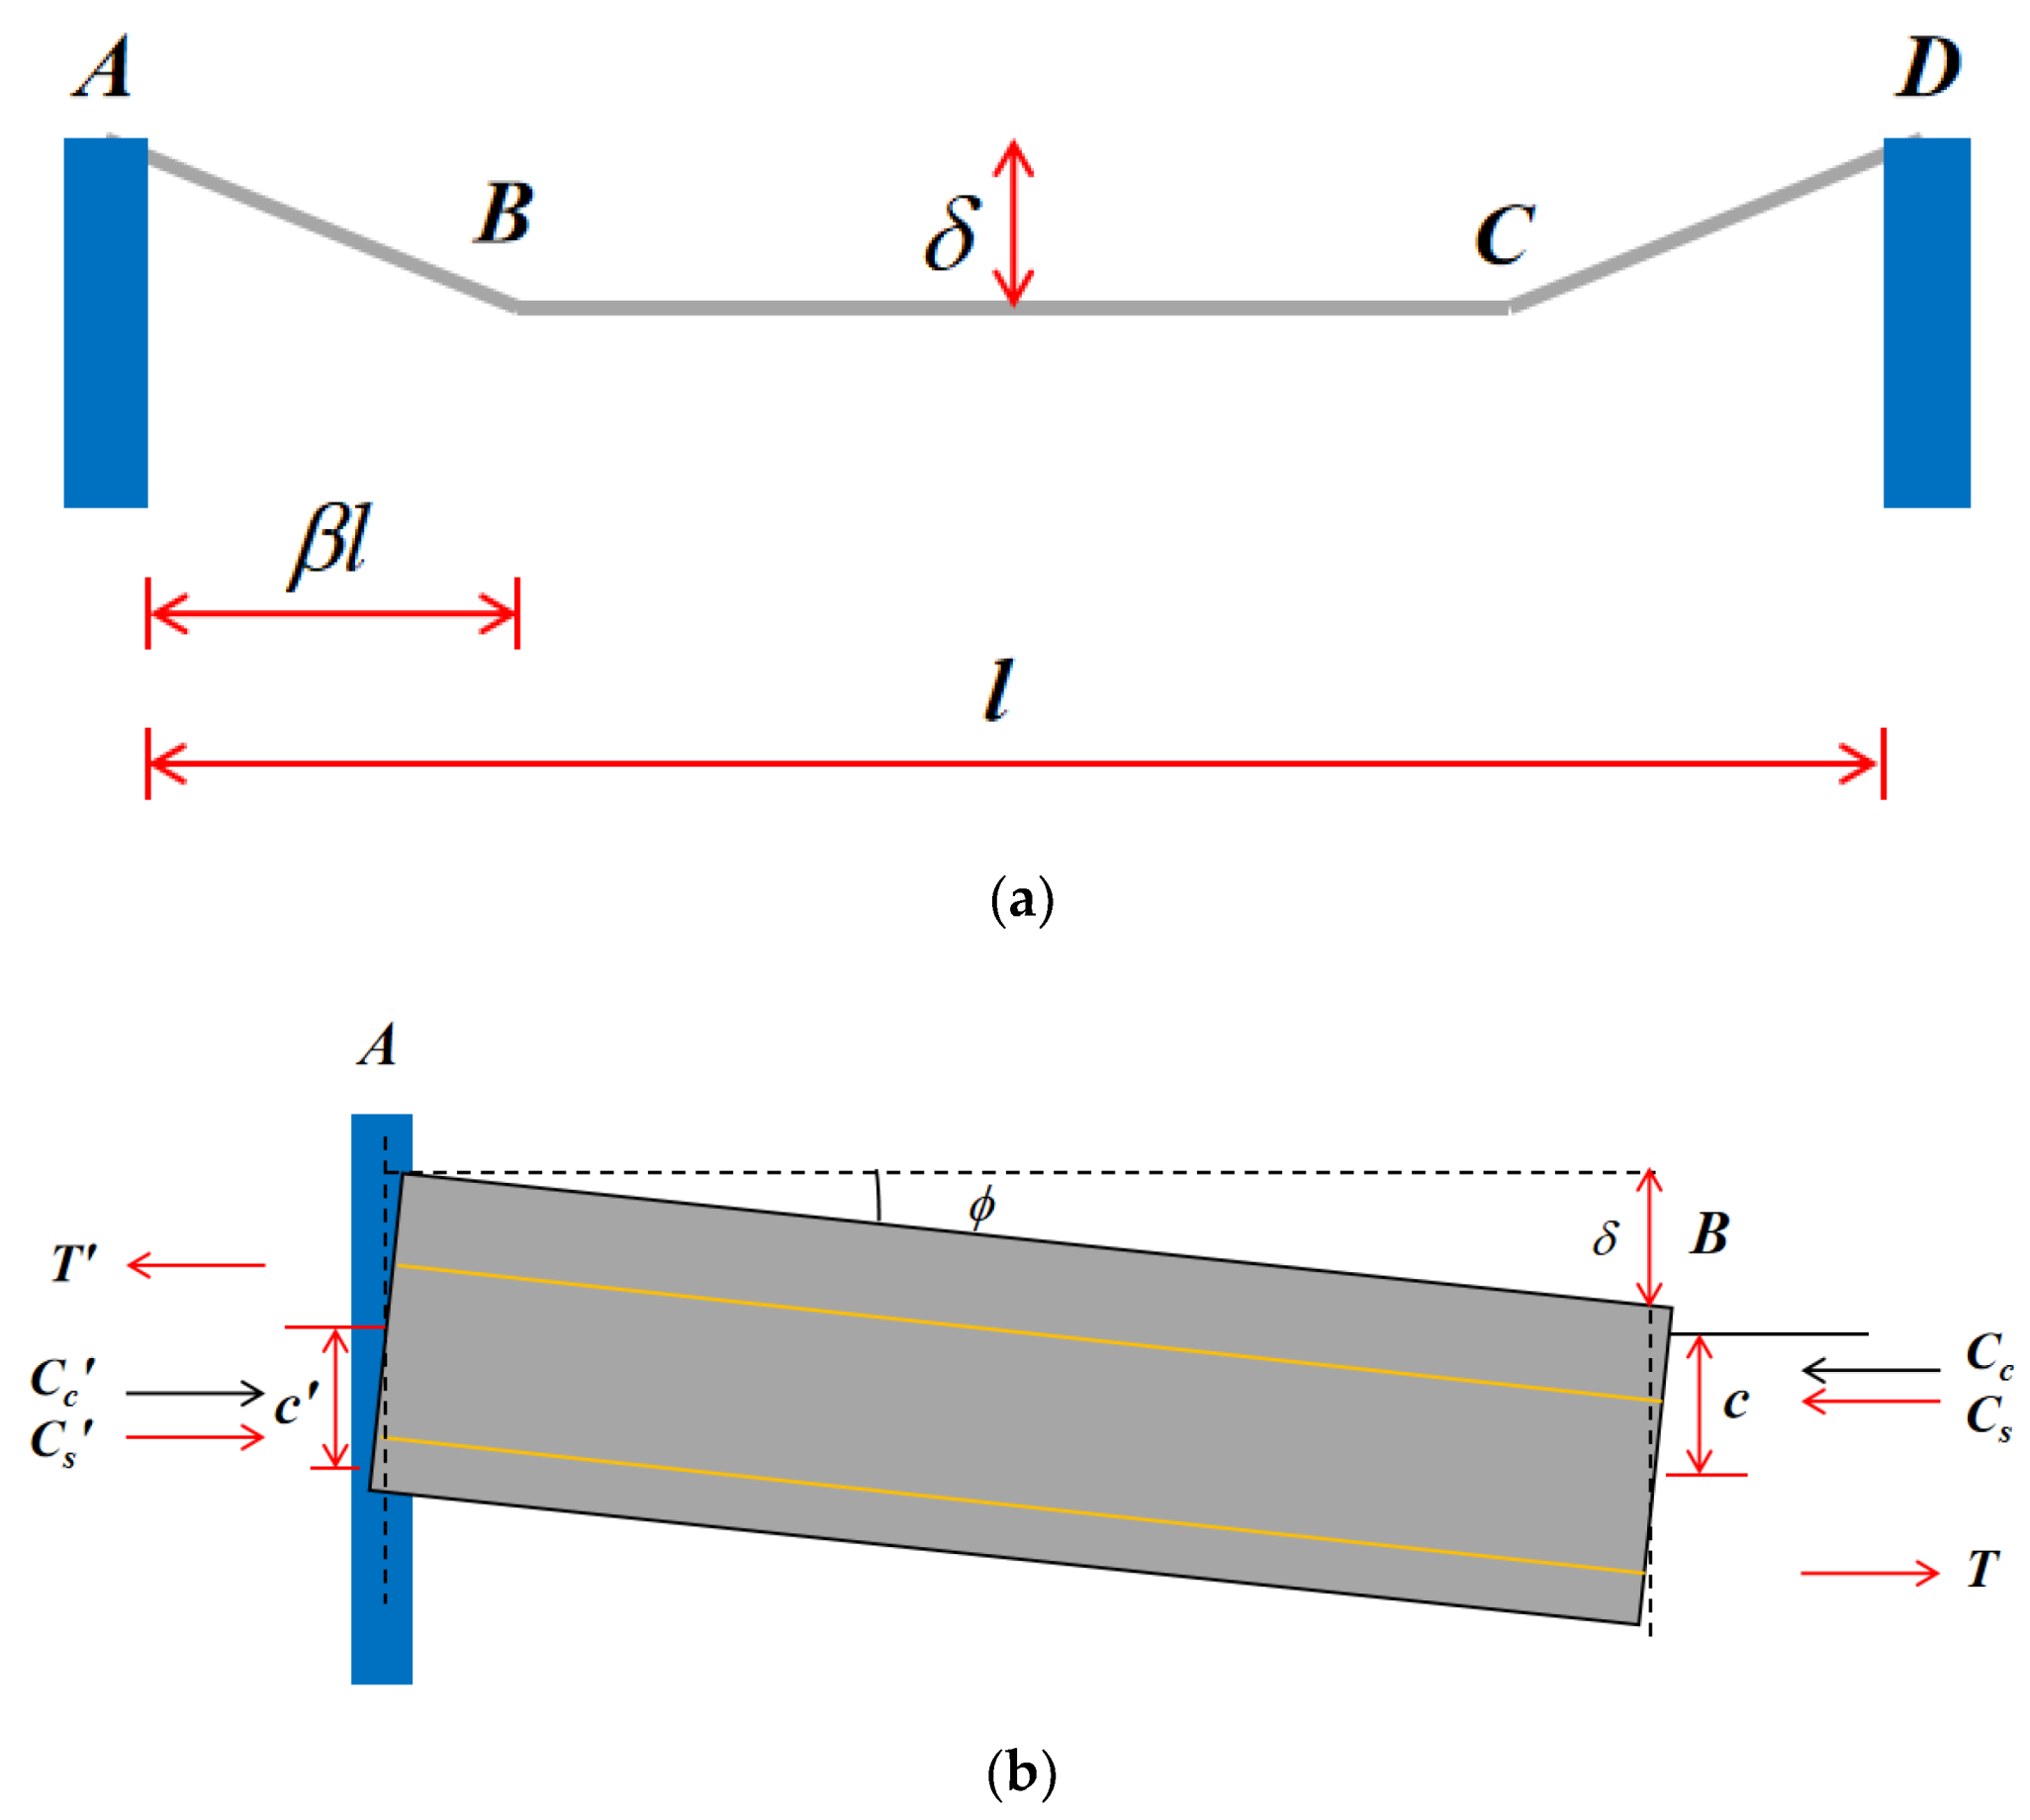
5.2. Calculation Formula Incorporating the Membrane Effect
- (1)
- The yield line mode of the specimen is diagonal (Figure 13).
- (2)
- The cross-section of the floor in a single direction is divided into several I-sections because the fillers and the cast-in-situ concrete ribbed beams can work in concert. Ribbed strips along the X and Y directions constitute a slab and are straight in the yield section, with the sum of the elastic strain, creep strain, axial shrinkage strain , and lateral displacement , are taken as 0.
- (3)
- The concrete in the compression zone reached its yield strength.
- (4)
- When the center deflection is 0.5 times the thickness (i.e., 125 mm), the component achieves the ultimate load [41].
6. Conclusions
- (1)
- The specimen showed similar behavior to a two-way isotropic solid slab under bending. At the end of loading, the main flexural cracks passed through adjacent hidden girders from voids at the central area of the slab.
- (2)
- In the experiment, the ultimate bearing capacity of the composite floor was approximately 38 kN/m2, with a maximum deflection of 20.76 mm. Although the flange of the steel–concrete composite beam was not welded with shear connectors, its deflection at the mid-span is far less than the limit value of GB/T 50152-2012 when the flexural member is damaged.
- (3)
- Based on the load–strain relationships in bidirectional locations, it can be inferred that the specimen is an isotropic hollow slab. In the final stage of the trial, the strain value of upper rebars at the mid-span of the frame girder was positive while that of bottom rebars was negative, consistent with the behavior of the uniformly loaded and laterally constrained reinforced concrete slab when the compressive membrane force is generated.
- (4)
- The predicted equation considering limit analysis using the upper-bound method provided a conservative result in estimating the flexural strength of the specimen, where the ratio of experimental ultimate uniformly distributed load value to that of computation was 1.88.
- (5)
- On the other hand, the proposed theoretical solution incorporating membrane effect was closer to the real datum; therefore, this method can reasonably be applied to calculate the load-bearing capacity of the steel–concrete hollow composite slab voided with thin-walled core boxes.
- (6)
- The membrane effect will have a significant influence on the flexural strength of the hollow slab. However, this effect must be considered with caution, typically when the floor is surrounded with unreliable lateral restraints and configured inappropriate steel ratio in the cross-section.
- (7)
- As established by the test results and valuation, the steel–concrete composite slab voided with thin-walled core boxes can replace a conventional overweight solid slab as a two-way slab.
Author Contributions
Funding
Acknowledgments
Conflicts of Interest
Abbreviation
Appendix A


References
- Tian, X.; Bai, F.; Jia, J.; Liu, Y.; Shi, F. Realizing low-carbon development in a developing and industrializing region: Impacts of industrial structure change on CO2 emissions in southwest China. J. Environ. Manag. 2019. [Google Scholar] [CrossRef]
- Gan, V.J.L.; Cheng, J.C.P.; Lo, I.M.C.; Chan, C.M. Developing a CO2-e accounting method for quantification and analysis of embodied carbon in high-rise buildings. J. Clean. Prod. 2017. [Google Scholar] [CrossRef]
- Gan, V.J.L.; Lo, I.M.C.; Ma, J.; Tse, K.T.; Cheng, J.C.P.; Chan, C.M. Simulation optimisation towards energy efficient green buildings: Current status and future trends. J. Clean. Prod. 2020, 254, 120012. [Google Scholar] [CrossRef]
- Gan, V.J.L.; Chan, C.M.; Tse, K.T.; Lo, I.M.C.; Cheng, J.C.P. A comparative analysis of embodied carbon in high-rise buildings regarding different design parameters. J. Clean. Prod. 2017, 161, 663–675. [Google Scholar] [CrossRef]
- Gan, V.J.L.; Deng, M.; Tse, K.T.; Chan, C.M.; Lo, I.M.C.; Cheng, J.C.P. Holistic BIM framework for sustainable low carbon design of high-rise buildings. J. Clean. Prod. 2018, 195, 1091–1104. [Google Scholar] [CrossRef]
- Gan, V.J.L.; Wong, H.K.; Tse, K.T.; Cheng, J.C.P.; Lo, I.M.C.; Chan, C.M. Simulation-based evolutionary optimization for energy-efficient layout plan design of high-rise residential buildings. J. Clean. Prod. 2019, 231, 1375–1388. [Google Scholar] [CrossRef]
- Zuo, J.; Zhao, Z.Y. Green building research-current status and future agenda: A review. Renew. Sustain. Energy Rev. 2014, 30, 271–281. [Google Scholar] [CrossRef]
- Gan, V.J.L.; Cheng, J.C.P.; Lo, I.M.C. A comprehensive approach to mitigation of embodied carbon in reinforced concrete buildings. J. Clean. Prod. 2019, 229, 582–597. [Google Scholar] [CrossRef]
- Afzal, M.; Liu, Y.; Cheng, J.C.P.; Gan, V.J.L. Reinforced concrete structural design optimization: A critical review. J. Clean. Prod. 2020, 120623. [Google Scholar] [CrossRef]
- Al-Shaarbaf, I.A.; Al-Azzawi, A.A.; Abdulsattar, R. A state of the art review on hollow core slabs. ARPN J. Eng. Appl. Sci. 2018, 13, 9. [Google Scholar]
- Maazoun, A.; Matthys, S.; Belkassem, B.; Lecompte, D.; Vantomme, J. Blast response of retrofitted reinforced concrete hollow core slabs under a close distance explosion. Eng. Struct. 2019, 191, 447–459. [Google Scholar] [CrossRef]
- Albero, V.; Espinós, A.; Serra, E.; Romero, M.L.; Hospitaler, A. Numerical study on the flexural behaviour of slim-floor beams with hollow core slabs at elevated temperature. Eng. Struct. 2019, 180, 561–573. [Google Scholar] [CrossRef]
- Lee, C.H.; Mansouri, I.; Kim, E.; Ryu, J.; Woo, W.T. Experimental analysis of one-way composite steel deck slabs voided by circular paper tubes: Shear strength and moment–shear interaction. Eng. Struct. 2019, 182, 227–240. [Google Scholar] [CrossRef]
- Lee, C.H.; Mansouri, I.; Kim, E.; Hwang, K.S.; Woo, W.T. Flexural Strength of One-Way Composite Steel Deck Slabs Voided by Circular Paper Tubes. J. Struct. Eng. 2019, 145, 04018246. [Google Scholar] [CrossRef]
- Rahman, M.K.; Baluch, M.H.; Said, M.K.; Shazali, M.A. Flexural and Shear Strength of Prestressed Precast Hollow-Core Slabs. Arab. J. Sci. Eng. 2012, 37, 443–455. [Google Scholar] [CrossRef]
- Jiang, Z.; Luo, Z. Study on Mechanical Behavior Influence of the Hollow Ratio to the Cast-in-Situ Concrete Hollow Slab with Two-Way Tube Fillers. Adv. Mater. Res. 2012, 594–597, 942–946. [Google Scholar] [CrossRef]
- Prabhu Teja, P.; Vijay Kumar, P.; Anusha, S.; Mounika, C.H.; Saha, P. Structural Behavior of Bubble Deck Slab. In 2012 International Conference on Advances in Engineering, Science and Management; Institute of Electrical and Electronics Engineers: Piscataway Township, NJ, USA, 2012; ISBN 9781467302135. [Google Scholar]
- Prakashan, L.V.; George, J.; Edayadiyil, J.B.; George, J.M. Experimental Study on the Flexural Behavior of Hollow Core Concrete Slabs. Appl. Mech. Mater. 2016. [Google Scholar] [CrossRef]
- Wariyatno, N.G.; Haryanto, Y.; Sudibyo, G.H. Flexural Behavior of Precast Hollow Core Slab Using PVC Pipe and Styrofoam with different Reinforcement. Procedia Eng. 2017, 171, 909–916. [Google Scholar] [CrossRef]
- Al-Azzawi, A.A.; Abdul Al-Aziz, B.M. Behavior of reinforced lightweight aggregate concrete hollow-core slabs. Comput. Concr. 2018. [Google Scholar] [CrossRef]
- Ryu, J.; Lee, C.H.; Oh, J.; Yoon, S.W.; Ju, Y.K. Shear Resistance of a Biaxial Hollow Composite Floor System with GFRP Plates. J. Struct. Eng. 2017, 143, 04016180. [Google Scholar] [CrossRef]
- Gohari, S.; Sharifi, S.; Burvill, C.; Mouloodi, S.; Izadifar, M.; Thissen, P. Localized failure analysis of internally pressurized laminated ellipsoidal woven GFRP composite domes: Analytical, numerical, and experimental studies. Arch. Civ. Mech. Eng. 2019. [Google Scholar] [CrossRef]
- Gol Zardian, M.; Moslemi, N.; Mozafari, F.; Gohari, S.; Yahya, M.Y.; Burvill, C.; Ayob, A. Flexural and free vibration control of smart epoxy composite beams using shape memory alloy wires actuator. J. Intell. Mater. Syst. Struct. 2020. [Google Scholar] [CrossRef]
- Precast/Prestressed Concrete Institute. PCI Design Handbook: Precast and Prestressed Concrete, 7th ed.; Precast/Prestressed Concrete Institute: Chicago, IL, USA, 2010; ISBN 9780937040874. [Google Scholar]
- Yang, J.; Chen, H.; Hu, S.; Gan, V.J.L. Experimental studies on the flexural behaviour of steel-concrete composite beams with transverse and longitudinal hidden girders. Eng. Struct. 2019, 179, 583–594. [Google Scholar] [CrossRef]
- Ho, P.L.H.; Le, C.V.; Tran-Cong, T. Limit state analysis of reinforced concrete slabs using an integrated radial basis function based mesh-free method. Appl. Math. Model. 2018. [Google Scholar] [CrossRef]
- Jensen, T.W.; Poulsen, P.N.; Hoang, L.C. Limit analysis of reinforced concrete slabs with construction joints. Eng. Struct. 2020. [Google Scholar] [CrossRef]
- Salam Al-Sabah, A.; Falter, H. Finite element lower bound “yield line” analysis of isotropic slabs using rotation-free elements. Eng. Struct. 2013. [Google Scholar] [CrossRef]
- Belletti, B.; Walraven, J.C.; Trapani, F. Evaluation of compressive membrane action effects on punching shear resistance of reinforced concrete slabs. Eng. Struct. 2015. [Google Scholar] [CrossRef]
- Burgess, I. Yield-line plasticity and tensile membrane action in lightly-reinforced rectangular concrete slabs. Eng. Struct. 2017. [Google Scholar] [CrossRef]
- Burgess, I.; Chan, B. An integrated yield-line approach to tensile and compressive membrane actions in thin lightly-reinforced concrete slabs. Eng. Struct. 2020. [Google Scholar] [CrossRef]
- Einpaul, J.; Fernández Ruiz, M.; Muttoni, A. Influence of moment redistribution and compressive membrane action on punching strength of flat slabs. Eng. Struct. 2015. [Google Scholar] [CrossRef]
- Thoma, K.; Malisia, F. Compressive membrane action in RC one-way slabs. Eng. Struct. 2018. [Google Scholar] [CrossRef]
- Chung, J.H.; Jung, H.S.; Bae, B.I.; Choi, C.S.; Choi, H.K. Two-Way Flexural Behavior of Donut-Type Voided Slabs. Int. J. Concr. Struct. Mater. 2018. [Google Scholar] [CrossRef]
- Zhang, Z.; Yang, W.; He, Z. Experiment and Theory Study on Ultimate Bearing Capacity of Reinforced Concrete Tubular Hollow Continuous Slab. Appl. Mech. Mater. 2012, 204–208, 782–785. [Google Scholar] [CrossRef]
- Ministry of Housing and Urban-Rural Development of P.R.China. Technical Specification for Cast-in-Situ Concrete Hollow Floor Structure (JGJ/T 268-2012); Ministry of Housing and Urban-Rural Development of P.R.China: Beijing, China, 2012.
- General Administration of Quality Supervision, Inspection and Quarantine of P.R.China, M. of C. of P.R.C. The Standard for the Test Method of Mechanical Properties on Ordinary Concrete (GB/T 50081-2002); General Administration of Quality Supervision, Inspection and Quarantine of P.R.China, M. of C. of P.R.C.: Beijing, China, 2002. [Google Scholar]
- General Administration of Quality Supervision, Inspection and Quarantine of P.R.China, S.A. of P.R.C. Metallic Materials-Tensile Testing-Part 1: Method of the Test at Room Temperature (GB/T 228.1-2010); General Administration of Quality Supervision, Inspection and Quarantine of P.R.China, S.A. of P.R.C: Beijing, China, 2010. [Google Scholar]
- General Administration of Quality Supervision, Inspection and Quarantine of P.R.China, M. of H. and U.-R.D. of P.R.C. Code for Design of Concrete Structures (GB 50010-2010); General Administration of Quality Supervision, Inspection and Quarantine of P.R.China, M. of H. and U.-R.D. of P.R.C.: Beijing, China, 2015. [Google Scholar]
- General Administration of Quality Supervision, Inspection and Quarantine of P.R.China, M. of H. and U.-R.D. of P.R.C. The Standard for the Test Method of Concrete Structures (GB/T 50152-2012); General Administration of Quality Supervision, Inspection and Quarantine of P.R.China, M. of H. and U.-R.D. of P.R.C.: Beijing, China, 2012. [Google Scholar]
- Bhatt, P.; MacGinley, T.J.; Choo, B.S. Reinforced concrete slabs. In Reinforced Concrete Design Theory and Examples; Taylor&Francis Group: Abingdon, UK, 2010. [Google Scholar] [CrossRef]
- Ding, F.X.; Zhang, P.; Zhou, L.C.; Yu, Z.W. Nonlinear Finite Element Analysis of Axially Loaded Lightweight Aggregate Concrete Filled Circular Steel Tubular Stub Columns; Harbin Gongye Daxue: Harbin, China, 2010. [Google Scholar]
- Johansen, K.W. Yield-Line Formulae for Slabs; CRC Press: Boca Raton, FL, USA, 1968. [Google Scholar] [CrossRef]
- Bailey, C.G. Membrane action of unrestrained lightly reinforced concrete slabs at large displacements. Eng. Struct. 2001. [Google Scholar] [CrossRef]
- Famiyesin, O.O.R.; Hossain, K.M.A.; Chia, Y.H.; Slade, P.A. Numerical and analytical predictions of the limit load of rectangular two way slabs. Comput. Struct. 2001, 79, 43–52. [Google Scholar] [CrossRef]
- Foster, S.J.; Bailey, C.G.; Burgess, I.W.; Plank, R.J. Experimental behaviour of concrete floor slabs at large displacements. Eng. Struct. 2004. [Google Scholar] [CrossRef]
- ACI Committee 318-14. Building Code Requirements for Structural Concrete and Commentary; American Concrete Institute: Indianapolis, IN, USA, 2014; ISBN 9780870319303. [Google Scholar]


| Specimen | ts (mm) | Width (mm) | Length (mm) | Void Filler | Reinforcing Bar | ||||
|---|---|---|---|---|---|---|---|---|---|
| Hidden Girder | Slab | ||||||||
| Upper | Bottom | Stirrup | Upper | Bottom | |||||
| F-TWCBs | 250 | 6250 | 6250 | Thin-walled core box | 2-D14 @100 | 2-D14 @100 | D6 @200 | D6 @200 | - |
| Sample | Age (d) | Compressive Strength (Mpa) | Elastic Modulus (Mpa) | Applied Specimen |
|---|---|---|---|---|
| 1 | 28 | 21.57 | 30,800 | F-TWCBs |
| Diameter (mm) | Yield Stress (Mpa) | Ultimate Stress (Mpa) | Elastic Modulus (Mpa) | Applied Specimen |
|---|---|---|---|---|
| 6 | 326.67 | 456.86 | 2.03 × 10⁵ | F-TWCBs F-TWCBs |
| 14 | 358.26 | 528.38 | 1.95 × 10⁵ |
| Bottom Reinforcing Bar | Upper Reinforcing Bar | Bs (N·mm2) | ||
|---|---|---|---|---|
| Location | Strain (×10−6) | Location | Strain (×10−6) | |
| B2 | −72.75 | U2 | −32.21 | 7.05 × 10¹³ |
| B5 | −78.14 | U5 | −31.73 | 6.71 × 10¹³ |
| B3 | −78.93 | U3 | −8.17 | 2.79 × 10¹³ |
| B6 | −82.63 | U6 | −11.06 | 2.59 × 10¹³ |
© 2020 by the authors. Licensee MDPI, Basel, Switzerland. This article is an open access article distributed under the terms and conditions of the Creative Commons Attribution (CC BY) license (http://creativecommons.org/licenses/by/4.0/).
Share and Cite
Huang, Y.; Gan, V.J.L.; Chen, H.; Yang, J. Behavior of a Two-Way Lightweight Steel–Concrete Composite Slab Voided with Thin-Walled Core Boxes towards Sustainable Construction. Materials 2020, 13, 4129. https://doi.org/10.3390/ma13184129
Huang Y, Gan VJL, Chen H, Yang J. Behavior of a Two-Way Lightweight Steel–Concrete Composite Slab Voided with Thin-Walled Core Boxes towards Sustainable Construction. Materials. 2020; 13(18):4129. https://doi.org/10.3390/ma13184129
Chicago/Turabian StyleHuang, Yongqi, Vincent J.L. Gan, Huaguo Chen, and Jianjun Yang. 2020. "Behavior of a Two-Way Lightweight Steel–Concrete Composite Slab Voided with Thin-Walled Core Boxes towards Sustainable Construction" Materials 13, no. 18: 4129. https://doi.org/10.3390/ma13184129
APA StyleHuang, Y., Gan, V. J. L., Chen, H., & Yang, J. (2020). Behavior of a Two-Way Lightweight Steel–Concrete Composite Slab Voided with Thin-Walled Core Boxes towards Sustainable Construction. Materials, 13(18), 4129. https://doi.org/10.3390/ma13184129