Article

The Phase Relations of the Co-Ni-In Ternary System at 673 K and 873 K and Magnetic Properties of Their Compounds

1
College of Chemistry and Chemical Engineering, Guangxi University, Nanning 530004, China
2
School of Resources, Environment and Materials and Guangxi Key Laboratory of Processing for Non-ferrous Metallic and Featured Materials, Guangxi University, Nanning 530004, China
3
School of Materials and Chemical Engineering, Ningbo University of Technology, Ningbo 315211, China
4
School of Science, Guangxi University of Nationalities, Nanning 530006, China
*
Author to whom correspondence should be addressed.
Materials 2020, 13(18), 3990; https://doi.org/10.3390/ma13183990
Submission received: 10 July 2020 / Revised: 3 September 2020 / Accepted: 4 September 2020 / Published: 9 September 2020

Abstract

:
The phase relationships of the ternary Co-Ni-In system at 673 K and 873 K were investigated by means of powder X-ray diffraction, scanning electron microscopy equipped with energy dispersive spectroscopy, and optical microscopy. Though CoIn2 does not exist at 873 K, the ternary solid solution Co1−xNixIn2 exists at both 673 K and 873 K with different composition ranges. The Rietveld refinements were carried out to investigate the crystal structure of Co1−xNixIn2 (x = 0.540, and 0.580) and Ni2−xCoxIn3 (x = 0.200). The magnetization dependence of temperature (MT) curves of Ni2−xCoxIn3 (x = 0.200) and Co1−xNixIn2 (x = 0.540) are similar to those of the ferromagnetic shape memory alloys Ni-Mn-A (A = Ga, Sn, and In), but do not undergo martensitic transformation. The maximum magnetic entropy changes in Ni2−xCoxIn3 (x = 0.200) and Co1−xNixIn2 (x = 0.540) under 3T are 1.25 and 1.475 J kg−1K−1, respectively.

1. Introduction

Recently, Ni-Mn-In has drawn increasing attention due to its fascinating multifunctional properties including its shape memory effect [1], magnetocaloric effect [2], elastocaloric effect [3], magnetothermal conductivity [4], magnetic superelasticity [5], barocaloric effect [6], and large exchange bias effect [7] associated with the martensitic-type phase transformation. A large number of researches have shown that the properties of the Ni-Mn-In alloys have been highly improved when accompanied with a small amount of Co doping into Ni-Mn-In ternary compounds [8,9,10]. This brings more attention to the Ni-Co-Mn-In quaternary compounds and another upsurge of research of the alloys [11,12,13,14]. The martensitic transformation, which belongs to first-order magnetostructural transformation, led to a large magnetic entropy change (ΔS) which makes Ni-Co-Mn-In alloys promising candidates for magnetic refrigeration materials [15,16,17]. A giant magnetocaloric effect driven by structural transitions was found in Ni45.7Mn36.3In13Co5, which resulted in a high adiabatic temperature change (ΔTad) of −6.2 K under a low field of 2T [2]. In Cheng’s work, the temperature-induced martensitic transformation of Ni42Co8Mn37.7In12.3 alloy achieved a giant (ΔS) of 14.30 J·K−1·kg −1 and refrigeration capacity (RC) up to 549 J·K−1. Additionally, the near-room-temperature working temperature range of 248–295 K makes it superior among a number of reported magnetocaloric materials [18]. Large magnetic field-induced martensitic transformation led to enormous recoverable deformation, which can be easily observed in Ni-Co-Mn-In alloys, making it an attractive shape memory functional material [19,20,21]. Stresses of over 100 MPa were generated in Ni45Co5Mn36.7In13.3 on the field of 7 T. 3 % deformation, and full recovery of the original shape was discovered as a result of magnetic field-induced strains [1]. After sintering at 873 K, Ni45Mn36.6In13.4Co5 showed an almost perfect shape memory effect in which martensitic transformation played the dominant role, since the shape recovery was as high as 11.4% [22]. With such excellent magnetocaloric and shape memory properties, they can extensively serve society. However, large thermal transformation hysteresis, needing a high-driving magnetic field and poor mechanical properties, severely hinders their commercialization [10,23,24]. Phase diagrams are important for designing and preparing of Ni-Co-Mn-In alloys with potentially excellent properties. In addition, they enable the exploration of new functional materials. Only the phase diagrams of the Ni-Mn-In and Ni-Co-Mn ternary systems among the four sub-ternary systems of the Ni-Co-Mn-In quaternary system have been studied [25,26,27,28], while the phase diagrams of the other systems are not available in literature. At the same time, investigation on the magnetic properties of the compounds in these three ternary systems also plays a significant role in exploring new potential magnetic materials, such as refrigeration materials. This paper will focus on one of the four sub-ternary systems of the Ni-Co-Mn-In quaternary system, the Co-Ni-In system, and the magnetic properties of its compounds.
The phase diagrams of the binary systems Co-Ni, Co-In, and Ni-In related to the Ni-Co-In ternary system have been studied [29,30,31]. According to the Co-Ni binary phase diagram, there is no intermediate phase in this system. Co and Ni form an infinite solid solution that exists in the form of α-(CoNi) (space group: Fm 3 ¯ m) above 695 K. Below 695 K, the alloys are in a ε-(CoNi) hexagonal phase (Space group P63/mm) at a low nickel content range. With the increase in Ni content, the ε-Co α-Co transformation occurs. Two binary compounds, CoIn2 and CoIn3, exist in the Co-In binary system, and the compounds are formed by peritectic reactions of α-Co + L CoIn2 (823 K) and CoIn2 + L CoIn3 (763 K), respectively. The binary system undergoes a monotectic reaction at 1559 K. The composition of the monotectic is about 77 at.% In.
There are seven binary compounds, i.e., Ni3In, Ni2In, ζ, Ni13In9, NiIn, δ, Ni2In3, and Ni3In7 in the Ni-In binary system according to Ref. [31]. Intermetallic compounds of Ni3In, Ni2In, NiIn, Ni2In3, and Ni3In7 are stoichiometrically determined. The ζ phase is stable from 755 to 1223 K with a maximum range from 31.2 to 40.5 at.% In, and the compound Ni13In9 has a composition range of 38.0–41.0 at.% In, and the compound Ni13In9 have a composition range of 38.0–41.0 at.% In. Additionally, the δ phase forming at higher temperature is stable in the temperature range of 1043–1203 K and has a composition range of 52–58.2 at.% In. The solid solubility of In in Ni increases with temperature, which increases from 3.3 to 13.4 at.% In when temperature increases from 693 to 1181 K. No solubility of Ni in In has been reported. A ternary compound, Ni2CoIn, was investigated theoretically by first principles in [32], showing that the compound crystallized in a cubic structure with a space group of Fm 3 ¯ m and lattice parameter a = 0. 5944 nm. The Ni atom occupies the 8c (0.25, 0.25, 0.25) site, Co occupies the 4b (0.5, 0.5, 0.5) site, and the In atom occupies the 4a (0, 0, 0) site. Calculation of formation energy indicates the instability of the austenitic structure in Ni2CoIn and a strong tendency of martensitic transformation. Table 1 shows the crystallographic data of the compounds in the Co-Ni-In system.

2. Experimental

All samples with a mass of 2 g were prepared in an electric arc furnace under argon atmosphere. The purities of initial metals Co, Ni, and In were 99.9 wt. %, 99.99 wt. % and 99.9 wt. %, respectively. The material source is General Research Institute for Nonferrous Metals (Beijing, China). A proper amount of In was added to each samples due to the loss of In. Titanium was used as the oxygen scavenger during the melting process. The samples were melted three times for the purpose of homogeneity of the alloy samples. All the as-cast samples were sealed in evacuated quartz tubes to anneal at higher temperature for further homogenization. The In-rich (> 50 at.% In) alloys were kept at 923 K/673 K for 30 days, while the other alloys homogenized at 1073 K for 20 days. After homogenization annealing, the samples used for the 873 K section were cooled down to 873 K with a cooling rate of 50 K/day and maintained at 873 K for 20 days to reach equilibrium, while those used for the 673 K section were cooled down to 673 K and maintained at 673 K for 20 days. Finally, all the samples were quenched into ice-water mixture.
The X-ray powder diffraction (XRD) data of the Co-Ni-In alloy samples were obtained by using a Rigaku D/max 2500 V powder diffractometer (Cu Kα1 radiation, λ = 1.54060 Å; Tokyo, Japan). The powder XRD data for phase analysis were collected in a continuous scanning mode, and those for Rietveld refinement were collected in a step scanned mode with a step size of 0.02°. The high temperature XRD data were collected by using a Bruker D8 advance diffractometer. The Rietveld refinements for some selected samples were carried out by using FullProf programs [34,35]. Scanning electron microscopy (SEM, Hitachi S-3400N or SU8000; Tokyo, Japan) and optical microscopy (Axio Imager A2m, Zeiss, Jena, Germany) were used for microstructure analysis, and energy dispersive analysis (EDS) was applied for the measurements of sample chemical and phase compositions. The samples used for SEM/EDS measurements were corroded with clear water. Magnetic measurements were carried out in the Physical Property Measurement System (PPMS, Quantum Design; San Diego, CA, USA).

3. Results and Discussion

The phase analysis was performed on all the XRD data of the equilibrated Co-Ni-In samples with the aid of the Powder Diffraction File 2 (PDF2) database released by International Center for Diffraction Data (ICDD). The diffraction patterns of those compounds absent in the PDF2 database were calculated from the crystallographic data available in references. By carrying out the phase identification on the XRD patterns of each Co-Ni-In sample, the phase components of each sample were obtained. The selected samples were further observed by SEM/EDS and optical microscopy for phase identification and composition measurements.

3.1. Phase Analysis

3.1.1. Phase Analysis at 673 K

Table S1 shows the XRD and SEM/EDS analysis results of the selected Co-Ni-In samples at 673 K. The analysis on the XRD patterns of all the binary and ternary Co-Ni-In samples shows eight binary compounds, i.e., Ni3In, Ni2In, Ni13In9, NiIn, Ni2In3, Ni3In7, CoIn3, and CoIn2, existing at 673 K. The binary compounds Ni4In and Ni13In7 were not observed in our experimental conditions. This is in good agreement with the Co-Ni, Co-In, and In-Ni binary phase diagrams. The Backscattered electrons (BSE) micrographs of the alloys No. 1 (Co10Ni75In15) and No. 2 (Co4Ni34In62) are shown in Figure 1a,b. Both alloys contain two phases. EDS analysis on alloy No. 24 (Co10Ni75In15) in Figure 1a revealed that the dark gray phase with composition of Co35.53(5)Ni62.15(4)In2.31(4) was identified as α-Ni Cox (x = 0.355), and the gray phase with composition of Co1.02(4)Ni72.26(5)In26.72(5) was Ni3In. In Figure 1b, for the sample No. 25 (Co4Ni34In62), the dark gray phase with composition of Co 2.36(4)Ni59.12(3)In38.52(5) was verified to be Ni2 – xCoxIn3 (x = 0.118), and the gray phase with composition of Co0.86(6)Ni32.43(5)In66.72(6) was Ni3In7. These results proved the existence of Ni3In, Ni2In3, and Ni3In7 at 673 K, which is in agreement with the literature [26,31].
In order to verify the existence of the ternary compound Ni2CoIn, which was investigated by using the first principle calculation as described by Bai et al. [35], a series of samples with compositions near Ni2CoIn was prepared. Figure 2 presents the XRD patterns of sample No. 3 (Co25Ni50In25), No. 4 (Co22Ni52In26), and No. 5 (Co27Ni48In25), and none of the XRD data of these samples correspond to the diffraction pattern calculated from the crystallographic data of Ni2CoIn as shown in the literature [35]. The XRD analysis on all of these alloys showed that these alloys contained the three phases of Ni13 − xCoxIn9 (x = 0.702), Ni1−xCoxIn (x = 0.125), and α-Ni1−xCox (x = 0.400) pointing to the absence of Ni2CoIn at 673 K. Figure 3a,b show the SEM micrographs of samples No. 5 and No. 6, respectively, as well as the composition of each phase obtained by EDS. The results also indicated that these two alloys contained the three phases of Ni13 − xCoxIn9 (x = 0.702), Ni1−xCoxIn (x = 0.125) and α-Ni1−xCox (x = 0.4), which proved the non-existence of Ni2CoIn at 673 K.

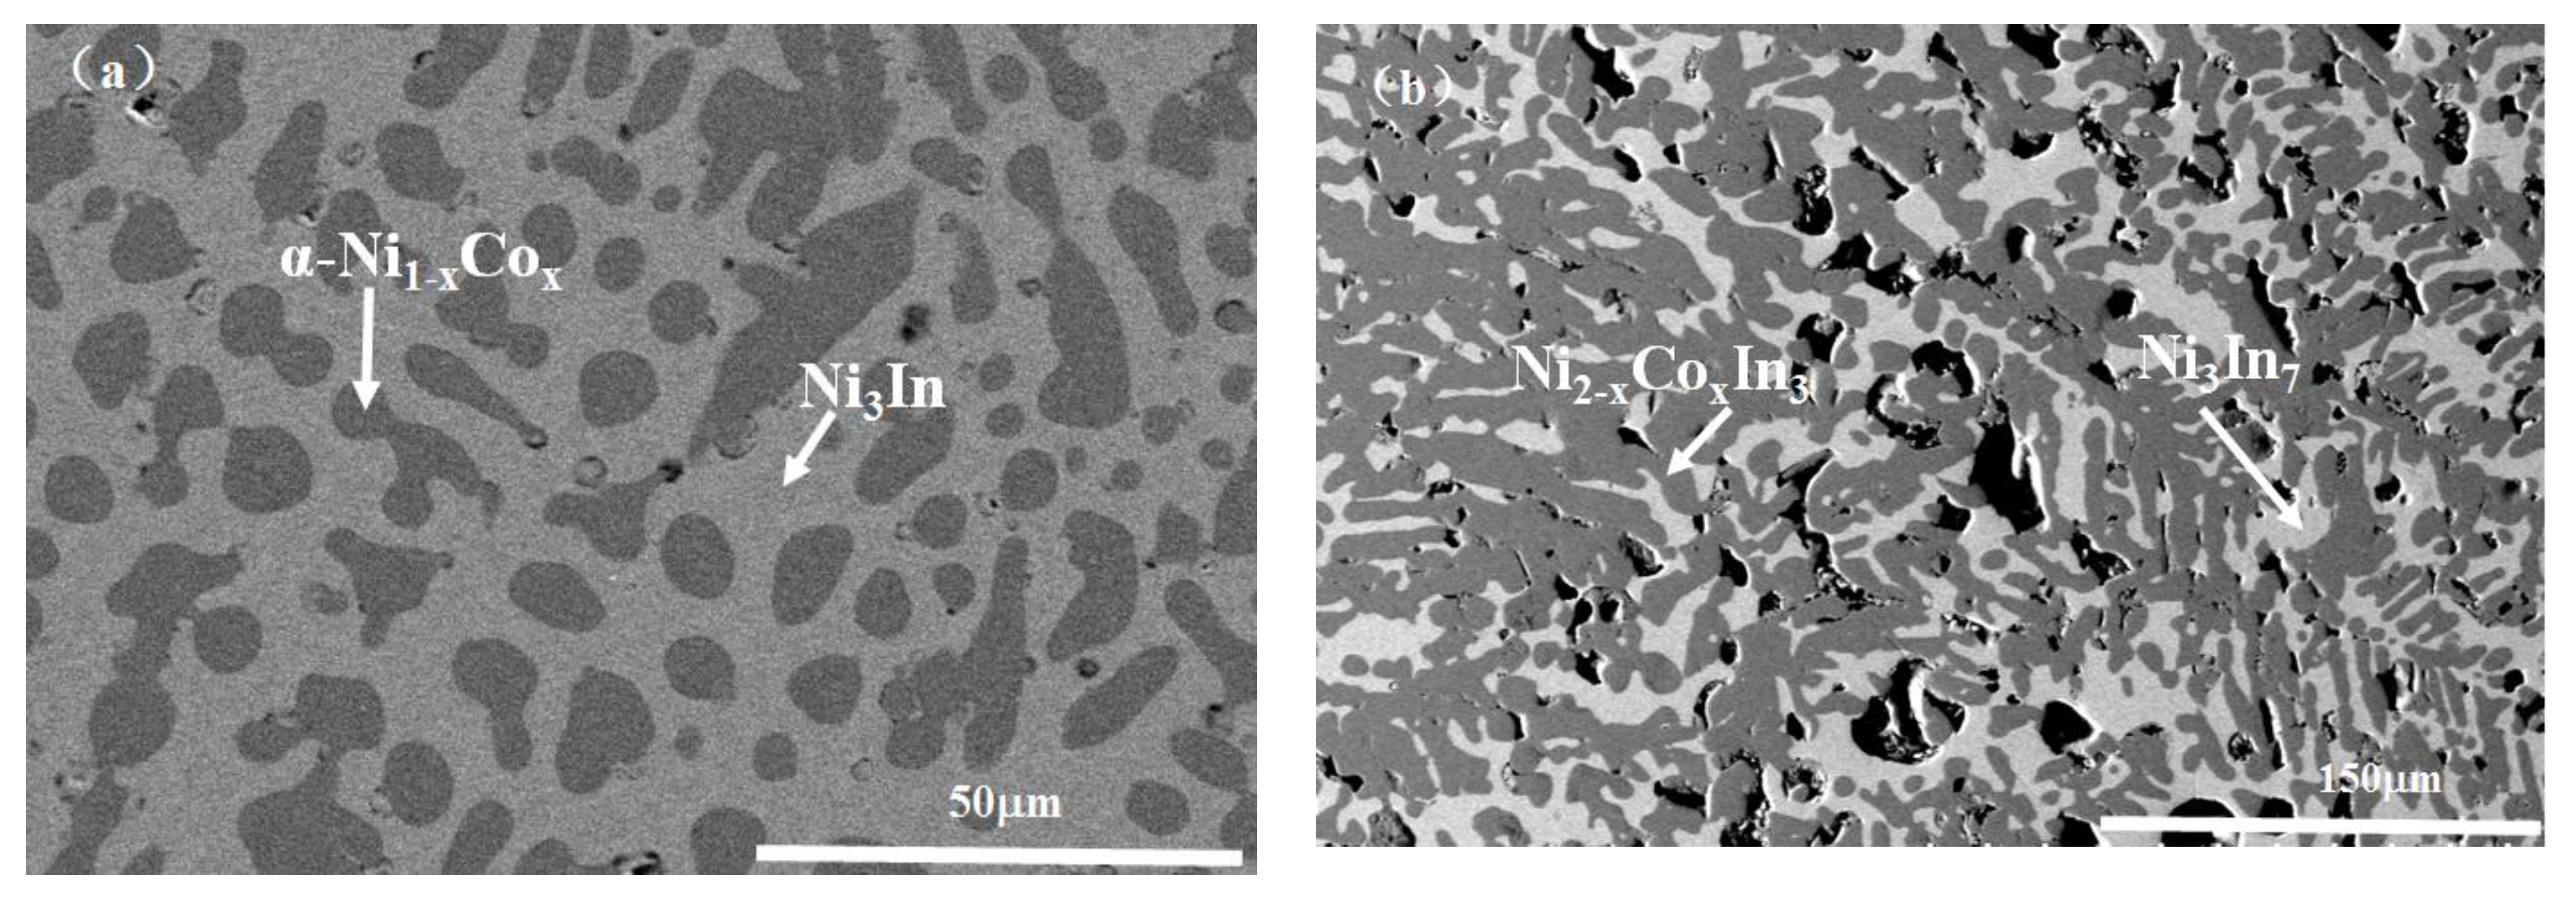
3.1.2. Phase Analysis at 873 K

Table S2 gives the XRD and SEM/EDS analysis results of the selected Co-Ni-In samples at 873 K. The analysis on the XRD patterns of all the binary and ternary Co-Ni-In samples shows that six binary compounds, i.e., Ni3In, Ni2In, Ni13In9, ξ, NiIn, and Co1−xNixIn2, exist at 873 K.
According to [12], a peritectic reaction L + (α) Co → CoIn2 occurs at 823 K, and the compound CoIn2 does not exist at 873 K. However, in the present work, a solid solution Co1−xNixIn2 was found at 873 K. The solid solution of Co1−xNixIn2 crystallized in the same crystal structure as that of CoIn2. Figure 4a,b show the XRD pattern and SEM micrograph of alloy No. 26 (Co28Ni24In48). The XRD analysis result revealed that the alloy contained the three phases of Co1−xNixIn2 (x = 0.612), Ni2−xCoxIn3 (x = 0.450), and α-Co1−xNix (x = 0.200), as seen in Figure 4a. The composition measurement showed that the grey phase with composition of Co8.69(5)Ni32.99(4)In58.32(4), the light gray phase with composition of Co20.10(5)Ni16.82(6)In63.08(5), and the dark phase with composition of Co82.21(5)Ni17.16(6)In0.63(5) were identified to be the three phases of Ni2−xCoxIn3 (x = 0.160), Co1−xNixIn2 (x = 0.612), and α-Co1−xNix (x = 0.200), respectively, as seen in Figure 4b. Figure 5 shows the XRD pattern of alloy No. 27 (Co26Ni6In68). The XRD pattern in Figure 5 clearly indicates that the alloy contained the two phases of Co1−xNixIn2 and In, which confirmed Co1−xNixIn2 existed at 873 K once again. This suggests that the addition of Ni into CoIn2 stabilized the compound and raised the temperature of the peritectic reaction L + (α) Co → Co1−xNixIn2.
The XRD pattern and SEM micrograph of alloy No. 28 (Co8Ni22In70) are shown in Figure 6a,b, respectively. The XRD analysis of the alloy indicated that the three phases of Co1 – xNixIn2 (x = 0.612), Ni2 – xCoxIn3 (x = 0.450) and In (Liquid) coexisted in the alloy, and no diffraction patterns of Ni3In7 and/or CoIn3 were observed. The SEM/EDS analysis on alloy No.28 also gave the same results. This indicates that Ni3In7 and CoIn3 do not exist at 873 K. Figure 7 shows the SEM micrograph of No. 29 (Co18Ni52In30) alloy. It is clearly seen that the alloy is composed of three phases. EDS measurements showed that the gray phase with composition of Co10.91(5)Ni46.53(4)In42.56(4) was identified as Ni13 − xCoxIn9 (x = 2.634), the dark gray phase with composition of Co5.94(6)Ni55.83(5)In38.28(5) was verified to be ξ, and the dark phase with composition of Co48.69(4)Ni49.12(4)In2.19(3) was α-Ni1−xCox (x = 0.500). This result suggests that the ξ phase existed at 873 K, which is similar to Schmetterer’s investigation [36].
Compared to the phases at 673 K, the binary compounds, i.e., Ni3In, Ni2In, Ni13In9, NiIn, Ni2In3, and ξ, exist at 873 K, while the binary compounds Ni3In7, CoIn3, and CoIn2 disappeared at 873 K. Although CoIn2 does not exist at 873 K, the ternary solid solution Co1−xNixIn2 exists at both of 673 K and 873 K with different composition ranges. No new binary and ternary compounds were found at 673 K and 873 K.

3.2. Solid Solubility

The solid solubilities of Co In Ni2In, NiIn, N13In9, Ni2In3, and Ni, as well as Ni in CoIn2 and Co at 673 K and 873 K were determined by XRD using the phase-disappearing and lattice parameter method combined with the SEM (EDS). The rough maximum solid solubility of above compounds was estimated by comparing the movement of the diffraction patterns of the single phases to the disappearance of the phases. A few series samples such as Ni1−xCoxIn and Co1−xNixIn2 were prepared for the purpose of the solid solubility determination in the Co-Ni-In ternary system. The computer software Jade 5.0 was used to calculate and refine the lattice parameters of the samples Ni1−xCoxIn and Co1−xNixIn2 from the XRD patterns.

3.2.1. Solid Solubility at 673 K

Figure 8 presents the XRD patterns of the samples Ni1−xCoxIn (x = 0.04, 0.08, 0.12, 0.14) at 673 K. It can be clearly seen that these samples (except that of x = 0.14) contained the single phase of Ni1−xCoxIn, pointing to the maximum solid solubility of Co in NiIn being between x = 0.12 and x = 0.14. Figure 9a,b show the variation in the lattice parameter a and the lattice parameter c of Ni1−xCoxIn with the content of Co, which were calculated from the XRD patterns by Jade 5.0. It can be seen from Figure 9a,b that the maximum solid solubility of Co in Ni1−xCoxIn is x = 0.125 (6.25 at.% Co). Further analysis on the sample Ni1−xCoxIn (x = 0.14) by the SEM (EDS) also showed that the alloy contains the three phases of Ni1−xCoxIn (x = 0.125), Ni2−xCoxIn3 (x = 0.400), and ε-Co1−xNix (x = 0.280), as seen in Figure 10, which is felt in a three-phase region. The composition measurement shows that the dark grey phase with composition of Co5.75(5)Ni45.02(6)In49.23(6) is Ni1−xCoxIn (x = 0.125), the grey phase with composition of Co7.82(4)Ni33.11(5)In58.07(5) is Ni2−xCoxIn3 (x = 0.400) and the dark phase with composition of Co72.81(7)Ni26.18(6)In1.01(5) is ε-Co1−xNix (x = 0.280). This caused the maximum solid solubility of Co in Ni1−xCoxIn to be 5.82 at.% Co at 673 K, and this value is similar to that obtained by the lattice parameter method, i.e., x = 0.125 (6.25 at.% Co). This further supports that the maximum solid solubility of Co in Ni1−xCoxIn is 6.25 at.% Co at 673 K.
Similarly, the maximum solid solubilities of Ni in Co1−xNixIn2 and ε-Co1−xNix were determined to be 18.64 and 28 at.% Ni at 673 K, respectively. The maximum solid solubilities of Co in Ni2−xCoxIn, Ni13 − xCoxIn9, Ni2−xCoxIn3, and α-Ni1−xCox were about 3, 3.2, 8, and 60 at.% Co at 673 K.

3.2.2. Solid Solubility at 873 K

Figure 11a,b show the variation of the lattice parameter a and the lattice parameter c of Co1−xNixIn2 with the content of Ni, which indicated that the maximum solid solubility of Ni in Co1−xNixIn2 is x = 0.612 (about 20.19 at.% Co). The SEM micrograph of No. 26 is given in Figure 4b. The composition measurement of the light grey phase with composition of Co20.10(5)Ni16.82(5)In63.08(5), which was Co1−xNixIn2 (x = 0.612), suggested that the maximum solid solubility of Co in Co1−xNixIn2 was 20.1 at.% Co at 873 K. These two values are close. Although the binary CoIn2 is absent at 873 K, the addition of Ni in CoIn2 stabilized the compounds and kept the solid solution Co1−xNixIn2 with a wide range appeared at 873 K. The solid solubility range of Co1−xNixIn2 is 3-20.1 at.% Co at 873 K.
The SEM micrograph of alloy No. 30 (Co25Ni45In35) in Figure 12 clearly shows that the alloy contains three phases. Further composition measurements indicated that the grey phase with composition of Co7.43(5)Ni43.56(6)In49.01(6) was confirmed as Ni1−xCoxIn (x = 0.160), the light grey phase with composition of Co12.03(6)Ni47.28(7)In40.69(6) was verified to be Ni13 − xCoxIn9 (x = 2.634) and the dark phase with composition of Co61.21(5)Ni37.51(5)In1.28(5) was α-Ni1−xCox (x = 0.600). This further suggests that the maximum solid solubility of Co in Ni13 − xCoxIn9 is about 12.03 at. % Co at 873 K.
Similarly, the maximum solid solubilities of Co In Ni2−xCoxIn, Ni13 − xCoxIn9, Ni1−xCoxIn, Ni2−xCoxIn3, and α-Ni1−xCox were found to be about 6, 12.03, 8, 9, and 60 at.% Co at 873 K, respectively. Both of the maximum solid solubilities of In in ε-Co1−xNix and α-Ni1−xCox were observed to be less than 3 at.% In.
Clearly, temperature has a great effect on the solid solubility of the third element in the binary compounds of the Co-Ni-In ternary system. Normally, the maximum solid solubilities of the third element increase with the increasing temperature. For example, the maximum solid solubilities of Co in Ni13 − xCoxIn9 increased from 3.2 at.% Co at 673 K to 12.03 at.% Co at 873 K. However, the solid solubility range of Co1−xNixIn2 was found to be 0–18.64% at. % Ni 673 K, while it shifted to the range of 3–20.1% at. % Ni at 873 K due to the absence of CoIn2 at 873 K.

3.3. Isothermal Sections of the Co-Ni-In Ternary System at 673 K and 873 K

By comparing and analyzing more than 33 alloy samples of the Co-Ni-In ternary system and identifying the phases presented in each sample by XRD, optical microscopy, and SEM/EDS, the isothermal sections of the phase diagrams of the Co-Ni-In ternary system at 673 K and 873 K were determined. As shown in Figure 13, the isothermal section at 673 K consists of 11 single-phase regions, 21 two-phase regions, and 9 three-phase regions. The typical alloys and the details of the three-phase regions of the isothermal section of the Co-Ni-In ternary system are given in Table 2.
As shown in Figure 14, the isothermal section at 873 K contains 8 single-phase regions, 16 two-phase regions, and 8 three-phase regions. The typical alloys and the details of the three-phase regions of the Co-Ni-In isothermal section at 873 K are presented in Table 3.
By comparing the isothermal sections at 673 K and 873 K of phase diagram of the Co-Ni-In ternary system, the differences between the two sections can be found. The three three-phase regions, i.e., Co1−xNixIn2 (x = 0.565) + Ni2−xCoxIn3 (x = 0.4) + Ni3In7, Co1−xNixIn2 (x = 0.565) + CoIn3 + Ni3In7 and CoIn3 + Ni3In7 + In (Liquid) disappear due to the absence of the binary compounds Ni3In7 and CoIn3 at 873 K [12,13], as seen Figure 4. The three-phase region Ni13 − xCoxIn9 (x = 0.702) + Ni1−xCoxIn2 (x = 0.091) + α-Ni1−xCox (x = 0.400) breaks into two three-phase regions, i.e., Ni2−xCoxIn (x = 0.181) + ξ + α-Ni1−xCox (x = 0.500), and ξ + Ni13 − xCoxIn9 (x = 2.634) + α-Ni1−xCox (x = 0.500) since the ξ phase exist from 746 K to 1223 K [13]. According to the Co-Ni binary phase diagram, the crystal structures of Co1−xNix alloys belong to the hexagonal structure when the concentration of Ni is less than 10 at.% Ni at 673 K, while its structure starts to change from a hexagonal structure into a cubic structure when Ni content exceed 10 at.% Ni. However, the Co1−xNix alloy only crystallizes in a cubic structure at 873 K. Therefore, the three-phase region Ni1−xCoxIn (x = 0.125) + α-Co1−xNix (x = 0.600) + ε-Co1−xNix (x = 0.280) at 673 K becomes a two-phase region, Ni1−xCoxIn (x = 0.160) + α-Ni1−xCox at 873 K. Although the binary compound Coln2 does not exist at 873 K, a narrow three-phase region, Co1−xNixIn2 (x = 0.091) + α-Co + In (Liquid), presents at 873 K due to the solid solution of Co1−xNixln2 (x = 0.091–0.612) appearing at 873 K.

3.4. Crystal Structure

3.4.1. Crystal Structure of Ni2−xCoxIn3 (x = 0.200)

The XRD and SEM/EDS data for the sample Ni2−xCoxIn3 (x = 0.200) were collected in order to investigate its crystal structure. The XRD phase analysis points out that this sample is a single phase without any detectable impurity or additional phases. The SEM/EDS testing result shows that the composition of the sample is Ni34.62(3)Co5.23(4)In60.15(3), which reveals that 5.23(4)at.% of Co replaces the Ni position in Ni2−xCoxIn3 (x = 0.200). To determine the crystal structures of the Ni2−xCoxIn3 (x = 0.200) alloy, Rietveld refinement was performed from the XRD data by using the FullProf program. The powder X-ray diffraction pattern for the Ni2−xCoxIn3 (x = 0.200) alloy is shown in Figure 15. The Rietveld refinement results of the alloys are listed in Table 4. The low values of the Rp and Rwp factors suggest that the fitted pattern is in good agreement with the experimental data and that the Rietveld refinement is reliable. The Rietveld refinement results support the case that the structure of sample remains unchanged at room temperature when cobalt is doped into the Ni2−xCoxIn3 (x = 0.200) compound, and Ni2−xCoxIn3 (x = 0.200) crystallizes in the Al2Ni3-type structure (space group P 3 ¯ m1). The lattice parameters are a = 0.43959(5) nm, c = 0.53121(1) nm, and Z = 1. All positions are fully occupied in the compound. The Wyckoff 1a (0, 0, 0) site and 2d (1/3, 2/3, 0.3534 (3)) site are all occupied by In atoms, while the 2d (1/3, 2/3, 0.1381 (2)) site is occupied by Co and Ni atoms (0.1Co + 0.9 Ni).

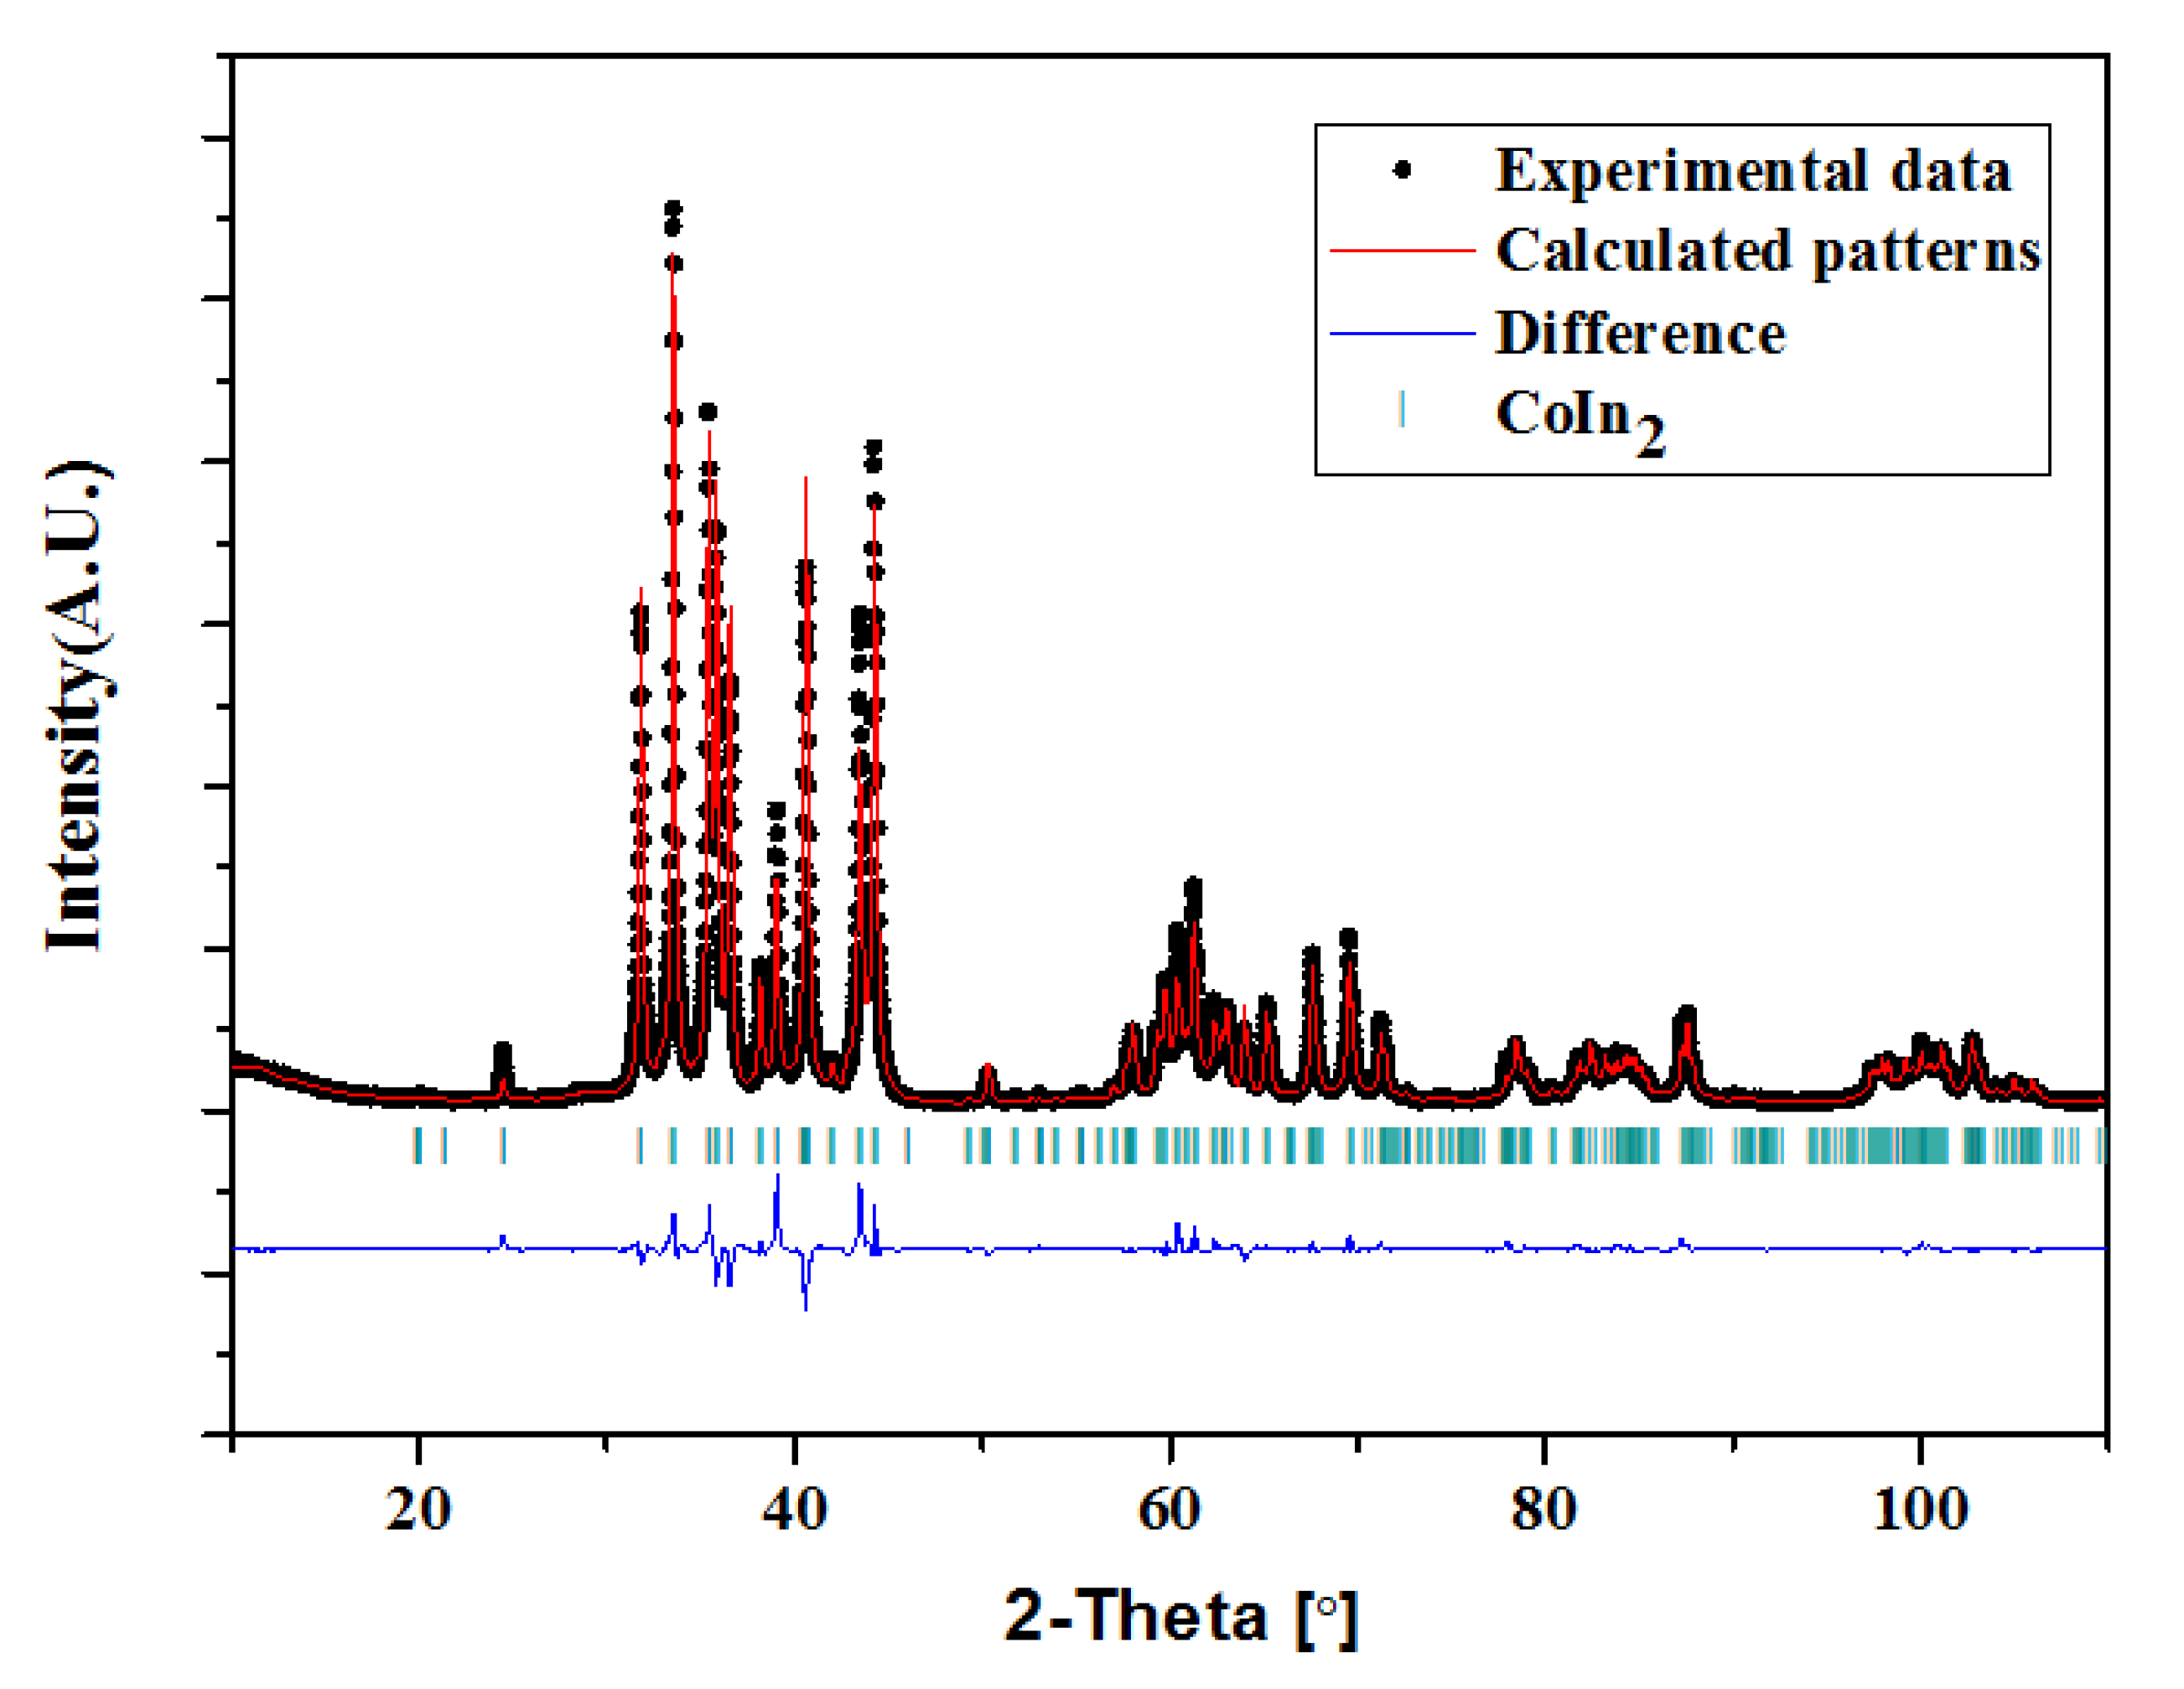
3.4.2. Crystal Structure of Co1−xNixIn2 (x = 0.540, 0.580)

A large difference in the melting points of Co, Ni, and In (Co:1768K, Ni:1726K, In:429K) [37,38] causes difficulty in obtaining good single-phase Co1−xNixIn2 samples. Thus, the crystal structure of Co1−xNixIn2 was investigated with a few selected good single-phase samples. The crystal structure of Co1−xNixIn2 (x = 0.540, 0.580) at 673 K was investigated via XRD and SEM/EDS. Figure 16 and Figure 17 present the XRD patterns of Co1−xNixIn2. Table 4 lists the Rietveld refinement results of Co1−xNixIn2. The lower values of Rp and Rwp for the Rietveld refinement indicate that the refinement results are credible. The SEM/EDS results show that the composition of Co1−xNixIn2 (x = 0.580) is Co16.97(4)Ni18.02 (5)In65.01(5); see Table S1. The refinement result shows that the Co1−xNixIn2 (x = 0.540) compound, in which a large number of Co atoms are replaced by Ni, remains in the single phase and maintains the Cu2Mg-type structure with the space group Fddd (No. 70). The lattice parameters of Co1−xNixIn2 (x = 0.540) are refined to be a = 0.9424(3) nm, b = 0.5288(4) nm, and c = 1.7742(5) nm. The Co1−xNixIn2 (x = 0.580) alloy contains the Co1−xNixIn2 (x = 0.565) (Cu2Mg-type structure) phase with a small amount of the Ni2−xCoxIn3 (x = 0.400) (Al3Ni2-type structure). The EDS results shows that the compositions of the Co1−xNixIn2 (x = 0.565) and Ni2−xCoxIn3 (x = 0.400) phases were about Co14.11(4)Ni18.64(3)In67.25(4) and Co7.41(3)Ni35.27(4)In57.3(4)2, which were identified as Co1−xNixIn2 (x = 0.565) and Ni2−xCoxIn3 (x = 0.400), respectively. This also proves that the solubility of Ni in Co1−xNixIn2 is 18.64 at.% Ni in the Ni2−xCoxIn3 (x = 0.400) alloy. The Rietveld refinement of the Co1−xNixIn2 (x = 0.580) alloy shows that the mass fractions of these two phases in the sample were 2.7% and 97.3 %, respectively. The Rietveld refinement also indicated that the amount of Ni in the phase of Co1−xNixIn2 was x = 0.565. This is in agreement with the results of solid solubility determination including the SEM/EDS measurements. The refined lattice parameters of Co1−xNixIn2 (x = 0.565) are a = 0. 9421(2) nm, b = 0.5282(3) nm, and c = 1.7739(3) nm, which are slightly smaller than those of Co1−xNixIn2 (x = 0.540). This phenomenon is mainly due to the similar crystal structure of Co and Ni, and the radius of Ni (RNi = 0.124 nm) atom is slightly smaller than that of Co (RCo = 0.125 nm). The replacement of Ni atoms for Co atoms causes the volume of Co1−xNixIn2 to shrink. This results in smaller sizes. The lattice parameters of Ni2−xCoxIn3 (x = 0.400) are refined to be a = 0.4397(1) nm and 0.5319(3) nm. In the structure of Co1−xNixIn2, the In atoms occupy the 16e and 16g sites, while Co atoms (including the substituting Ni atoms) exist at the 16g sites.

3.5. Magnetic Properties

3.5.1. Magnetic Properties of Ni2−xCoxIn3 (x = 0.200)

Figure 18 shows the zero-field-cooled (ZFC) and zero-field-heated (ZFH) temperature dependence of the magnetization under a static magnetic field of 50 mT for the Ni2−xCoxIn3 (x = 0.200) alloy. During the heating process, the magnetization of the alloy remains constant at 0.044 emµ/g in the range of 5–436 K, and then increases sharply at 436 K (THS) and rises to 1.05 emμ/g at 451 K (THF). After that, the magnetization increases slowly and reaches a maximum of 1.11 emμ/g at 482 K. When the temperature increases from 482 to 528 K, the magnetization slowly drops to 1.05 emµ/g. The magnetization drops rapidly to a minimum value of 0.046 emµ/g with a further temperature increase to 560 K. The cooling curve almost completely coincides with the heating one, except in the temperature range of 339–451 K. In the cooling curve, the magnetization starts to decrease at 446 K (TCS) and stops to decrease at 399 K (TCF). The temperature cooling curve shifts to the low-temperature direction, indicating that the sample has thermal hysteresis in this temperature range; Δ = 21 K (ΔThys= (THS + THF – TCS − TCF)/2). This is very similar to the martensitic transformation phenomenon occurring in the Ni-Mn-A (A = Ga, Sn, In) [39,40,41] systems. As can be seen from the inset of Figure 18, the differential of magnetization to temperature varies with temperature and shows that the Curie temperature of the compound is 550 K.
Magnetization isotherms, measured during heating cycles at different temperatures, are shown in Figure 19. The samples show ferromagnetism at all measuring temperatures. Clearly, the magnetization increases with the increase in temperature. The magnetization increases from 0.178 emμ/g to 3.84 emμ/g when temperature is heated from 430 K to 454 K under the 3 T magnetic field. The sample has weak magnetism at 600 K—the magnetization is only 0.147 at 3 T. Magnetic entropy change (ΔSM) in the system, due to the application of external magnetic field, can be determined from Maxwell’s relation (Equation (1)) by integrating the magnetization isotherms over the magnetic field.
Δ S M ( T , H max ) = S M ( T , H max ) S M ( T , 0 ) = 0 H max ( M H ) H dH
Magnetic entropy changes in the alloy have been derived from the isothermal magnetization curves. Figure 20 shows the magnetic entropy change in the Ni2−xCoxIn3 (x = 0.200) sample as a function of temperature near 445 K under the 3 T, 2 T, and 1 T magnetic fields. Clearly, the greater the magnetic entropy, the stronger the magnetic field. The peak value under a field change of 3 T is 1.25 J kg−1K−1 at T = 449.5 K. The relative cooling power (RCP = ΔSM × ΔTFWHM), which is the measure of the amount of heat transfer between the cold and hot reservoirs in an ideal refrigeration cycle, is evaluated to be 14.125 J kg−1K−1 in the vicinity of 430–454 K for 3 T magnetic field change, where ΔTFWHM = 11.3 K.

3.5.2. Magnetic Properties of Co1−xNixIn2 (x = 0.540)

Figure 21 shows the magnetization behavior of the Co1−xNixIn2 (x = 0.540) alloy during thermal cycling with a heating/cooling rate of 5 K/min at ZFC and ZFH. The tendency of magnetization changes with temperature of the Co1−xNixIn2 (x = 0.540) compound is very similar to that of Ni2−xCoxIn3 (x = 0.200). However, there are two hysteresis taking place in the Co1−xNixIn2 (x = 0.540) alloy. The ΔThys in low temperature is 8.5 K, which is smaller than Ni2 – xCoxIn3 (x = 0.200). As can be seen from the inset of Figure 21, due to the thermal hysteresis, two different Curie temperatures (544 K and 553 K) can be obtained from the heating curve and the cooling curve. Representative isothermal magnetization loops measured around 462.5 K for Co1 – xNixIn2 (x = 0.540) are presented in Figure 22. The sample shows a low magnetization below 459 K, which rises from 0.21 emµ/g to 4.46 emµ/g with a temperature increase from 453 K to 471 K at the magnetic field of 3T. Associated with this magnetostructural transition, a large magnetic entropy change occurs. Figure 23 shows the magnetic entropy change as a function of temperature under the 3 T, 2 T, and 1 T magnetic fields for the alloy. It is clearly seen that as the magnetic field increases, the magnetic entropy of the Co1−xNixIn2 (x = 0.540) compound becomes larger. Under a magnetic field of 3 T, the magnetic entropy of the alloy reaches a maximum of 1.475 J kg−1K−1at about 463.5 K. The corresponding half-maximum width is ΔTFWHM = 8.9 K for the compound. The direct RCP is evaluated as 13.128 J kg−1K−1.
Since the magnetization dependence of temperature (MT) curves of Ni2−xCoxIn3 (x = 0.200) and Co1−xNixIn2 (x = 0.540) are similar to those of ferromagnetic shape memory alloys with martensitic transformation, temperature-dependent powder XRD measurements were performed in order to obtain further insights into whether the compound undergoes martensite transformation behavior. Figure 24 shows the XRD patterns for the Ni2−xCoxIn3 (x = 0.200) alloy measured at 490 K. According to XRD patterns, the main phase of the alloy at 490 K still was a Ni2In3 phase with an Al2Ni3-type structure. Furthermore, a small amount of Ni10In27 (space group Im-3 m) and Ni2In (space group P63/mmc) appears in alloy. The results indicate that a small amount of Ni10In27 and Ni2In is generated during heating. Indexing of the Ni2In3 phase showed that a = 0.43905 (5) nm, c = 0.52930 (3) nm, and V = 0.08836 nm3. All these results show that a structure phase transformation but not a martensitic transformation occurred in Ni2−xCoxIn3 (x = 0.200) during heating. Figure 25 shows the XRD patterns of the Co1−xNixIn2 (x = 0.540) alloy at 490 K, which still retains the Cu2Mg-type structure type at 490 K. These results point to the notion that no martensitic transformation occurred in the Co1−xNixIn2 (x = 0.540) alloys during heating.

4. Conclusions

More than 130 samples were prepared and investigated by experimental methods to establish the phase equilibrium of the ternary Co-Ni-In system at 673 K and 873 K. The peculiar MT curves of Ni2−xCoxIn3 (x = 0.200) and Co1−xNixIn2 (x = 0.540) allow them to have potential to become magnetic functional materials.
1.
There are eight Co-Ni-In binary compounds existing at 673 K and six binary compounds existing at 873 K. Compared to the phases at 673 K, the binary compounds Ni3In7, CoIn3, and CoIn2 disappeared, and ξ exists at 873 K.
2.
The solid solubility range of Co1−xNixIn2 was found to be 0–18.64% at. % Ni at 673 K, while it shifted to the range of 3–20.1% at. % Ni at 873 K due to the absence of CoIn2 at 873 K.
3.
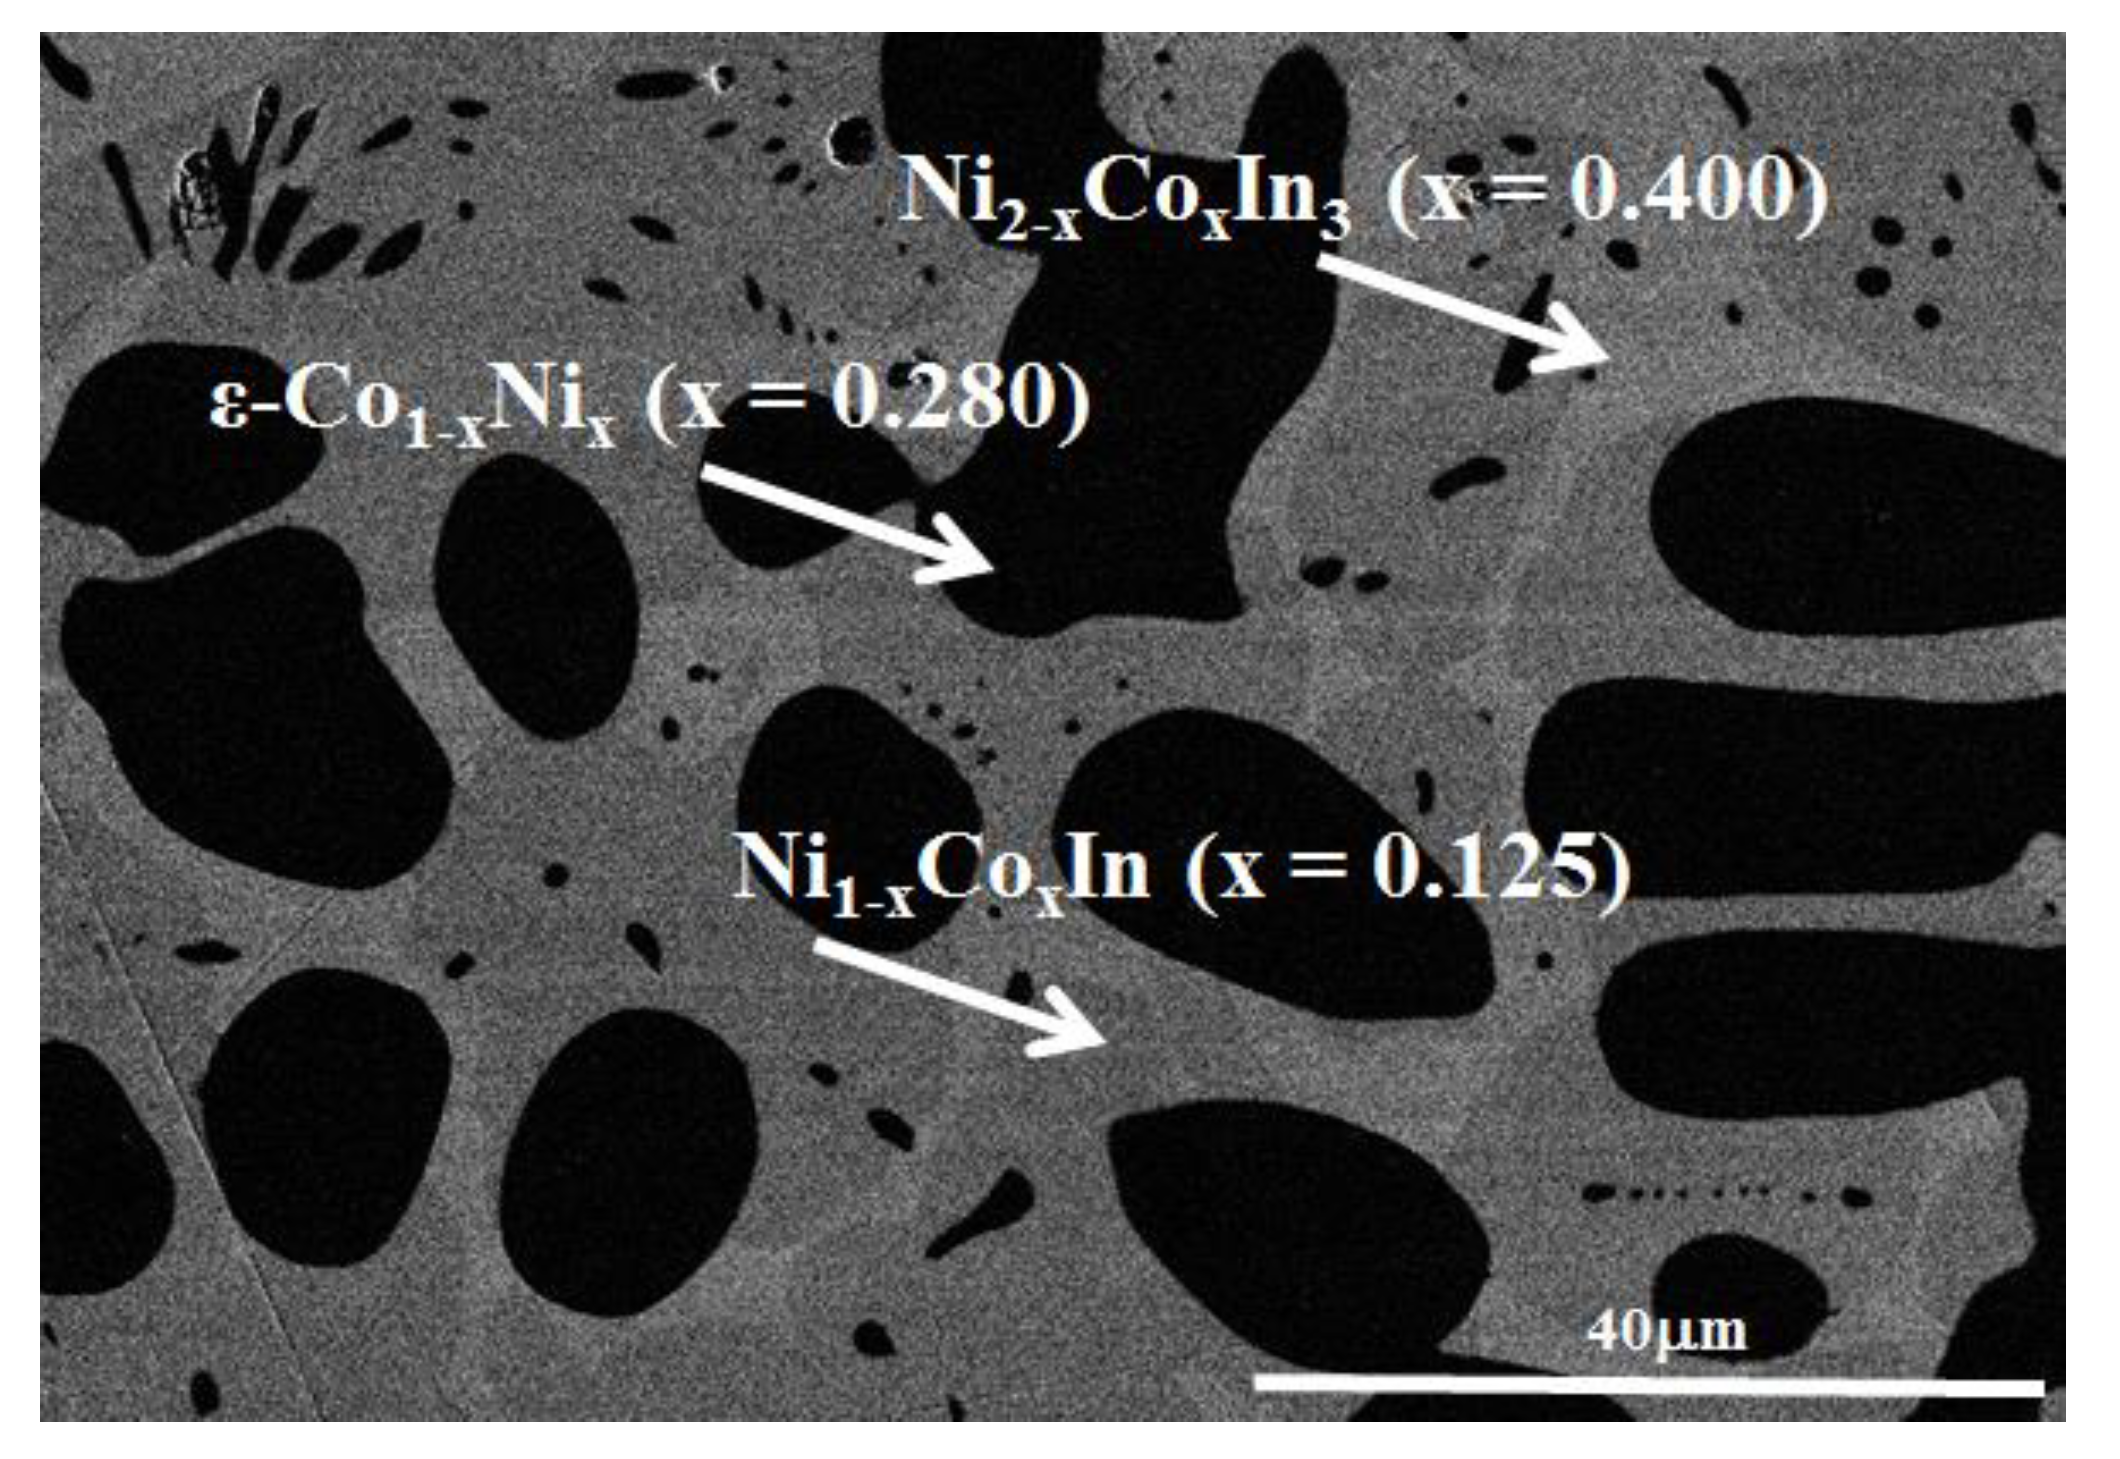
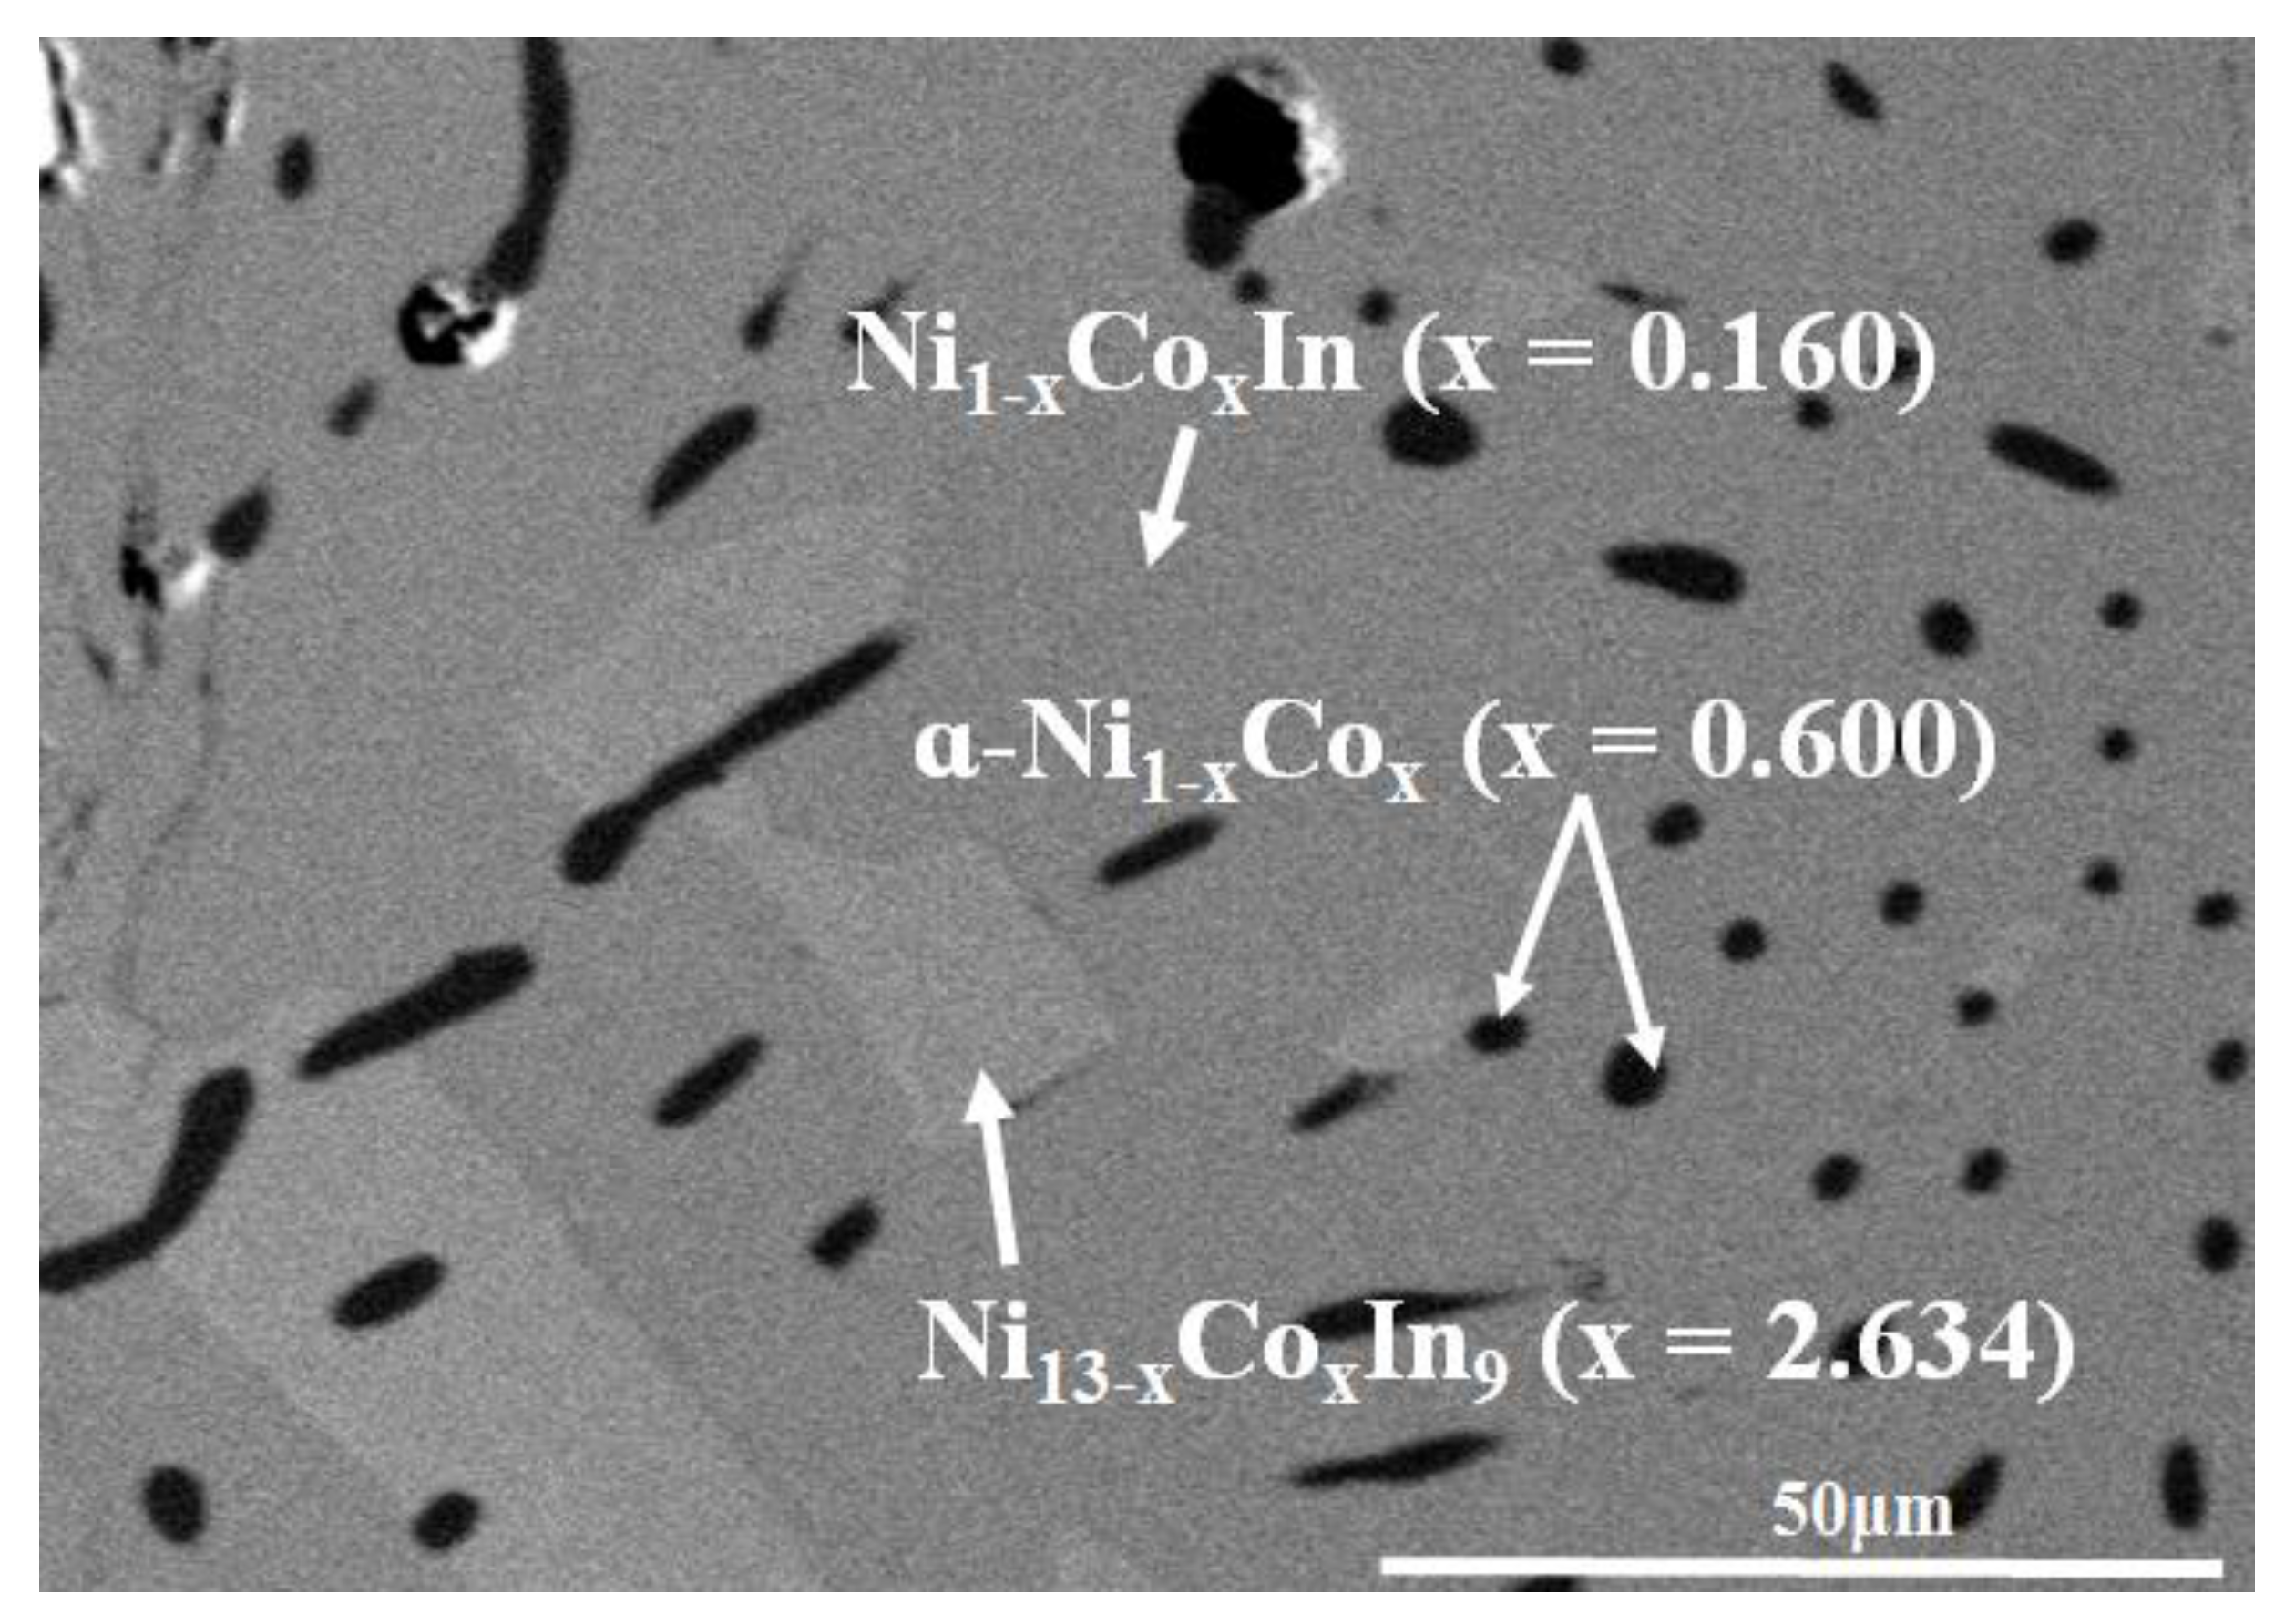
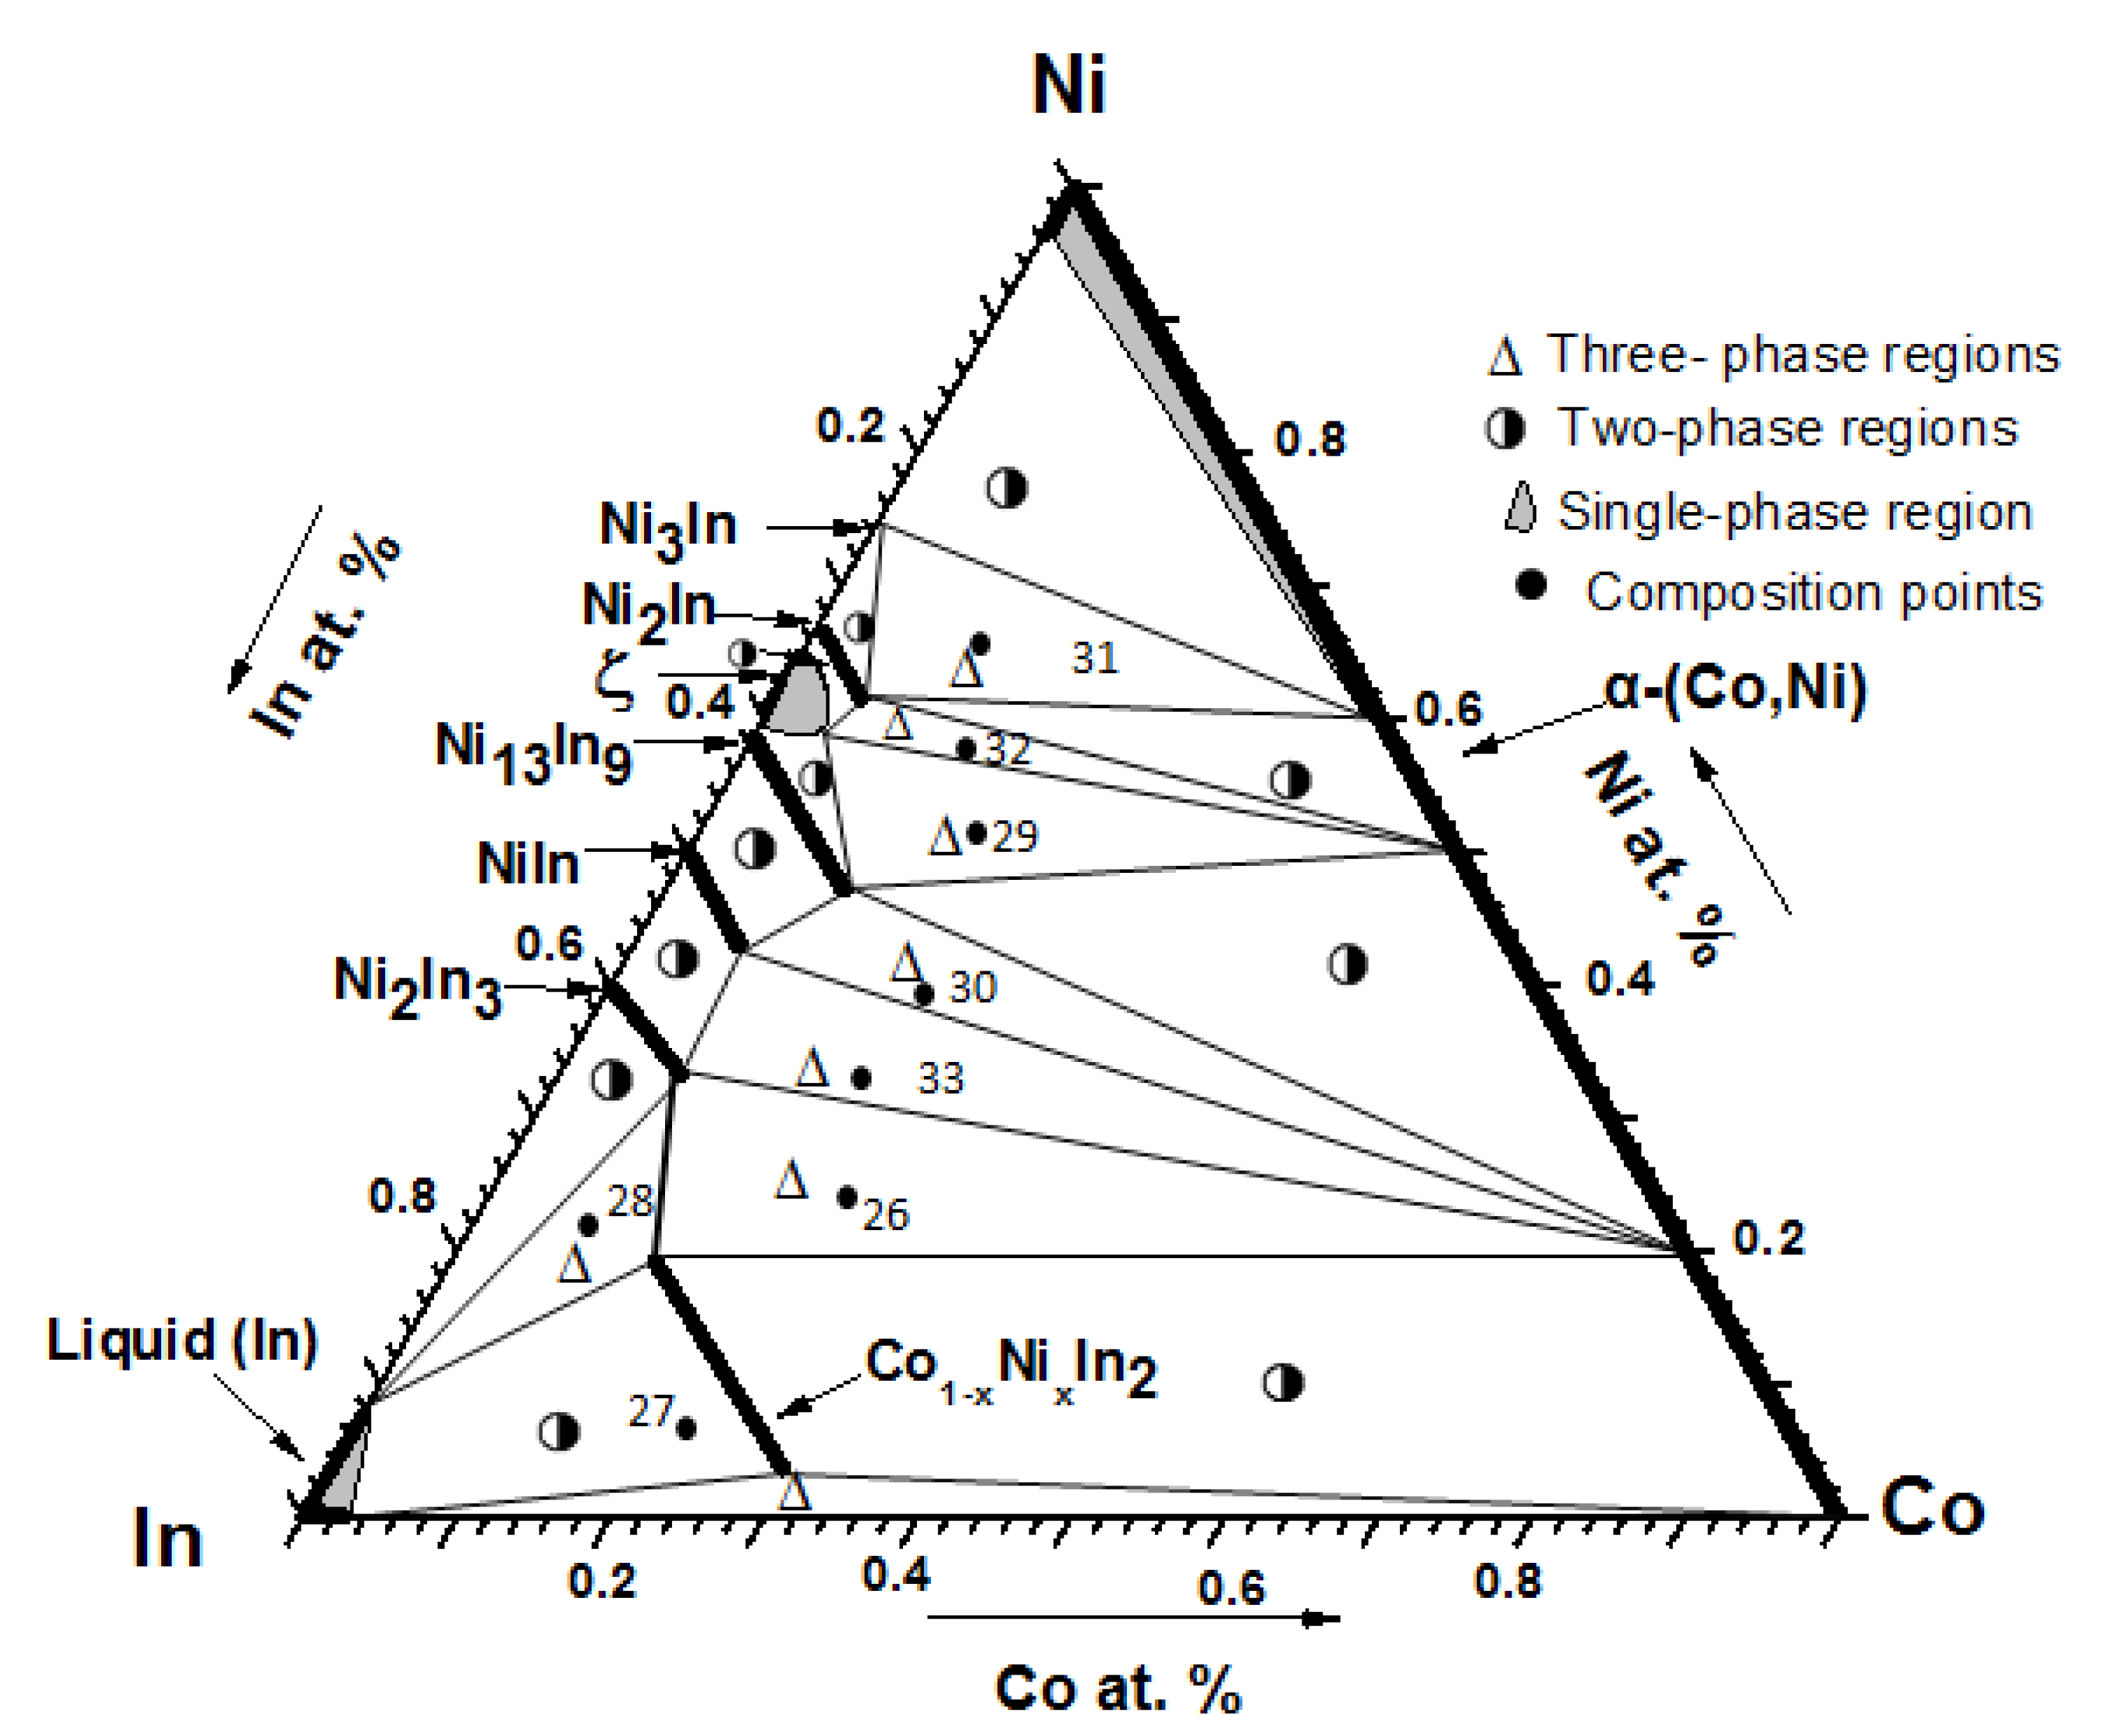
The isothermal section of the phase diagram of the Co-Ni-In system at 673 K consists of 11 single-phase regions, 21 two-phase regions, and 9 three-phase regions, and the isothermal section at 873 K contains 8 single-phase regions, 16 two-phase regions, and 8 three-phase regions. Three-phase regions disappear due to the absence of the binary compounds Ni3In7 and CoIn3 at 873 K. The three-phase region Ni13 − xCoxIn9 (x = 0.702) + Ni1−xCoxIn2 (x = 0.091) + α-Ni1−xCox (x = 0.400) breaks into two three-phase regions due to the ξ phase existing at 873 K.
4.
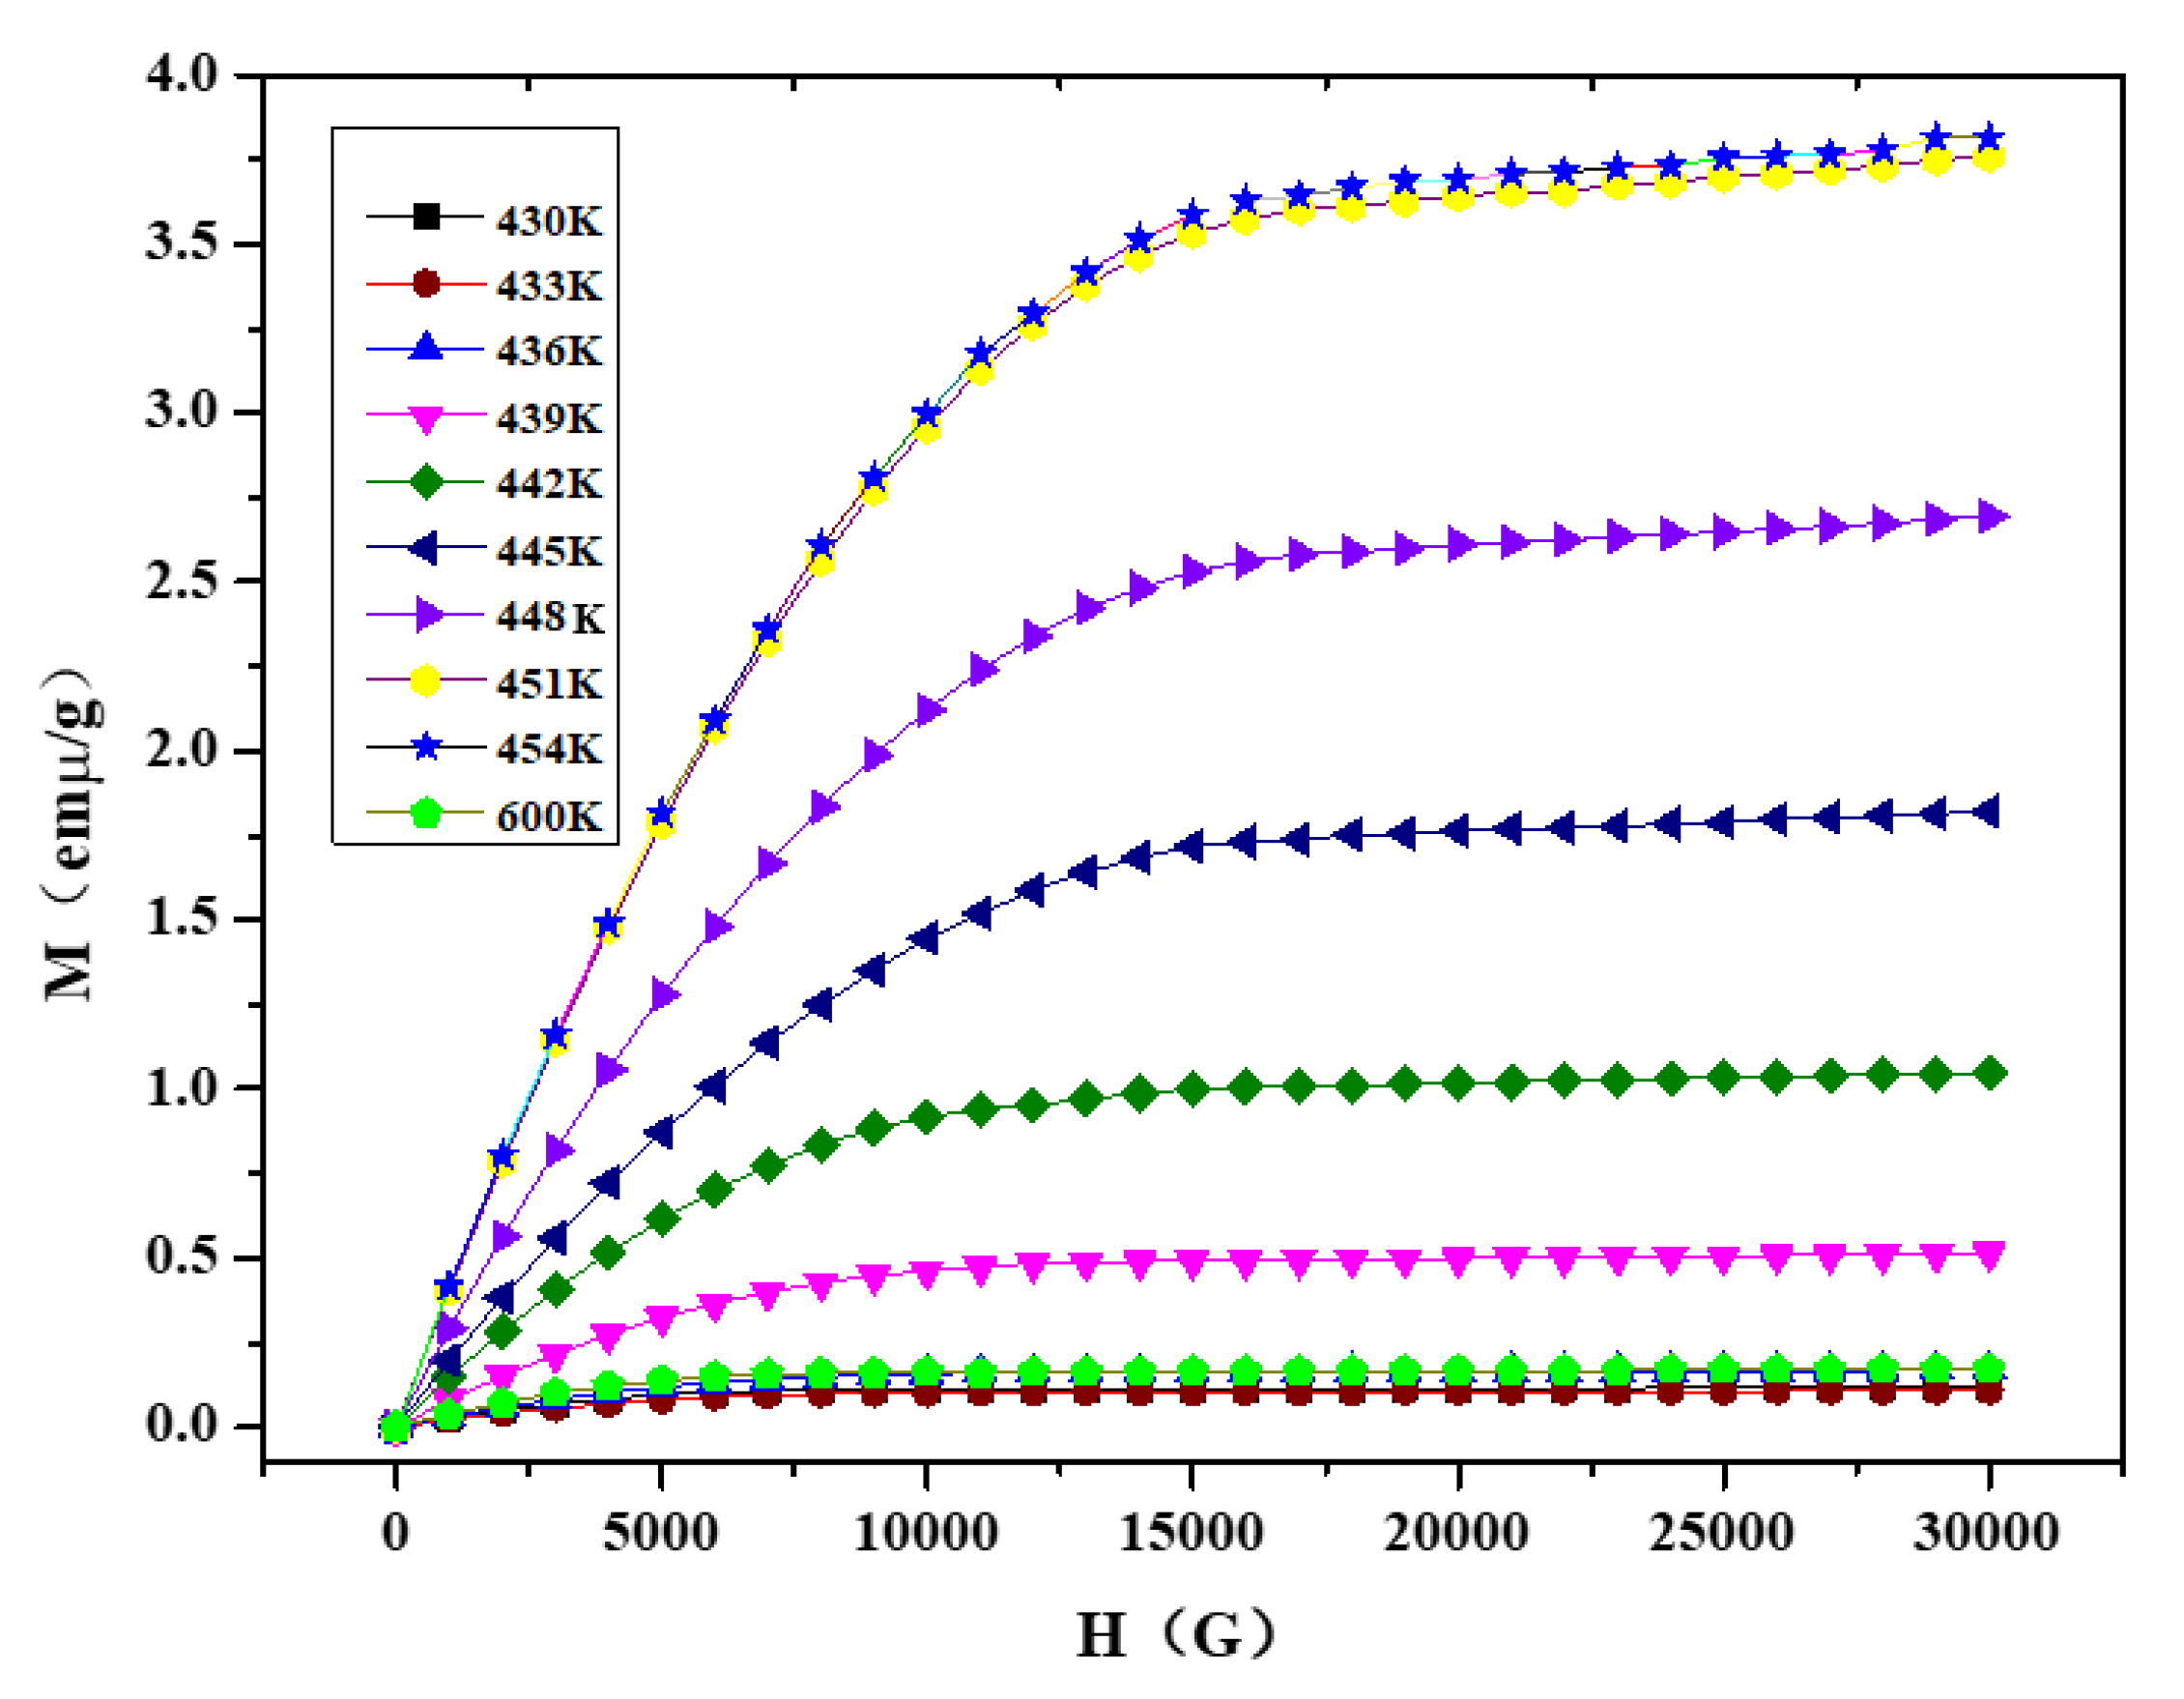
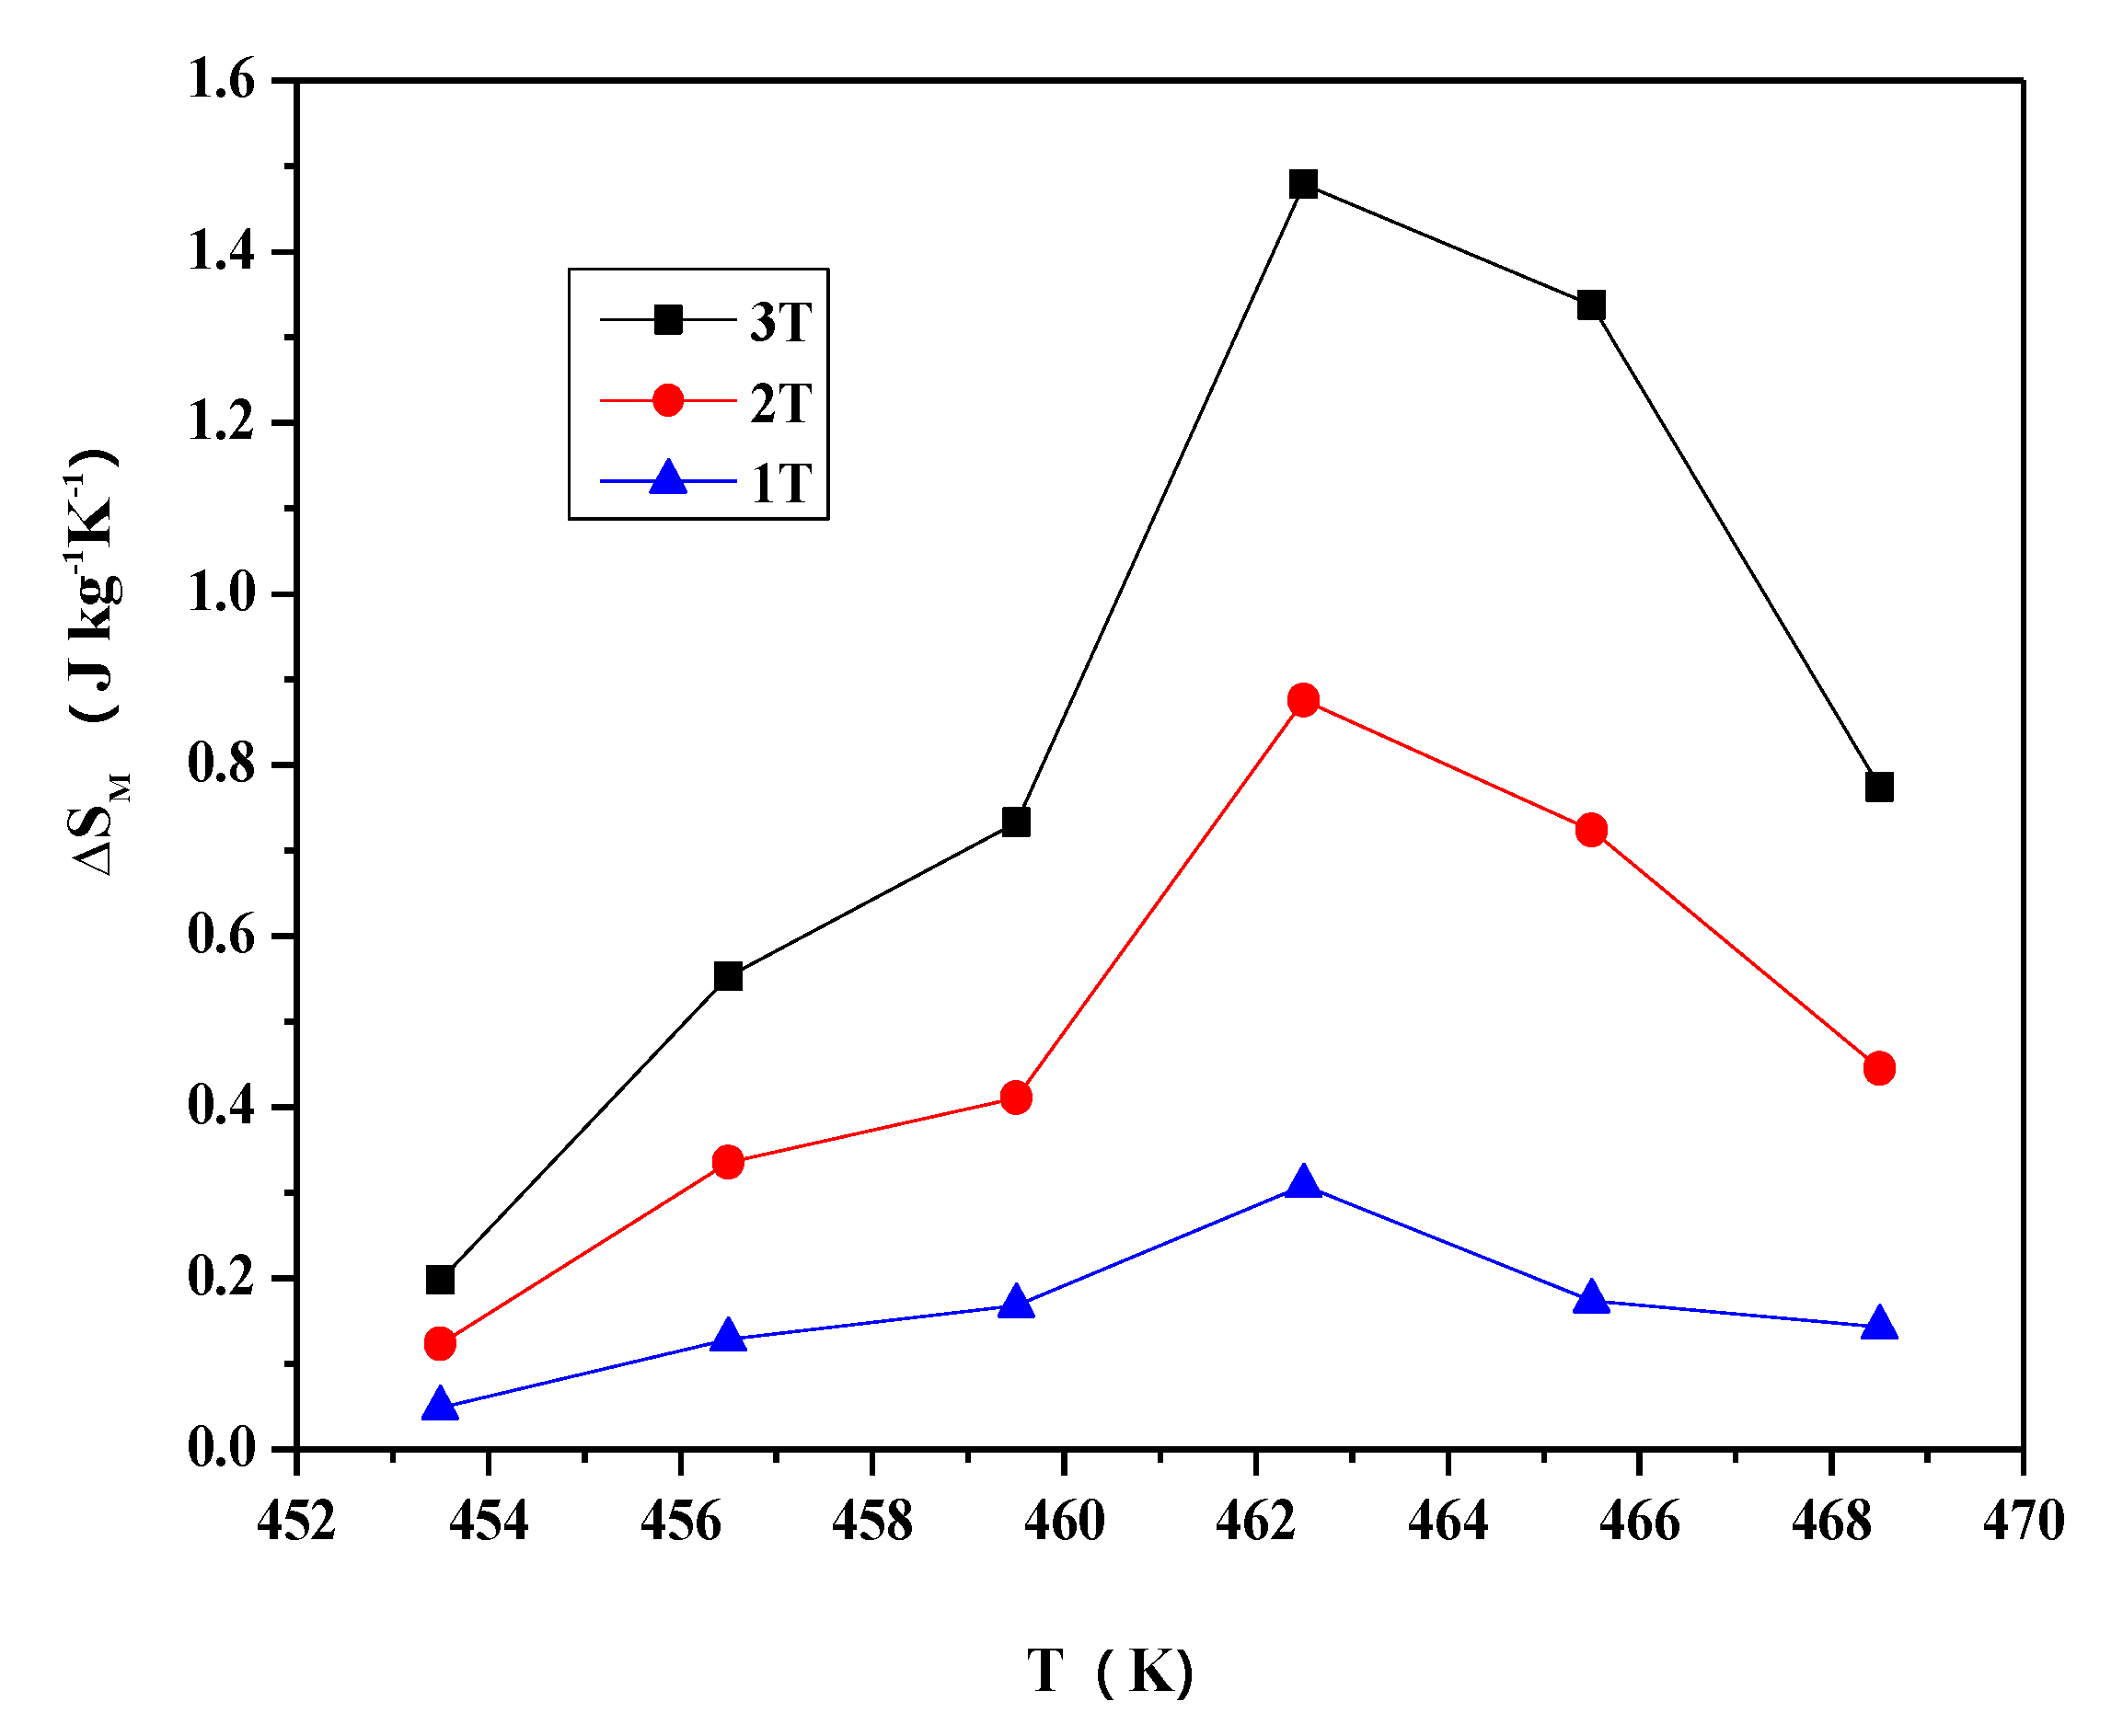
The MT curves of Ni2−xCoxIn3 (x = 0.200) and Co1−xNixIn2 (x = 0.540), which are similar to the Ni-Mn-A (A = Ga, Sn, In), do not undergo martensitic transformation at temperatures, which results in a sharp change in magnetization. The maximum magnetic entropy changes of Ni2−xCoxIn3 (x = 0.200) and Co1−xNixIn2 (x = 0.540) under 3T in 430 K–454 K and 454 K–472 K are 1.25 J kg−1K−1, 1.475 J kg−1K−1, respectively.

Supplementary Materials

The following are available online at https://www.mdpi.com/1996-1944/13/18/3990/s1, Table S1: XRD and SEM/EDS analysis results of the selected Co-Ni-In samples at 673 K; Table S2: XRD and SEM/EDS analysis results of the selected Co-Ni-In samples at 873 K.

Author Contributions

W.H.: project administration, investigation, writing—review and editing. T.Y.: investigation, writing, data curation. G.C.: investigation, Software. W.Z.: investigation, methodology. J.W.: investigation. L.Z.: formal analysis. J.L.: investigation, visualization. All authors have read and agreed to the published version of the manuscript.

Funding

This work was jointly supported by the National Natural Science Foundation of China (Nos. 51861003 & 51461004).

Conflicts of Interest

The authors declare no conflict of interest.

References

  1. Imano, Y.; Ito, W.; Sutou, Y.; Morito, H.; Okamoto, S.; Kitakami, O.; Oikawa, K.; Fujita, A.; Kanomata, T.; Ishida, K. Magnetic-field-induced shape recovery by reverse phase transformation. Nature 2006, 439, 957–960. [Google Scholar]
  2. Liu, J.; Gottschall, T.; Skokov, K.P.; James, D.M.; Oliver, G. Giant magnetocaloric effect driven by structural transitions. Nat. Mater. 2012, 11, 620–626. [Google Scholar] [CrossRef]
  3. Bonnot, E.; Romero, R.; Manosa, L.; Vives, E.; Planes, A. Elastocaloric effect associated with the martensitic transition in shape-memory alloys. Phys. Rev. Lett. 2008, 100, 125901. [Google Scholar] [CrossRef] [Green Version]
  4. Zhang, B.; Zhang, X.X.; Yu, S.Y.; Chen, J.L.; Cao, Z.X.; Wu, G.H. Giant magnetothermal conductivity in the Ni-Mn-In ferromagnetic shape memory alloys. Appl. Phys. Lett. 2007, 91, 012510. [Google Scholar] [CrossRef]
  5. Krenke, T.; Duman, E.; Acet, M.; Wassermann, E.F. Magnetic superelasticity and inverse magnetocaloric effect in Ni-Mn-In. Phys. Rev. B 2007, 75, 104414. [Google Scholar] [CrossRef] [Green Version]
  6. Mañosa, L.; González-Alonso, D.; Planes, A.; Bonnot, E.; Barrio, M.; Tamarit, J.; Aksoy, S.; Acet, M. Giant solid-state barocaloric effect in the Ni-Mn-In magnetic shape-memory alloy. Nat. Mater. 2010, 9, 478–481. [Google Scholar] [CrossRef] [Green Version]
  7. Wang, B.M.; Liu, Y.; Ren, P.; Xia, B.; Ruan, K.B.; Yi, J.B.; Ding, J.; Li, X.G.; Wang, L. Large Exchange Bias after Zero-Field Cooling from an Unmagnetized State. Phys. Rev. Lett. 2011, 106, 077203. [Google Scholar] [CrossRef]
  8. Ito, W.; Imano, Y.; Kainuma, R.; Sutou, Y.; Oikawa, K.; Ishida, K. Martensitic and Magnetic Transformation Behaviors in Heusler-Type NiMnIn and NiCoMnIn Metamagnetic Shape Memory Alloys. Metall. Mater. Trans. 2007, 38, 759–766. [Google Scholar] [CrossRef]
  9. Wu, Z.G.; Liu, Z.H.; Yang, H.; Liu, Y.N.; Wu, G.H. Metamagnetic phase transformation in Mn50Ni37In10Co3 polycrystalline alloy. Appl. Phys. Lett. 2011, 98, 061904. [Google Scholar] [CrossRef]
  10. Wu, Z.G.; Liu, Z.H.; Yang, H.; Liu, Y.N.; Wu, G.H. Effect of Co addition on martensitic phase transformation and magnetic properties of Mn50Ni40-xIn10Cox polycrystalline alloys. Intermetallics 2011, 19, 1839–1848. [Google Scholar] [CrossRef]
  11. He, X.J.; Wei, S.X.; Kang, Y.R.; Zhang, Y.L.; Cao, Y.M.; Xu, K.; Li, Z.; Jing, C. Enhanced barocaloric effect produced by hydrostatic pressure-induced martensitic transformation for Ni44.6Co5.5Mn35.5In14.4 Heusler alloy. Scr. Mater. 2018, 145, 58–61. [Google Scholar] [CrossRef]
  12. Zhang, X.X.; Qian, M.F.; Miao, S.P.; Su, R.Z.; Liu, Y.F.; Geng, L.; Sun, J.F. Enhanced magnetic entropy change and working temperature interval in Ni-Mn-In-Co alloys. J. Alloys Compd. 2016, 656, 154–158. [Google Scholar] [CrossRef]
  13. Monroe, J.A.; Karaman, I.; Basaran, B.; Ito, W.; Umetsu, R.Y.; Kainuma, R.; Koyama, K.; Chumlyakov, Y.I. Direct measurement of large reversible magnetic-field-induced strain in Ni-Co-Mn-In metamagnetic shape memory alloys. Acta Mater. 2012, 60, 6883–6891. [Google Scholar] [CrossRef]
  14. Liu, J.; Aksoy, S.; Scheerbaum, N.; Acet, M.; Gutfleisch, O. Large magnetostrain in polycrystalline Ni-Mn-In-Co. Appl. Phys. Lett. 2009, 95, 232515. [Google Scholar]
  15. Madiligama, A.S.B.; Ari-Gur, P.; Shavrov, V.G.; Koledov, V.V.; Calder, S.; Mashirov, A.V.; Kamantsev, A.P.; Dilmieva, E.T.; Gonzalez-Legarreta, L.; Grande, B.H.; et al. Crystalline structure and magnetic behavior of the Ni41Mn39In12Co8 alloy demonstrating giant magnetocaloric effect. Smart Mater. Struct. 2016, 25, 085013. [Google Scholar] [CrossRef]
  16. Gottschall, T.; Skokov, K.P.; Frincu, B.; Gutfleisch, O. Large reversible magnetocaloric effect in Ni-Mn-In-Co. Appl. Phys. Lett. 2015, 106, 021901. [Google Scholar] [CrossRef]
  17. Huang, L.; Cong, D.Y.; Ma, L.; Nie, Z.H.; Wang, Z.L.; Suo, H.L.; Ren, Y.; Wang, Y.D. Large reversible magnetocaloric effect in a Ni-Co-Mn-In magnetic shape memory alloy. Appl. Phys. Lett. 2016, 108, 032405. [Google Scholar] [CrossRef]
  18. Cheng, F.; Gao, L.M.; Wang, Y.; Wang, J.T.; Liao, X.Q.; Yang, S. Large refrigeration capacity in a Ni42Co8Mn37.7In12.3 magnetocaloric alloy. J. Magn. Magn. Mater. 2019, 478, 234–238. [Google Scholar] [CrossRef]
  19. Karaca, H.E.; Karaman, I.; Basaran, B.; Ren, Y.; Chumlyakov, Y.I.; Maier, H.J. Magnetic Field-Induced Phase Transformation in NiMnCoIn Magnetic Shape-Memory Alloys—A New Actuation Mechanism with Large Work Output. Adv. Funct. Mater. 2009, 19, 983–998. [Google Scholar] [CrossRef]
  20. Wang, Y.D.; Huang, E.W.; Ren, Y.; Nie, Z.H.; Wang, G.; Liu, Y.D.; Deng, J.N.; Choo, H.; Liaw, P.K.; Brown, D.E.; et al. In situ high-energy X-ray studies of magnetic-field-induced phase transition in a ferromagnetic shape memory Ni-Co-Mn-In alloy. Acta Mater. 2008, 56, 913–923. [Google Scholar] [CrossRef]
  21. Pérez-Landazábal, J.I.; Recarte, V.; Sánchez-Alarcos, V.; Gómez-Polo, C.; Kustov, S.; Cesari, E. Magnetic field induced martensitic transformation linked to the arrested austenite in a Ni-Mn-In-Co shape memory alloy. Appl. Phys. Lett. 2011, 109, 093515. [Google Scholar] [CrossRef]
  22. Feng, Y.; Chen, H.; Xiao, F.; Bian, X.H.; Wang, P. Improvement of mechanical property and large shape recovery of sintered Ni45Mn36.6In13.4Co5 alloy. J. Alloys Compd. 2018, 765, 264–270. [Google Scholar] [CrossRef]
  23. Madiligama, A.; Ari-Gur, P.; Ren, Y.; Koledov, V.V.; Dilmieva, E.T.; Kamantsev, A.P.; Mashirov, A.V.; Shavrov, V.G.; Gonzalez-Legarreta, L.; Grande, B.H. Thermal and magnetic hysteresis associated with martensitic and magnetic phase transformations in Ni52Mn25In16Co7 Heusler alloy. J. Magn. Magn. Mater. 2017, 442, 25–35. [Google Scholar] [CrossRef]
  24. Turabi, A.S.; Karaca, H.E.; Tobe, H.; Basaran, B.; Aydogdu, Y.; Chumlyakov, Y.I. Shape memory effect and superelasticity of NiMnCoIn metamagnetic shape memory alloys under high magnetic field. Scr. Mater. 2016, 111, 110–113. [Google Scholar] [CrossRef]
  25. Ao, W.Q.; Liu, F.S.; Li, J.Q.; Du, Y.; Liu, F.L. Isothermal section of the Ni-Mn-In ternary system at 773 K. J. Alloys Compd. 2015, 622, 149–154. [Google Scholar] [CrossRef]
  26. Miyamoto, T.; Nagasako, M.; Kainuma, R. Phase equilibria in the Ni-Mn-In alloy system. J. Alloys Compd. 2013, 549, 57–63. [Google Scholar] [CrossRef]
  27. Gupta, K.P. The Co-Mn-Ni (Cobalt-Manganese-Nickel) system. J. Phase Equilib. 1999, 20, 527–532. [Google Scholar] [CrossRef]
  28. Zhou, Y.; Nash, P.; Dai, X.; Li, D.; Silva, A.; Cardoso, G. Phase equilibria in the Co-Mn-Ni system. J. Alloys Compd. 2018, 777, 1274–1285. [Google Scholar] [CrossRef]
  29. Nash, P.; Nash, A. Phase Diagrams of Binary Nickel Alloy; ASM International: Materials Park, OH, USA, 1991; p. 229. [Google Scholar]
  30. Okamoto, H. Co-In. J. Phase Equilib. Diffus. 1997, 18, 3. [Google Scholar]
  31. Durussel, P.; Burri, G.; Feschotte, E. The binary system Ni-In. J. Alloys Compd. 1997, 257, 253–258. [Google Scholar] [CrossRef]
  32. Bai, J.; Xu, N.; Raulot, J.M.; Zhang, Y.D.; Esling, C. First-principles investigations of crystallographic, magnetic, and electronic structures in Ni2XIn (X = Mn, Fe, and Co). Appl. Phys. 2012, 112, 114901. [Google Scholar] [CrossRef]
  33. Villars, P. Pearson’s Handbook, Desk Edition: Crystallographic Data for Intermetallic Phases; ASM International: Materials Park, OH, USA, 1997; p. 1. [Google Scholar]
  34. Roisnel, T.; Rodriguez-Carvajal, J. WinPLOTR: A windows tool for powder diffraction patterns analysis. Mater. Sci. 2001, 378–381, 118–123. [Google Scholar] [CrossRef] [Green Version]
  35. Rodriguez-Carvajal, J. Recent advances in magnetic structure determination by neutron powder diffraction. Physica B 1993, 192, 55–69. [Google Scholar] [CrossRef]
  36. Schmetterer, C.; Zemanova, A.; Flandorfer, H. Phase equilibria in the ternary In-Ni-Sn system at 700 °C. Intermetallics 2013, 35, 90–94. [Google Scholar] [CrossRef] [PubMed] [Green Version]
  37. Howe, R.A.; Enderby, J.E. The thermoelectric power of cerium, lanthanum, nickel and cobalt in the vicinity of the melting point. J. Phys. F Met. Phys. 1973, 3, 12–14. [Google Scholar] [CrossRef]
  38. Maira, G.K.; Orton, B.R.; Riviere, J.C. An XPS study of indium through the melting point. J. Phys. F Met. Phys. 1987, 17, 10. [Google Scholar] [CrossRef]
  39. Seguí, C.; Cesari, E.; Pons, J. Intermartensitic Transformations in Ni-Mn-Ga Alloys: A General View. Adv. Mater. Res. 2008, 52, 47–55. [Google Scholar] [CrossRef]
  40. Krenke, T.; Acet, M.; Wassermann, E.F. Ferromagnetism in the austenitic and martensitic states of Ni-Mn-In alloys. Phys. Rev. B 2006, 7, 174413. [Google Scholar] [CrossRef] [Green Version]
  41. Krenke, T.; Acet, M.; Wassermann, E.F. Martensitic transitions and the nature of ferromagnetism in the austenitic and martensitic states of Ni-Mn-Sn alloys. Phys. Rev. B 2005, 72, 014412. [Google Scholar] [CrossRef] [Green Version]
Figure 1. BSE micrograph of (a) No. 1 (Co10Ni75In15) and (b) No. 2 (Co4Ni34In62).
Materials 13 03990 g001
Figure 2. XRD patterns of samples No. 3 (Co25Ni50In25), No. 4 (Co22Ni52In26), and No. 5 (Co27Ni48In25).
Materials 13 03990 g002
Figure 3. BSE micrograph of samples (a) No. 3(Co25Ni50In25) and (b) No. 4 (Co22Ni52In26).
Materials 13 03990 g003
Figure 4. (a) XRD pattern and (b) BSE micrograph of No. 26 (Co28Ni24In48).
Materials 13 03990 g004
Figure 5. XRD pattern of No.33 (Co26Ni6In68).
Materials 13 03990 g005
Figure 6. (a) XRD pattern and (b) BSE micrograph of No. 32 (Co8Ni22In70).
Materials 13 03990 g006
Figure 7. BSE micrograph of No. 28 (Co18Ni52In30).
Materials 13 03990 g007
Figure 8. XRD patterns of the sample Ni1−xCoxIn (x = 0.04, 0.08, 0.12, 0.14).
Materials 13 03990 g008
Figure 9. Variation of (a) the lattice parameter a and (b) lattice parameter c of Ni1−xCoxIn on Co content.
Materials 13 03990 g009
Figure 10. BSE micrograph of the sample Ni1−xCoxIn (x = 0.14).
Materials 13 03990 g010
Figure 11. Variation of (a) the lattice parameter a and (b) lattice parameter c of Co1−xNixIn2 on Ni content.
Materials 13 03990 g011
Figure 12. The BSE micrograph of No. 30 (Co25Ni45In35).
Materials 13 03990 g012
Figure 13. Isothermal section of the Co-Ni-In system at 673 K.
Materials 13 03990 g013
Figure 14. Isothermal section of the Co-Ni-In system at 873 K.
Materials 13 03990 g014
Figure 15. Observed, calculated, and differential XRD patterns of Ni2−xCoxIn3 (x = 0.200).
Materials 13 03990 g015
Figure 16. Observed, calculated and differential XRD patterns of Co1−xNixIn2 (x = 0.540).
Materials 13 03990 g016
Figure 17. Observed, calculated and differential XRD patterns of Co1−xNixIn2 (x = 0.580).
Materials 13 03990 g017
Figure 18. The zero-field-cooled (ZFC) and zero-field-heated (ZFH) temperature dependence of the magnetization under static magnetic fields of 50 mT for the Ni2−xCoxIn3 (x = 0.200) alloy.
Materials 13 03990 g018
Figure 19. Magnetization isotherms of the Ni2−xCoxIn3 (x = 0.200) alloy.
Materials 13 03990 g019
Figure 20. The magnetic entropy changes as a function of temperature under 3 T, 2 T, 1 T magnetic fields for the Ni2−xCoxIn3 (x = 0.200) alloy.
Materials 13 03990 g020
Figure 21. The ZFC and ZFH temperature dependence of the magnetization under static magnetic fields of 50 mT for the Co1−xNixIn2 (x = 0.540) compound.
Materials 13 03990 g021
Figure 22. Magnetization isotherms for the Co1−xNixIn2 (x = 0.540) alloy.
Materials 13 03990 g022
Figure 23. The magnetic entropy changes as a function of temperature under 3 T, 2 T, and 1 T magnetic fields for the Co1−xNixIn2 (x = 0.540) alloy.
Materials 13 03990 g023
Figure 24. The XRD patterns of sample Ni2−xCoxIn3 (x = 0.200) at 490 K.
Materials 13 03990 g024
Figure 25. The XRD patterns of sample Co1−xNixIn2 (x = 0.540) at 490 K.
Materials 13 03990 g025
Table 1. Crystallographic data of the compounds in the Co-Ni-In system.
CompoundsStructure TypeSpace GroupLattice Parameters (nm)References
abcβ(°)
CoIn2CuMg2Fddd0.94020.52821.784690[30]
CoIn3MgP63/mmc0.68290.68290.709490[30]
Ni4InWIm 3 ¯ m0.29290.29290.292990[33]
Ni3InNi3SnP63/mmc0.53200.53200.424290[31]
Ni3InAuCu3Pm 3 ¯ m0.37500.37500.375090[31]
ζNiAsP63/mmc0.41890.41890.512390[31]
Ni2InNi2InP63/mmc0.41790.41790.513190[31]
Ni13In9Ni13In9C2/m1.46460.83290.897735.35[31]
Ni13In7AsNiP63/mmc0.41780.41780.513790[33]
NiInCoSnP6/mmm0.52430.52430.434290[31]
NiInCsClPm 3 ¯ m0.30920.30920.309290[31]
Ni2In3 Al3Ni2P 3 ¯ m10.43900.43900.520190[31]
Ni3In7Cu5Zn8I4 3 ¯ m0.91800.91800.918090[33]
Ni2CoInBiF3Fm 3 ¯ m0. 59440. 59440. 594490[32]
Table 2. Typical samples and details of three-phase regions in the Co-Ni-In ternary system at 673 K.
Phase RegionsSamplesAlloy CompositionsPhase Components
1No. 6Co10Ni68In22Ni2−xCoxIn(x = 0.091) + Ni3In+ α-Ni1−xCox (x = 0.400)
2No. 7Co10Ni62In28Ni13 − xCoxIn9 (x = 0.702) + Ni2−xCoxIn (x = 0.091) +
α-Ni1−xCox (x = 0.400)
3No. 9Co20Ni45In35Ni13 − xCoxIn9 (x = 0.702) + Ni1−xCoxIn (x = 0.125) +
α-Co1−xNix(x = 0.600)
4No. 10Co10Ni40In50Ni1−xCoxIn (x = 0.125) + Ni2−xCoxIn3 (x = 0.400) +
ε-Co1−xNix (x = 0.280)
5No. 11Co40Ni20In40Co1−xNixIn2 (x = 0.565) + Ni2−xCoxIn3 (x = 0.400) + ε-Co1−xNix
(x = 0.280)
6No. 13Co30Ni40In30Ni1−xCoxIn (x = 0.125) + α-Co1−xNix (x = 0.600) +ε-Co1−xNix (x = 0.280)
7No. 14Co10Ni24In66Co1−xNixIn2 (x = 0.565) + Ni2−xCoxIn3 (x = 0.400) + Ni3In7
8No. 15Co16Ni12In72Co1−xNixIn2 (x = 0.565) + CoIn3 + Ni3In7
9No. 16Co10Ni12In78CoIn3 + Ni3In7 + In (Liquid)
Table 3. Typical samples and details of three-phase regions in the Co-Ni-In ternary system at 873 K.
Phase RegionsSamplesAlloy CompositionsPhase Components
INo. 26Co28Ni24In48Co1−xNixIn2 (x = 0.612) + Ni2−xCoxIn3 (x = 0.450) + α-Co1−xNix (x = 0.200)
IINo. 28Co8Ni22In70Co1−xNixIn2 (x = 0.612) + Ni2−xCoxIn3 (x = 0.450) + In (Liquid)
IIINo. 28Co18Ni52In30ξ + Ni13 − xCoxIn9 (x = 2.634) + α-Ni1−xCox (x = 0.500)
IVNo. 30Co20Ni45In35Ni13 − xCoxIn9 (x = 2.634)+ Ni1−xCoxIn (x = 0.160) + α-Ni1−xCox (x = 0.600)
VNo. 31Co14Ni66In20Ni3In + Ni2−xCoxIn (x = 0.181) + α-Ni1−xCox (x = 0.400)
VINo. 32Co12Ni58In30Ni2−xCoxIn (x = 0.181) + ξ + α-Ni1−xCox (x = 0.500)
VIINo. 33Co20Ni34In46Ni1−xCoxIn (x = 0.160) + Ni2−xCoxIn3 (x = 0.450) + α-Co1−xNix (x = 0.200)
VIII Co1−xNixIn2 (x = 0.091) + α-Co + In (Liquid)
Table 4. Crystallographic data and Rietveld refinement results for Ni2−xCoxIn3 (x = 0.200) and Co1−xNixIn2 (x= 0.54, 0.58) alloys.
CompoundPhaseStructure TypeSpace
Group
Lattice Parameters (nm)Atomic ParametersReliability FactorsGoodness of Fit
abcAtomsWyck (x, y, z)OccR
p(%)
R
exp(%)
S
(%)
Ni2−xCoxIn3(x = 0.200)Ni2−xCoxIn3 (x = 0.200)Al2Ni3P 3 ¯ m1
(164)
0.43959(5)0.43959(5)0.53121(1)In11a (0,0,0)110.4614.153.2
In22d (1/3, 2/3, 0.6469(3))1
M1 = (Co, Ni)2d (0, 0, 0.1381(2))0.1Co + 0.9 Ni
Co1−xNixIn2(x = 0.540)Co1−xNixIn2(x = 0.540)CuMg2Fddd
(70)
0.9424(3)0.5288(4)1.7742(5)In116e (0.9648(2), 1/4,1/4)110.2913.262.9
M2 = (Co, Ni)16g (1/4, 0.9963(7), 1/4)0.466Co + 0.534Ni
In216g (1/4, 0.7120(5), 1/4)1
Co1−xNixIn2 (x = 0.580)Co1−xNixIn2(x = 0.565)CuMg2Fddd
(70)
0.9421(2)0.5282(3)1.7739(3)In116e (0.9642(3), 1/4,1/4)19.8912.582.7
M3 = (Co, Ni)16g (1/4, 0.9962(2), 1/4)0.438Co + 0.562Ni
In216g (1/4, 0.7131(4), 1/4)1
Ni2−xCoxIn3 (x = 0.400)Al3Ni2P 3 ¯ m1
(164)
0.4397(1)0.4397(1)0.5319(3)In11a (0 0 0) 19.8912.582.7
In22d (1/3, 2/3, 0.6412(2))1
M4 = (Co, Ni)2d (0, 0, 0.1350)0.8Co + 0.2Ni
M1 = 0.1Co + 0.9 Ni; M2 = 0.466Co + 0.534Ni; M3 = 0.438Co + 0.562Ni; M4 = 0.8Co + 0.2Ni

