Study of the Active Carbon from Used Coffee Grounds as the Active Material for a High-Temperature Stable Supercapacitor with Ionic-Liquid Electrolyte


Abstract
1. Introduction
2. Experimental
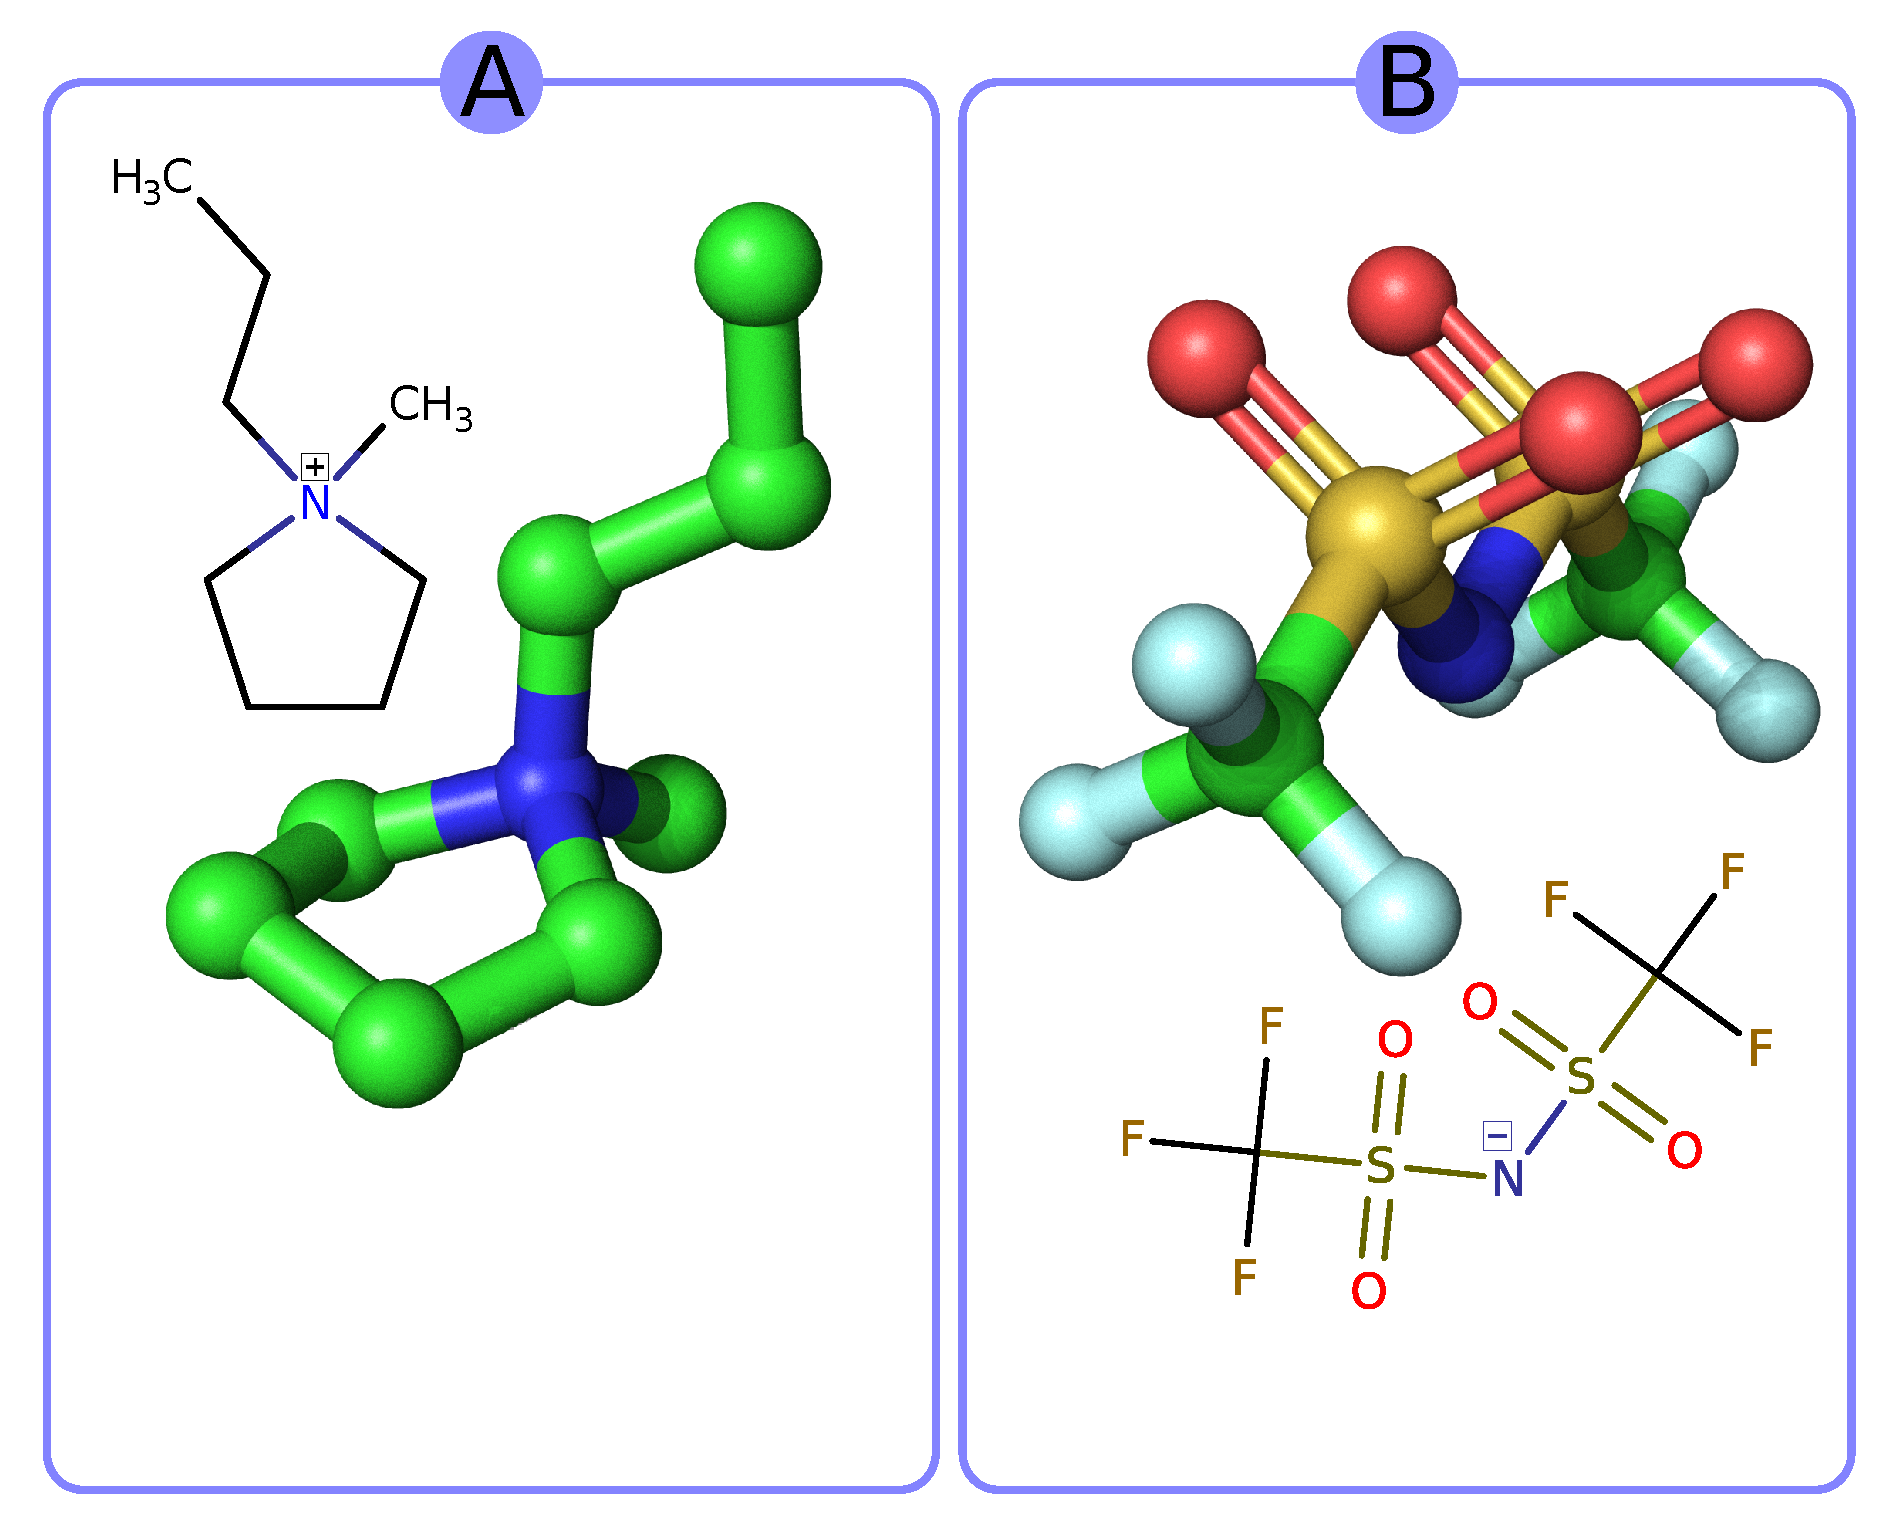
2.1. Materials
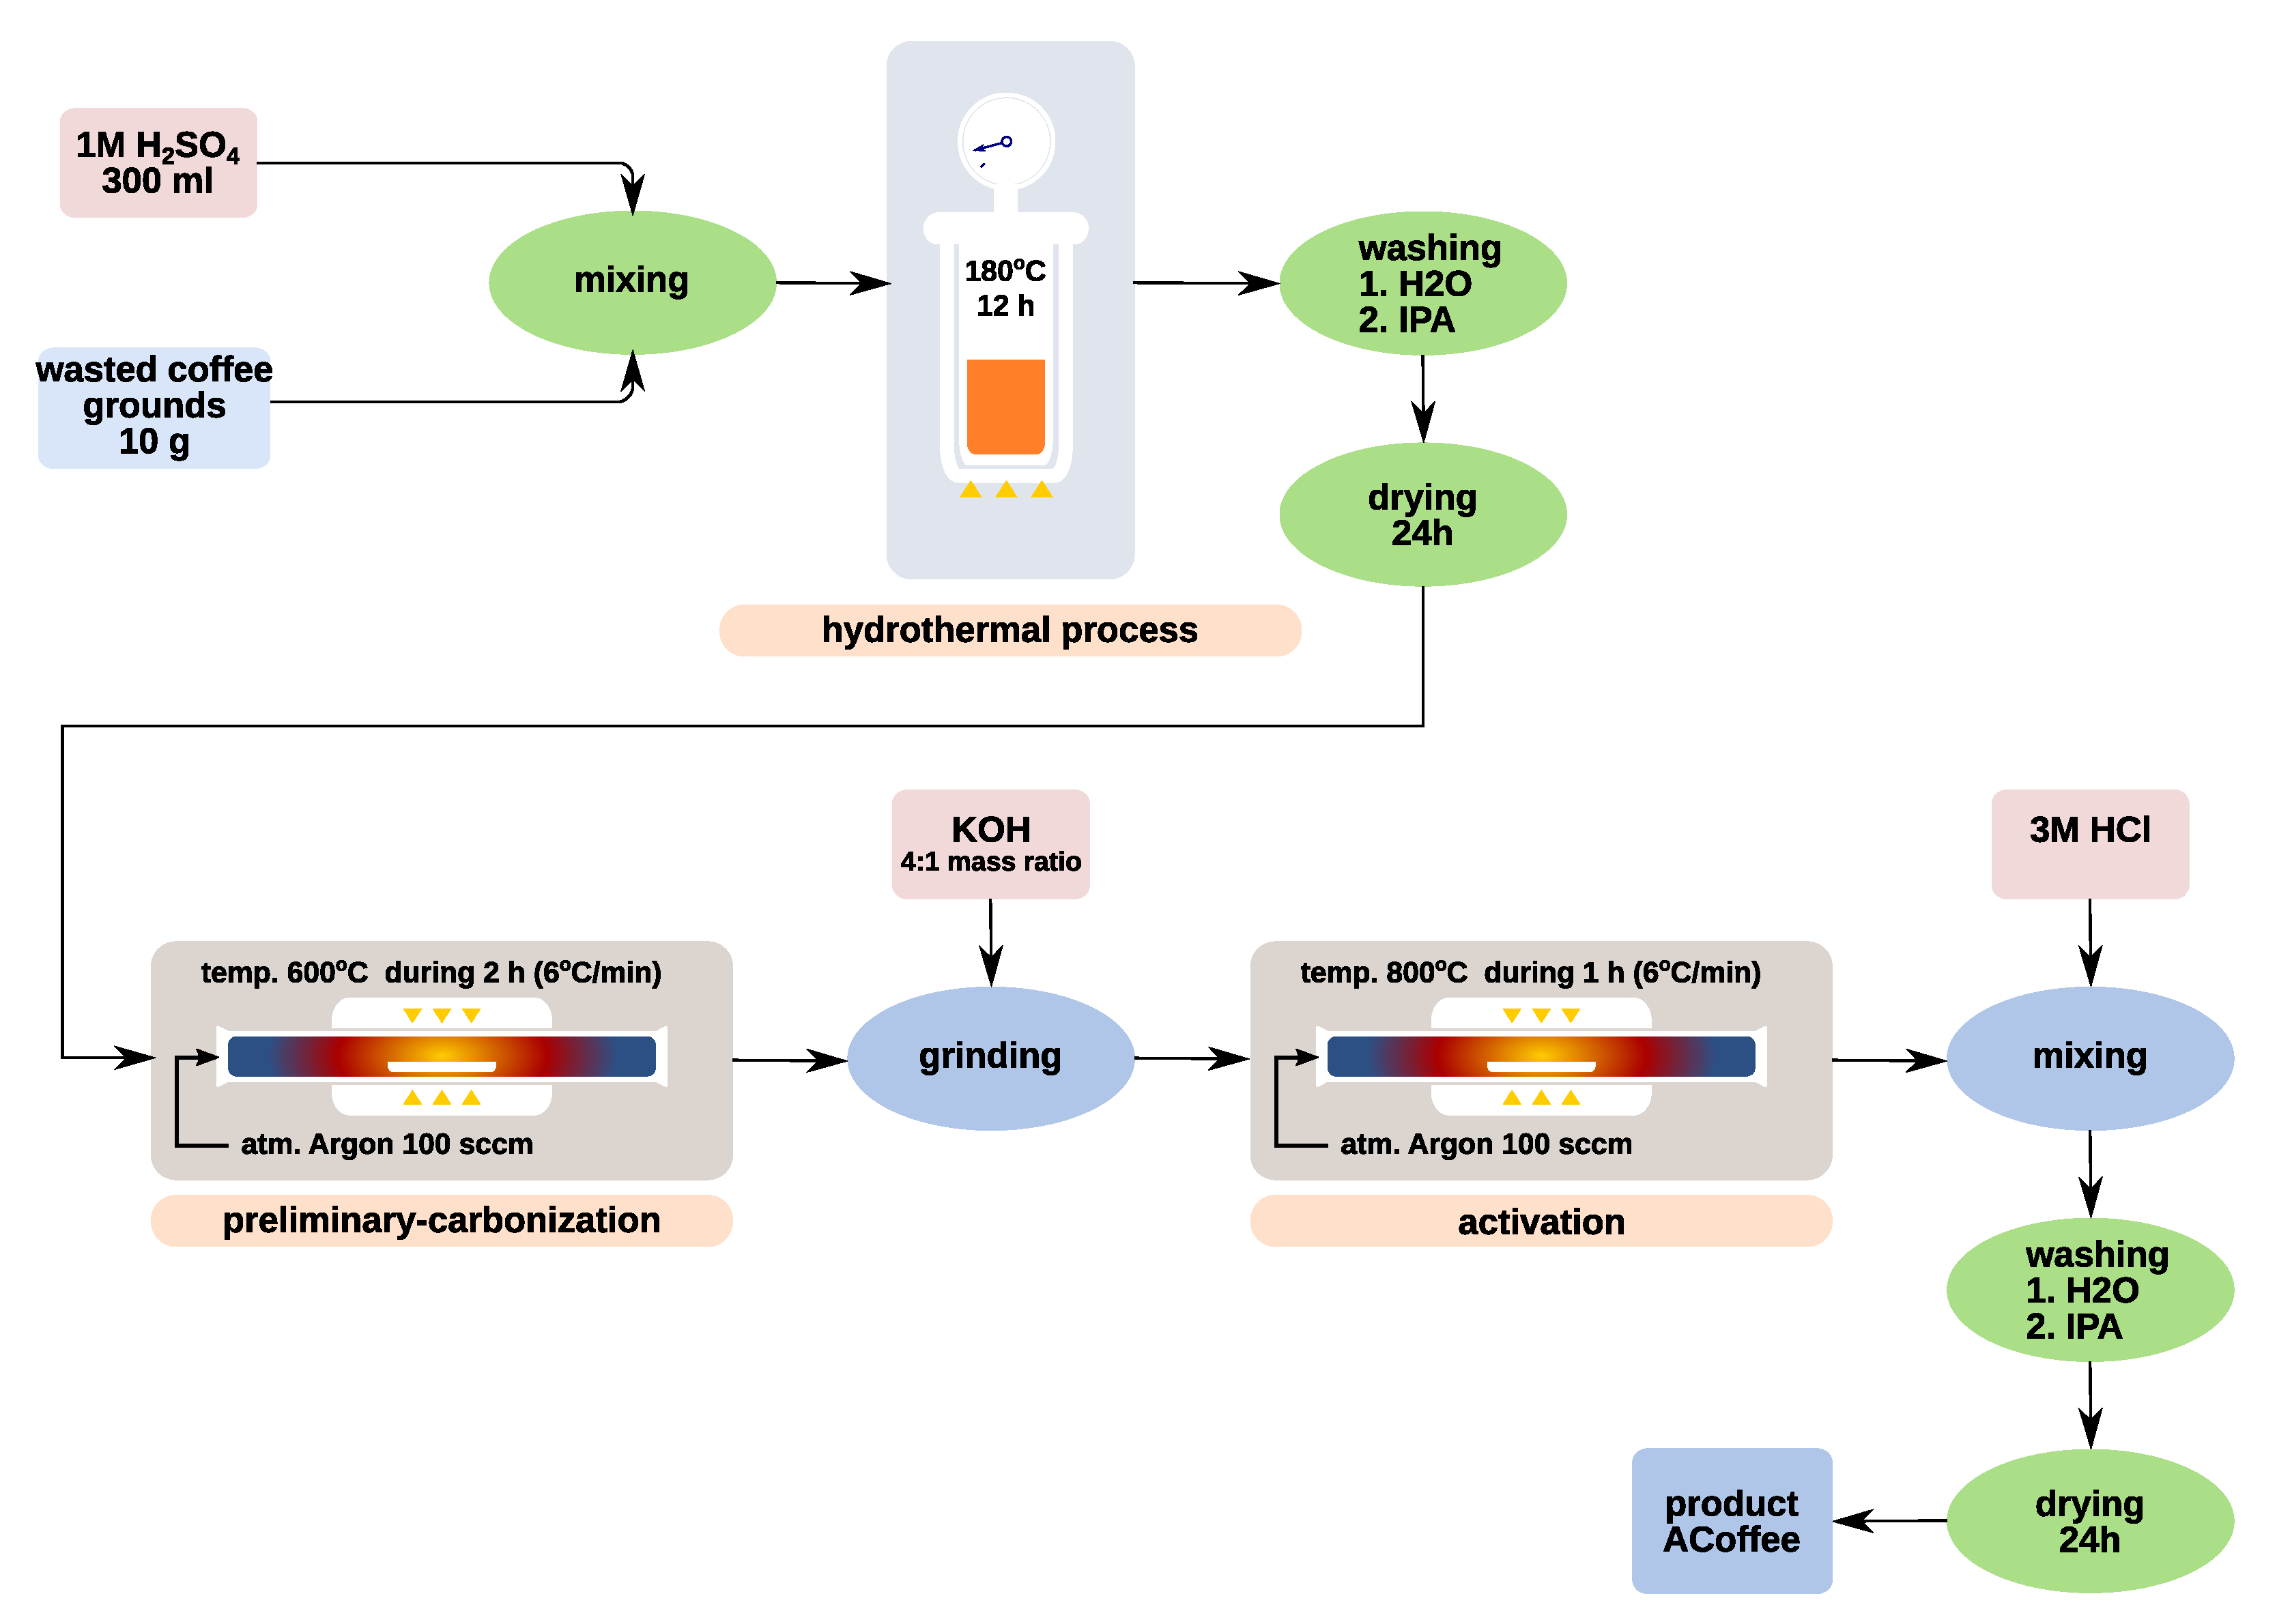
2.2. Material Preparation
2.3. Electrochemical Measurements
2.4. Material Characterization
3. Results
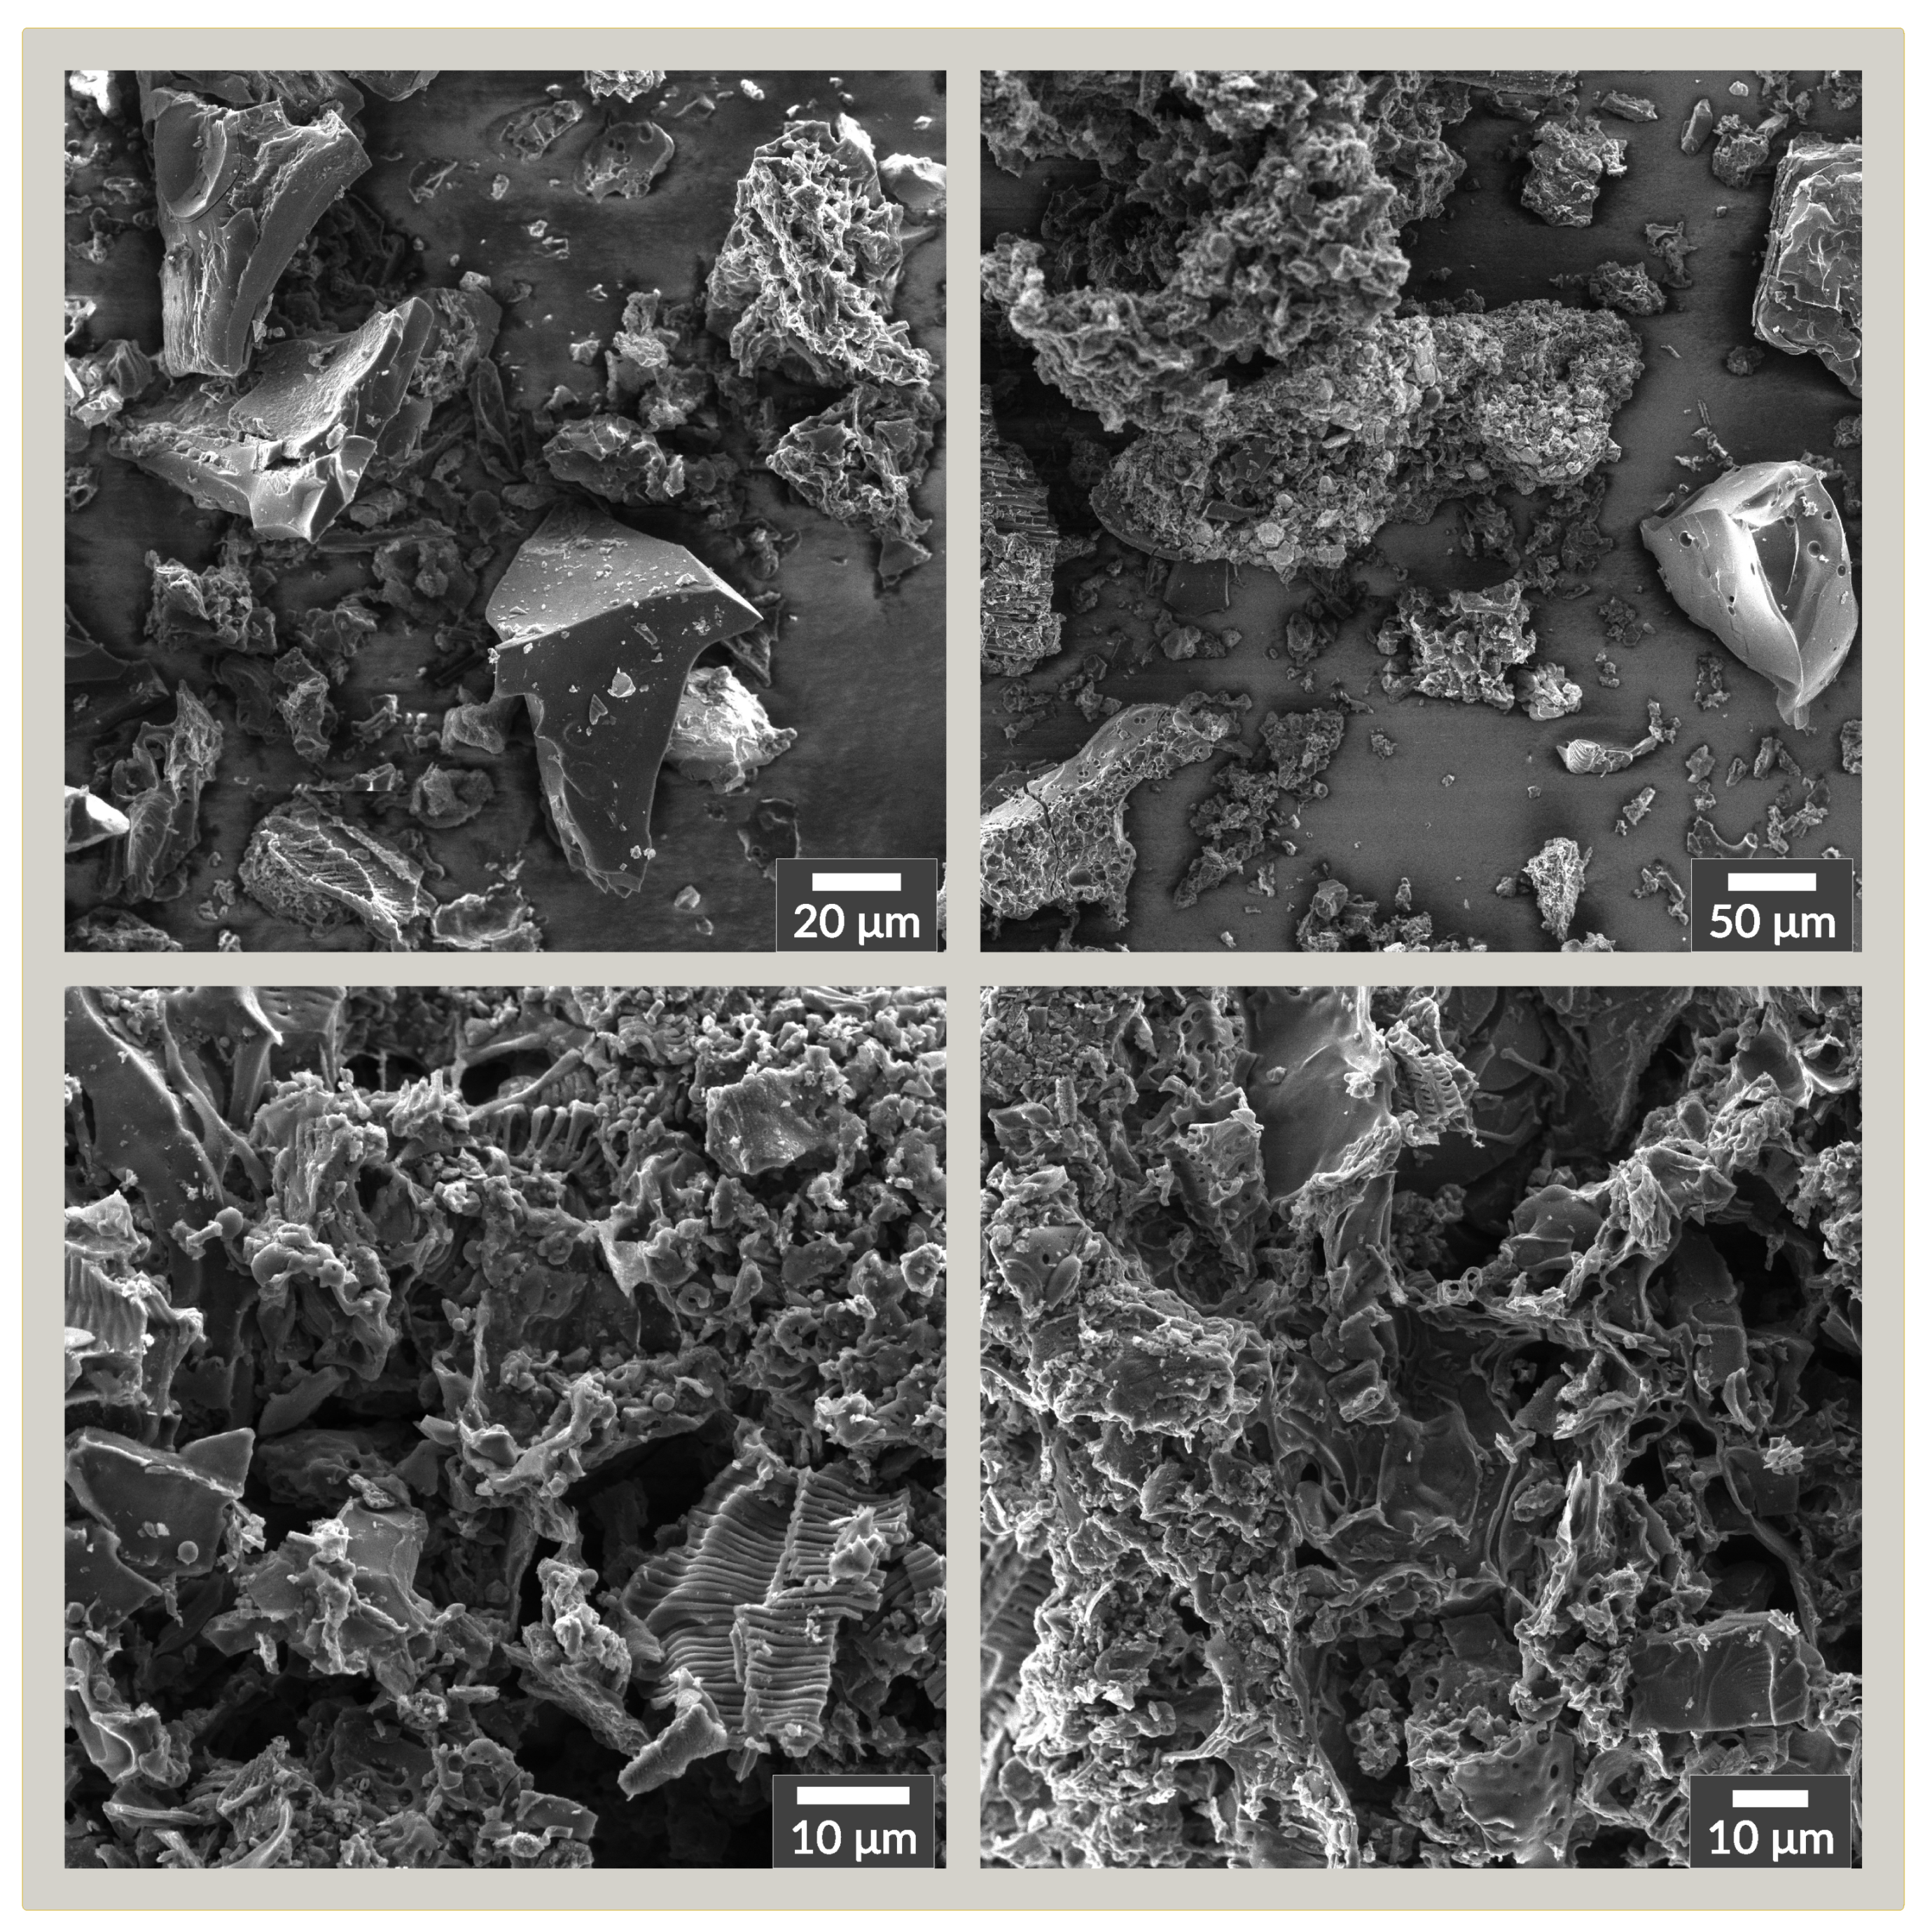
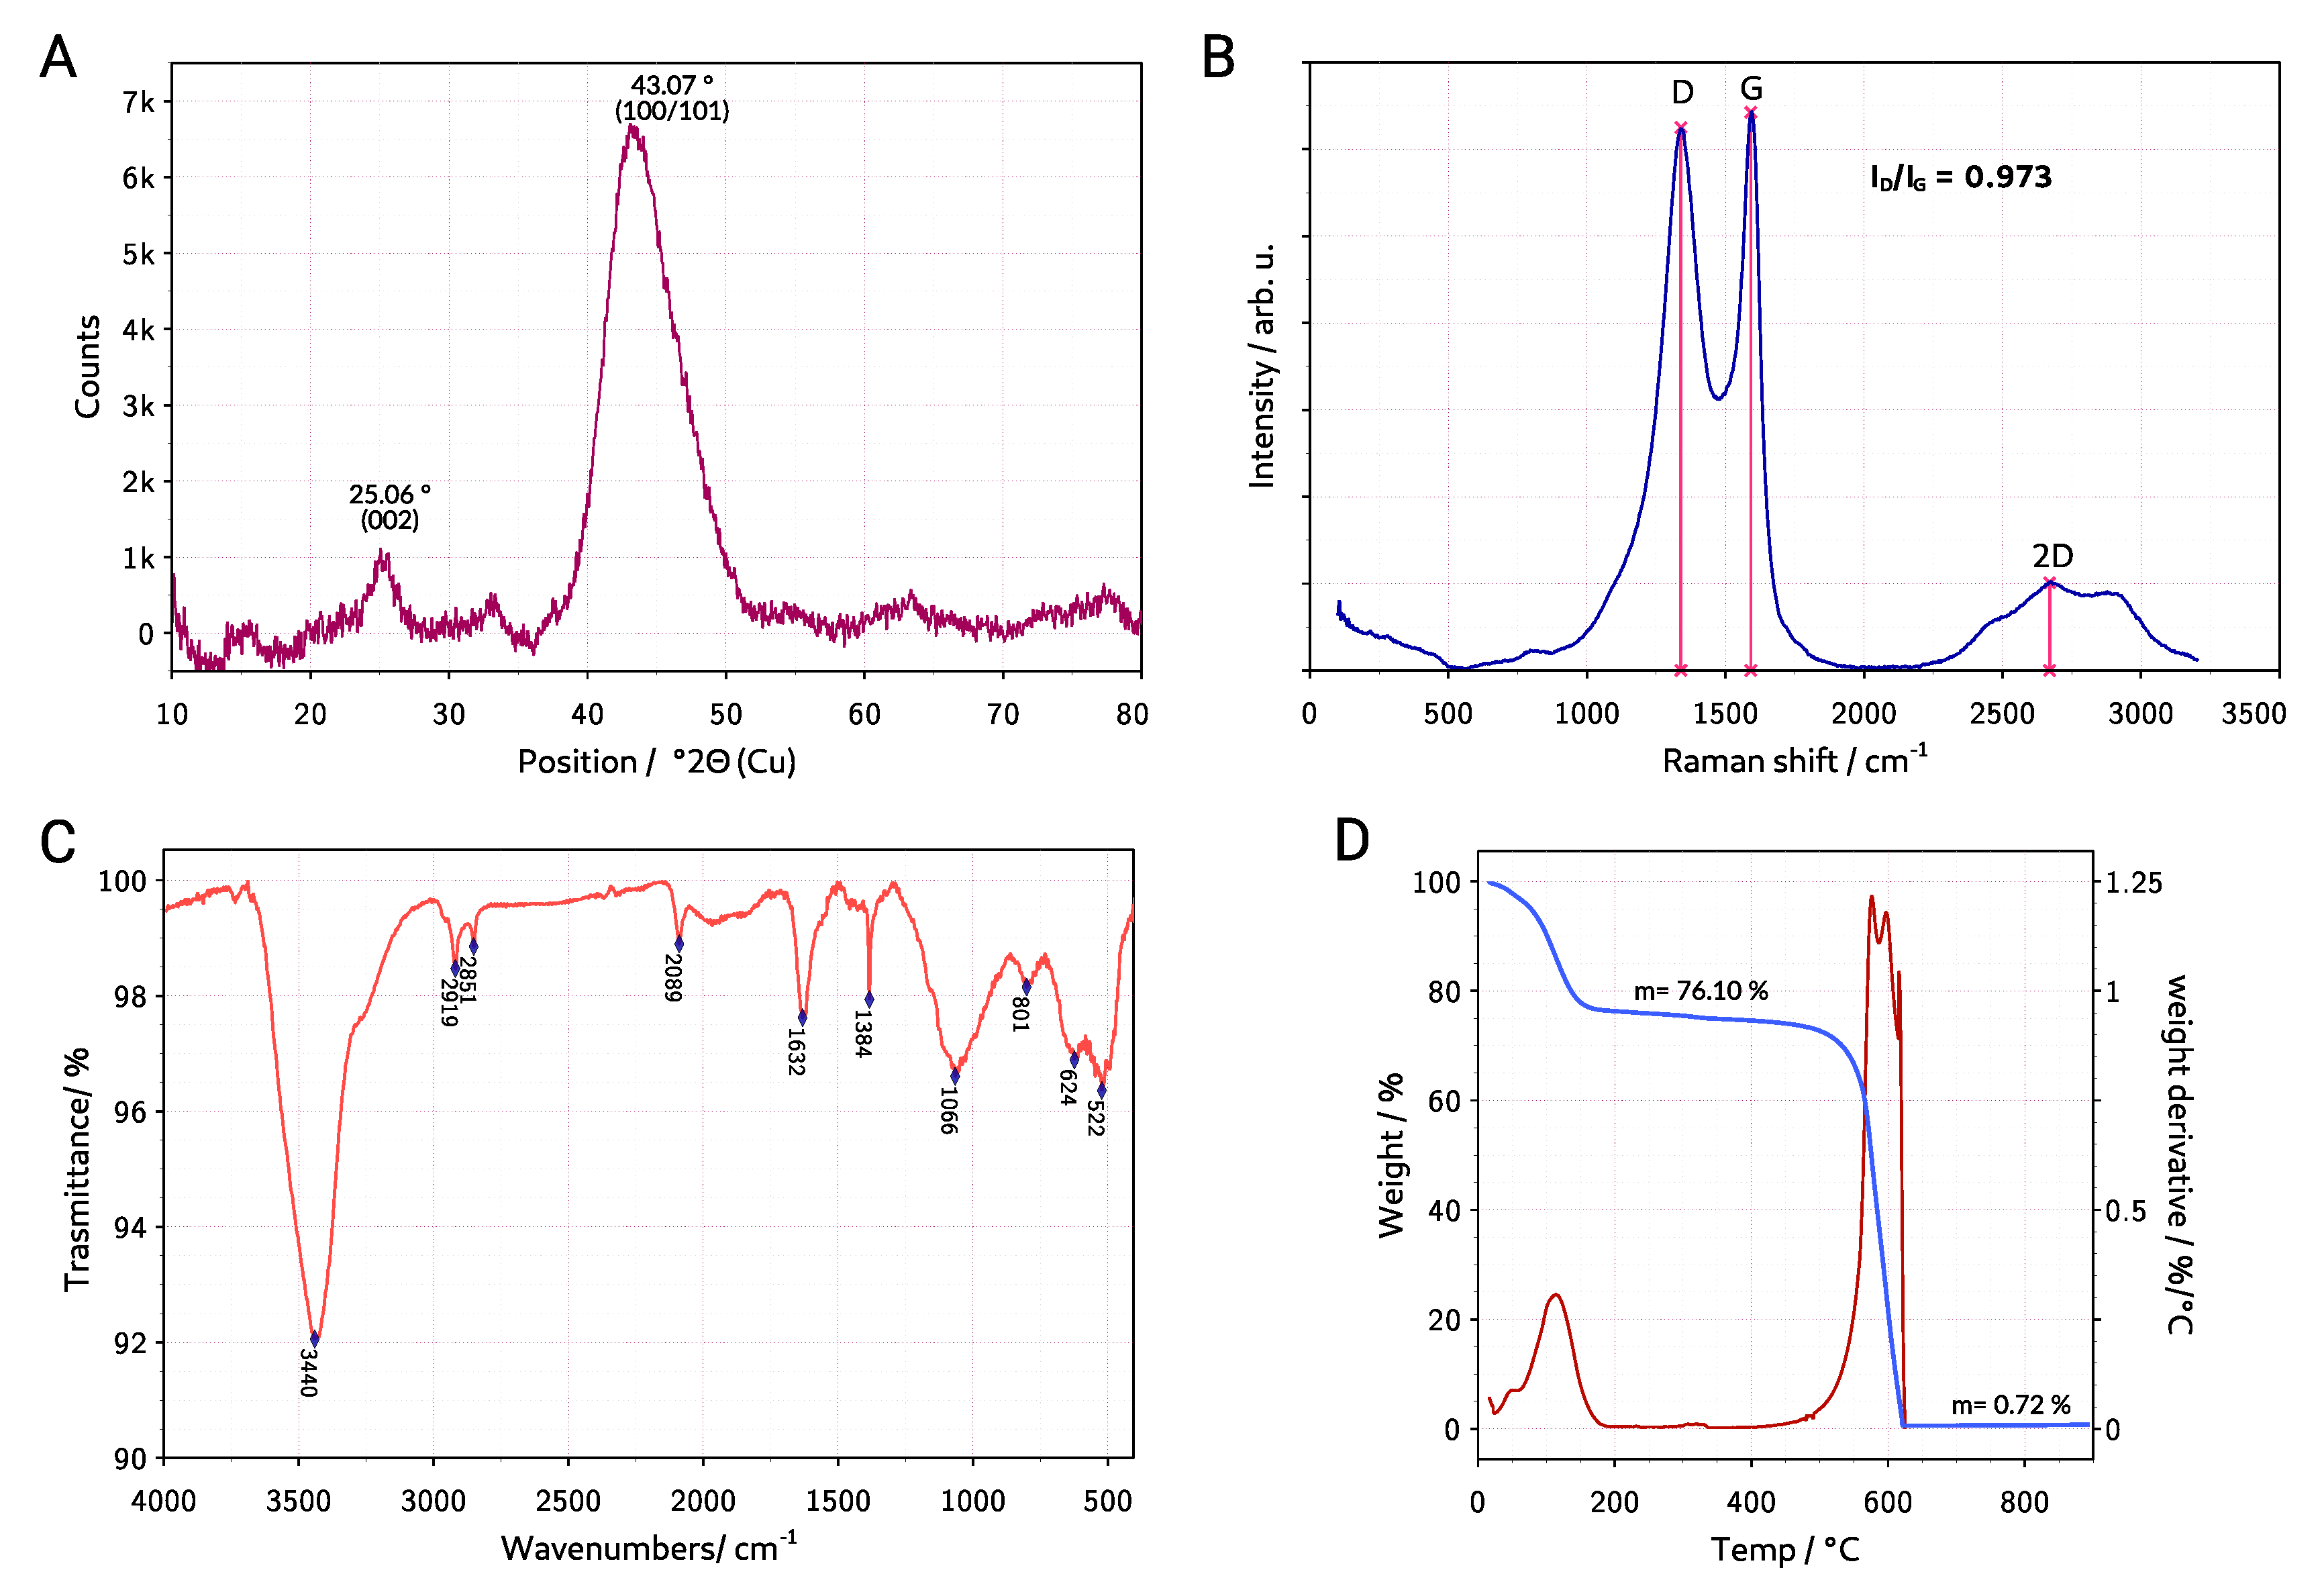
3.1. Material Characterization
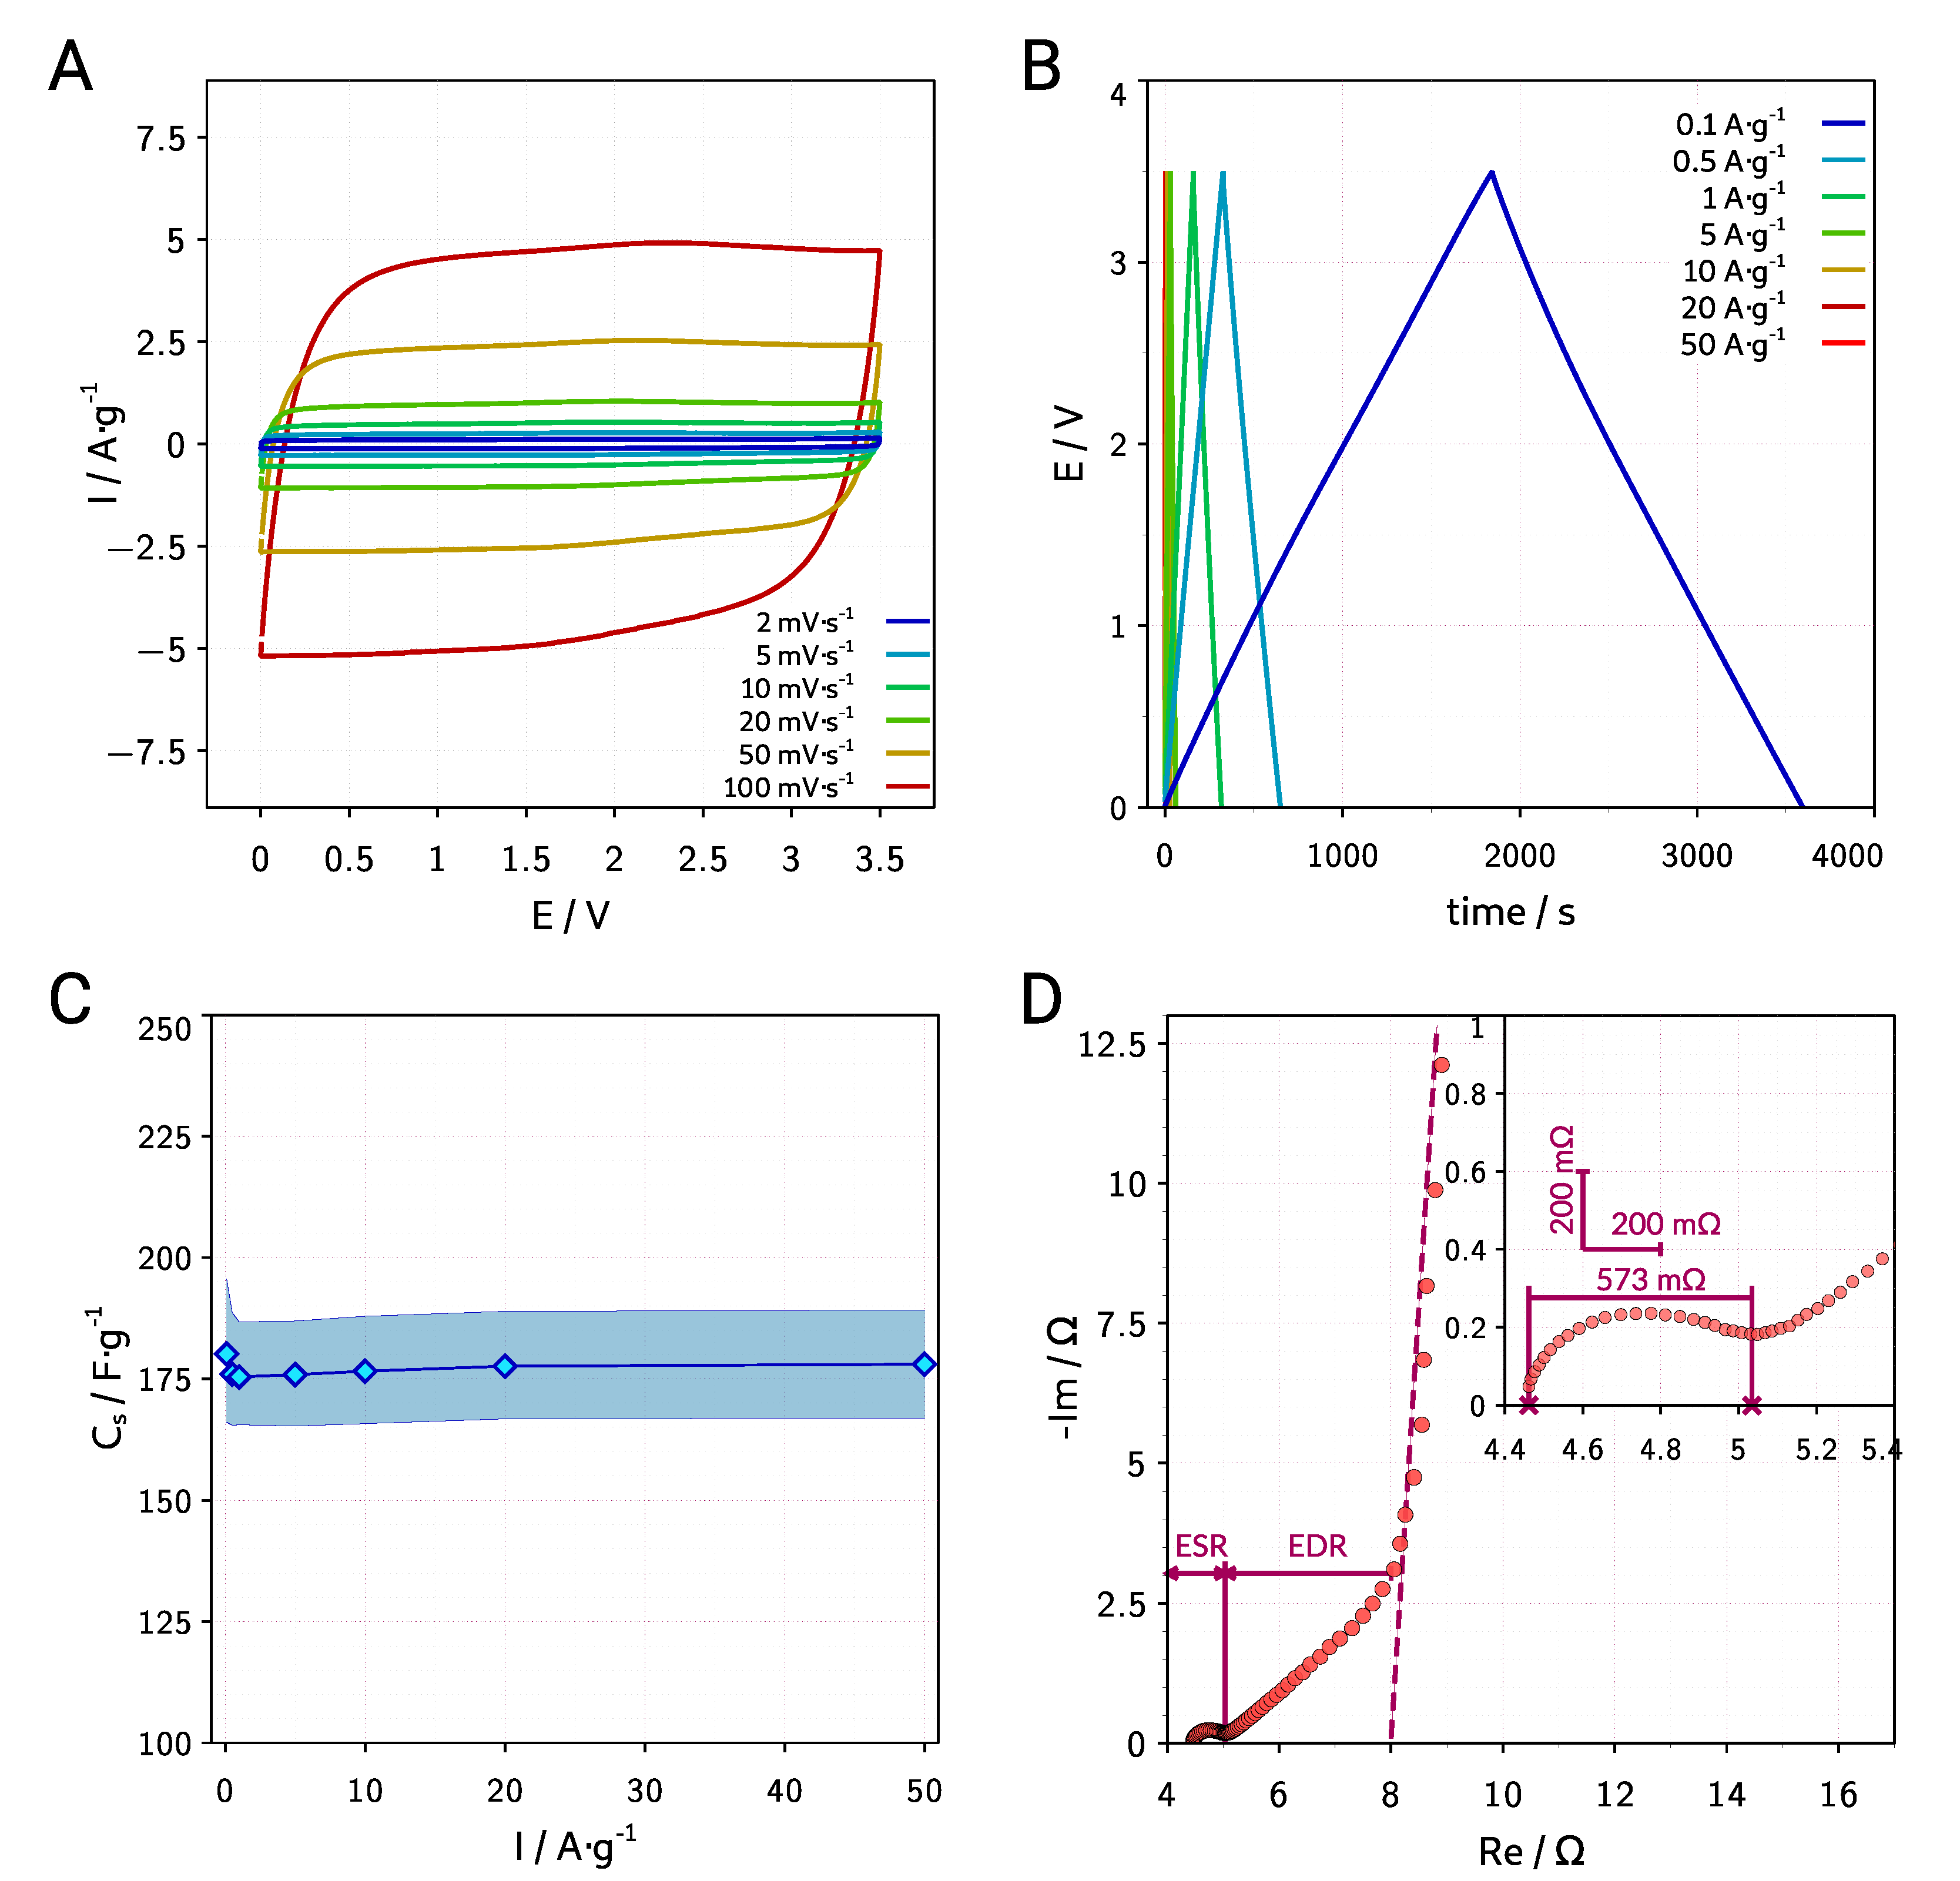
3.2. Electrochemical Measurements
4. Conclusions
Author Contributions
Funding
Conflicts of Interest
References
- Simon, P.; Gogotsi, Y. Materials for Electrochemical Capacitors. In Nanoscience and Technology; Co-Published with Macmillan Publishers Ltd.: London, UK, 2009; pp. 320–329. [Google Scholar] [CrossRef]
- Sudhakar, Y.N.; Selvakumar, M.; Bhat, D.K. Biopolymer Electrolytes: Fundamentals and Applications in Energy Storage; Elsevier: Amsterdam, The Netherlands, 2018. [Google Scholar] [CrossRef]
- Pandolfo, A.G.; Hollenkamp, A.F. Carbon Properties and Their Role in Supercapacitors. J. Power Sources 2006, 157, 11–27. [Google Scholar] [CrossRef]
- Niu, C.; Sichel, E.K.; Hoch, R.; Moy, D.; Tennent, H. High Power Electrochemical Capacitors Based on Carbon Nanotube Electrodes. Appl. Phys. Lett. 1997, 70, 1480–1482. [Google Scholar] [CrossRef]
- El-Kady, M.F.; Kaner, R.B. Scalable Fabrication of High-Power Graphene Micro-Supercapacitors for Flexible and on-Chip Energy Storage. Nat. Commun. 2013, 4, 1–9. [Google Scholar] [CrossRef]
- Kim, S.J.; Hwang, S.W.; Hyun, S.H. Preparation of Carbon Aerogel Electrodes for Supercapacitor and Their Electrochemical Characteristics. J. Mater. Sci. 2005, 40, 725–731. [Google Scholar] [CrossRef]
- Hoang, T.T.B. Chapter 26-Noble Metal–Manganese Oxide Nanohybrids Based Supercapacitors. In Noble Metal-Metal Oxide Hybrid Nanoparticles; Mohapatra, S., Nguyen, T.A., Nguyen-Tri, P., Eds.; Micro and Nano Technologies, Woodhead Publishing: Cambridge, UK, 2019; pp. 549–564. [Google Scholar] [CrossRef]
- Snook, G.A.; Kao, P.; Best, A.S. Conducting-Polymer-Based Supercapacitor Devices and Electrodes. J. Power Sources 2011, 196, 1–12. [Google Scholar] [CrossRef]
- Ramachandran, R.; Wang, F. Electrochemical Capacitor Performance: Influence of Aqueous Electrolytes. Supercapacit. Theor. Pract. Solut. 2017. [Google Scholar] [CrossRef]
- Yang, C.; Sun, M.; Wang, G.; Cheng, Q.; Bao, H.; Li, X.; Saha, N.; Saha, P. High Energy-Density Organic Supercapacitors Based on Optimum Matching between GNS/aMWCNT@polyaniline Nanocone Arrays Cathode and GNS/aMWCNT@poly(1,5-Diaminoanthraquinone) Nanoparticles Anode. Chem. Eng. J. 2017, 326, 9–16. [Google Scholar] [CrossRef]
- Mousavi, M.P.S.; Wilson, B.E.; Kashefolgheta, S.; Anderson, E.L.; He, S.; Bühlmann, P.; Stein, A. Ionic Liquids as Electrolytes for Electrochemical Double-Layer Capacitors: Structures That Optimize Specific Energy. ACS Appl. Mater. Interfaces 2016, 8, 3396–3406. [Google Scholar] [CrossRef]
- Lewandowski, A.; Galiński, M. Carbon–Ionic Liquid Double-Layer Capacitors. J. Phys. Chem. Solids 2004, 65, 281–286. [Google Scholar] [CrossRef]
- Sakaebe, H.; Matsumoto, H. N-Methyl-N-Propylpiperidinium Bis(Trifluoromethanesulfonyl)Imide (PP13–TFSI) – Novel Electrolyte Base for Li Battery. Electrochem. Commun. 2003, 5, 594–598. [Google Scholar] [CrossRef]
- Yu, L.; Gan, M.; Ma, L.; Huang, H.; Hu, H.; Li, Y.; Tu, Y.; Ge, C.; Yang, F.; Yan, J. Facile Synthesis of MnO2/Polyaniline Nanorod Arrays Based on Graphene and Its Electrochemical Performance. Synth. Met. 2014, 198, 167–174. [Google Scholar] [CrossRef]
- Brezesinski, T.; Wang, J.; Tolbert, S.H.; Dunn, B. Ordered Mesoporous α-MoO3 with Iso-Oriented Nanocrystalline Walls for Thin-Film Pseudocapacitors. Nat. Mater. 2010, 9, 146–151. [Google Scholar] [CrossRef] [PubMed]
- Burke, A. R&D Considerations for the Performance and Application of Electrochemical Capacitors. Electrochim. Acta 2007, 53, 1083–1091. [Google Scholar] [CrossRef]
- Fernicola, A.; Scrosati, B.; Ohno, H. Potentialities of Ionic Liquids as New Electrolyte Media in Advanced Electrochemical Devices. Ionics 2006, 12, 95–102. [Google Scholar] [CrossRef]
- Kurc, B.; Siwińska-Stefańska, K.; Jakóbczyk, P.; Jesionowski, T. Titanium Dioxide/Graphene Oxide Composite and Its Application as an Anode Material in Non-Flammable Electrolyte Based on Ionic Liquid and Sulfolane. J. Solid State Electrochem. 2016, 20, 1971–1981. [Google Scholar] [CrossRef]
- Stepnowski, P. Chapter 16—Sorption, Lipophilicity and Partitioning Phenomena of Ionic Liquids in Environmental Systems. In Thermodynamics, Solubility and Environmental Issues; Letcher, T.M., Ed.; Elsevier: Amsterdam, The Netherlands, 2007; pp. 299–313. [Google Scholar] [CrossRef]
- Lewandowski, A.; Olejniczak, A.; Galinski, M.; Stepniak, I. Performance of Carbon–Carbon Supercapacitors Based on Organic, Aqueous and Ionic Liquid Electrolytes. J. Power Sources 2010, 195, 5814–5819. [Google Scholar] [CrossRef]
- Zhang, S.; Brahim, S.; Maat, S. High-Voltage Operation of Binder-Free CNT Supercapacitors Using Ionic Liquid Electrolytes. J. Mater. Res. 2018, 33, 1179–1188. [Google Scholar] [CrossRef]
- Howlett, P.C.; Izgorodina, E.I.; Forsyth, M.; MacFarlane, D.R. Electrochemistry at Negative Potentials in Bis(Trifluoromethanesulfonyl)Amide Ionic Liquids. Z. Phys. Chem. 2006, 220, 1483–1498. [Google Scholar] [CrossRef]
- Balducci, A. Electrolytes for High Voltage Electrochemical Double Layer Capacitors: A Perspective Article. J. Power Sources 2016, 326, 534–540. [Google Scholar] [CrossRef]
- Marsh, H.; Rodríguez-Reinoso, F. CHAPTER 1-Introduction to the Scope of the Text. In Activated Carbon; Marsh, H., Rodríguez-Reinoso, F., Eds.; Elsevier Science Ltd.: Oxford, UK, 2006; pp. 1–12. [Google Scholar] [CrossRef]
- Zhang, J.; Gong, L.; Sun, K.; Jiang, J.; Zhang, X. Preparation of Activated Carbon from Waste Camellia Oleifera Shell for Supercapacitor Application. J. Solid State Electrochem. 2012, 16, 2179–2186. [Google Scholar] [CrossRef]
- Rufford, T.E.; Hulicova-Jurcakova, D.; Zhu, Z.; Lu, G.Q. Nanoporous Carbon Electrode from Waste Coffee Beans for High Performance Supercapacitors. Electrochem. Commun. 2008, 10, 1594–1597. [Google Scholar] [CrossRef]
- Rufford, T.E.; Hulicova-Jurcakova, D.; Khosla, K.; Zhu, Z.; Lu, G.Q. Microstructure and Electrochemical Double-Layer Capacitance of Carbon Electrodes Prepared by Zinc Chloride Activation of Sugar Cane Bagasse. J. Power Sources 2010, 195, 912–918. [Google Scholar] [CrossRef]
- Wu, M.b.; Li, R.c.; He, X.j.; Zhang, H.b.; Sui, W.b.; Tan, M.h. Microwave-Assisted Preparation of Peanut Shell-Based Activated Carbons and Their Use in Electrochemical Capacitors. New Carbon Mater. 2015, 30, 86–91. [Google Scholar] [CrossRef]
- Le Van, K.; Luong Thi, T.T. Activated Carbon Derived from Rice Husk by NaOH Activation and Its Application in Supercapacitor. Prog. Nat. Sci. Mater. Int. 2014, 24, 191–198. [Google Scholar] [CrossRef]
- Okman, I.; Karagöz, S.; Tay, T.; Erdem, M. Activated Carbons from Grape Seeds by Chemical Activation with Potassium Carbonate and Potassium Hydroxide. Appl. Surf. Sci. 2014, 293, 138–142. [Google Scholar] [CrossRef]
- Biswal, M.; Banerjee, A.; Deo, M.; Ogale, S. From Dead Leaves to High Energy Density Supercapacitors. Energy Environ. Sci. 2013, 6, 1249–1259. [Google Scholar] [CrossRef]
- Zaripov, Z.I.; Gumerov, F.M.; Khairutdinov, V.F.; Małgorzata, M.; Zorębski, E.; Dzida, M.; Abdulagatov, I.M. Thermal Conductivity and Thermal Diffusivity of Pyrrolidinium-BasedIonic Liquids at Atmospheric Pressure. Fluid Phase Equilib. 2019, 485, 135–145. [Google Scholar] [CrossRef]
- MacFarlane, D.R.; Meakin, P.; Sun, J.; Amini, N.; Forsyth, M. Pyrrolidinium Imides: A New Family of Molten Salts and Conductive Plastic Crystal Phases. J. Phys. Chem. B 1999, 103, 4164–4170. [Google Scholar] [CrossRef]
- Serafin, J.; Baca, M.; Biegun, M.; Mijowska, E.; Kaleńczuk, R.J.; Sreńscek-Nazzal, J.; Michalkiewicz, B. Direct Conversion of Biomass to Nanoporous Activated Biocarbons for High CO2 Adsorption and Supercapacitor Applications. Appl. Surf. Sci. 2019, 497, 143722. [Google Scholar] [CrossRef]
- Tseng, R.L.; Tseng, S.K.; Wu, F.C.; Hu, C.C.; Wang, C.C. Effects of Micropore Development on the Physicochemical Properties of KOH-Activated Carbons. J. Chin. Inst. Chem. Eng. 2008, 39, 37–47. [Google Scholar] [CrossRef]
- Bragg, W.L.; Bragg, W.H. The Structure of Some Crystals as Indicated by Their Diffraction of X-Rays. Proc. R. Soc. Lond. Ser. Contain. Pap. Math. Phys. Character 1913, 89, 248–277. [Google Scholar] [CrossRef]
- Ali, G.A.; Makhlouf, S.A.; Yusoff, M.M.; Chong, K.F. Structural and Electrochemical Characteristics of Graphene Nanosheets as Supercapacitor Electrodes. Rev. Adv. Mater. Sci. 2015, 41, 35–43. [Google Scholar]
- Saka, C. BET, TG–DTG, FT-IR, SEM, Iodine Number Analysis and Preparation of Activated Carbon from Acorn Shell by Chemical Activation with ZnCl2. J. Anal. Appl. Pyrolysis 2012, 95, 21–24. [Google Scholar] [CrossRef]
- Thommes, M.; Kaneko, K.; Neimark, A.V.; Olivier, J.P.; Rodriguez-Reinoso, F.; Rouquerol, J.; Sing, K.S.W. Physisorption of Gases, with Special Reference to the Evaluation of Surface Area and Pore Size Distribution (IUPAC Technical Report). Pure Appl. Chem. 2015, 87, 1051–1069. [Google Scholar] [CrossRef]
- Conway, B.E.; Pell, W.G. Double-Layer and Pseudocapacitance Types of Electrochemical Capacitors and Their Applications to the Development of Hybrid Devices. J. Solid State Electrochem. 2003, 7, 637–644. [Google Scholar] [CrossRef]
- Conway, B.E. Electrochemical Supercapacitors: Scientific Fundamentals and Technological Applications; Springer Science & Business Media: Berlin, Germany, 2013. [Google Scholar] [CrossRef]
- Fic, K.; Platek, A.; Piwek, J.; Frackowiak, E. Sustainable Materials for Electrochemical Capacitors. Mater. Today 2018, 21, 437–454. [Google Scholar] [CrossRef]
- Liu, K.; Zhou, Y.X.; Han, H.B.; Zhou, S.S.; Feng, W.F.; Nie, J.; Li, H.; Huang, X.J.; Armand, M.; Zhou, Z.B. Ionic Liquids Based on (Fluorosulfonyl)(Pentafluoroethanesulfonyl)Imide with Various Oniums. Electrochim. Acta 2010, 55, 7145–7151. [Google Scholar] [CrossRef]
- Nicotera, I.; Oliviero, C.; Henderson, W.A.; Appetecchi, G.B.; Passerini, S. NMR Investigation of Ionic Liquid-LiX Mixtures: Pyrrolidinium Cations and TFSI- Anions. J. Phys. Chem. B 2005, 109, 22814–22819. [Google Scholar] [CrossRef]
- Borodin, O.; Smith, G.D. Structure and Dynamics of N-Methyl-N-Propylpyrrolidinium Bis(Trifluoromethanesulfonyl)Imide Ionic Liquid from Molecular Dynamics Simulations. J. Phys. Chem. B 2006, 110, 11481–11490. [Google Scholar] [CrossRef]


| Symbol | Melting Point | Viscosity | Conductivity | Ref. |
|---|---|---|---|---|
| PYR13-TFSI | 12 | 63 | [33] |
© 2020 by the authors. Licensee MDPI, Basel, Switzerland. This article is an open access article distributed under the terms and conditions of the Creative Commons Attribution (CC BY) license (http://creativecommons.org/licenses/by/4.0/).
Share and Cite
Biegun, M.; Dymerska, A.; Chen, X.; Mijowska, E. Study of the Active Carbon from Used Coffee Grounds as the Active Material for a High-Temperature Stable Supercapacitor with Ionic-Liquid Electrolyte. Materials 2020, 13, 3919. https://doi.org/10.3390/ma13183919
Biegun M, Dymerska A, Chen X, Mijowska E. Study of the Active Carbon from Used Coffee Grounds as the Active Material for a High-Temperature Stable Supercapacitor with Ionic-Liquid Electrolyte. Materials. 2020; 13(18):3919. https://doi.org/10.3390/ma13183919
Chicago/Turabian StyleBiegun, Marcin, Anna Dymerska, Xuecheng Chen, and Ewa Mijowska. 2020. "Study of the Active Carbon from Used Coffee Grounds as the Active Material for a High-Temperature Stable Supercapacitor with Ionic-Liquid Electrolyte" Materials 13, no. 18: 3919. https://doi.org/10.3390/ma13183919
APA StyleBiegun, M., Dymerska, A., Chen, X., & Mijowska, E. (2020). Study of the Active Carbon from Used Coffee Grounds as the Active Material for a High-Temperature Stable Supercapacitor with Ionic-Liquid Electrolyte. Materials, 13(18), 3919. https://doi.org/10.3390/ma13183919