Abstract
The dissolution of the main metals (Cu, Zn, Sn, Pb and Fe) found in waste printed circuit boards (WPCBs) was investigated by electrochemical corrosion measurements (potentiodynamic polarization and electrochemical impedance spectroscopy (EIS)) in different bromide-based systems that could be used as lixiviants in hydrometallurgical route of metals recovery. The analysis of the corrosion products was carried out by X-ray diffraction (XRD) and X-ray photoelectron spectroscopy (XPS) measurements. All measurements showed that the addition of bromine in the electrolyte favors to great extents the dissolution process of all studied metals as compared to bromine-free electrolytes. In the investigated experimental conditions, the highest dissolution rates of the metals were obtained in acidic KBr solution containing 0.01 mol/L bromine and they decreased in the following order: Zn >> Sn > Pb > Fe > Cu. The XRD and XPS chemical assessment allowed the identification of the dissolution products formed on the metallic surfaces after exposure to the electrolytes. They consisted mainly of oxides in the case of Cu, Zn, Sn and Fe, while the presence of PbBr2 was also noticed on the lead surface. Based on the results of EIS and surface investigations, several models explaining the corrosion behavior of the metals were proposed and discussed. The obtained results demonstrate that all studied metals could be successfully leached using brominated solutions, providing a viable alternative for the selective and efficient recovery of the base metals from WPCBs through a multi-step hydrometallurgical processing route.
1. Introduction
The hydrometallurgical route is a selective way toward metal recovery from waste printed circuit boards (WPCBs), being easier to control and creating less environmental hazards than the pyrometallurgical approach [1]. Various leaching reagents were used to ensure a fast kinetics of the dissolution process of both noble and base metals: cyanide [2], thiosulfate [3,4], thiourea [5,6], H2SO4 (alone or in combination with H2O2, nitric acid or other oxidants) [7,8], potassium persulfate [9], etc. Much less often, halides-based systems such as I−/I2 [10,11,12], I2-H2O2 [13] and Cl−/Cl2 [14] were used. To the best of our knowledge, Br−/Br2 system was used before only for extraction of gold from gold ores [15]. Fast leaching rate, low-toxicity and applicability over a wide range of pH values (from acidic to neutral) are important characteristics of the bromide leaching system [16]. On the other side, because bromine is an efficient lixiviant, but because elemental bromine is hazardous and extremely difficult to store or transport in safe conditions, it is preferable to be produced in-situ, in the leaching reactor [15,17].
In a previous research [18], we investigated the ability of the Br−/Br2 leaching system to remove the exposed metallic parts from different models of computer motherboards (CMB), simultaneous with the electrochemical lixiviants regeneration and the partial electrodeposition of the dissolved metals. Although the operating parameters were not optimized, the results indicate that CMB could be completely dismantled in about 18 h, with cathodic and anodic mean current efficiencies of 43.6% and 58.4%, respectively. Taking into consideration that leaching plays a key role in the electrochemical recycling of WPCBs, a better understanding of the metals’ dissolution mechanisms in different lixiviants might be an important step in the processes’ optimization.
In the present work, a fundamental study on the electrochemical dissolution behavior of the main base metals (Cu, Zn, Sn, Pb and Fe) found in WPCBs was carried out by corrosion measurements (potentiodynamic polarization and electrochemical impedance spectroscopy) in different bromide-based systems that could be used as lixiviants in hydrometallurgical route of metals recovery. The paper aims at assessing the electrochemical dissolution rates of the metals and establishing their dissolution mechanisms in different bromide-based electrolytes.
To gain a deeper insight into the dissolution behavior of the investigated metals, the electrochemical results were corroborated with XRD and XPS analysis of the metallic surface, after the attack of the bromide-based lixiviants. These techniques allowed the identification of the surface compounds formed during the dissolution of the metals, which might validate the corrosion mechanisms proposed based on EIS measurements. This study is part of a more complex research project aiming to elaborate an innovative and pollutants-free electrohydrometallurgical technology for metals recovery from WPCBs.
2. Materials and Methods
2.1. Materials
The working electrodes were cylindrical probes made of different pure metals embedded in epoxy resin (EpoxycureTM, Buhler, Uzwil, Switzerland): Cu (0.28 cm2), Zn (0.27 cm2), Sn (0.28 cm2), Pb (0.27 cm2) and Fe (0.28 cm2). Note that the working electrodes were made of pure metals instead of waste PCBs materials, and therefore they should be defined as model electrodes, simulating the metals from circuits. The exposed metallic surfaces were prepared via an abrading procedure, using successive grade of silicon carbide paper grit (from 1200 to 4000), washed thoroughly with distilled water and ethanol.
Four different bromide-based electrolytes were used as corrosive solutions:
- -
- Sol. A: 2 M KBr (pH = 6);
- -
- Sol. B: 2 M KBr + 0.5 M HBr (pH = 0.3);
- -
- Sol. C: 2 M KBr + 0.5 M HBr (pH = 0.3) + 0.01 M Br2; and
- -
- Sol. D: 2 M KBr + 0.5 M HBr (pH = 0.3) + 0.001 M Br2.
The solutions were prepared using analytical grade reagents (Sigma Aldrich, Taufkirchen, Germany and Merck, Darmstadt, Germany) and distillated water.
2.2. Electrochemical Measurements
A three-electrode cell was used for the electrochemical experiments. The potentials were measured against Ag/AgCl/KClsat as a reference electrode (Ref), while a twisted platinum wire (Φ = 0.5 mm, L = 10 cm) was used as counter-electrode.
The electrochemical measurements were carried out using a Princeton Applied Research (PAR) model 2273 potentiostat (Princeton Applied Research, Oak Ridge, TN, USA, 2008). Before each measurement, the working electrodes were left for at least 1 h in the corrosive solution to obtain stable open circuit potentials (OCP). In each experiment, a fresh working electrode was used, and two measurements were performed to ensure the data reproducibility.
Potentiodynamic polarization curves were recorded at a constant sweep rate of 10 mV min−1, in a wide potential range of ±250 mV vs. OCP, from the cathodic to the anodic direction.
Impedance spectra were recorded at OCP, in the frequency range of 100 kHz–10 MHz, at 5 points per hertz decade, using an alternating voltage amplitude of ±10 mV. The experimental impedance data were modeled using ZSimpWin 3.21 software (EChem Software, MI, USA).
The electrochemical measurements were performed at room temperature, in the electrolytes under non-stirred and naturally aerated conditions.
2.3. X-ray Photoelectron Spectroscopy Measurements
X-ray photoelectron spectroscopy (XPS) data were collected using a custom built Thermofisher ESCALAB 250 Xi XPS spectrometer (Thermofisher, East Grinstead, UK) equipped with a scanning electron microscope and an X-ray detector for the acquisition of EDX data. XPS spectra were acquired using the Al Kα radiation (1486.6 eV). The data were collected from a circular surface with a radius of 650 µm. The sample’s surface was kept perpendicular to the analyzer axis for all experiments. The equipment was calibrated in the binding energy (B.E.) scale using an Au sample with the B.E. of the main Au peak observed at 84 eV. The C1s peak attributed to adventitious C was also used as a B.E. reference point for each sample. The B.E. for this peak was observed to vary between 284.6 and 285.1 eV between the samples. Survey scans were acquired in the constant analyzer energy mode (CAE) using a pass energy of 200 eV. High resolution narrow scans spectra were also recorded in the CAE mode using a pass energy of 15 eV. Depth profile experiments were performed using the lowest possible ion beam energy (typically 500 eV) to minimize the reduction of the chemical species. The XPS spectra were recorded and fitted using Avantage software (version 5.9915.0.6619, Thermofisher, East Grinstead, UK). The background was modeled by a “Smart” function type for all samples. The peak shape function was described by the product between a Lorentzian function and a Gaussian function with a mixing parameter of 30%. The mixing parameter was usually constrained to remain fixed.
XPS data were collected after different immersion times of the investigated metals in Sol. C, i.e., 60 min in the case of Cu, Sn and Zn and 120 min for Fe and Pb.
2.4. X-ray Diffraction Measurements
X-ray diffraction measurements (XRD) were carried out at room temperature on a Bruker D8 Advance powder diffractometer (Bruker, Karlsruhe, Germany) using Cu Kα1 radiation (λ = 0.154056 nm) at 45 kV and 40 mA. The θ–2θ Bragg–Brentano configuration geometry and incident-beam Ge (111) monochromator were used to investigate the structural properties of the samples. The 2θ range of 10°–85° was recorded at the rate of 0.02° and 2θ/0.5 s. XRD has a detection limit of ~5% by volume, if a compound is present below this level, no peaks above noise will be detected in the diffraction pattern. The exact detection limit depends on the density, Z number and crystal structure of the compounds in the sample. The crystal phases were identified comparing the 2θ values and intensities of reflections on X-ray diffractograms with JCP data base using a Diffraction AT-Brucker program.
Given the limitations of our structural detection, XRD diffractograms were collected after 120 h immersion of Cu, Zn, Sn, Pb and Fe electrodes in Sol. A, Sol. B and Sol. C, respectively.
3. Results and Discussions
3.1. Potentiodynamic Polarization Measurements
To investigate the dissolution behavior of the metals in different bromide-based electrolytes, potentiodynamic polarization measurements were performed at room temperature. Figure 1 illustrates the polarization curves obtained after 1 h immersion for the anodic and cathodic scans.
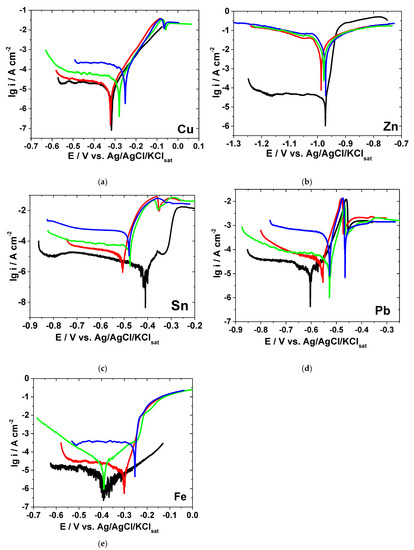
Figure 1.
Polarization curves collected after 1-h immersion of electrodes in different bromide-based electrolytes: Cu (a); Zn (b); Sn (c); Pb (d); and Fe (e). (—) Sol. A, (—) Sol. B, (—) Sol. C, (—) Sol. D.
The strong acidification of KBr solution, from pH = 6 to pH = 0.3, and the supplementary addition of Br2 affect the electrochemical behavior of the investigated metals in different ways, as discussed below.
Figure 1 shows that, in most cases, the cathodic polarization curves exhibit limiting diffusion plateaus, while the anodic dissolution branches present either a Tafel behavior or surface passivation. Consequently, the evaluation of the corrosion kinetic parameters (i.e., corrosion current density, corrosion potential, anodic and cathodic Tafel slopes) by Tafel extrapolation method over a wide potential range would lead to uncertainties and error sources.
Instead, in the close vicinity of the open-circuit corrosion potential, it is expected that the Stern–Geary theory [19] could be applied. It considers that both the anodic and cathodic processes follow the Tafel law and the global current density i could be expressed by the following Equation:
where icorr is the corrosion current density, Ecorr is the corrosion potential and ba and bc are the anodic and cathodic activation coefficients (V−1), respectively.
i = ia + ic = icorr{eba (E−Ecorr) – ebc (E−Ecorr)}
To yield quantitative approach, the electrochemical kinetic parameters (icorr, Ecorr, ba and bc) were then evaluated from the experimental data by a non-linear regression calculation near zero overall current. A user-defined function of “Non-linear least squares curve fitting” of Origin 9.3 software (OriginLab Corporation, Northampton, MA, USA) based on Equation (1) was applied in the potential domain limited to ± 50 mV with respect to Ecorr [20]. In all cases, the correlation factor R2 varied within 0.9828–0.9998, indicating good fitting results.
As an example, Figure 2 presents the polarization curves obtained by regression calculation in Sol. C overlaid on the experimental data represented by symbols.
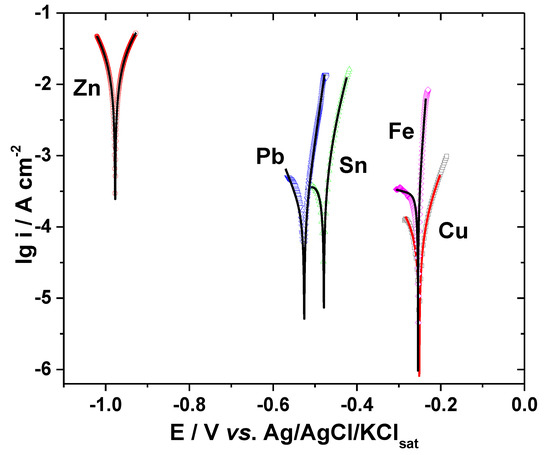
Figure 2.
Polarization curves of various metals in Sol. C. Symbols, experimental data; lines, calculated data by Stern–Geary.
The activation coefficients were linked to Tafel slopes, by the following Equation:
The calculated corrosion kinetic parameters corresponding to metal corrosion in different bromide-based electrolytes are illustrated in Table 1.

Table 1.
Corrosion kinetic parameters for metals in different bromide-based electrolytes.
In the case of Cu, the electrochemical behavior was found to be rather similar in all investigated electrolytes, as shown in Figure 1a. A very slight increase of the anodic and cathodic current densities could be noticed at high potentials in strong acidic KBr solution.
The addition of increasing Br2 concentrations shifts the Ecorr towards more positive values and markedly increases the corrosion current density (Table 1). For instance, the icorr value calculated in Sol. C is almost 7.5 times higher than that obtained in Sol. B. This corelates with an increased corrosion rate of Cu in the solution containing 0.01 M Br2. However, as shown in Figure 1a, the addition of Br2 mainly accelerates the cathodic reduction of the dissolved oxygen, which is under diffusion control, while the anodic dissolution of Cu is less affected. The increasing of the cathodic current density observed in the presence of bromide could be due to a reduction of the molecular Br2 that takes place in parallel with the oxygen reduction [21].
The anodic behavior of Cu in bromide-based electrolytes agrees with the results previously reported by other authors [22,23,24]. Thus, an apparent Tafel region with a slope of around 70 mV dec−1 could be observed on the anodic polarization curves obtained in the absence and presence of Br2. The anodic process occurring in this region might be related to the fast transformation of Cu into Cu+ ions, followed by the formation of soluble CuBr2− complexes [22,23]. As the potential becomes more positive, an anodic current peak appears at about −60 mV vs. Ref on the polarization curves obtained in brominated solutions. The subsequent decrease of the current density noticed in Figure 1a might be associated to the formation of a porous and insoluble layer of CuBr on the electrode surface [24]. Finally, a region of sudden increase in the current density appears to be due to the presence of the aggressive Br− ions reducing the adhesion properties of the adsorbed CuBr layer and leading to formation of soluble CuBr2− complexes, which might suffer dissolution into the bulk solution. It has also been reported that, at high potential values (>0.2 V vs. Ref), the presence of CuO on the metallic surface is rather common, among the predominant Cu2+ compounds [24].
As expected, Zn presents the most negative potential (−0.97 V vs. Ref) and the highest anodic activity in all investigated electrolytes (Figure 1b). In near neutral KBr solution, a well-defined cathodic diffusion plateau was observed on the polarization curves due to the oxygen reduction reaction, while the anodic current density increases exponentially for about four orders of magnitude, within a potential range of +50 mV from Ecorr, with an apparent anodic Tafel slope of 12.6 mV dec−1, slightly lower as compared to a previously reported value [25].
A marked shift in both cathodic and anodic branches of the polarization curves towards higher current densities could be noticed in the strong acidic electrolytes (Figure 1b), suggesting an important enhancement of Zn corrosion. Although the calculated Ecorr values in different electrolytes are rather similar (Table 1), the corrosion current density significantly increases as the solution’s pH decrease.
The changes in the anodic Tafel slopes suggest that the dissolution mechanism of Zn might occur by a different pathway in strong acidic KBr solution as compared to neutral one. Nevertheless, the addition of Br2 slightly accelerates the electrochemical reactions, but does not modify the mechanism of Zn corrosion. The large estimated cathodic Tafel slopes are consistent with the hypothesis of a diffusion limited reduction reaction.
In Sol. A, the region of active Sn dissolution observed at low potentials is followed by a narrow semi-passive region [26], characterized by lower anodic current density values (Figure 1c), due to the presence of a thin film of tin oxide on the electrode surface [27]. The passivity breakdown observed at −0.32 V vs. Ref could be related to the pitting induced by Br− ions at the oxide–electrolyte interface [28].
As revealed in Figure 1c, the Sn dissolution process is significantly favored by the electrolyte acidification. Moreover, the cathodic oxygen reduction reaction appears to be greatly enhanced by Br2 addition. In Table 1, an increase of icorr values can be noticed in all investigated acidic solutions, while the Ecorr values are shifted towards less noble values. The highest negative shift of Ecorr was observed in the presence of 0.01 M Br2. At this concentration, the corrosion current density presents its greatest value, which is about 29 and 285 times higher than icorr values obtained in Sol. B and Sol. A, respectively. The acceleration of Sn dissolution in strong acidic electrolytes might be due to adsorption of aggressive Br− ions at active sites of Sn surface, followed by the formation of soluble complexes transferred into the solution. As previously stated by Johnson and Liu [29], such complexing processes decrease the metallic ions concentration retarding the formation of the oxide passive layer. However, at around −0.35 V vs. Ref, a minimum peak current could be observed on the polarization curves obtained in strong acidic KBr solution, both in the absence and in the presence of Br2. Its interpretation is rather uncertain; some authors attributed it to the formation of Sn(IV) species [26], while others to some complex compounds formed on the metallic surface [28]. Nevertheless, the increased aggressiveness of Sol. C induces pitting corrosion, which explains the sharp increase of the current density values at high potentials (Figure 1c).
The anodic Tafel slopes present similar values regardless of the electrolyte’s nature, suggesting that the Sn dissolution mechanism is rather similar.
As shown in Figure 1d, the polarization curves of Pb were shifted towards more positive values in strong acidic KBr solutions, and even more in the presence of Br2. Although not very clearly seen in Figure 1d, a small transition region appears at around −0.58 V vs. Ref on the polarization curves obtained in Sol. A; it may correspond to the formation of a passivating layer on the metallic surface, which further dissolves as the potential become more positive. It may be inferred that the reactivation region is associated with the formation of soluble lead species, subsequent to the passivating step [30].
In strong acidic solutions, regardless the addition of bromine, the superficial corrosion products layer cannot impart passivity because its solubility is relatively high [30] and Pb surface dissolves readily leading to Pb2+ formation [31]. A similar behavior was previously noticed for Pb corrosion in chloride electrolytes [30].
At about −0.47 V vs. Ref, a sharp increase of the current density could be observed on the anodic part of the polarization curves in all investigated electrolytes. This decrease of the current density may be due to the formation of a layer corrosion products on Pb surface.
In Table 1, it is clear that the overall corrosion process of Pb is enhanced by the aggressiveness of bromine. Thus, the calculated icorr value reached 144.4 μA cm−2 in the presence of 0.01 M Br2, which is almost four time greater than the value obtained in Br2-free acidic solution (37.8 μA cm−2).
As previously reported, Pb corrosion in aqueous solutions might be represented by a two-electron transfer reaction [31]. Depending on the solution’s nature, this reaction may occur in a sequence of steps, in which the formation of monovalent intermediate is possible [31], as suggested by the low values of βa calculated in strong acidic solutions, in the absence and in the presence of Br2 (Table 1).
In the case of iron, Br− ion might adsorb on the electrode surface promoting the metal dissolution [32]. Consequently, no passivation of Fe surface was observed in the studied experimental conditions (Figure 1e). Particularly, the Br2 addition significantly enhances both the active dissolution of Fe and cathodic oxygen reduction, which is under diffusion control. Thus, the corrosion current density in the presence of 0.01 M Br2 is more than 38 and 76 times higher as compared to icorr values calculated in Sol. B and Sol. A, respectively. Moreover, a displacement of Ecorr towards more noble values takes place in Br2-containing solutions (Table 1). The low values of the anodic Tafel slopes calculated in all acidic electrolytes advises that some adsorbed intermediates might be involved in Fe corrosion mechanism.
3.2. Electrochemical Impedance Spectroscopy
The electrochemical dissolution behavior of the metals in different bromide-based systems was further investigated by electrochemical impedance spectroscopy (EIS). The impedance measurements were conducted at the open-circuit potentials and the obtained results are displayed as Nyquist diagrams and Bode plots in Figure 3, Figure 4, Figure 5, Figure 6 and Figure 7. The insets in Figure 3, Figure 4, Figure 5, Figure 6 and Figure 7 present some of the Nyquist diagrams in enlarged scale.
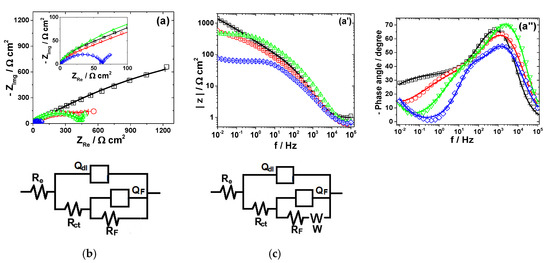
Figure 3.
EIS results of Cu after immersion in different bromide-based electrolytes: Nyquist diagrams (a); Bode plot of |Z| vs. frequency (a’); and Bode plot of phase angle vs. frequency (a”). The equivalent electrical circuits used to fit the EIS data (b,c). Symbols represent the experimental data and lines with cross (—+—) correspond to the simulated spectra. Electrolytes: (□) Sol. A; (O) Sol. B; (◊) Sol. C; and (Δ) Sol. D.
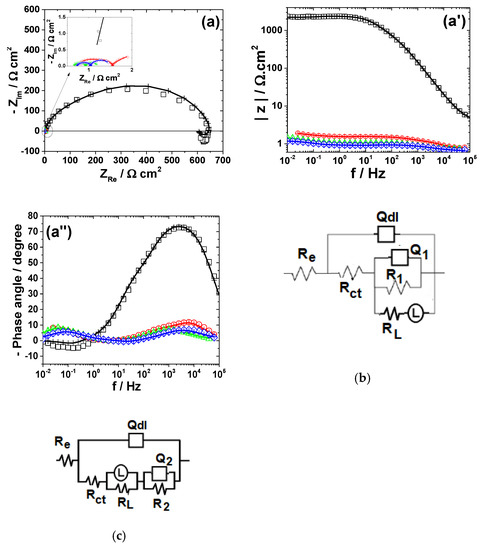
Figure 4.
EIS results of Zn after immersion in different bromide-based electrolytes: Nyquist diagrams (a); Bode plot of |Z| vs. frequency (a’); and Bode plot of phase angle vs. frequency (a”). The equivalent electrical circuits used for EIS fitting (b,c). Symbols represent the experimental data and lines with cross (—+—) correspond to the simulated spectra. Electrolytes: (□) Sol. A; (O) Sol. B; (◊) Sol. C; and (Δ) Sol. D.
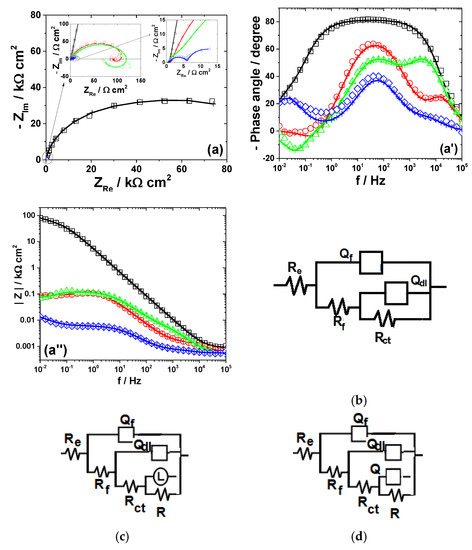
Figure 5.
EIS results of Sn after immersion in different bromide-based electrolytes: Nyquist diagrams (a); Bode plot of |Z| vs. frequency (a’); and Bode plot of phase angle vs. frequency (a”). The equivalent electrical circuits used for EIS fitting (b–d). Symbols represent the experimental data and lines with cross (—+—) correspond to the simulated spectra. Electrolytes: (□) Sol. A; (O) Sol. B; (◊) Sol. C; and (Δ) Sol. D.
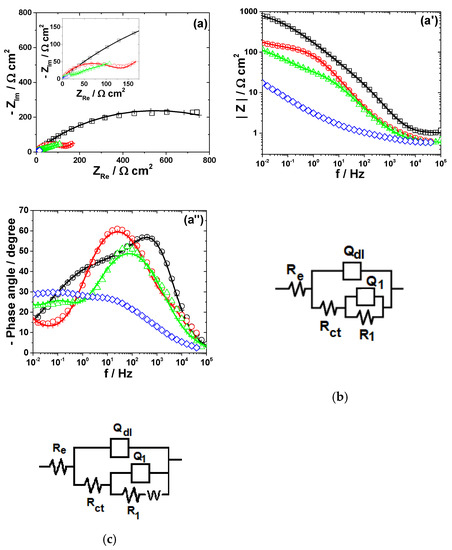
Figure 6.
EIS results of Pb after immersion in different bromide-based electrolytes: Nyquist diagrams (a); Bode plot of |Z| vs. frequency (a’); and Bode plot of phase angle vs. frequency (a”). The equivalent electrical circuits used for EIS fitting (b,c). Symbols represent the experimental data and lines with cross (—+—) correspond to the simulated spectra. Electrolytes: (□) Sol. A; (O) Sol. B; (◊) Sol. C; and (Δ) Sol. D.
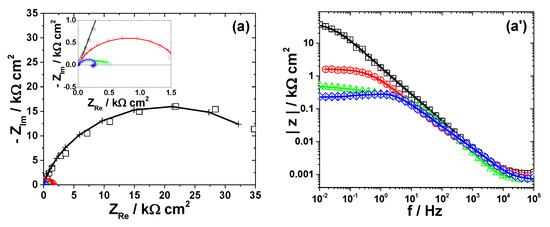
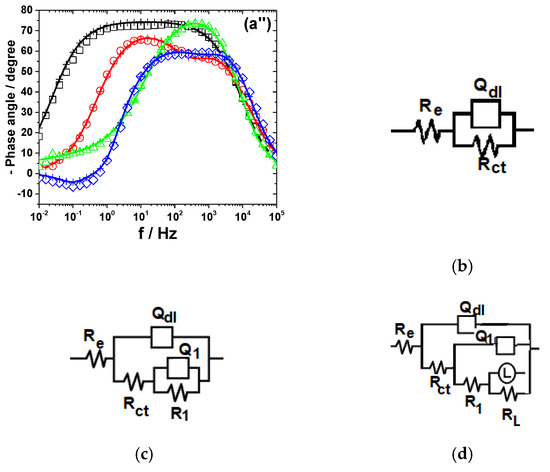
Figure 7.
Displays the impedance diagrams of Fe immersed in the studied electrolytes. EIS results of Fe after immersion in different bromide-based electrolytes: Nyquist diagrams (a); Bode plot of |Z| vs. frequency (a’); and Bode plot of phase angle vs. frequency (a”). The equivalent electrical circuits used for EIS fitting (b–d). Symbols represent the experimental data and lines with cross (—+—) correspond to the simulated spectra. Electrolytes: (□) Sol. A; (O) Sol. B; (◊) Sol. C; and (Δ) Sol. D.
As shown in Figure 3, Figure 4, Figure 5, Figure 6 and Figure 7, disregarding the metal, an important decrease of the impedance magnitude could be observed in strong acidic KBr solution as compared to the near neutral one, and even more in the presence of Br2, which is consistent with an increased dissolution rate of all metals in brominated electrolytes, in agreement with the potentiodynamic polarization results.
Before attempting to fit the experimental impedance data with electrical equivalent circuits, an evaluation of the EIS data validity with respect to linearity, causality and stability was carried out. For this purpose, Kramers–Kronig relations were applied to several experimental impedance data by transforming the real axis into the imaginary axis and the imaginary axis into the real axis and then comparing the transformed quantities with the corresponding experimental data [24]. The satisfactory agreement between the measured and transformed values (within the range of experimental errors) demonstrates that the experimental impedance data are consistent with K-K transformations and therefore stable, as shown in Section S1 (Figure S1).
EIS results obtained in Sol. A, Sol. B and Sol. C were further analyzed by numerical simulation, using different equivalent electrical circuits that allow estimation of the R-Q parameters corresponding to the electrochemical systems under investigation and might validate the proposed reaction mechanisms [31].
The capacitive contributions of the impedance plots were simulated using constant phase elements (CPE), represented by the terms Q and n, instead of a pure capacitors (C) due to the non-ideal behavior of the metallic surfaces. The semicircle depression is often explained by the surface heterogeneity, caused by surface roughness, formation of porous layers, defects in the crystal lattice, variations in the properties or compositions of the surface layers, adsorption and presence of impurities [33].
The impedance of CPE is given by [34]:
where Q represents a pre-exponential factor, which is a frequency-independent parameter with dimensions of Ω−1 cm−2 sn; j is an imaginary number; ω = 2πf is angular frequency in rad·s−1; and n is the exponent which defines the character of frequency-dependence (−1 ≤ n ≤ 1).
Q = ZCPE(ω) = [C(jω)n]−1
The values of the pseudo-capacitances (C) associated with CPEs were recalculated using the Equation:
The equivalent electrical circuits used for experimental EIS data simulation are illustrated together with the impedance diagrams in Figure 3, Figure 4, Figure 5, Figure 6 and Figure 7.
The used equivalent electrical circuits reproduce properly all experimental impedance, as could be seen in Figure 3, Figure 4, Figure 5, Figure 6 and Figure 7, where good overlapping between the measured data (represented by scattered symbols) and calculated ones (denoted by —+—) were obtained for all studied systems. The quality of the fitting procedures was also evaluated by the Chi-squared (χ2) values situated in 10−4–10−3 range and by the error percentages corresponding to each parameter of the used electrical circuits, which were mostly below 10%.
Since the physical meaning of the time constants used for impedance simulations was different, depending on the studied metal and electrolyte characteristics, a detailed discussion on their interpretation will be further provided.
3.2.1. Copper
The experimental EIS spectra obtained from Cu surface exposed to the bromide-based electrolytes are presented in Figure 3.
As shown in Figure 3a, the impedance diagrams of Cu in the investigated electrolytes are characterized by a semicircular appearance with badly separately capacitive loops. Although not clearly seen in Figure 3a, two-time constants are necessary to suitably reproduce the experimental data obtained in Sol. A and Sol. B. The equivalent electrical circuit [35,36] depicted in Figure 3b was adopted for these data simulations. In the equivalent circuit in Figure 3b, Re represents the electrolyte resistance, the high-frequency parameters (Rct−Qdl) correspond to the charge transfer resistance and double layer capacitance and the low frequency circuit represented by RF−QF was ascribed to a redox process involving the corrosion products (i.e., Cu2O and CuO) accumulated at the interface, based on the following reactions [20]:
Cu ↔ Cu+ad + e−
Cu+ad → Cu2+ + e−
The impedance spectra obtained in the presence of Br2 were fitted to the equivalent circuit in Figure 3b. It contains an additional Warburg impedance to account for the appearance of the diffusion tail observed at lowest frequency region in the EIS diagrams collected from Br2-containing electrolytes.
The R-Q parameters for Cu dissolution in different bromide-based electrolytes obtained by fitting the equivalent electrical circuits are given in Table 2.
Table 2.
Electrochemical parameters of Cu dissolution in different bromide-containing systems.
As shown in Table 2, the charge transfer resistance, Rct, values significantly decrease as the electrolyte’s pH becomes acidic and even more in the presence of 0.01 mM Br2. This decay of Rct is accompanied by an increase of the double layer capacitance Cdl. The corrosion process is faster in strong acidic electrolytes and Cu surface becomes coarser, leading to higher Cdl values. At the same time, the faradaic resistance calculated in Sol. C is more than 9 and 75 times lower than the RF values obtained in Sol. B and Sol. A, respectively. These results advise for an increased electrochemical reactivity of Cu in brominated electrolyte, in agreement with the polarization measurements.
3.2.2. Zinc
The experimental EIS spectra obtained from Zn electrode exposed to the bromide-based electrolytes are presented in Figure 4.
As shown in Figure 4, the impedance plots obtained during Zn dissolution in near neutral and strong acidic KBr electrolytes present different features, which indicates that some changes in the reaction mechanisms with the solution pH might occur.
Although the corrosion behavior of Zn in bromide [37] or bromine-containing solutions is scarcely reported [38], its dissolution mechanism in chloride-based electrolytes was subject to numerous investigations. The previously reported reaction models [39,40,41,42] involve several parallel steps of dissolution and three adsorbed species (Znad+, ZnOHad and Znad2+), depending on Zn surface preparation and the experimental conditions (pH, oxygen concentration and the presence of different oxidized species, i.e., oxide or hydroxide, on Zn surface) [43]. For example, Cachet and Wiart [39] proposed a reaction scheme for the dissolution of Zn in aerated ZnCl2 and NH4Cl which involves two parallel steps, stimulated by the presence of chloride ions:

The major path (2) is catalyzed by Zn+ads. The minor path (1), is much more dependent on the diffusion of the chloro-zinc species than the major one. The formation of ZnOHads is considered a side reaction, which is caused by the chemical oxidation of Zn by the electrolyte. Close to the rest potential, additional difficulties come from the competition between the slow chemical formation of the oxidized protective layer and its elimination under the effect of Zn dissolution [41].
This study found that the impedance corresponding to Zn corrosion in Sol. A could be suitably represented using two time constants under capacitive relaxation and an inductive contribution at low frequency, according to the electrical circuit in Figure 4b. The two capacitive loops were ascribed to the charge transfer process (Rct−Qdl) and the coverage relaxation of an adsorbed Znad+ intermediate (R1−Q1), respectively. The appearance of an inductive loop (RL−L) in the low frequency-end was assumed to be due to the relaxation of an oxidized intermediate species (i.e., ZnOHad); its formation might express the chemical oxidation of Zn by the electrolyte [41]. This very thin layer of oxidized Zn species might present some protective properties on the metallic surface [41,42,44]. As discussed below, the low value of Cdl (5.5 μF cm−2) obtained in Sol. A is consistent with the presence of a protective layer on Zn surface. Furthermore, the presence of a thin layer of ZnO on the metallic surface was identified in the XRD pattern of Zn exposed for 120 h to Sol. A, according to the data in Figure 8b.
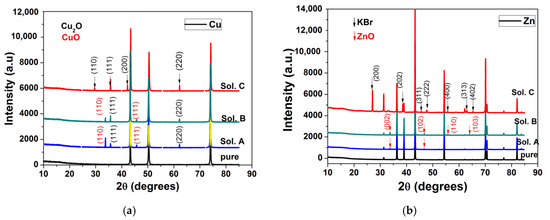
Figure 8.
XRD diffractograms collected before and after 120 h immersion of electrodes in different bromide-based electrolytes: Cu (a); Zn (b); Sn (c); Pb (d); and Fe (e).
The decrease in the solution pH significantly favors the Zn dissolution process, hindering the formation of the oxidized species on the metallic surface. This might explain the vanishing of the inductive loop at low frequency [25]. Nevertheless, the appearance of a small inductive loop at intermediate frequency (~10 Hz) between two capacitive contributions could be noticed in strong acidic electrolytes, both in the absence and in the presence of Br2 (Figure 4a) [25,41]. The similar features of the impedance diagrams obtained in strong acidic electrolytes, regardless of the presence of Br2, confirm that a similar dissolution mechanism of Zn is involved, in agreement with the polarization measurements. Thus, the inductive loop was attributed to the relaxation of the adsorbed Znad+ intermediate, while the low-frequency capacitive semicircle might be associated to the formation of Znad2+ species during the dissolution reaction [45,46]. However, as shown in Figure 4a, the maximum frequency of the second capacitive loop is very low, which allowed us to assume that the formation and consumption of the adsorbed intermediate occurs in parallel with the main dissolution path [46].
The impedance diagrams of Zn dissolution in strong acidic KBr solutions were accurately simulated using the equivalent circuit in Figure 4c and several calculated R-Q parameters are presented in Table 3.
Table 3.
Electrochemical parameters of Zn dissolution in different bromide-containing electrolytes.
As shown in Table 3, the charge transfer resistance Rct presents a similar pH dependence as the icorr values calculated from polarization measurements; it decreases from about 322.9 Ω cm2 in Sol. A to 0.87 Ω cm2 in Sol. B, confirming that Zn suffers severe corrosion in strong acidic KBr electrolyte. The addition of Br2 accelerates to some extent the dissolution process, as proved by the Rct value which is more than three orders of magnitude lower in the presence of 0.01 M Br2, as compared to its absence. Additionally, the significant increase of Cdl values in Br2-containing electrolytes corroborates the formation of coarse surface during Zn dissolution, as revealed by SEM micrograph (results shown in Figure S2).
3.2.3. Tin
The impedance spectra of Sn exposed to different bromide/bromine electrolytes are illustrated in Figure 5.
As shown in Figure 5a, the Nyquist diagram obtained for Sn corrosion in near neutral KBr solution consists of a wide capacitive contribution, with a large imaginary part at the lowest frequency. The attempts to represent the EIS data of Sn exposed to Sol. A by one time constant circuit were found inappropriate and two time constants were required to accurately reproduce the experimental results. As revealed in Figure 5b, the model adopted for simulation includes one couple, Rf−Qf, ascribed to the capacitance and resistance of a thin passive layer composed of tin oxides, formed on the metallic surface [47] and the Rct−Qdl parameters corresponding to the charge transfer resistance and double layer capacitance. The XRD measurements performed after 5 h immersion of Sn in Sol. A did not detected the presence of any corrosion products (results not shown here) because their amount was too small [48]. Instead, the occurrence of SnO2 on the surface was evidenced in the XRD diffractogram obtained at longer exposure time (Figure 8c).
An additional inductive loop at low frequencies is observed in EIS spectra corresponding to Sn corrosion in strong acidic KBr electrolytes, both in the absence and in the presence of 0.001 M Br2 (Figure 5c). Several models of equivalent circuits were attempted to fit these experimental data. The best agreement between experiment and fitting was obtained using the equivalent circuit in Figure 5c. It contains an additional (RL−L) couple proposed to account for the low-frequency inductive time constant, which might be attributed to the pitting corrosion induced by Br− ions on Sn surface [49]. However, as the concentration of Br2 increases to 0.01 M, the low-frequency inductive loop becomes capacitive and the equivalent circuit in Figure 5d was used to simulate the corresponding impedance.
Table 4 illustrates the equivalent circuit parameters calculated for Sn dissolution in the investigated electrolytes.
Table 4.
Electrochemical parameters of Sn dissolution in different bromide-containing solutions.
The strong passivation of tin in Sol. A is confirmed by the high values of Rf and Rct (Table 4). As the electrolyte become more acidic, the resistance of the thin SnO2 layer formed on Sn surface Rf and the charge transfer resistance of the underlying metal Rct significantly decrease. In parallel, important increases of Cf and Cdl values were observed in Sol. C. These results correlate with a passivity breakdown in strong acidic electrolytes [50], leading to higher corrosion rates and much rougher surfaces with enlarged areas. The presence of 0.01 M Br2 additionally accelerates the active Sn dissolution, in accordance to the outlined conclusions of the potentiodynamic measurements.
3.2.4. Lead
Figure 6 presents the impedance spectra measured on Pb electrode exposed to different bromide-based electrolytes and the electrical equivalent circuits used for data simulation.
The development of more than one time constant could be noticed in all impedance spectra corresponding to Pb corrosion (Figure 6). The Bode plot for Pb dissolution in Sol. A shows two maxima in the phase, which were interpreted according to the equivalent circuit in Figure 6b. The first time constant at high frequencies was ascribed to the double layer capacitance Qdl connected in parallel with the charge transfer resistance Rct, while the second one corresponds to some adsorbed species that contributes to the formation of the corrosion layer [51]. An additional Warburg tail associated to a diffusion process at the metallic surface was noticed in the impedance diagram of Pb exposed to Sol. B. Accordingly, the corresponding EIS data were interpreted in terms of the equivalent circuit depicted in Figure 6b and the calculated R-Q parameters are shown in Table 5.
Table 5.
Electrochemical parameters of Pb dissolution in bromide-containing solutions.
As expected, the fast dissolution of Pb in strong acidic brominated electrolytes was confirmed by the low values of Rct and R1 (Table 5). The attempts to simulate the EIS data obtained for Pb corrosion in solutions containing Br2 with different electrical equivalent circuits did not allow a satisfactory agreement between the used models and experimental results. A possible explanation could be related to the complexity of the electrochemical processes taking place at Pb surface in the presence of Br2, leading to the formation of various compounds, i.e., Pb3O4 and PbBr2, which complicate the corrosion mechanism. However, the decrease of the overall impedance and phase angle in Sol. C noticed in Figure 6 correlates with an important increase of Pb corrosion rate in brominated electrolytes.
3.2.5. Iron
The Nyquist diagram of Fe exposed to Sol. A shows a wide depressed capacitive contribution, which was interpreted according to the Randles circuit model in Figure 7b [52]. Instead, two time constants are clearly visible in the Bode plots obtained in Sol. B and Sol. D, suggesting that the mechanism of Fe corrosion in strong acidic electrolytes might involve one adsorbed intermediate (i.e., Fead+) covering the electrode surface [53]. The relaxation process of the adsorbed intermediate was represented by R1−Q1 circuit nested in the typical Rct−Qdl network, as revealed in Figure 7c.
An inductive loop in the low-frequency domain could be observed for Fe corrosion in Sol. C. It could originate from the relaxation process of some adsorbed intermediate species formed on Fe surface [54]. The equivalent circuit in Figure 7d, containing the RL−L inductive elements, was used for these data simulations. It should be noted that similar impedance results were obtained in the case of Fe dissolution in NaCl solutions of pH = 0, 1, 2, 3, 4 [55].
Table 6 presents the values of R-Q parameters obtained by fitting the experimental data corresponding to Fe corrosion in different bromide-based electrolytes to the equivalent electrical circuits in Figure 7.
Table 6.
Electrochemical impedance parameter values for the corrosion of Fe in various bromide-based electrolytes.
As expected, the electrochemical dissolution of Fe is enhanced by the decrease of solution pH, as revealed by the low values of Rct and R1 obtained in Sol. B (Table 6). The addition of Br2 further accelerates the corrosion process, i.e., Rct and R1 values are more than six times lower in Sol. C as compared to Sol. B.
3.3. Ex-Situ Examinations
3.3.1. XRD Measurements
The XRD spectra of Cu, Zn, Sn, Pb and Fe obtained after 120-h immersion in different bromide-based electrolytes are shown in Figure 8.
Prior to XRD measurements, the above-mentioned metallic samples were mechanically and chemically cleaned to remove any traces of corrosion from their surface. XRD diffractograms for all cleaned samples (pure curves in Figure 8) show that they are pure, without traces of oxides or other compounds on their surface.
The long immersion of the metals in different bromide-based electrolytes induces structural modifications for all electrodes, as shown in their XRD diffractograms. In the case of Cu electrode immersed in Sol. A and Sol. B, the XRD diffractograms shows a combination of CuO and Cu2O phases. By exposing the Cu electrode to Sol. C, the corrosion products change their composition and XRD diffractograms show only peaks related to the Cu2O phase. In the case of Sn, the additional diffraction peaks appearing in the diffraction pattern after 120 h were assigned to SnO2 and their intensity increases in Sol. C. In the case of Pb the influence of the Sol. C is more obvious. The peaks in the XRD diffractograms were indexed with red arrows (for PbBr2 phase) and black arrows (for Pb3O4 phase). The predominance of PbBr2 becomes visible.
The XRD diffractograms of Zn and Fe after immersion in Sol. A and Sol. B reveal the presence of corrosion products, i.e., Fe3O4 and ZnO, respectively. Instead, the XRD diffractograms for Fe immersion in Sol. C show only the peaks corresponding to KBr.
From the XRD diffractograms obtained on the metal electrodes, a preferential orientation tendency of the crystallites of the corrosion products was observed according to certain crystallization planes. To study the effect of dissolution of metals in different bromide-based systems on the preferential orientation of crystallites, we assessed the X-ray diffractograms obtained on samples exposed to these solutions for 120 h. The relative values of the intensities of the diffraction peaks for all samples are presented in Table 7.
Table 7.
Preferential orientation tendency of the crystallites of the corrosion products in different bromide-based electrolytes.
In the case of Cu and Sn electrodes, a preferential orientation of the crystallites of the corrosion products is observed according to the diffraction planes (111) for Cu2O and (110) for SnO2. The increase in the intensity ratios after these diffraction planes indicates that the corrosion products become more stable [56], in agreement with potentiodynamic polarization and EIS measurements. In the case of Pb electrodes, the small variation of the I110/I211 ratio of the intensities around 1 for Pb3O4 is probably due to the fact that the formation of the corrosion product PbBr2 is more accentuated, as can be seen in Figure 8c.
For the Fe and Zn electrodes, a preferential orientation on the c direction of the crystallites of the corrosion products is observed, according to the diffraction planes (001) for Fe3O4 and (002) for ZnO. The decrease in the solution pH significantly influences the Fe and Zn dissolution process, preventing the formation of oxidized species on the metallic surface, consistent with EIS measurements.
3.3.2. XPS Measurements
To get deeper insight into the corrosion processes taking place on the metallic surfaces after 60–120 min immersion in Sol. C, X-ray photoelectron spectroscopy was used. XPS might act as a valuable tool for studying the initial stages of corrosion, when the layer of formed corrosion products may be too thin for bulk sensitive methods such as for X-ray diffraction.
Cu Samples
The elements identified in the survey scans of Cu samples are Cu, O, Br, K, C and Si. As expected, sample degradation due to X-ray exposure was observed (Figure 9). The sample degradation was measured by repeating the Cu 2p narrow scan acquisition for 10 iterations and subsequently fitting the spectra. Figure 9 shows the changes in the Cu 2p narrow scan data due to sample degradation and the fit of the initial dataset (Iteration 0). The peak shift observed on the left side of the figure is ascribed to charging effects. At least two contributions are required to fit the data, which were ascribed to Cu2+ and Cu1+, respectively.
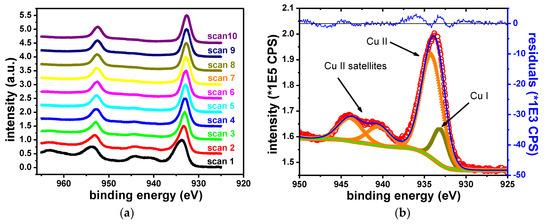
Figure 9.
Copper sample degradation (a) and fit of the initial narrow scan (b).
Table 8 gives the binding energies of the two contributions and their attributed oxidation states. The initial spectrum shows satellite features at the following binding energies: 940.5, 943.9 and 962.1 eV, which are specific to Cu2+ state [57]. The Cu 2p3/2 contribution associated with Cu2+ was observed at 934.2 eV. The Cu 2p3/2 contribution associated with Cu1+ was observed at 932.6 eV, in agreement with formerly reported results [58,59,60]. With the prolonged X-ray exposure, Cu2+ satellite features vanish. The intensity of the Cu 2p3/2–Cu2+ peak decreases. Conversely, the intensity of the Cu 2p3/2–Cu1+ peak increases. This indicates the reduction of the Cu2+ component. The degradation of Cu2+ compounds during XPS measurements is a well-known occurrence [44,61].
Table 8.
Cu2p3/2 fit parameters (referenced to adventitious carbon C1s peak at 285.1 eV).
The ratio of the two oxides was estimated by adding the contribution of the Cu2+ satellite peaks to the contribution of the main Cu2+ peak. Table 9 shows the quantification results.
Table 9.
Cu oxide ratios.
The O1s peak presents three components which can be ascribed to organic contaminations and to metallic oxides, respectively. The component ascribed to metallic oxides is observed at 530.1 eV, in accordance with the values previously reported for Cu2O, which are in the range of 530.2–530.7 eV [62,63].
The presence of K along with Br could indicate the presence of recrystallized KBr traces on the sample. The measured B.E. of the K2p3/2 and Br3p3/2 electrons are consistent with the expected values for KBr. The K2p3/2 peak is observed at 292.9–293.0 eV and the Br3p3/2 peak is observed at 182.1 eV. Typical values reported in the literature are in the range of 292.9–293.1 eV for K in KBr [64,65] and 182.1 eV for Br in NaBr [66]. Depth profile experiments (Figure 10) showed a parallel variation of peak intensity for the K2p3/2 and the Br3p3/2 photoelectrons with the etching time. This further indicates the presence of KBr.
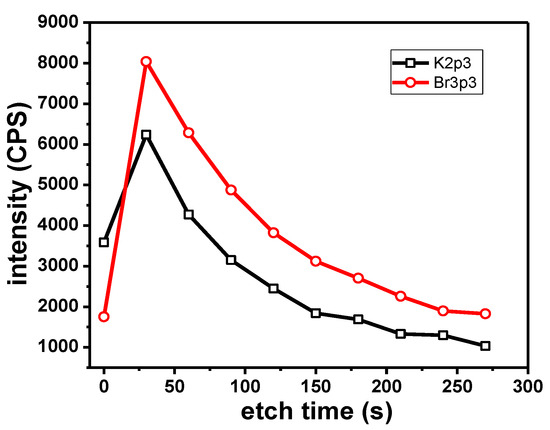
Figure 10.
Variation of K (black) and Br (red) peak intensity with etching time.
Zn Samples
The main elements identified in the case of the Zn sample are Zn, K, Br, C and O. The C1s peak of the adventitious species was observed at 285.0 eV. Zn is observed in the Zn2+ oxidation state on the “as received” sample. The Zn 2p3/2 peak appears at 1022.5 eV, in agreement with previously reported values for ZnO or Zn(OH)2 [44,67]. During depth profile experiments, the peak shape of the Zn 2p and of the Zn LMM electrons indicates the emergence of metallic Zn. No metallic Zn is observed before sputtering.
Figure 11 shows the narrow scans for the two types of electrons. The XPS electrons are shown after 150 s of etching. The X-ray induced Auger electrons are presented after 120 s of etching. In both examples, oxide and metallic contributions are clearly visible. This highlights the presence of the 2+ oxide state before etching.
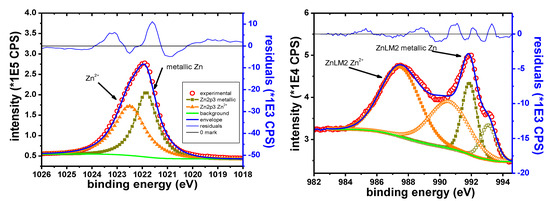
Figure 11.
Zn 2p narrow scan (left), Zn LMM narrow scan (right).
Table 10 shows the B.E. and the K.E. values corresponding to the two oxidation states.
Table 10.
B.E. and K.E. values for Zn peak contributions/oxidation states.
The measured ratios of Zn:O could be useful in assigning the chemical composition. The Znoxide: O atomic ratio is 49.7:50.3. This is close to the 1:1 expected ratio for ZnO.
Figure 12 shows the O1s scan after 270 s of etching. The peak at 531.0 eV was attributed to Zn oxide, in accordance with other reported data [44,67]. The peaks from 532.2 and 533.1 eV correspond to adventitious organic species. The peak intensity in the case of the organic components is decreasing rapidly with sputtering, although the peaks remain detectable throughout the entire depth profile experiment.
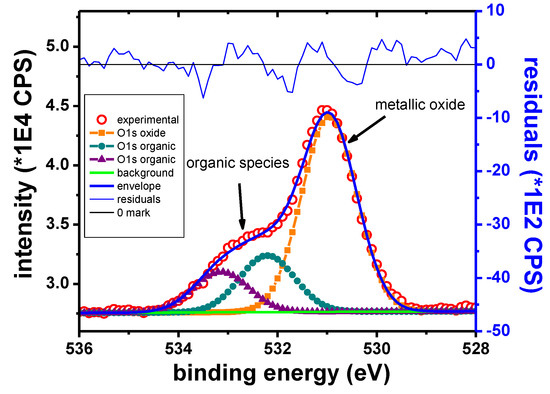
Figure 12.
O1s narrow scan, Zn sample.
K and Br are also observed for the Zn sample, but the two elements are removed from the sample at the same rate during the depth profile experiment. It could therefore be inferred that they belong to the same compound, namely KBr.
Sn Samples
In the case of the Sn sample, the main elements identified in the XPS survey spectra are Sn, O, K, Br and C. The Sn 3d5/2 narrow scan presented in Figure 13 shows two well separated peaks. These peaks are identified as corresponding to the metallic and Sn4+ states, respectively, according to their B.E values (Table 11).
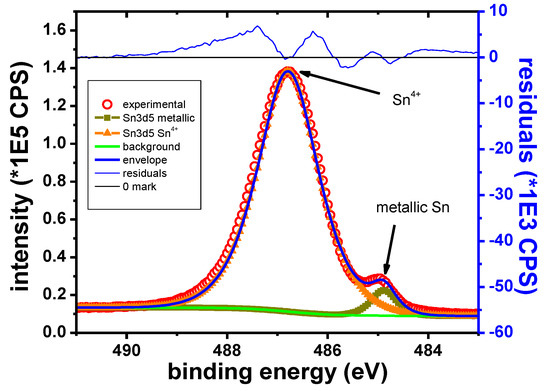
Figure 13.
Sn 3d5/2 narrow scan, Sn sample.
Table 11.
B.E. values for Sn (with reference the C1s peak due to adventitious C which is observed at 285.0 eV).
Figure 14 shows the O1s peak for the Sn sample after 15 s of etching. Contributions from organic compounds and the inorganic oxide are initially observed. The O1s peak attributed to metallic oxides was observed at 530.4 eV. During the depth profile, the organic contributions vanish rapidly. The inorganic contribution remains visible as long as the Sn4+ peak remains visible. This behavior is consistent with the presence of Sn oxide on the surface. Because Sn was found in Sn4+ state, it was assumed that the sample surface contains SnO2.
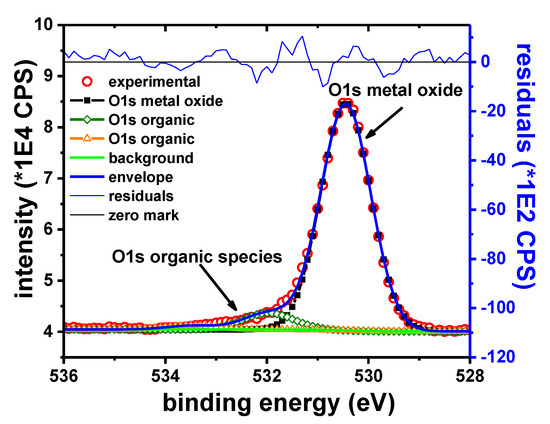
Figure 14.
O1s narrow scan, Sn sample.
Pb Samples
The main elements observed in the XPS survey spectra of the Pb sample were only Pb, Br, C and O. The C1s peak is observed at 285.0 eV. C and O are ascribed only to the adventitious organic species. The intensity of these peaks is decreasing rapidly and at the same rate, suggesting that both elements belong to the same compounds.
Figure 15 shows the narrow scan on the Pb 4f7/2 peak. The two observed components are attributed to metallic Pb and Pb2+, respectively. The B.E. of Pb 4f7/2 peak observed at 139.0 eV is consistent with the presence of PbBr2 on the surface of the Pb sample, in agreement with previously reported data [69,70]. The Br 3d5/2 peak was observed at 68.8 eV. When Br is forming PbBr2, a similar Br 3d5/2 peak was reported at 68.7 eV [71].
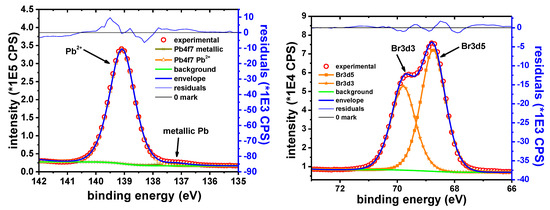
Figure 15.
Pb 4f7/2 narrow scan (left); and Br 3d narrow scan (right).
Table 12 shows the experimentally determined B.E. values for the two Pb components and the assigned oxidation states.
Table 12.
B.E. values for Pb.
The Pb:Br ratio determined from the XPS data is in the range of 35.6:64.4 ≈ 1:1.81, which is close to the expected 1:2 ratio. It should be noted that the occurrence of PbBr2 on lead surface was also confirmed by XRD measurements.
The featureless residue obtained with only two components, the relatively narrow Pb2+ peak and the rapid decrease of the O1s peak intensity, suggests the absence of any other Pb2+ containing compounds. This is in contrast with XRD data, which indicated the occurrence of Pb3O4 on the sample, along with PbBr2. The absence of Pb3O4 in the XPS spectra could be the result of the different scanning depth and/or different scanning area typical for the two techniques. The metallic component of the Pb 4f7/2 peak is probably the effect of sample reduction due to the Ar sputtering.
Fe Samples
The elements identified in the XPS spectra for the Fe sample are Fe, O, K, Br and C.
Figure 16 shows the Fe 2p3/2 narrow scan spectrum, collected on the sample, before (left) and after 15 s of etching (right).
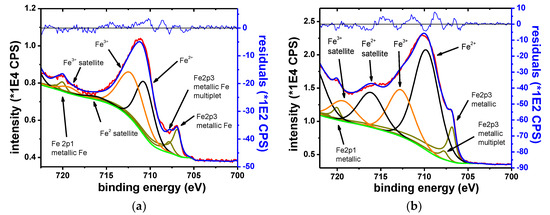
Figure 16.
Fe 2p3 narrow scan, initial spectrum (a) and spectrum after 15 s of etching (b).
The narrow scans showed that Fe was found in three oxidation states, namely metallic, Fe2+ and Fe3+. Before etching, the spectra is dominated by the oxide contributions. After etching, the metallic component becomes dominant. The metallic component shows multiplet splitting. The oxide phases show characteristic satellite features. The chemical states are identified according to the B.E. at which they are observed and by their satellite fingerprint. The observed results agree with the previously reported values [44,72,73].
Table 13 shows the B.E. of Fe components and their respective oxidation states.
Table 13.
B.E. values for Fe.
The O1s peak shows contributions from organic species and inorganic oxides. The two types of contributions can be separated based on their response to the Ar ion etching. The organic contributions vanish more quickly than the contributions associated to the Fe oxides. As expected, the presence of KBr on the metallic surface was also evidenced.
4. Conclusions
Based on the obtained results, some conclusions can be drawn:
- Electrochemical measurements showed that the addition of bromine to the system favors to a great extent the dissolution process of all studied metals as compared to bromine-free electrolytes. Better understanding of the reaction mechanisms and evaluating the electrochemical parameters of the systems are necessary before any technological approach. The results of the study concern the dissolution processes, but at the same time they open a real possibility to recover the metals of practical importance from bromine-based systems.
- In the investigated experimental conditions, the highest dissolution rates of the metals were obtained in acidic bromide solution containing 0.01 M Br2 and they vary in the following order: Zn >> Sn > Pb > Fe> Cu.
- XPS chemical assessment allowed the identification of the dissolution products formed on the metallic surfaces after exposure to bromine-containing solution in initial stages of the corrosion process. They consist mainly of metallic oxides in the case of Cu, Zn, Sn and Fe samples, while the presence of a layer of PbBr2 was noticed on the Pb surface.
- XRD measurements showed that the immersion of the metals in different bromide-based electrolytes induces structural modifications for all electrodes. From the XRD diffractograms obtained on all studied metals, a preferential orientation tendency of the crystallites of the corrosion products was observed according to certain crystallization planes.
- The bromide-based systems are promising alternatives for lixiviants in hydrometallurgical route of metals recovery from WPCBs. Since the major economic driver for WPCBs recycling relies on the efficient metal recovery, in a first step, an effective dissolution of the raw material is necessary. The results of our work show that all studied metals could be successfully leached by using bromine-based systems and indicate good premises for selective and efficient metal recovery through a multi-step hydrometallurgical processing route.
Supplementary Materials
The following are available online at https://www.mdpi.com/1996-1944/13/16/3630/s1, Figure S1: Comparison of the experimental impedance data corresponding to the corrosion of different metals in sol. C and the transfer function calculated using K–K relations. Metals: (a) Cu; (b) Zn; (c) Sn; (d) Pb; (e) Fe. Experimental data: (●) Real component (Z’); ( ) Imaginary component (Z”); Calculated points: (■) Real component (Z’); (
 ) Imaginary component (Z”), Figure S2: SEM micrographs of the metallic specimens after different immersions times in sol. C: 60 minutes in the case of Cu (a), Sn (b), Zn (c) and 120 minutes for Pb (d) and Fe (e). Inserts: SEM pictures in enlarged scales.
) Imaginary component (Z”); Calculated points: (■) Real component (Z’); () Imaginary component (Z”), Figure S2: SEM micrographs of the metallic specimens after different immersions times in sol. C: 60 minutes in the case of Cu (a), Sn (b), Zn (c) and 120 minutes for Pb (d) and Fe (e). Inserts: SEM pictures in enlarged scales.Author Contributions
Conceptualization, S.V., S.-A.D., L.M.M., D.M. and P.I.; Data curation, A.O., R.B. and D.M.; Formal analysis, S.V., A.O. and D.M.; Funding acquisition, S.-A.D. and P.I.; Investigation, S.V., A.O., R.B., M.P. and D.M.; Methodology, S.V., S.-A.D., A.O., L.M.M. and D.M.; Project administration, S.-A.D. and P.I.; Resources, S.-A.D. and P.I.; Supervision, S.V.; Validation, S.V., R.B. and M.P.; Visualization, S.V., S.-A.D., L.M.M., M.P., D.M. and P.I.; Writing—original draft, S.V., A.O., L.M.M. and D.M.; and Writing—review and editing, S.V., S.-A.D., A.O., L.M.M., D.M. and P.I. All authors have read and agreed to the published version of the manuscript.
Funding
This work was supported by a grant of the Romanian Ministry of Research and Innovation, CCCDI-UEFISCDI, project number PN-III-P1-1.2-PCCDI-2017-0652/84PCCDI⁄ 2018, within PNCDI III.
Conflicts of Interest
The authors declare no conflict of interest.
References
- Kaya, M. Recovery of metals and nonmetals from electronic waste by physical and chemical recycling processes. Waste Manag. 2016, 57, 64–90. [Google Scholar] [CrossRef] [PubMed]
- Montero, R.; Guevara, A.; De la Torre, E. Recovery of gold, silver, copper and niobium from printed circuit boards using leaching column. J. Earth Sci. Eng. 2012, 2, 590–595. [Google Scholar]
- Ha, V.H.; Lee, J.; Jeong, J.; Haia, H.T.; Jha, M.K. Thiosulfate leaching of gold from waste mobile phones. J. Hazard. Mater. 2010, 178, 1115–1119. [Google Scholar] [CrossRef] [PubMed]
- Abbruzzese, C.; Fornari, P.; Massidda, R.; Vegliò, F.; Ubaldini, S. Thiosulphate leaching for gold hydrometallurgy. Hydrometallurgy 1995, 39, 265–276. [Google Scholar] [CrossRef]
- Behnamfard, A.; Salarirad, M.M.; Veglio, F. Process development for recovery of copper and precious metals from waste printed circuit boards with emphasize on palladium and gold leaching and precipitation. Waste Manag. 2013, 33, 2354–2363. [Google Scholar] [CrossRef]
- Jing-ying, L.; Xiu-li, X.; Wen-quan, L. Thiourea leaching gold and silver from the printed circuit boards of waste mobile phones. Waste Manag. 2012, 32, 1209–1212. [Google Scholar] [CrossRef]
- Birloaga, I.; De Michelis, I.; Ferella, F.; Bazatu, M.; Veglio, F. Study on the influence of various factors in the hydrometallurgical processing of waste printed circuit boards for copper and gold recovery. Waste Manag. 2013, 33, 935–941. [Google Scholar] [CrossRef]
- Kumar, M.; Lee, J.; Kim, M.; Jeong, J.; Yoo, K. Leaching of metals from waste printed circuit boards (WPCBs) using sulfuric acid and nitric acids. Environ. Eng. Manag. J. 2014, 13, 2601–2607. [Google Scholar] [CrossRef]
- Syed, S. A green technology for recovery of gold from non-metallic secondary sources. Hydrometallurgy 2006, 82, 48–53. [Google Scholar] [CrossRef]
- Xu, Q.; Chen, D.; Chen, L.; Huang, M.H. Gold leaching from waste printed circuit board by iodine process. Nonferrous. Met. 2010, 62, 88–90. [Google Scholar]
- Altansukh, B.; Haga, K.; Ariunbolor, N.; Kawamura, S.; Shibayama, A. Leaching and adsorption of gold from waste printed circuit boards using iodine-iodide solution and activated carbon. Eng. J. 2016, 20, 29–40. [Google Scholar] [CrossRef]
- Serpe, A.; Rigoldi, A.; Marras, C.; Artizzu, F.; Mercuri, M.L.; Deplano, P. Chameleon behaviour of iodine in recovering noble-metals from WEEE: Towards sustainability and zero waste. Green Chem. 2015, 17, 2208–2216. [Google Scholar] [CrossRef]
- Sahin, M.; Akcil, A.; Erust, C.; Altynbek, S.; Gahan, C.S.; Tuncuk, A. A potential alternative for precious metal recovery from e-waste: Iodine leaching. Sep. Sci. Technol. 2015, 50, 2587–2595. [Google Scholar] [CrossRef]
- Quinet, P.; Proost, J.; Van Lierde, A. Recovery of precious metals from electronic scrap by hydrometallurgical processing routes. Min. Metall. Process 2005, 22, 17–22. [Google Scholar] [CrossRef]
- Sousa, R.; Futuro, A.; Fiúza, A.; Vila, M.C.; Dinis, M.L. Bromine leaching as an alternative method for gold dissolution. Min. Eng. 2018, 118, 16–23. [Google Scholar] [CrossRef]
- Melashvili, M.; Fleming, C.; Dymov, I.; Manimaran, M.; O’Day, J. Study of gold leaching with bromine and bromide and the influence of sulphide minerals on this reaction. In Proceedings of the Conference of Metallurgists (COM 2014), Vancouver, BC, Canada, 28 September–1 October 2014; Canadian Institute of Mining, Metallurgy and Petroleum: Westmount, QC, Canada, 2014. ISBN 978-1-926872-24-7. [Google Scholar]
- Hojo, M.; Iwasaki, S.; Okamura, K. Pure gold dissolution with hydrogen peroxide as the oxidizer in HBr or HI solution. J. Mol. Liq. 2017, 246, 372–378. [Google Scholar] [CrossRef]
- Dorneanu, S.A. Electrochemical recycling of waste printed circuit boards in bromide media. Part I: Preliminary leaching and dismantling tests. Studia Univ. Babeş-Bolyai Chem. 2017, 62, 177–186. [Google Scholar] [CrossRef]
- Stern, M.; Geary, A.L. Electrochemical polarization: I. A theoretical analysis of the shape of polarization curves. J. Electrochem. Soc. 1957, 104, 56–63. [Google Scholar] [CrossRef]
- Marusic, K.; Otmacic Curkovic, H.; Takenouti, H. Inhibiting effect of 4-methyl-1-p-tolylimidazole to the corrosion of bronze patinated in sulphate medium. Electrochim. Acta 2011, 56, 7491–7502. [Google Scholar] [CrossRef]
- Ives, M.; Lu, Y.; Luo, J. Cathodic reactions involved in metallic corrosion in chlorinated saline environments. Corros. Sci. 1991, 32, 91–102. [Google Scholar] [CrossRef]
- Aben, T. Anodic polarization behavior of copper in aqueous bromide and bromide/benzotriazole solutions. J. Electrochem. Soc. 1995, 142, 398. [Google Scholar] [CrossRef]
- Brolo, A.G.; Temperini, M.L.A.; Agostinho, S.M.L. Copper dissolution in bromide medium in the absence and presence of hexamethylenetetramine (HMTA). Electrochim. Acta 1998, 44, 559–571. [Google Scholar] [CrossRef]
- Fernández-Domene, R.M.; Blasco-Tamarit, E.; García-García, D.M.; García-Antón, J. Thermogalvanic effects on the corrosion of copper in heavy brine LiBr solutions. Corros. Sci. 2012, 63, 304–315. [Google Scholar] [CrossRef]
- Baugh, L.M. Corrosion and polarization characteristics of zinc in neutral-acid media-I. Pure zinc in solutions of various sodium salts. Electrochim. Acta 1979, 24, 657–667. [Google Scholar] [CrossRef]
- Hassan, H.H.; Fahmy, K. Pitting corrosion of tin by acetate anion in acidic media. Int. J. Electrochem. Sci. 2008, 3, 29–43. [Google Scholar]
- El Boraei, N.F.; Abd El Rehim, S.S. Electrochemical behavior of tin anode in ascorbic acid solutions. Mater. Chem. Phys. 2018, 215, 332–338. [Google Scholar] [CrossRef]
- Abd El Rehim, S.S.; Hassan, H.H. Anodic behaviour of tin in maleic acid solution and the effect of some inorganic inhibitors. Corros. Sci. 2004, 46, 1071–1082. [Google Scholar] [CrossRef]
- Johnson, J.W.; Liu, E.C. The anodic dissolution of tin in acidic chloride solutions. J. Less-Common Metals 1974, 34, 113–120. [Google Scholar] [CrossRef]
- Barradas, R.G.; Belinko, K.; Ambrose, J. Electrochemical behavior of the lead electrode in HCl and NaCl aqueous electrolytes. Can. J. Chem. 1975, 53, 389–406. [Google Scholar] [CrossRef]
- Helal, N.H.; El-Rabiee, M.M.; Abd El-Hafez, G.M.; Badawy, W.A. Environmentally safe corrosion inhibition of Pb in aqueous solutions. J. Alloy. Compd. 2008, 456, 372–378. [Google Scholar] [CrossRef]
- Tanno, K.; Itoh, M.; Takahashi, T.; Yashiro, H.; Kumagai, N. The corrosion of carbon steel in lithium bromide solution at moderate temperatures. Corros. Sci. 1993, 34, 1441–1451. [Google Scholar] [CrossRef]
- Popova, A.; Christov, M.; Vasilev, A. Mono- and dicationic benzothiazolic quaternary ammonium bromides as mild steel corrosion inhibitors. Part II: Electrochemical impedance and polarisation resistance results. Corros. Sci. 2011, 53, 1770–1777. [Google Scholar] [CrossRef]
- Raistrick, I.D.; MacDonald, J.R.; Franceschetti, D.R. The Electrical Analogs of Physical and Chemical Processes. In Impedance Spectroscopy Emphasizing Solid Materials and Systems; MacDonald, J.R., Ed.; John Wiley & Sons: New York, NY, USA, 1987; pp. 27–84. [Google Scholar]
- Sherif, E.M.; Park, S.M. Inhibition of copper corrosion in acidic pickling solutions by N-phenyl-1,4-phenylenediamine. Electrochim. Acta 2006, 51, 4665–4673. [Google Scholar] [CrossRef]
- Abelev, E.; Starosvetsky, D.; Ein-Eli, Y. Enhanced copper surface protection in aqueous solutions containing short-chain alkanoic acid potassium salts. Langmuir 2007, 23, 11281–11288. [Google Scholar] [CrossRef]
- Assaf, F.H.; Abd El-Rehiem, S.S.; Zaky, A.M. Pitting corrosion of zinc in neutral halide solutions. Mater. Chem. Phys. 1999, 58, 58–63. [Google Scholar] [CrossRef]
- Chiu, S.L.; Selman, J.R. Determination of electrode kinetics by corrosion potential measurements: Zinc corrosion by bromine. J. App. Electrochem. 1992, 22, 28–37. [Google Scholar] [CrossRef]
- Cachet, C.; Wiart, R. Reaction mechanism for zinc dissolution in chloride electrolytes. J. Electroanal. Chem. 1981, 129, 103–114. [Google Scholar] [CrossRef]
- Ahlberg, E.; Anderson, H. Simulating the impedance spectroscopy from a mechanistic point of view: Theory and Simulations. Acta Chem. Scand. 1992, 46, 1–14. [Google Scholar] [CrossRef][Green Version]
- Cachet, C.; Ganne, F.; Maurin, G.; Petitjean, J.; Vivier, V.; Wiart, R. EIS investigation of zinc dissolution in aerated sulfate medium, Part I: Bulk zinc. Electrochim. Acta 2001, 47, 509–518. [Google Scholar] [CrossRef]
- Deslouis, C.; Duprat, M.; Tournillon, C. The kinetics of zinc dissolution in aerated sodium sulphate solutions. a measurement of the corrosion rate by impedance techniques. Corros. Sci. 1989, 29, 13–30. [Google Scholar] [CrossRef]
- Pilbáth, A.; Nyikos, L.; Bertóti, I.; Kálmán, E. Zinc corrosion protection with 1,5-diphosphono-pentane. Corros. Sci. 2008, 50, 3314–3321. [Google Scholar] [CrossRef]
- Biesinger, M.C.; Lau, L.W.M.; Gerson, A.R.; Smart, R.S.C. Resolving surface chemical states in XPS analysis of first row transition metals, oxides and hydroxides: Sc, Ti, V, Cu and Zn. Appl. Surf. Sci. 2010, 257, 2717–2730. [Google Scholar] [CrossRef]
- Magaino, S.; Soga, M.; Sobue, K.; Kawaguchi, A.; Ishida, N.; Imai, H. Zinc corrosion in simulated acid rain. Electrochim. Acta 1999, 44, 4307–4312. [Google Scholar] [CrossRef]
- Cachet, C.; Wiart, R. The kinetics of zinc dissolution in chloride electrolytes: Impedance measurements and electrode morphology. J. Electroanal. Chem. 1980, 111, 235–246. [Google Scholar] [CrossRef]
- El Ibrahimi, B.; Jmiai, A.; El Mouaden, K.; Baddouh, A.; El Issami, S.; Bazzi, L.; Hilali, M. Effect of solution’s pH and molecular structure of three linear α-amino acids on the corrosion of tin in salt solution: A combined experimental and theoretical approach. J. Mol. Struct. 2019, 1196, 105–118. [Google Scholar] [CrossRef]
- Huang, B.X.; Tornatore, P.; Li, Y.-S. IR and Raman spectroelectrochemical studies of corrosion films on tin. Electrochim. Acta 2001, 46, 671–679. [Google Scholar] [CrossRef]
- Jafarian, M.; Gobal, F.; Danaee, I.; Biabani, R.; Mahjani, M.G. Electrochemical studies of the pitting corrosion of tin in citric acid solution containing Cl−. Electrochim. Acta 2008, 53, 4528–4536. [Google Scholar] [CrossRef]
- Foad El-Sherbini, E.E.; Abd-El-Wahab, S.M.; Amin, M.A.; Deyab, M.A. Electrochemical behavior of tin in sodium borate solutions and the effect of halide ions and some inorganic inhibitors. Corros. Sci. 2006, 48, 1885–1898. [Google Scholar] [CrossRef]
- Yang, C.J.; Ko, Y.; Park, S.M. Fourier transform electrochemical impedance spectroscopic studies on anodic reaction of lead. Electrochim. Acta 2012, 7, 615–622. [Google Scholar] [CrossRef]
- Chen, Y.; Jepson, W.P. EIS measurement for corrosion monitoring under multiphase flow conditions. Electrochim. Acta 1999, 44, 4453–4464. [Google Scholar] [CrossRef]
- Keddam, M.; Mattos, O.R.; Takenouti, H. Reaction model for iron dissolution studied by electrode impedance II. determination of the reaction model. J. Electrochem. Soc. 1981, 128, 257–266. [Google Scholar] [CrossRef]
- Amin, M.A.; Khaled, K.F.; Mohsen, Q.; Arida, H.A. A study of the inhibition of iron corrosion in HCl solutions by some amino acids. Corros. Sci. 2010, 52, 1684–1695. [Google Scholar] [CrossRef]
- MacFarlane, D.R.; Smedley, S.I. The Dissolution mechanism of iron in chloride solutions. J. Electrochem. Soc. 1986, 133, 2240–2244. [Google Scholar] [CrossRef]
- Montañés, M.T.; Pérez-Herranz, V.; García-Antón, J.; Guiñón, J.L. Evolution with exposure time of copper corrosion in a concentrated lithium bromide solution. Characterization of corrosion products by energy-dispersive X-ray analysis and X-ray Diffraction. Corrosion 2006, 62, 64–73. [Google Scholar] [CrossRef]
- Biesinger, M.C. Advanced analysis of copper X-ray photoelectron spectra. Surf. Interface Anal. 2017, 49, 1325–1334. [Google Scholar] [CrossRef]
- Capece, F.M.; Dicastro, V.; Furlani, C.; Mattogno, G.; Fragale, C.; Gargano, M.; Rossi, M. “Copper chromite” catalysts: XPS structure elucidation and correlation with catalytic activity. J. Electron Spectrosc. Relat. Phenom. 1982, 27, 119–128. [Google Scholar] [CrossRef]
- Nakamura, T.; Tomizuka, H.; Takahashi, M.; Hoshi, T.J. Methods of powder sample mounting and their evaluations in XPS analysis. Surf. Sci. Soc. Jpn. 1995, 16, 515–520. [Google Scholar] [CrossRef]
- Jolley, J.G.; Geesey, G.G.; Haukins, M.R.; Write, R.B.; Wichlacz, P.L. Auger electron and X-ray photoelectron spectroscopic study of the biocorrosion of copper by alginic acid polysaccharide. Appl. Surf. Sci. 1989, 37, 469–480. [Google Scholar] [CrossRef]
- Koberstein, J.T. Quantitative analysis of copper oxide nanoparticle composition and structure by X-ray photoelectron spectroscopy. Chem. Mater. 2006, 18, 6054–6058. [Google Scholar] [CrossRef]
- Dube, C.E.; Workie, B.; Kounaves, S.P.; Robbat, A., Jr.; Aksu, M.L.; Davies, G. Electrodeposition of metal alloy and mixed oxide films using a single-precursor tetranuclear copper-nickel complex. J. Electrochem. Soc. 1995, 142, 3357–3365. [Google Scholar] [CrossRef]
- Otamiri, J.C.; Andersson, S.L.T.; Andersson, A. Ammoxidation of toluene by YBa2Cu3O6+x and copper oxides: Activity and XPS studies. Appl. Catal. 1990, 65, 159–174. [Google Scholar] [CrossRef]
- Morgan, W.E.; Van Wazer, J.R.; Stec, W.J. Inner-orbital photoelectron spectroscopy of the alkali metal halides, perchlorates, phosphates, and pyrophosphates. J. Am. Chem. Soc. 1973, 95, 751–755. [Google Scholar] [CrossRef]
- Wagner, C.D.; Riggs, W.M.; Davis, L.E.; Moulder, J.F.; Muilenberg, G.E. Handbook of X-ray Photoelectron Spectroscopy; Perkin-Elmer Corporation, Physical Electronics Division: Eden Prairie, MN, USA, 1979. [Google Scholar] [CrossRef]
- Sharma, J.; Iqbal, Z. X-ray photoelectron spectroscopy of brominated (SN)x and S4N4. Chem. Phys. Lett. 1978, 56, 373–376. [Google Scholar] [CrossRef]
- Hosking, N.C.; Ström, M.A.; Shipway, P.H.; Rudd, C.D. Corrosion resistance of zinc–magnesium coated steel. Corros. Sci. 2007, 49, 3669–3695. [Google Scholar] [CrossRef]
- Sen, P.; Hegde, M.S.; Rao, C.N.R. Surface oxidation of cadmium, indium, tin and antimony by photoelectron and Auger spectroscopy. Appl. Surf. Sci. 1982, 10, 63–74. [Google Scholar] [CrossRef]
- Pederson, L.R. Two-dimensional chemical-state plot for lead using XPS. J. Electron. Spectrosc. Relat. Phenom. 1982, 28, 203–209. [Google Scholar] [CrossRef]
- Powell, C.J. Recommended auger parameters for 42 elemental solids. J. Electron. Spectrosc. Relat. Phenom. 2012, 185, 1–3. [Google Scholar] [CrossRef]
- Nefedov, V.I. A comparison of results of an ESCA study of nonconducting solids using spectrometers of different constructions. J. Electron. Spectrosc. Relat. Phenom. 1982, 25, 29–47. [Google Scholar] [CrossRef]
- Uhlig, I.; Szargan, R.; Nesbitt, H.W.; Laajalehto, K. Surface states and reactivity of pyrite and marcasite. Appl. Surf. Sci. 2001, 179, 222–229. [Google Scholar] [CrossRef]
- Grosvenor, A.P.; Kobe, B.A.; Biesinger, M.C.; McIntyre, N.S. Investigation of multiplet splitting of Fe 2p XPS spectra and bonding in iron compounds. Surf. Interface Anal. 2004, 36, 1564–1574. [Google Scholar] [CrossRef]
- Marcus, P.; Grimal, J.M. The anodic dissolution and passivation of Ni-Cr-Fe alloys studied by ESCA. Corros. Sci. 1992, 33, 805–814. [Google Scholar] [CrossRef]
- Hawn, D.D.; DeKoven, B.M. Deconvolution as a correction for photoelectron inelastic energy losses in the core level XPS spectra of iron oxides. Surf. Interface Anal. 1987, 10, 63–74. [Google Scholar] [CrossRef]
- Langevoort, J.C.; Sutherland, I.f.; Hanekamp, L.J.; Gellings, P.J. On the oxide formation on stainless steels AISI 304 and incoloy 800H investigated with XPS. Appl. Surf. Sci. 1987, 28, 167–179. [Google Scholar] [CrossRef]
© 2020 by the authors. Licensee MDPI, Basel, Switzerland. This article is an open access article distributed under the terms and conditions of the Creative Commons Attribution (CC BY) license (http://creativecommons.org/licenses/by/4.0/).