Mitigating the Drying Shrinkage and Autogenous Shrinkage of Alkali-Activated Slag by NaAlO2

Abstract
1. Introduction
2. Materials and Methods
2.1. Raw Material and Mixture Ratio
2.2. Test Methods
2.2.1. Drying Shrinkage
2.2.2. Autogenous Shrinkage
2.2.3. Instrumental Techniques
3. Results and Discussion
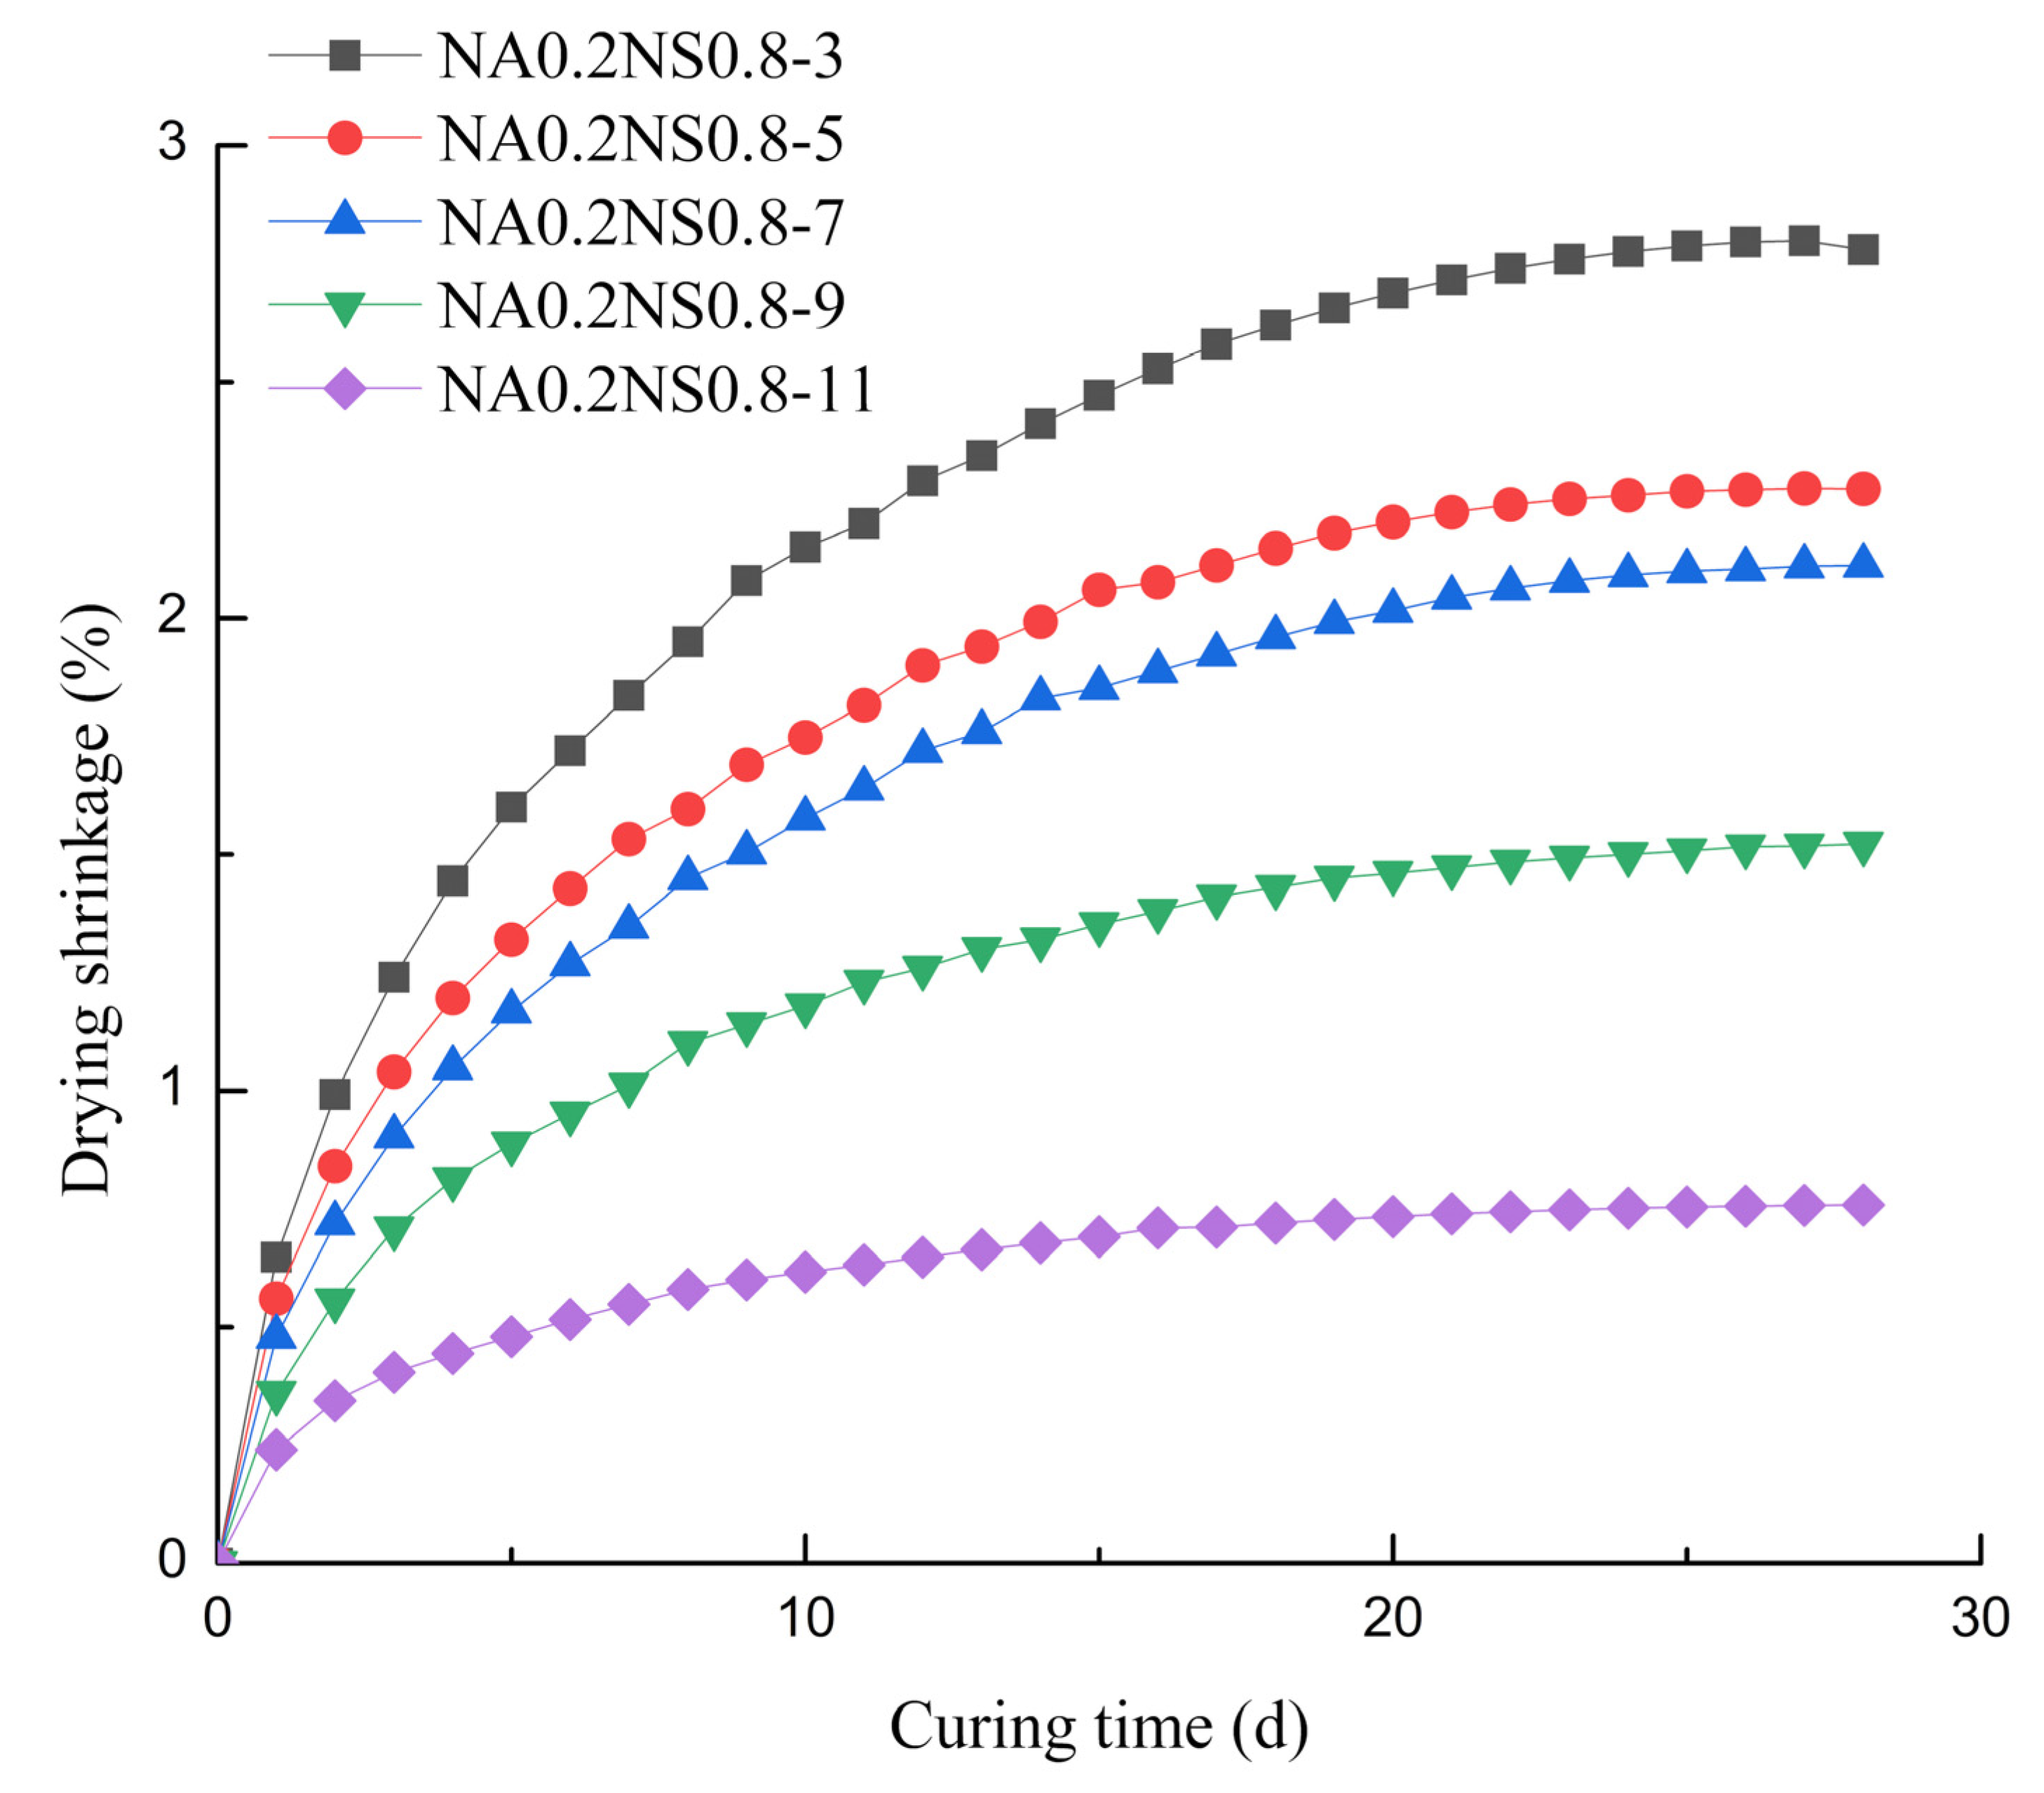
3.1. Drying Shrinkage
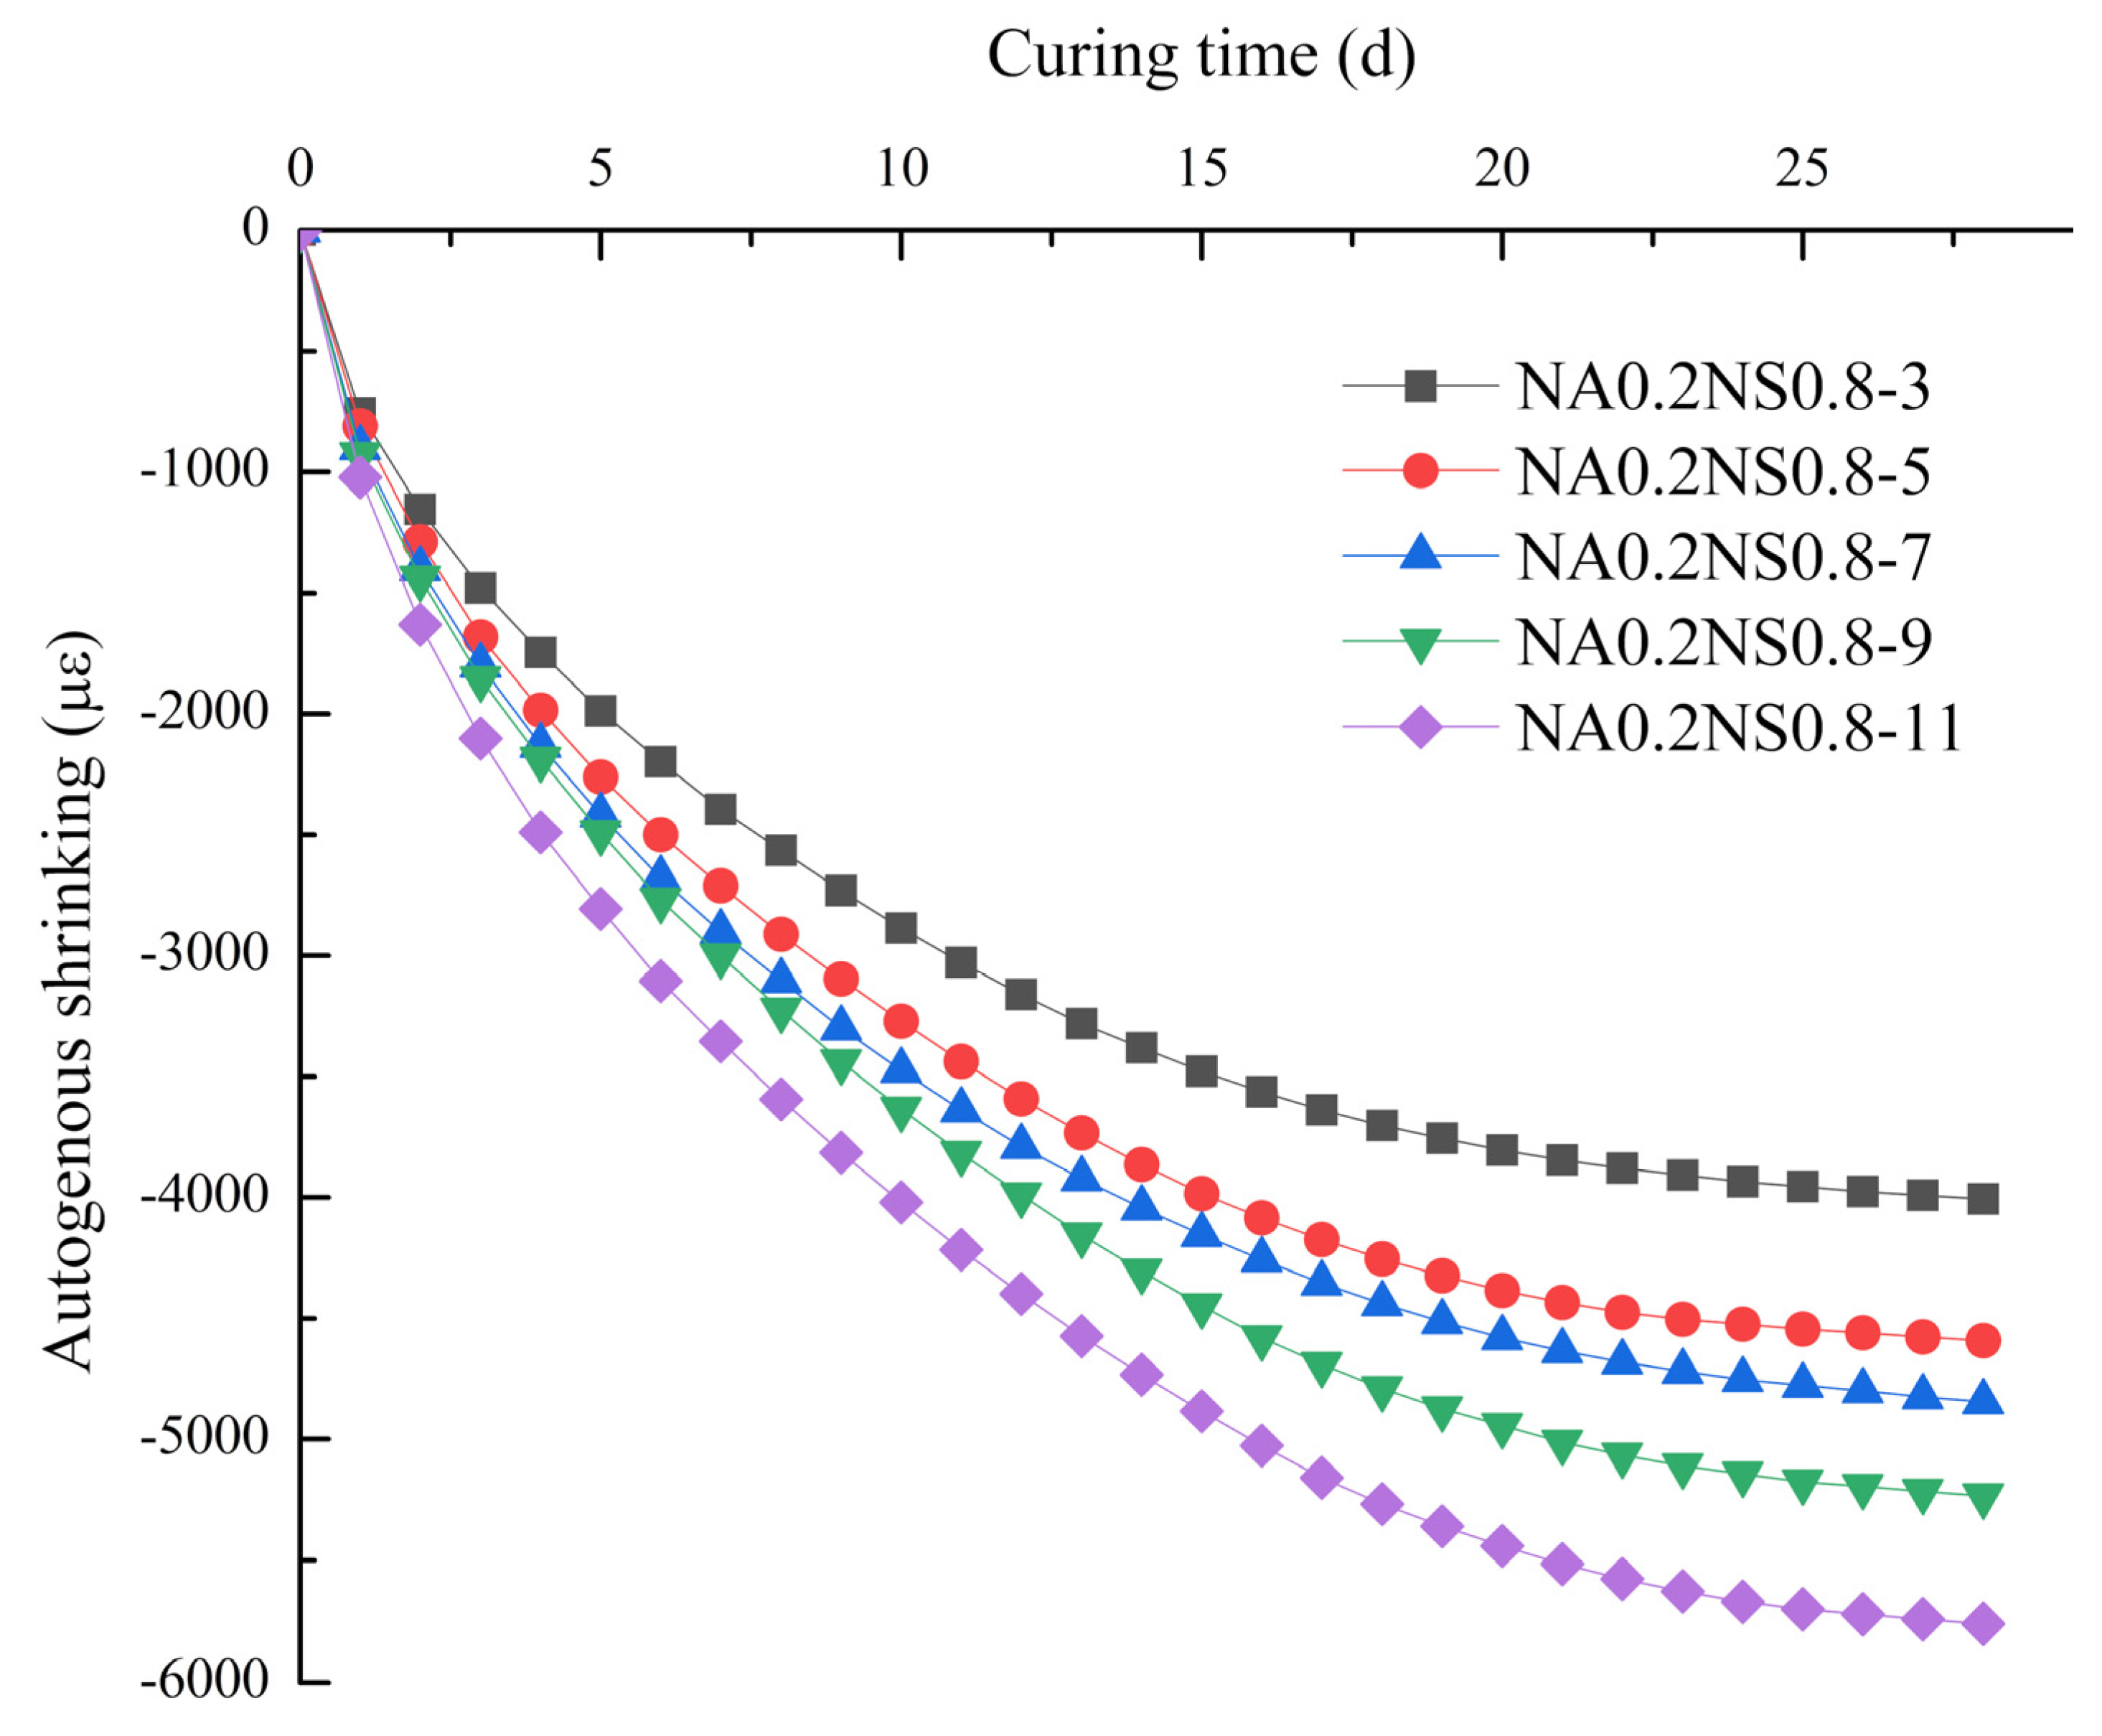
3.2. Autogenous Shrinkage
3.3. XRD
3.4. SEM
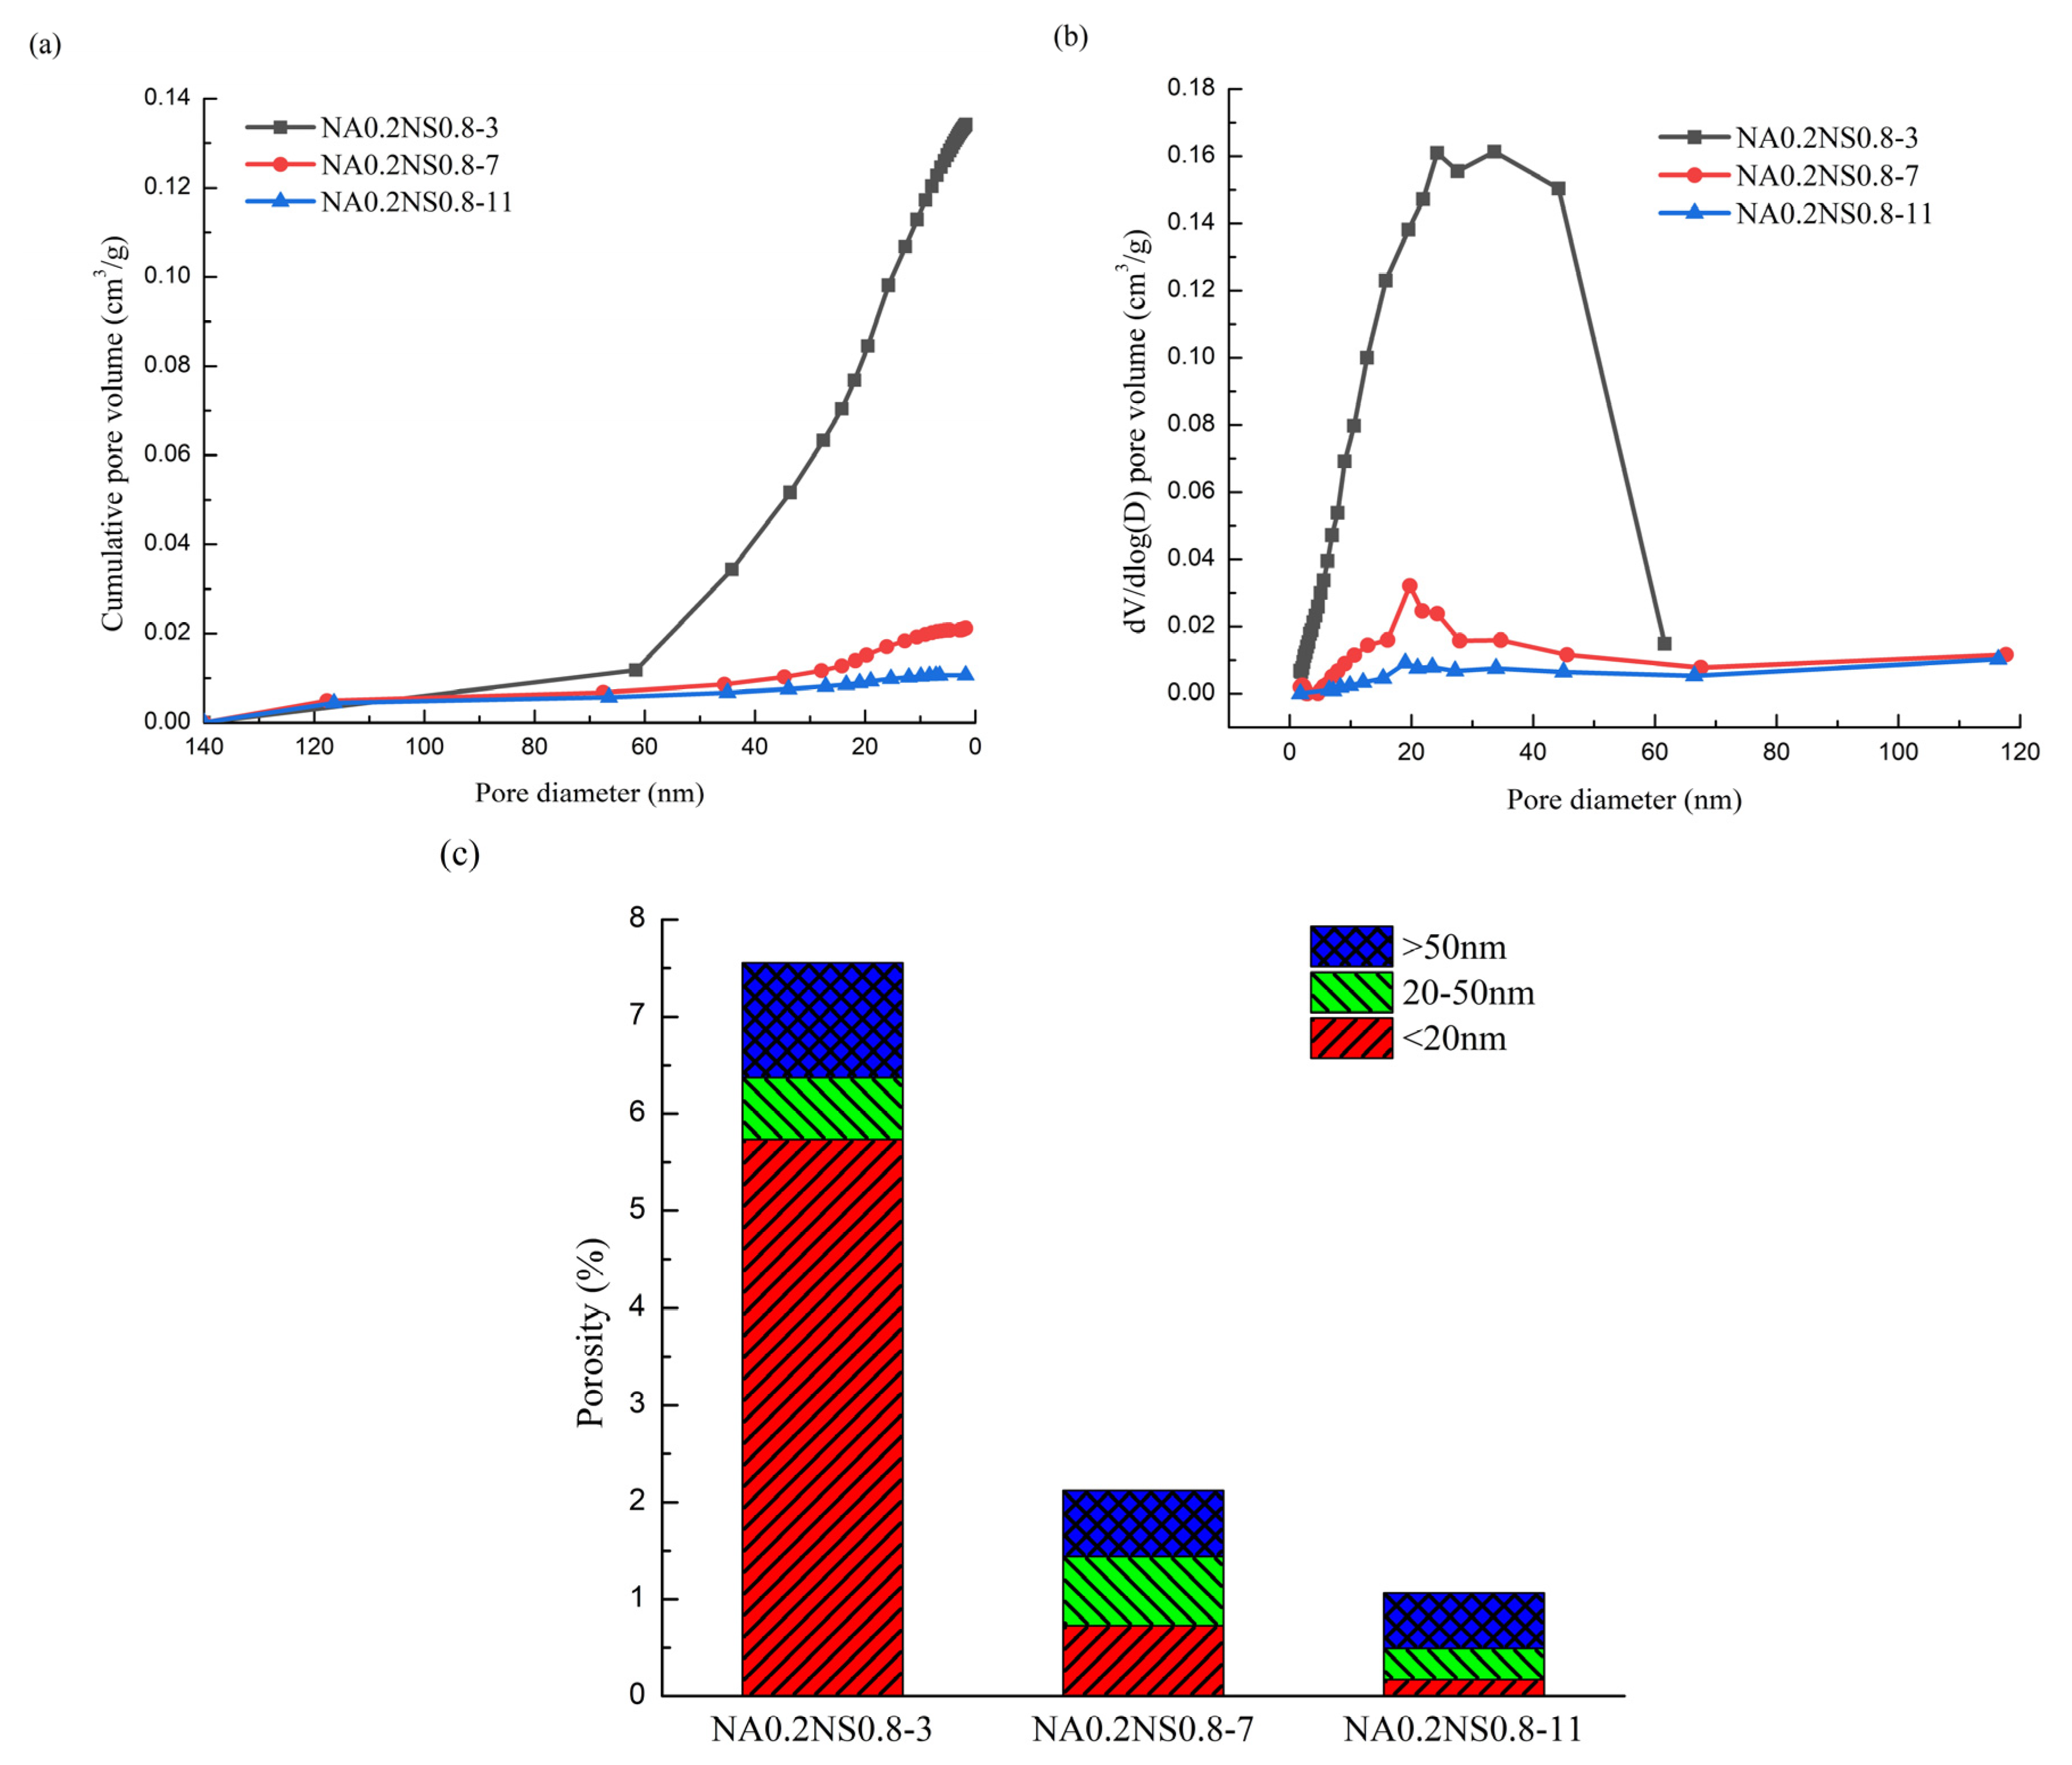
3.5. BET
4. Conclusions
- Through NaAlO2 addition, the drying shrinkage and autogenous shrinkage could be clearly mitigated. In addition, the solid alkaline activator provided a convenient way of preparation and curing and reduced damage from alkaline corrosion;
- The addition of NaAlO2 slowed the early hydration reaction, while made the later hydration reaction more complete, reducing the total porosity, changing the pore-size distribution and having a significant impact on the shrinkage performance;
- Added NaAlO2 could generate hydrotalcite and tetranatrolite, and the generation increased with increased added NaAlO2. Moreover, the change of the generated phase composition clearly mitigated shrinkage of AAS;
- For AAS with different Na2O contents, the evaporation from the paste played a major role in drying shrinkage and the degree of hydration reaction mainly contributed to autogenous shrinkage.
Author Contributions
Funding
Conflicts of Interest
References
- Mobili, A.; Belli, A.; Giosuè, C.; Bellezze, T.; Tittarelli, F. Metakaolin and fly ash alkali-activated mortars compared with cementitious mortars at the same strength class. Cem. Concr. Res. 2016, 88, 198–210. [Google Scholar] [CrossRef]
- McLellan, B.C.; Williams, R.P.; Lay, J.; van Riessen, A.; Corder, G.D. Costs and carbon emissions for geopolymer pastes in comparison to ordinary portland cement. J. Clean. Prod. 2011, 19, 1080–1090. [Google Scholar] [CrossRef]
- Yang, K.-H.; Song, J.-K.; Song, K.-I. Assessment of CO2 reduction of alkali-activated concrete. J. Clean. Prod. 2013, 39, 265–272. [Google Scholar] [CrossRef]
- Provis, J.L.; Palomo, A.; Shi, C. Advances in understanding alkali-activated materials. Cem. Concr. Res. 2015, 78, 110–125. [Google Scholar] [CrossRef]
- Li, C.; Sun, H.; Li, L. A review: The comparison between alkali-activated slag (Si+Ca) and metakaolin (Si+Al) cements. Cem. Concr. Res. 2010, 40, 1341–1349. [Google Scholar] [CrossRef]
- Jang, J.G.; Lee, N.K.; Lee, H.K. Fresh and hardened properties of alkali-activated fly ash/slag pastes with superplasticizers. Constr. Build. Mater. 2014, 50, 169–176. [Google Scholar] [CrossRef]
- Collins, F.; Sanjayan, J.G. Strength and shrinkage properties of alkali-activated slag concrete placed into a large column. Cem. Concr. Res. 1999, 29, 659–666. [Google Scholar] [CrossRef]
- Lee, N.K.; Jang, J.G.; Lee, H.K. Shrinkage characteristics of alkali-activated fly ash/slag paste and mortar at early ages. Cem. Concr. Compos. 2014, 53, 239–248. [Google Scholar] [CrossRef]
- Duran Atiş, C.; Bilim, C.; Çelik, Ö.; Karahan, O. Influence of activator on the strength and drying shrinkage of alkali-activated slag mortar. Constr. Build. Mater. 2009, 23, 548–555. [Google Scholar] [CrossRef]
- Cartwright, C.; Rajabipour, F.; Radliska, A. Shrinkage characteristics of alkali-activated slag cements. J. Mater. Civ. Eng. 2015, 27, B4014007. [Google Scholar] [CrossRef]
- Hojati, M.; Radlińska, A. Shrinkage and strength development of alkali-activated fly ash-slag binary cements. Constr. Build. Mater. 2017, 150, 808–816. [Google Scholar] [CrossRef]
- Ye, H.; Radlińska, A. Shrinkage mitigation strategies in alkali-activated slag. Cem. Concr. Res. 2017, 101, 131–143. [Google Scholar] [CrossRef]
- Kalina, L.; Bílek, V.; Bartoníčková, E.; Kalina, M.; Hajzler, J.; Novotný, R. Doubts over capillary pressure theory in context with drying and autogenous shrinkage of alkali-activated materials. Constr. Build. Mater. 2020, 248, 118620. [Google Scholar] [CrossRef]
- Coppola, L.; Coffetti, D.; Crotti, E.; Candamano, S.; Crea, F.; Gazzaniga, G.; Pastore, T. The combined use of admixtures for shrinkage reduction in one-part alkali activated slag-based mortars and pastes. Constr. Build. Mater. 2020, 248, 118682. [Google Scholar] [CrossRef]
- Song, C.; Choi, Y.C.; Choi, S. Effect of internal curing by superabsorbent polymers—Internal relative humidity and autogenous shrinkage of alkali-activated slag mortars. Constr. Build. Mater. 2016, 123, 198–206. [Google Scholar] [CrossRef]
- Abdel-Gawwad, H.A.; Mohammed, M.S.; Alomayri, T. Single and dual effects of magnesia and alumina nano-particles on strength and drying shrinkage of alkali activated slag. Constr. Build. Mater. 2019, 228, 116827. [Google Scholar] [CrossRef]
- Ben, H.M.; Lothenbach, B.; Le Saout, G.; Winnefeld, F. Influence of slag chemistry on the hydration of alkali-activated blast-furnace slag-Part II: Effect of Al2O3. Cem. Concr. Res. 2012, 42, 74–83. [Google Scholar] [CrossRef]
- Sakulich, A.R.; Anderson, E.; Schauer, C.L.; Barsoum, M.W. Influence of Si:Al ratio on the microstructural and mechanical properties of a fine-limestone aggregate alkali-activated slag concrete. Mater. Struct. 2010, 43, 1025–1035. [Google Scholar] [CrossRef]
- Standardization Administration of the People’s Republic of China. GB/T 18046-2017: Ground Granulated Blast Furnace Slag Uesd for Cement, Mortar and Concrete; China Standards Press: Beijing, China, 2017; p. 2. [Google Scholar]
- Ministry of Housing and Urban-Rural Development of People’s Repoblic of China. GB/T 50081-2019: Standard for Test Methods of Concrete Physical and Mechanical Properties; China Buliding Materials Industry Press: Beijing, China, 2019; pp. 12–14. [Google Scholar]
- ASTM C1698-09 Standard Test Method for Autogenous Strain of Cenment Paste and Mortar; ASTM Inernational: West Conshohocken, PA, USA, 2009.
- Ye, H.; Cartwright, C.; Rajabipour, F.; Radliska, A. Understanding the drying shrinkage performance of alkali-activated slag mortars. Cem. Concr. Compos. 2017, 76, 13–24. [Google Scholar] [CrossRef]
- Melo Neto, A.A.; Cincotto, M.A.; Repette, W. Drying and autogenous shrinkage of pastes and mortars with activated slag cement. Cem. Concr. Res. 2008, 38, 565–574. [Google Scholar] [CrossRef]
- Qureshi, M.N.; Ghosh, S. Effect of Silicate Content on the Properties of Alkali-Activated Blast Furnace Slag Paste. Arab. J. Sci. Eng. 2014, 39, 5905–5916. [Google Scholar] [CrossRef]
- Wu, M.; Zhang, Y.; Jia, Y.; She, W.; Liu, G. Study on the role of activators to the autogenous and drying shrinkage of lime-based low carbon cementitious materials. J. Clean. Prod. 2020, 257, 120522. [Google Scholar] [CrossRef]
- Ballekere Kumarappa, D.; Peethamparan, S.; Ngami, M. Autogenous shrinkage of alkali activated slag mortars: Basic mechanisms and mitigation methods. Cem. Concr. Res. 2018, 109, 1–9. [Google Scholar] [CrossRef]
- Ma, Y.; Ye, G. The shrinkage of alkali activated fly ash. Cem. Concr. Res. 2015, 68, 75–82. [Google Scholar] [CrossRef]
- Li, Z.; Lu, T.; Liang, X.; Dong, H.; Ye, G. Mechanisms of autogenous shrinkage of alkali-activated slag and fly ash pastes. Cem. Concr. Res. 2020, 135, 106107. [Google Scholar] [CrossRef]
- Bernal, S.A.; Provis, J.L.; Brice, D.G.; Kilcullen, A.; Duxson, P.; Van Deventer, J.S.J. Accelerated carbonation testing of alkali-activated binders significantly underestimates service life: The role of pore solution chemistry. Cem. Concr. Res. 2012, 42, 1317–1326. [Google Scholar] [CrossRef]
- Rashad, A.M.; Zeedan, S.R.; Hassan, A.A. Influence of the activator concentration of sodium silicate on the thermal properties of alkali-activated slag pastes. Constr. Build. Mater. 2016, 102, 811–820. [Google Scholar] [CrossRef]
- Haha, M.B.; Lothenbach, B.; Le Saout, G.; Winnefeld, F. Influence of slag chemistry on the hydration of alkali-activated blast-furnace slag-Part I: Effect of MgO. Cem. Concr. Res. 2011, 41, 955–963. [Google Scholar] [CrossRef]
- Huang, Y.; Han, M. The influence of α-Al2O3 addition on microstructure, mechanical and formaldehyde adsorption properties of fly ash-based geopolymer products. J. Hazard. Mater. 2011, 193, 90–94. [Google Scholar] [CrossRef]
- Mastali, M.; Kinnunen, P.; Dalvand, A.; Mohammadi Firouz, R.; Illikainen, M. Drying shrinkage in alkali-activated binders A critical review. Constr. Build. Mater. 2018, 190, 533–550. [Google Scholar] [CrossRef]
- You, N.; Liu, Y.; Gu, D.; Ozbakkaloglu, T.; Pan, J.; Zhang, Y. Rheology, shrinkage and pore structure of alkali-activated slag-fly ash mortar incorporating copper slag as fine aggregate. Constr. Build. Mater. 2020, 242, 118029. [Google Scholar] [CrossRef]
- Chen, H.; Wyrzykowski, M.; Scrivener, K.; Lura, P. Prediction of self-desiccation in low water-to-cement ratio pastes based on pore structure evolution. Cem. Concr. Res. 2013, 49, 38–47. [Google Scholar] [CrossRef]
- Khalid, H.R.; Lee, N.K.; Park, S.M.; Abbas, N.; Lee, H.K. Synthesis of geopolymer-supported zeolites via robust one-step method and their adsorption potential. J. Hazard. Mater. 2018, 353, 522–533. [Google Scholar] [CrossRef] [PubMed]
- Chindaprasirt, P.; Chareerat, T.; Hatanaka, S.; Cao, T. High-Strength Geopolymer Using Fine High-Calcium Fly Ash. J. Mater. Civ. Eng. 2011, 23, 264–270. [Google Scholar] [CrossRef]
- Yang, J.; Wang, Q.; Zhou, Y. Influence of Curing Time on the Drying Shrinkage of Concretes with Different Binders and Water-to-Binder Ratios. Adv. Mater. Sci. Eng. 2017, 2017. [Google Scholar] [CrossRef]


| Oxide | CaO | SiO2 | MgO | Al2O3 | MnO | TiO2 | S | FeO |
|---|---|---|---|---|---|---|---|---|
| Percentage/% | 40.91 | 32.82 | 7.87 | 14.93 | 0.48 | 0.92 | 0.91 | 1.16 |
| Code | NaAlO2 Substitution Rate (%) | Na2O Content (%) | Slag (g) | NaAlO2 (g) | Na2SiO3 (g) | H2O (g) |
|---|---|---|---|---|---|---|
| NS1.0-5 | 0 | 5 | 2000 | 0.0 | 458.7 | 700 |
| NA0.2NS0.8-5 | 20 | 5 | 2000 | 52.9 | 366.9 | 700 |
| NA0.4NS0.6-5 | 40 | 5 | 2000 | 105.9 | 275.2 | 700 |
| NA0.6NS0.4-5 | 60 | 5 | 2000 | 158.7 | 183.5 | 700 |
| NA0.8NS0.2-5 | 80 | 5 | 2000 | 211.6 | 91.7 | 700 |
| NA0.2NS0.8-3 | 20 | 3 | 2000 | 31.7 | 220.1 | 700 |
| NA0.2NS0.8-7 | 20 | 7 | 2000 | 74.1 | 513.7 | 700 |
| NA0.2NS0.8-9 | 20 | 9 | 2000 | 95.2 | 660.5 | 700 |
| NA0.2NS0.8-11 | 20 | 11 | 2000 | 116.4 | 807.3 | 700 |
| Code | Total Porosity (%) | Volume Proportions (%) | ||
|---|---|---|---|---|
| Micropores | Mesopores | Macropores | ||
| NS1.0-5 | 6.94 | 32.06 | 30.36 | 37.58 |
| NA0.2 NS0.8-5 | 3.90 | 60.89 | 23.20 | 15.91 |
| NA0.8 NS0.2-5 | 3.53 | 61.67 | 26.27 | 12.06 |
| NA0.2 NS0.8-3 | 13.41 | 75.92 | 8.45 | 15.63 |
| NA0.2 NS0.8-7 | 2.12 | 34.39 | 33.63 | 31.98 |
| NA0.2 NS0.8-11 | 1.07 | 16.24 | 30.14 | 53.62 |
© 2020 by the authors. Licensee MDPI, Basel, Switzerland. This article is an open access article distributed under the terms and conditions of the Creative Commons Attribution (CC BY) license (http://creativecommons.org/licenses/by/4.0/).
Share and Cite
Chen, B.; Wang, J.; Zhao, J. Mitigating the Drying Shrinkage and Autogenous Shrinkage of Alkali-Activated Slag by NaAlO2. Materials 2020, 13, 3499. https://doi.org/10.3390/ma13163499
Chen B, Wang J, Zhao J. Mitigating the Drying Shrinkage and Autogenous Shrinkage of Alkali-Activated Slag by NaAlO2. Materials. 2020; 13(16):3499. https://doi.org/10.3390/ma13163499
Chicago/Turabian StyleChen, Bin, Jun Wang, and Jinyou Zhao. 2020. "Mitigating the Drying Shrinkage and Autogenous Shrinkage of Alkali-Activated Slag by NaAlO2" Materials 13, no. 16: 3499. https://doi.org/10.3390/ma13163499
APA StyleChen, B., Wang, J., & Zhao, J. (2020). Mitigating the Drying Shrinkage and Autogenous Shrinkage of Alkali-Activated Slag by NaAlO2. Materials, 13(16), 3499. https://doi.org/10.3390/ma13163499