1. Introduction
Carbon quantum dots (CQD) are a highly attractive class in carbon-based nanomaterials families which include fullerenes, nanotubes, nanodiamonds and graphene. CQD were first reported in 2004 by Xu et al. [
1] via separation of single-walled carbon nanotubes through electrophoresis. Generally, CQD are zero-dimensional (0D) carbon nanoparticles with a sizes less than 10 nm, which exhibit similar properties to those of semiconductor nanoparticles [
2]. In the ever-expanding nanomaterials research, CQD have received tremendous interest among researchers due to their fascinating properties such as highly biocompatibility, low-toxicity, ease of production, good solubility, chemical inertness, inexpensiveness and excellent photoluminescence [
3,
4]. Owing to these properties, CQD are widely used in multidisciplinary fields such as optoelectronics, photocatalysis, solar cells, bioimaging, drug delivery and photovoltaics [
5].
The current worldwide research on CQD is particularly concentrated on two major themes; (1) application of newly discovered starting materials for CQD production; and (2) tuning synthesis to be more controllable and reproducible. Collective findings from these themes might be able to match the understanding of the structure of semiconductor quantum dots and finalise the mechanism of CQD formation and the governing principal of their photoluminescence (PL) properties [
6]. Another key element that has placed CQD into the limelight is that production of CQD can be scalable and normally a one-step route using biomass waste-derived sources is involved [
7].
Numerous methods have been proposed for the synthesis of CQD with outstanding optical and electronic properties. Two common approaches for the synthesis of CQD are high-energy ion beam radiation and laser radiation that use cement and graphite powders as starting materials [
8,
9]. Synthesis of CQD using a laser ablation technique is a fast-synthetic route however this method is economically not preferable and complicated operation. Chemical methods have been widely used for preventing the used of expensive precursors and energetic systems. Also, oxidation of gas soot, carbon soot or activated carbon with strong acids such as nitric acid are relatively inexpensive ways to synthesize CQD [
10,
11]. However, the usage of vast quantities of hazardous strong acids in the process is not favored. Meanwhile, the carbonization of molecular precursor materials such as glucose, sucrose, glycol, glycerol, citric acid, ascorbic acid to produce fluorescent CQD has attracted significant attention among researchers. Nonetheless, multiple-step processes and acids as well as post-treatments with surface passivating agents are required during the carbonization methods [
12,
13]. Currently, there are studies reported that one step hydrothermal carbonization with high temperature or microwave assisted hydrothermal carbonization using different carbon precursors can achieve self-passivating CQD [
14,
15,
16,
17,
18]. Unfortunately, the major drawbacks of these methods are harsh synthesis conditions, complicated process, and the fact that they are highly expensive and time-consuming [
19,
20,
21,
22,
23,
24]. Despite these disadvantages, hydrothermal process is still preferred by researchers in preparing CQD as the process can be modified in order to make it facile and green.
Nowadays, a green synthesis approach has paved the way towards sustainable synthesis of CQD by focusing on the design of products and processes that minimise the use of harsh strong chemicals in the reaction. The production of CQD from renewable cheap natural precursors is a challenging but worthy concept. The usage of renewable starting materials and environmentally friendly non-toxic chemicals is one of the primary objectives of this approach. The reported work on CQD show a trend where there is a linking in the sequence of: carbon source–synthesis route–CQD structure–PL properties. The sources of carbon can be varied, inexpensive and abundant [
25].
Table 1 summarises several synthesis methods of CQD using modified hydrothermal routes under different conditions. The methods listed use biomass and food waste as the carbon source and results in relatively small CQD which lie in the range of 1.5–10 nm.
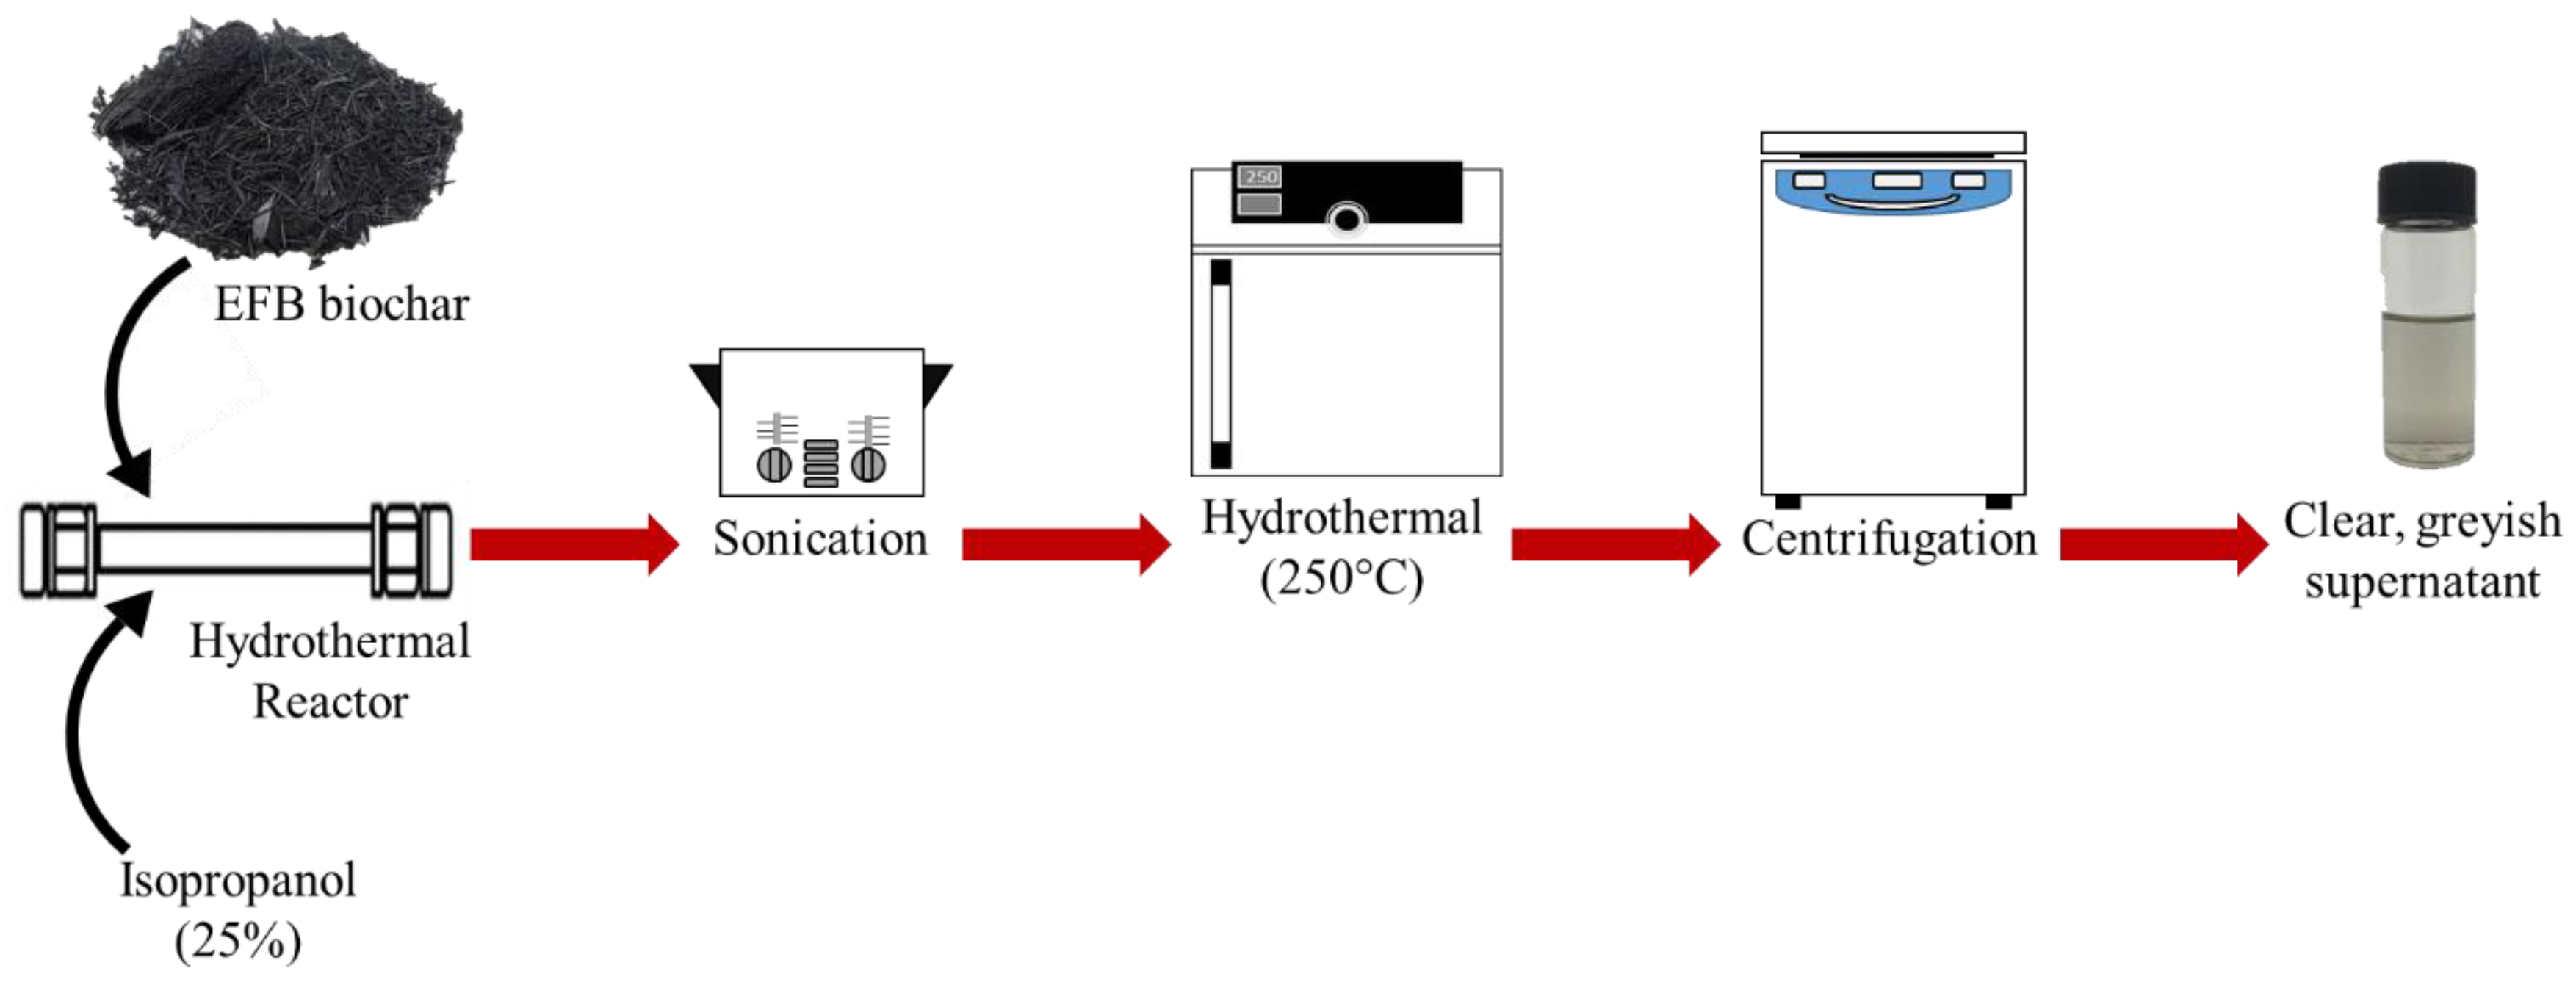
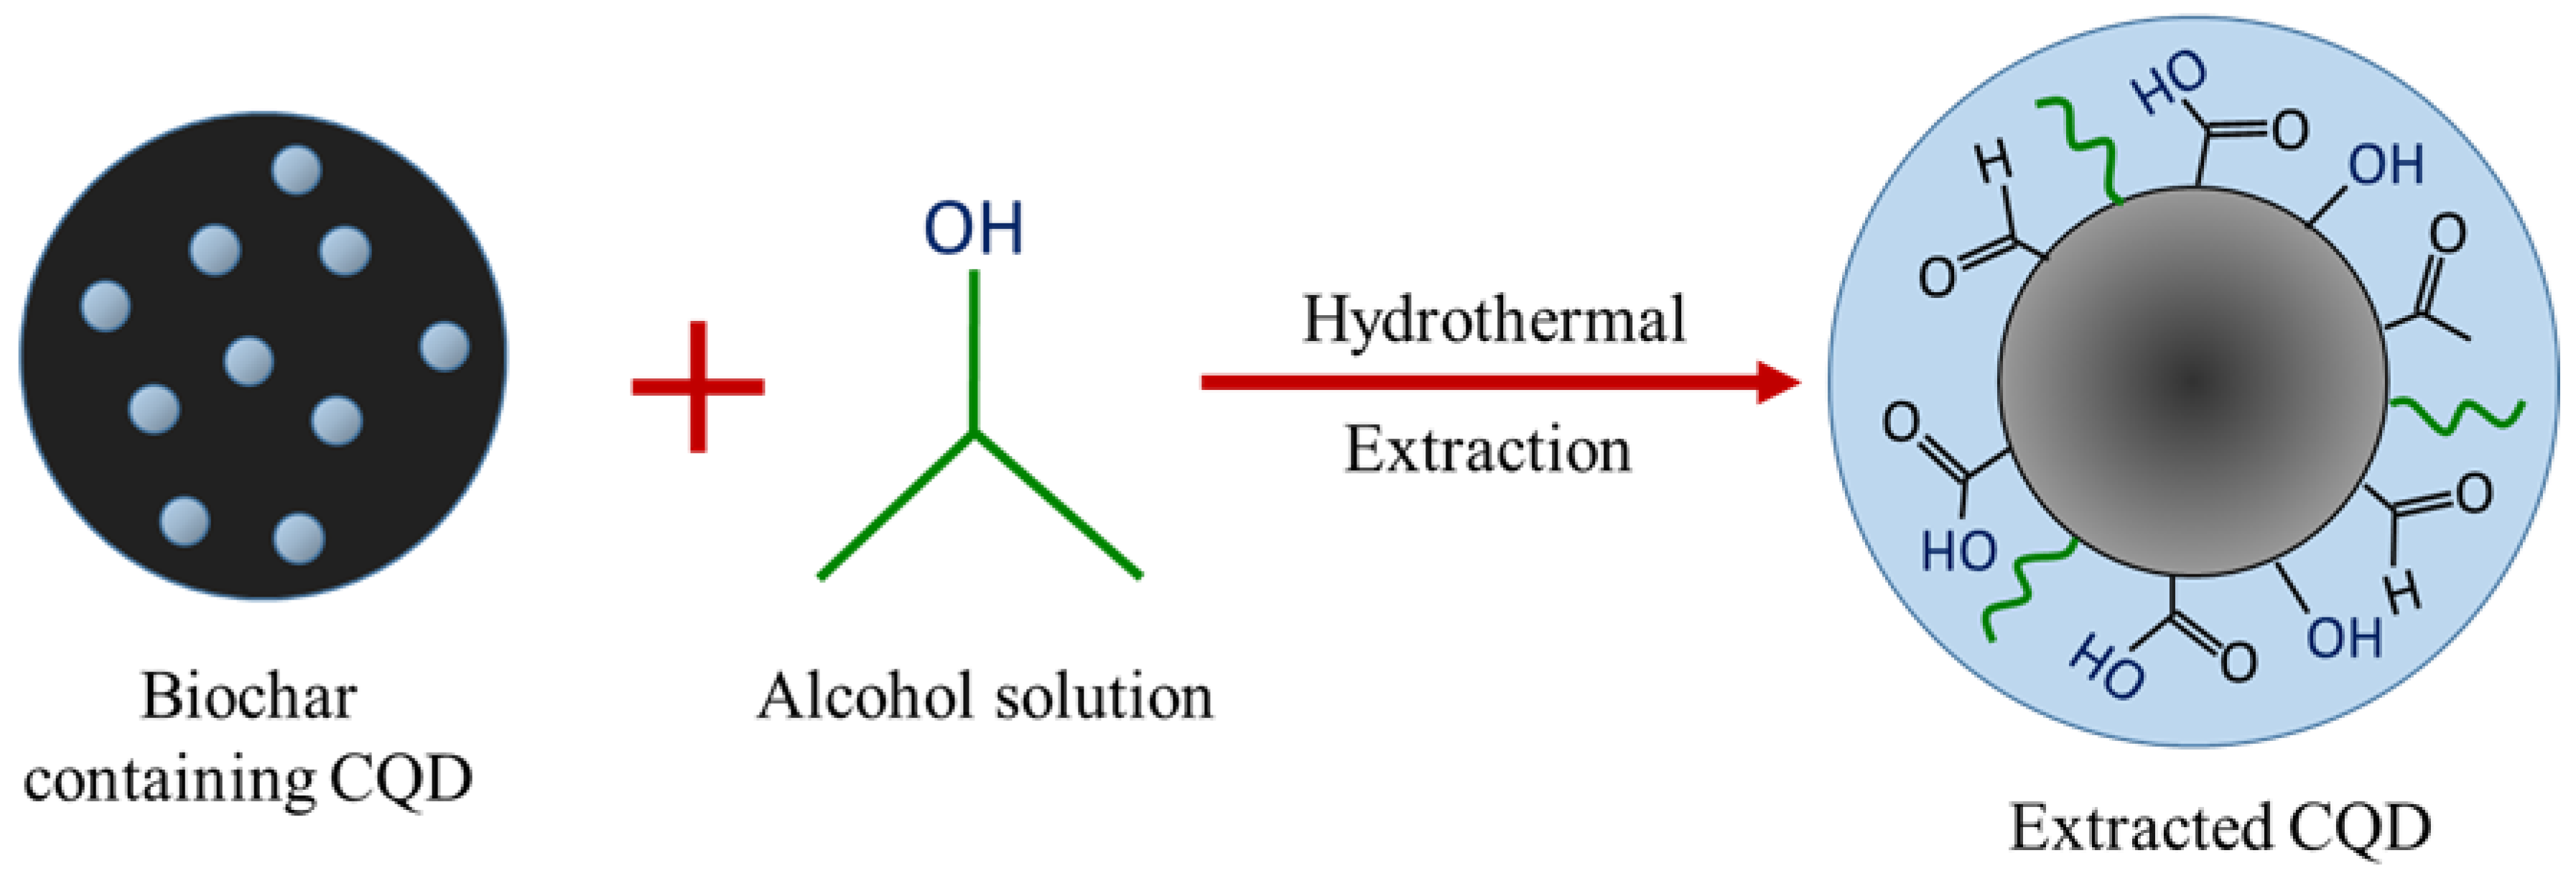
In this study we report a facile and acid-free hydrothermal process to extract CQD from empty fruit bunch (EFB) biochar as the natural source of carbon. EFB biochar has traditionally been used as an effective adsorbent as well as a soil conditioner for agriculture. This process is scalable and the use of EFB biochar is convenient due to its abundance and ease of availability. It is important to note that Malaysia is the second largest palm oil producers after Indonesia and has an abundance of oil palm residues (~135 million tonnes) generated throughout the year. The palm oil wastes include EFB, palm oil fonds, mesocarp fiber, palm oil trunks and palm kernel shell. Among these, EFB is the highest wastes being produced (~69.87 million ton) worldwide in year 2017 [
26]. The high volume of oil palm biomass residues incurs high disposal costs. Therefore, the utilization of EFB biomass that is abundantly available becomes the main focus of our study.
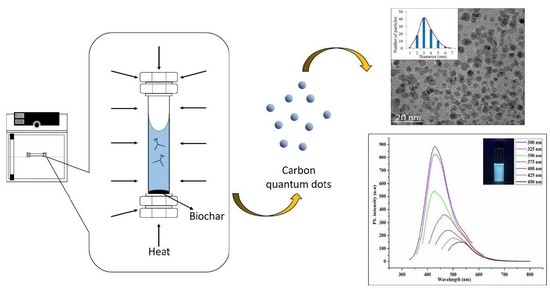
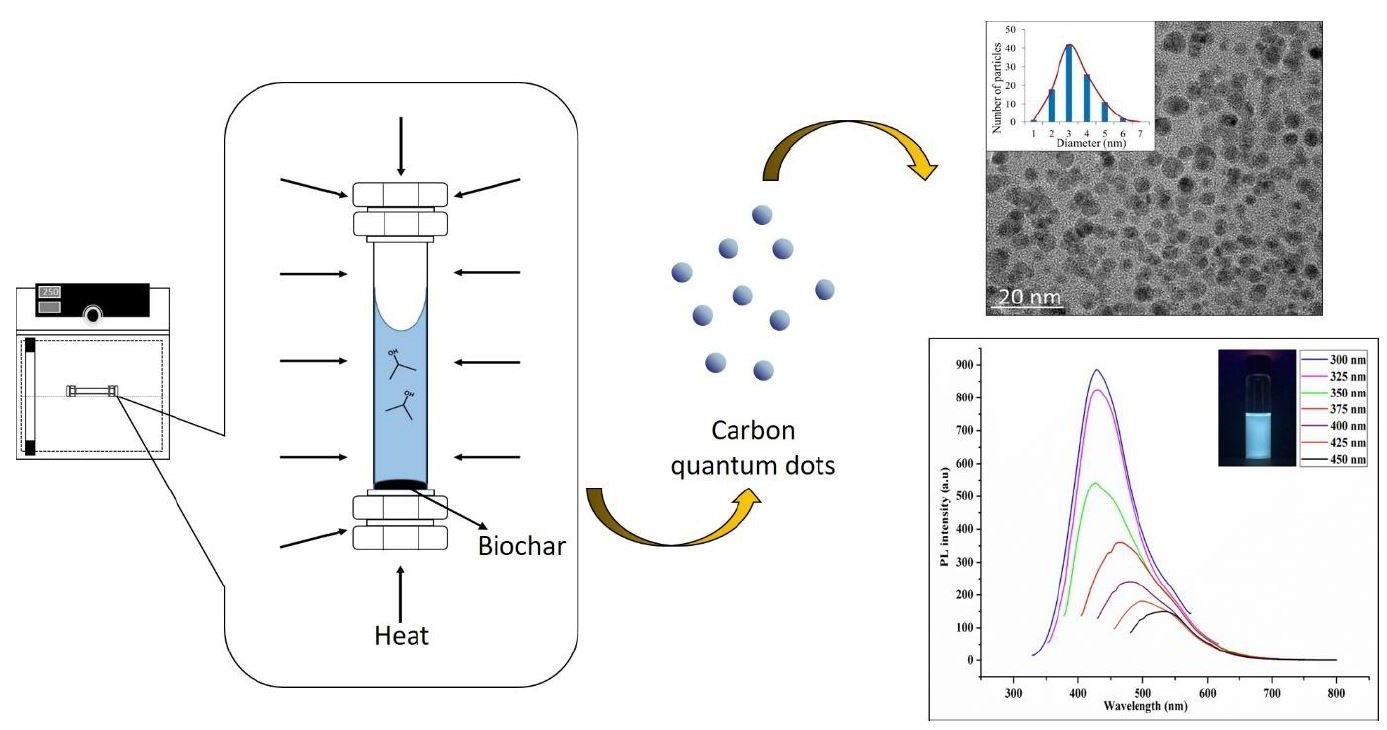
In a previous work, the hydrothermal process using salt bath of producing CQD from various types of biochar such as coconut shell, kenaf and EFB biochar had been carried out. It was found that CQD prepared from hydrothermally EFB biochar at subcritical water temperature of 250 °C yielded the highest fluorescence intensity, brightest blue fluorescence colour and smallest nanoparticle size [
27]. The hydrothermal extraction of CQD from biochar involves no harsh chemicals or complex purification process. Hydrothermal treatments can generate a combination of pressure and temperature effect in the EFB precursors, leading to the uniform formation of separate CQD. Due to the interaction of CQD with polar solvents, a series of emission traps are dominated, and more functional groups are attached on CQD resulting in the highest luminescent intensity of CQD. However, the hydrothermal synthesis mechanism of CQD was not studied in detail. We propose that CQD can be extracted from the carbon source by the synergistic effects of the applied thermal process and intercalation of the co-solvent into the graphitic structure of the carbon source. Density functional theory (DFT) studies were also included in this work for the better understanding in terms of the most stable and optimal molecular structure formation of CQD, which we believe has not been previously reported.
4. Molecular Modelling Based on Density Functional Theory
Many studies on the properties of CQD have been previously reported, however the limitation details of the molecular structure of CQD was due to the complexity and variety in shape and size of such dots. The molecular structure of the CQD is of special interest because there are many orientational possibilities of the functional groups moieties with respect to the aromatic ring. The concept of DFT Gaussian software is used to perform geometry optimization at ground state calculation of CQD for this study.
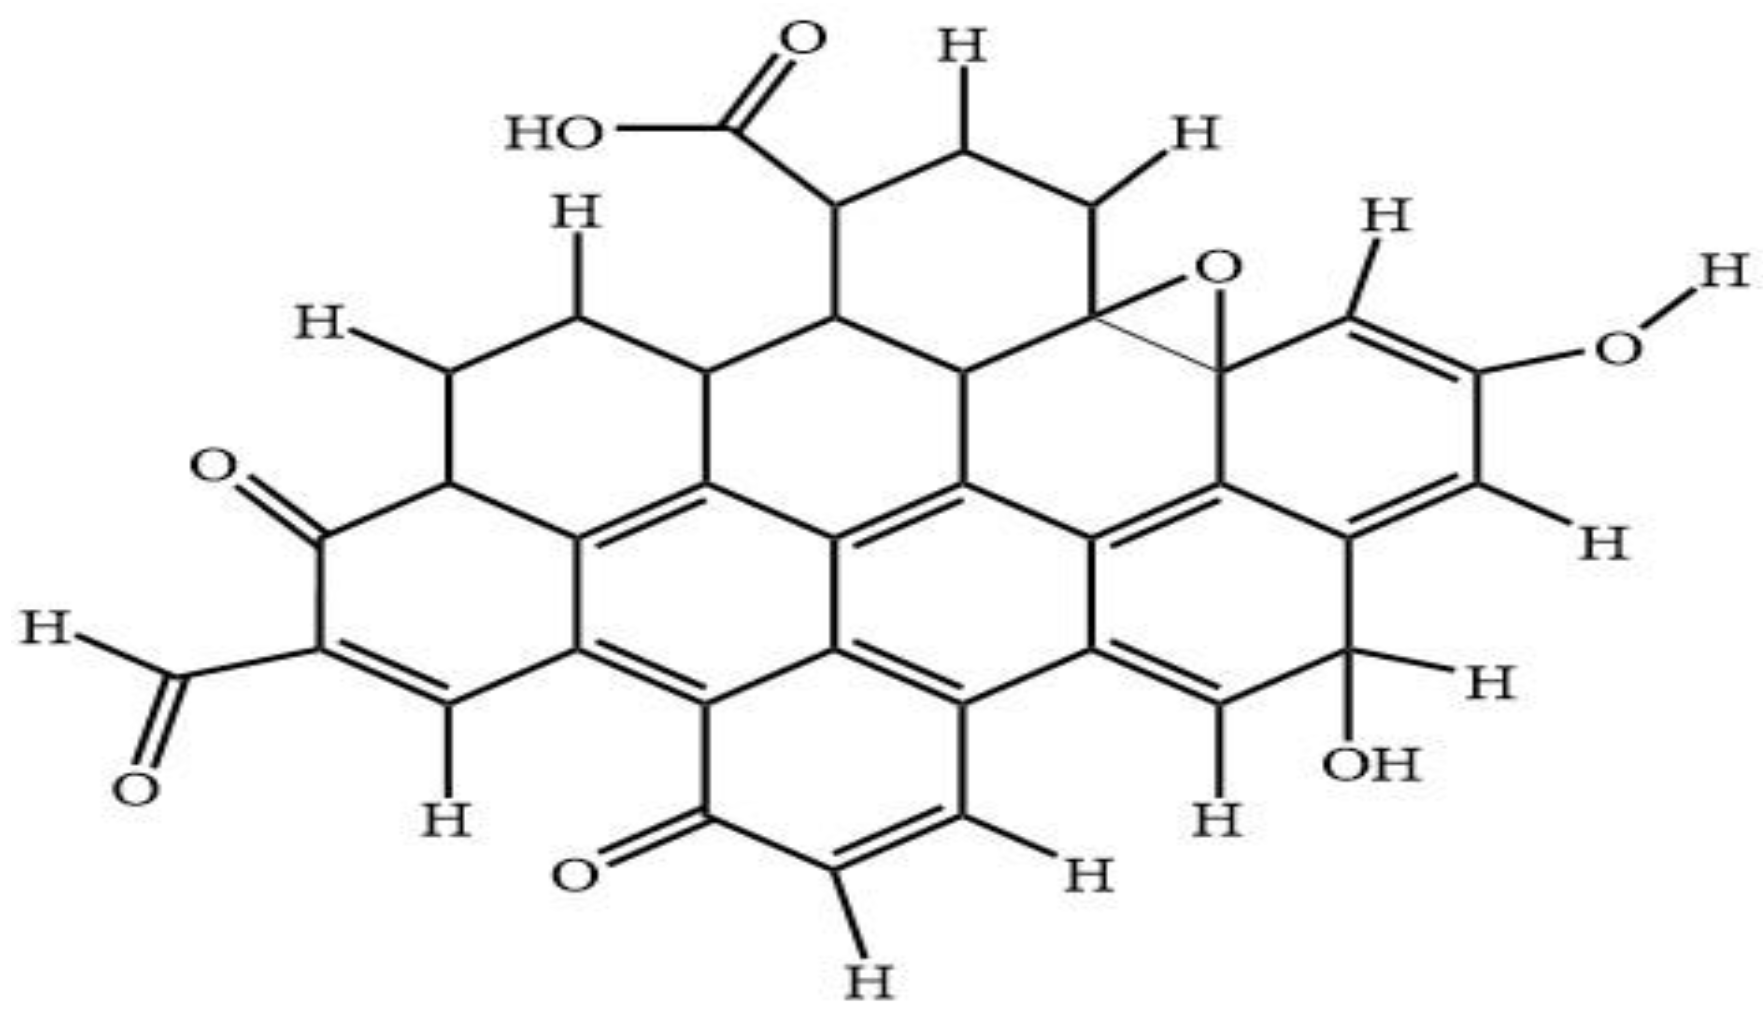
Figure 8 shows the predicted model structure for DFT simulation of CQD. The CQD structure was constructed such that the terminal carbon atoms are attached by hydrogen atoms, hydroxyl and carboxyl group, to study the possibility of band edge position tuning. The method and basis set were DFT (B3LYP) [
46,
47,
48,
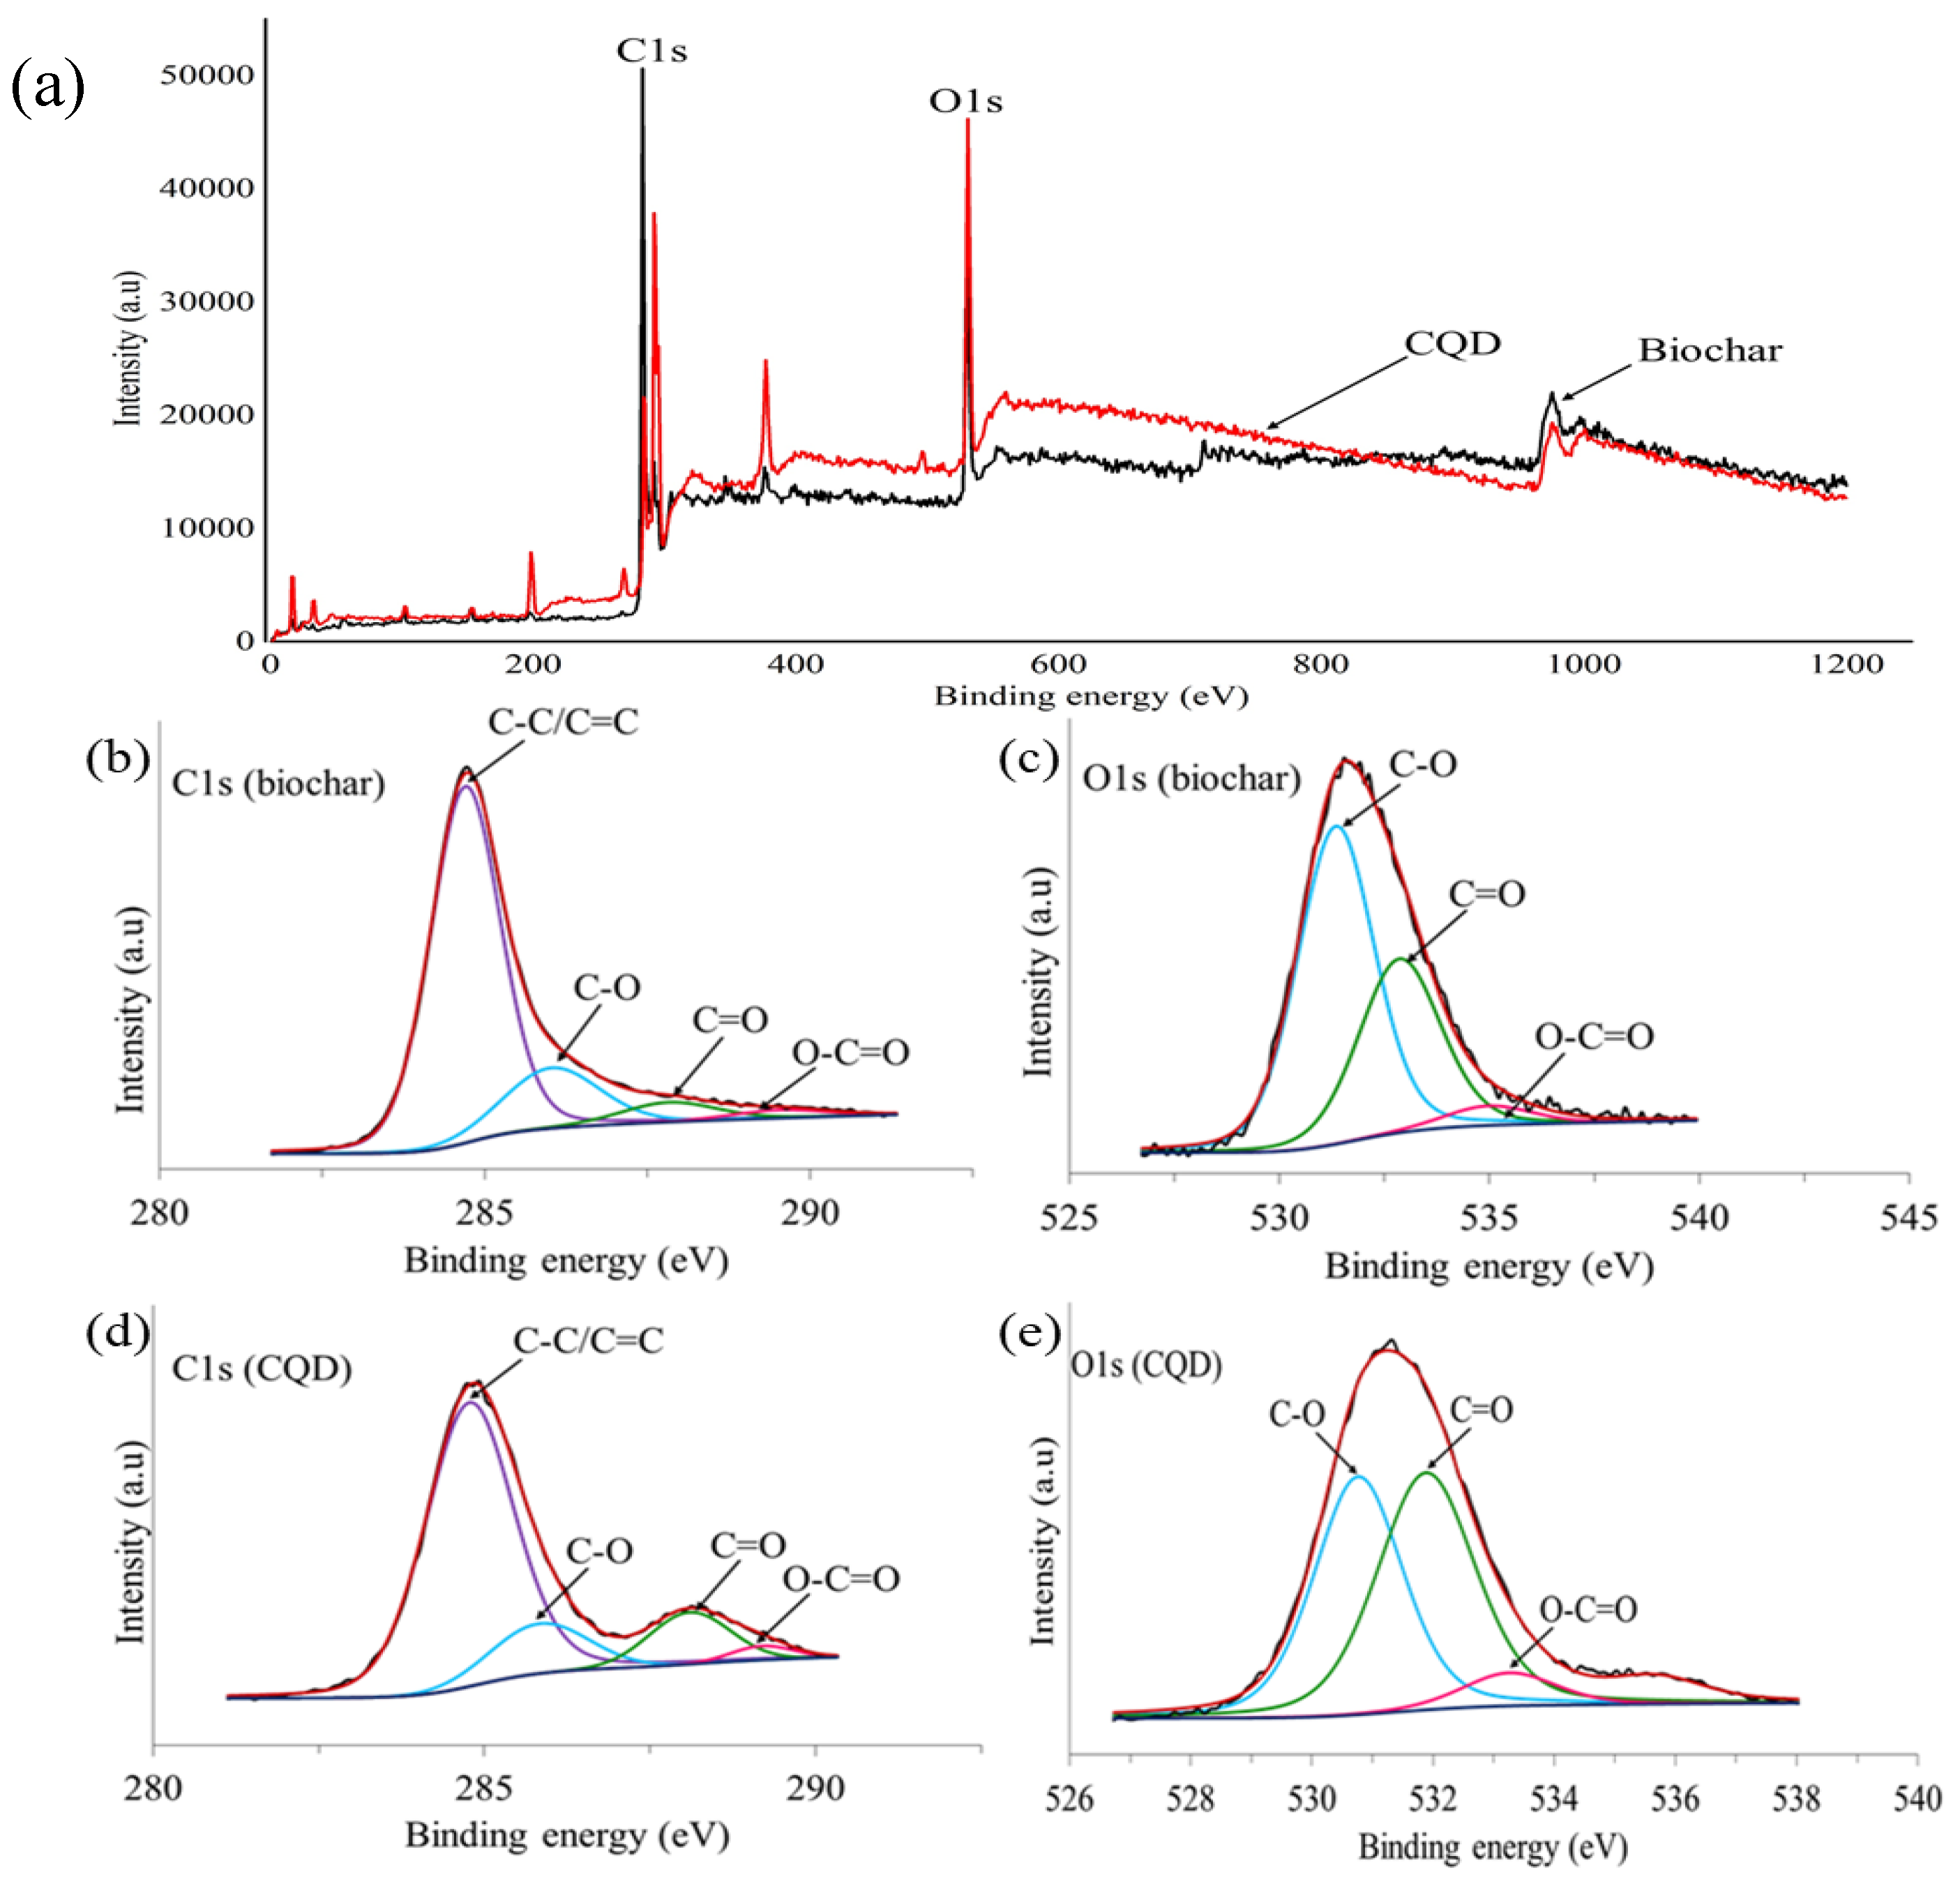
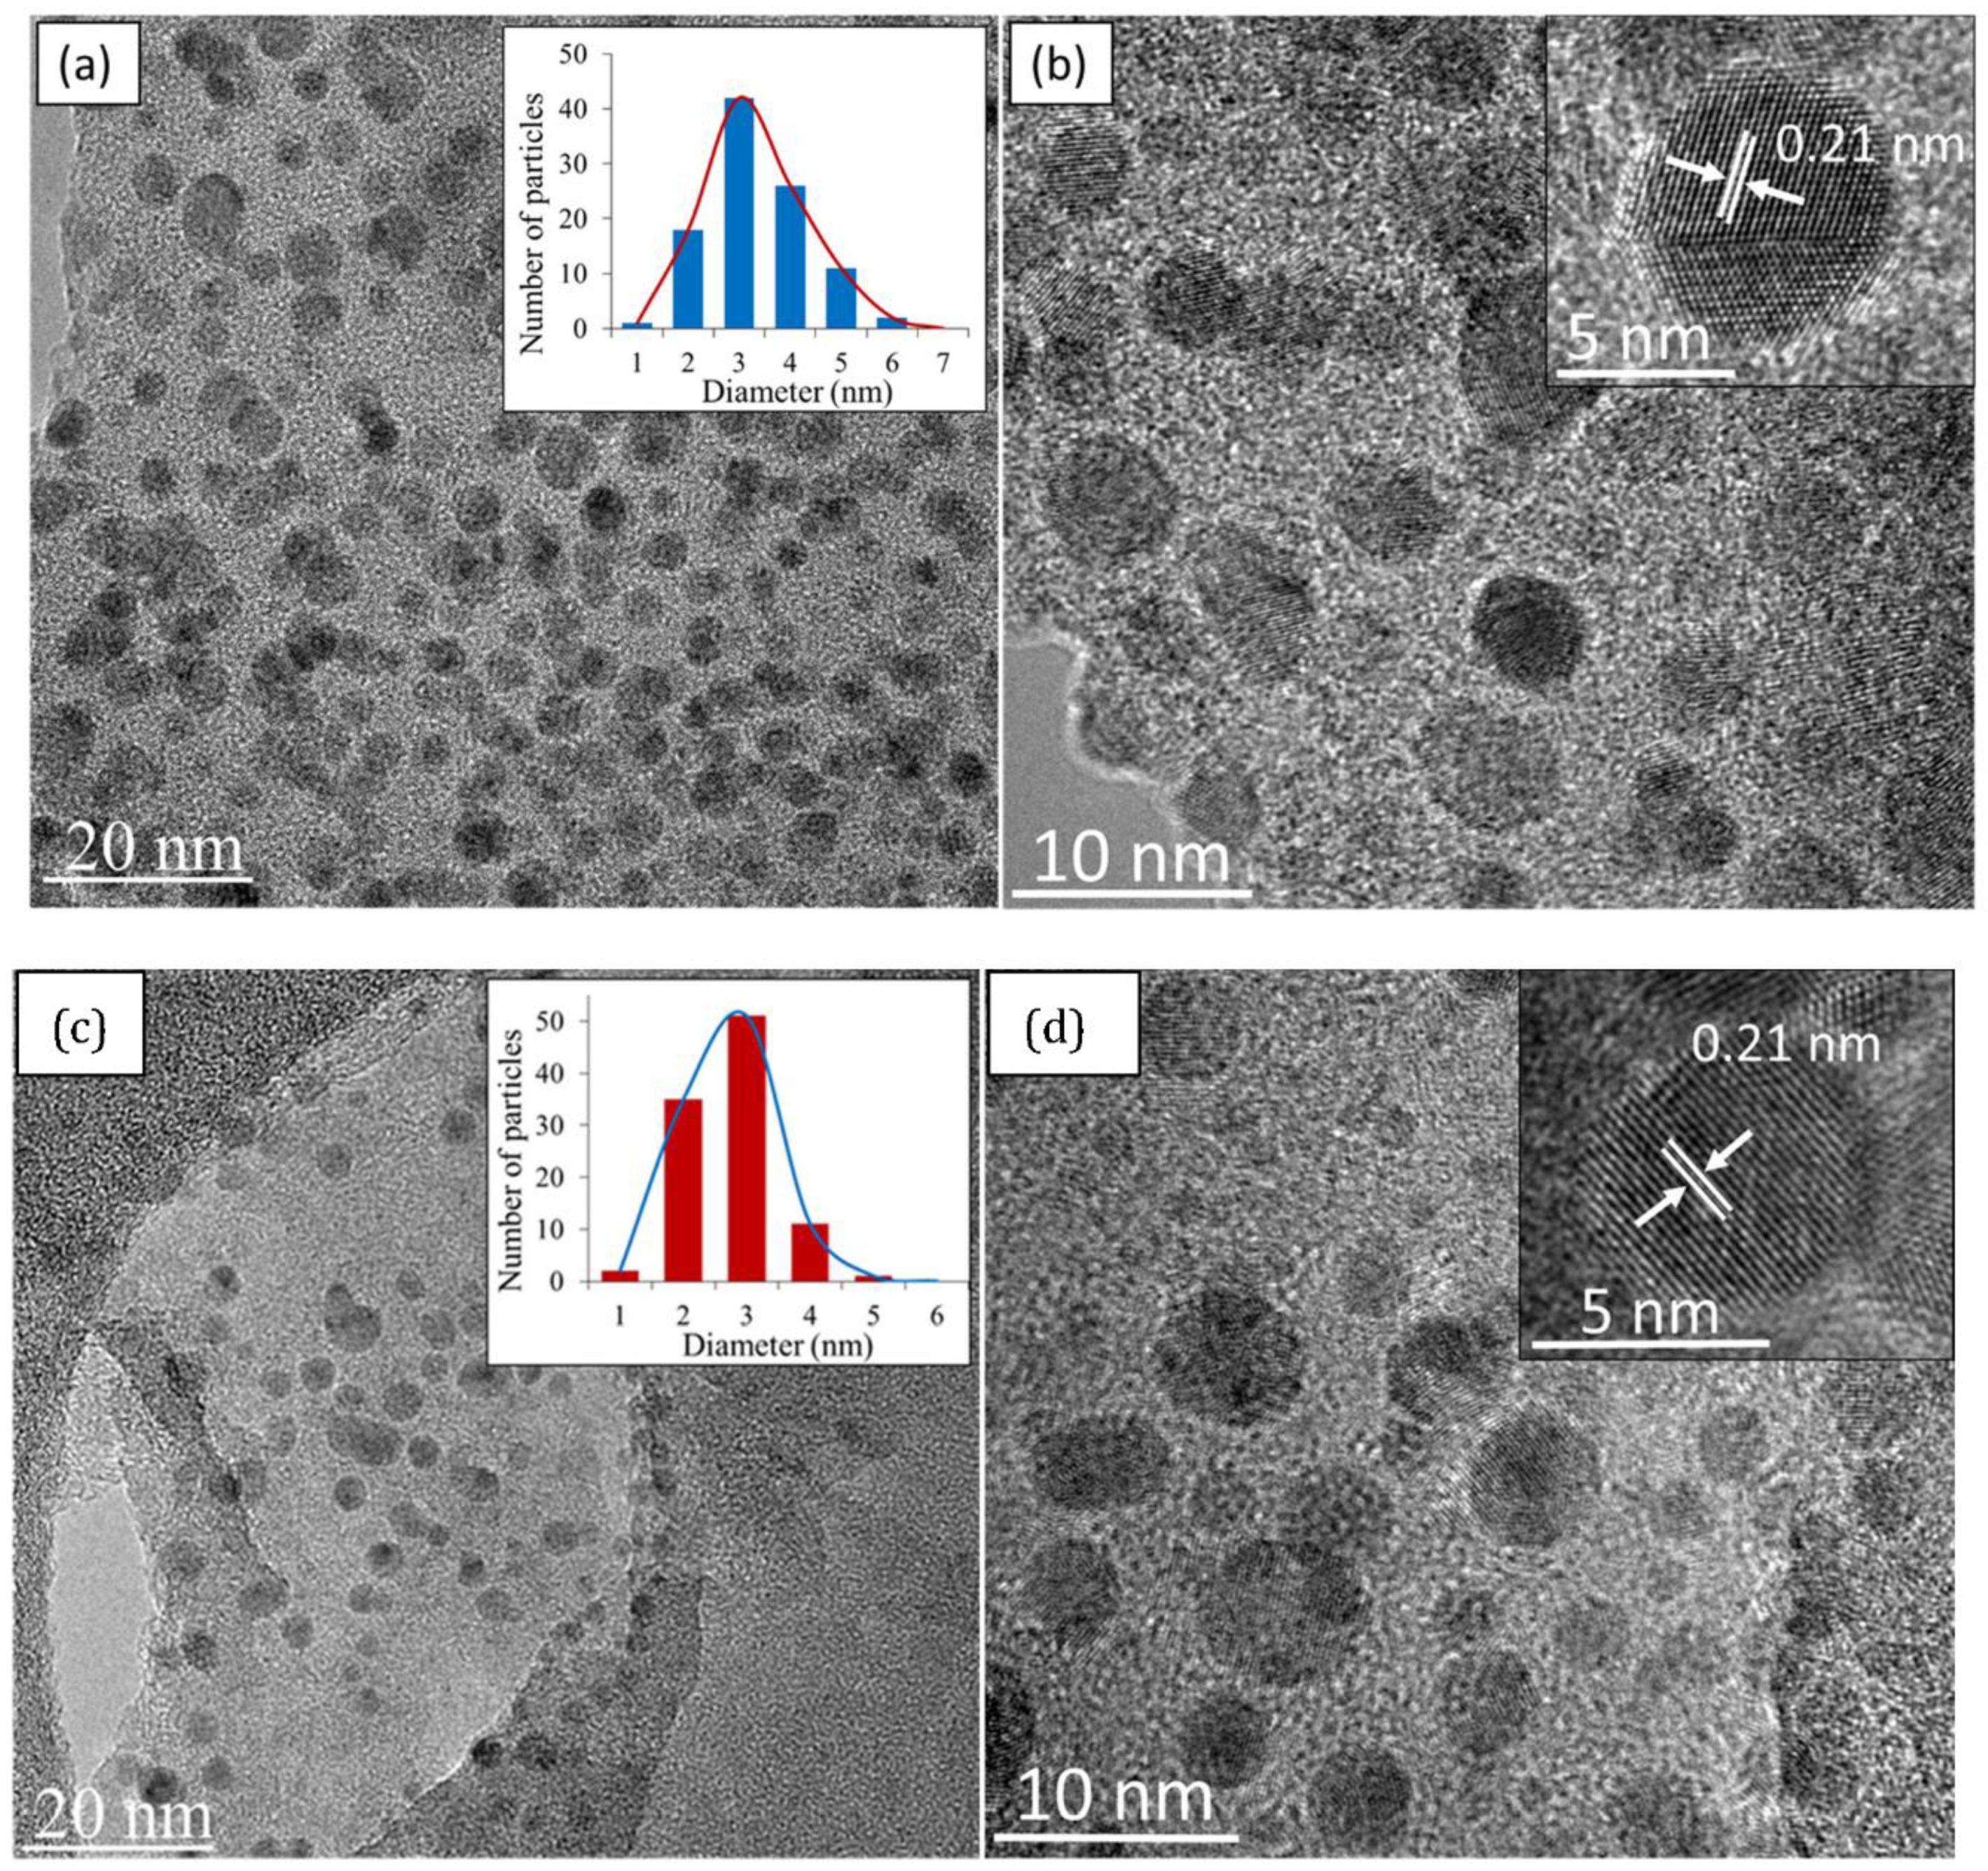
49] and 6-31G (p) in singlet spin form. The modelling was carried out in the ground state which means the lowest energy state. The simulation was undertaken vigorously from the maximum energy of the first structure until the minimum energy of the last structure was achieved. The simulation was done for different aromatic ring number including 9, 10 and 12 to find the best and optimum structure. The DFT calculation was dependent on charge distribution on the surface of molecular. In accordance with FTIR, XPS and TEM results, the molecular structure of CQD consists of C–O–C and C=C and the particle size was 3 nm.
The molecular structure was investigated using specific methods including Coulomb-attenuating method-3-parameter, Lee–Yang–Parr CAM-B3LYP and Becke, 3-parameter, Lee–Yang–Parr (B3LYP) with the base set as 6-31G(p). As a result, the molecule structure of CQD was derived from the simulation in the 103, 83, and 162 forms for 9, 10 and 12 rings, respectively. The parameters such as maximum force, root mean square RMS force, and RMS displacement were converged, and maximum displacement was not converged when the simulation was done using CAM-B3LYP method whereas all parameters were converged when the simulation was done under B3LYP method. The pertinent parameters are given in
Table 3. The minimum energy, maximum energy, and dipole momentum for molecule structure of CQD with 9, 10, and 12 rings have been presented in the
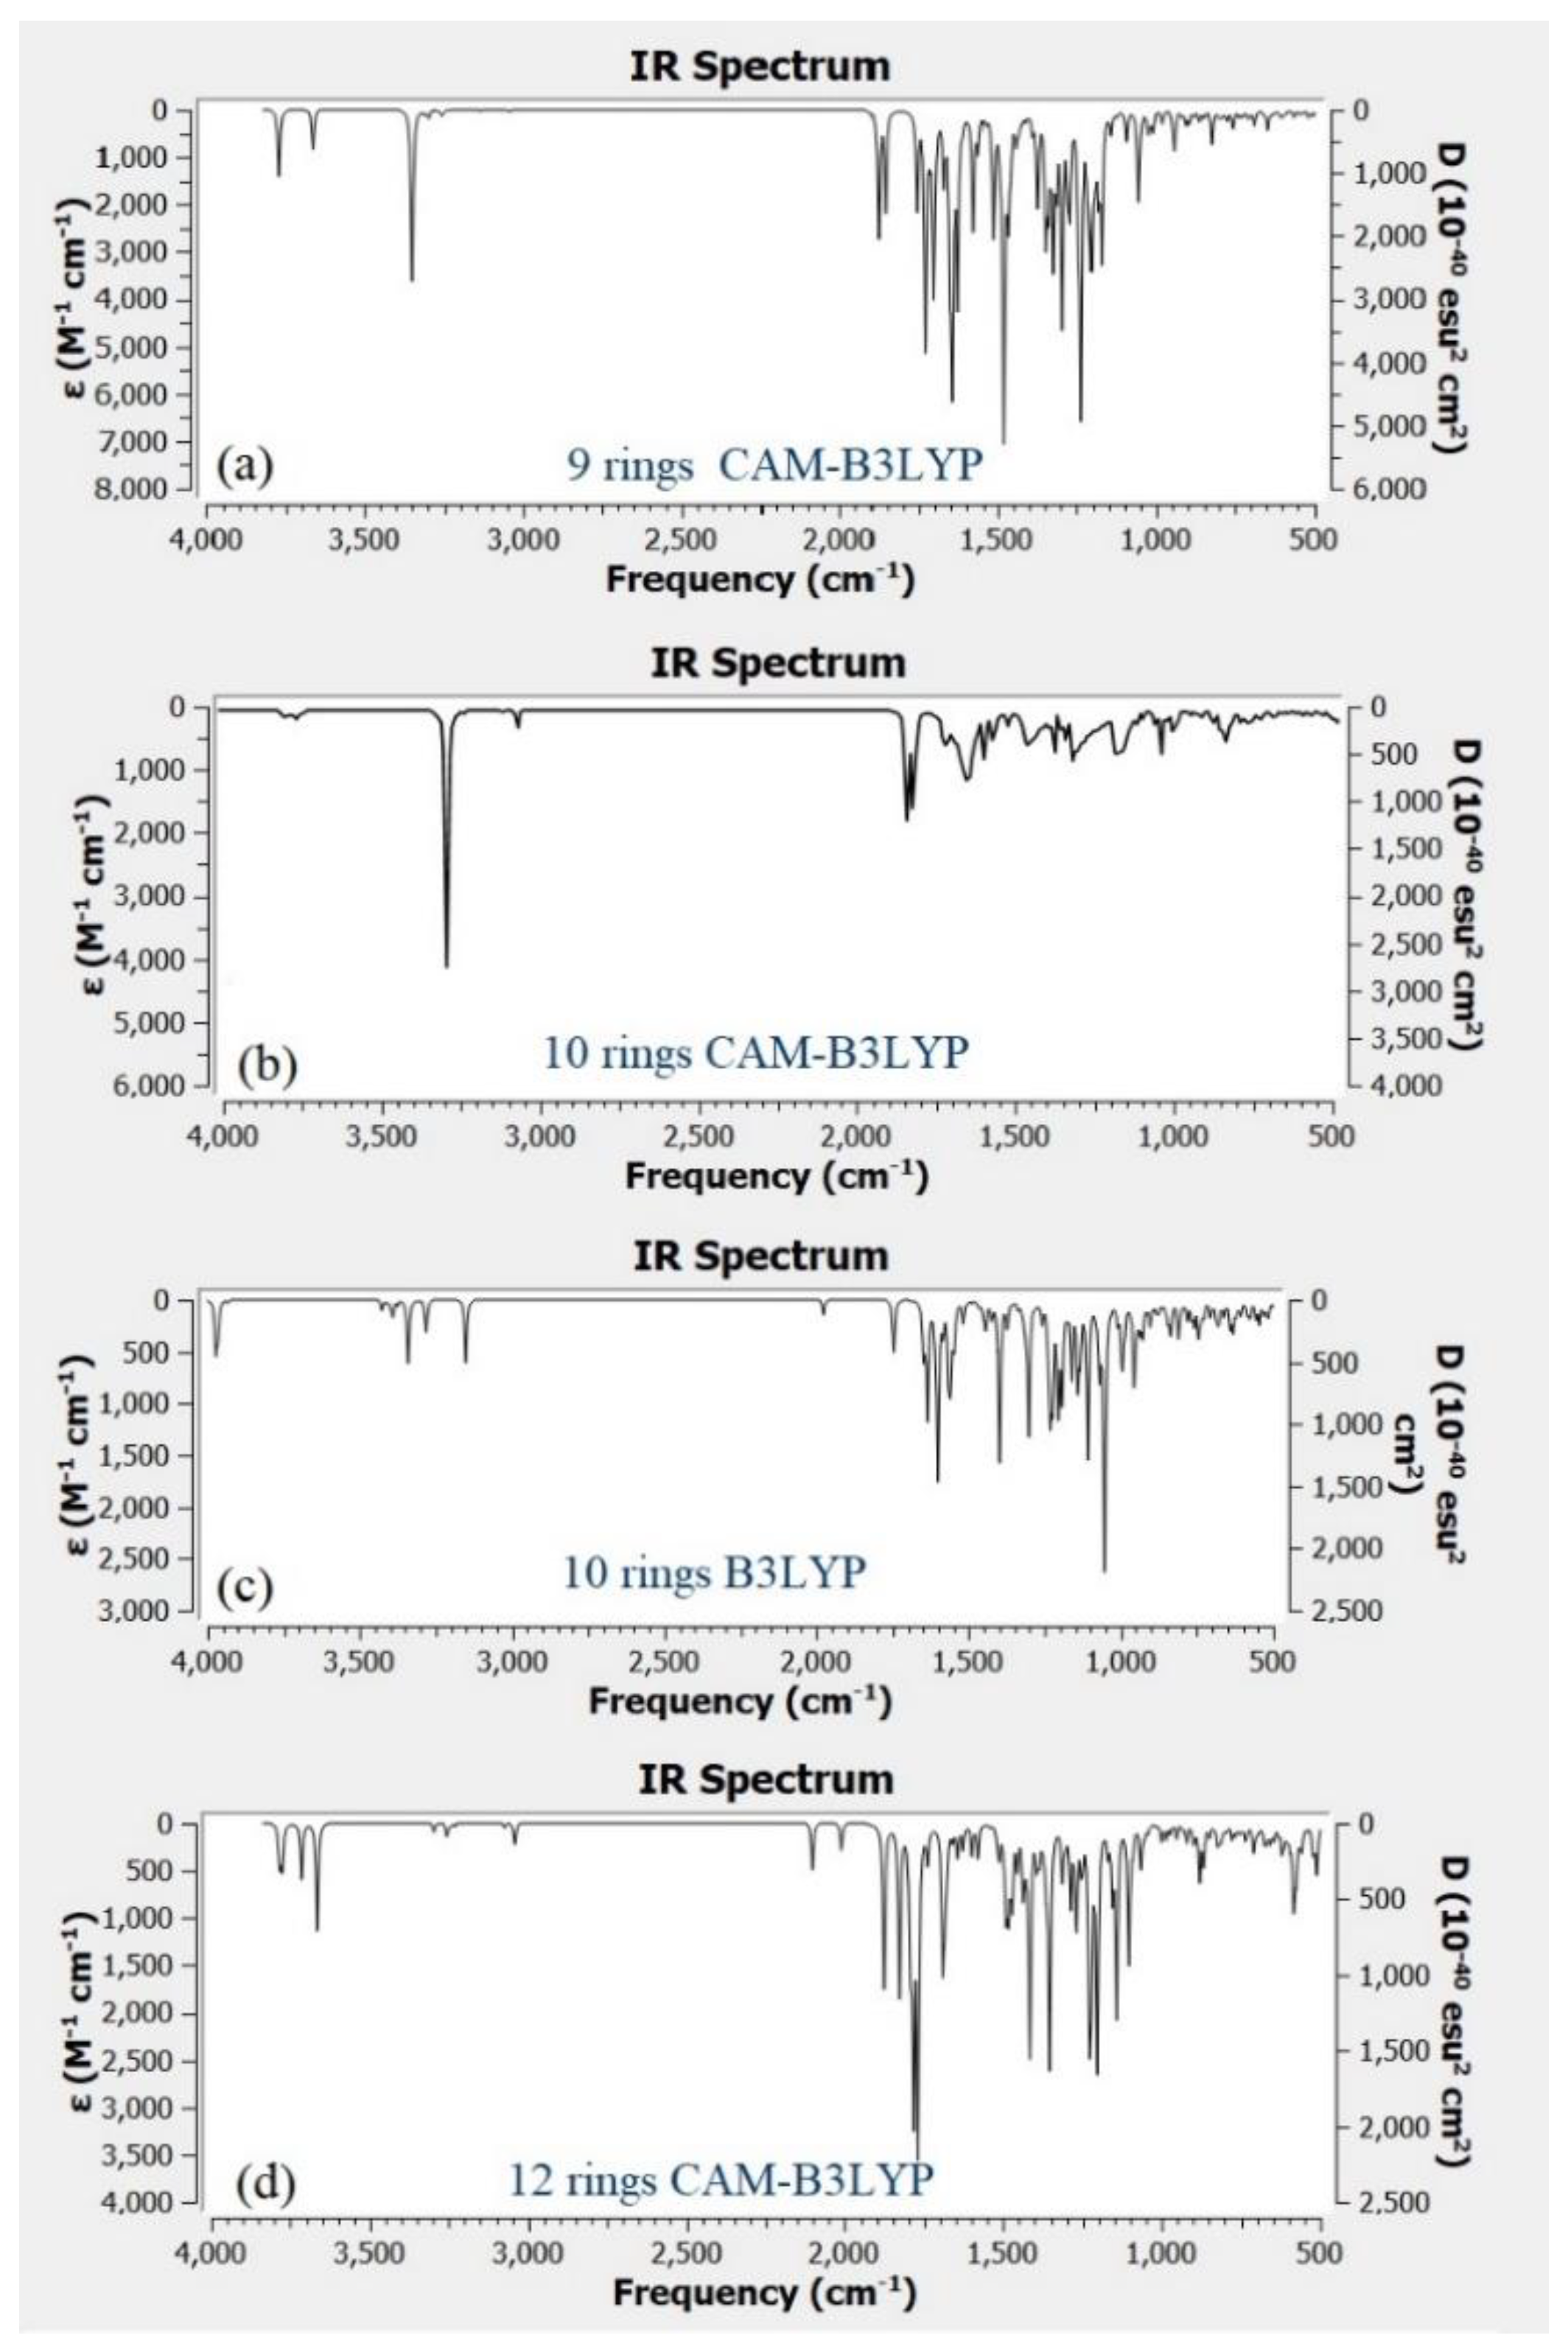
Table 4. Moreover, the FTIR spectra were derived from simulation of CQD with different ring number (9, 10 and 12).
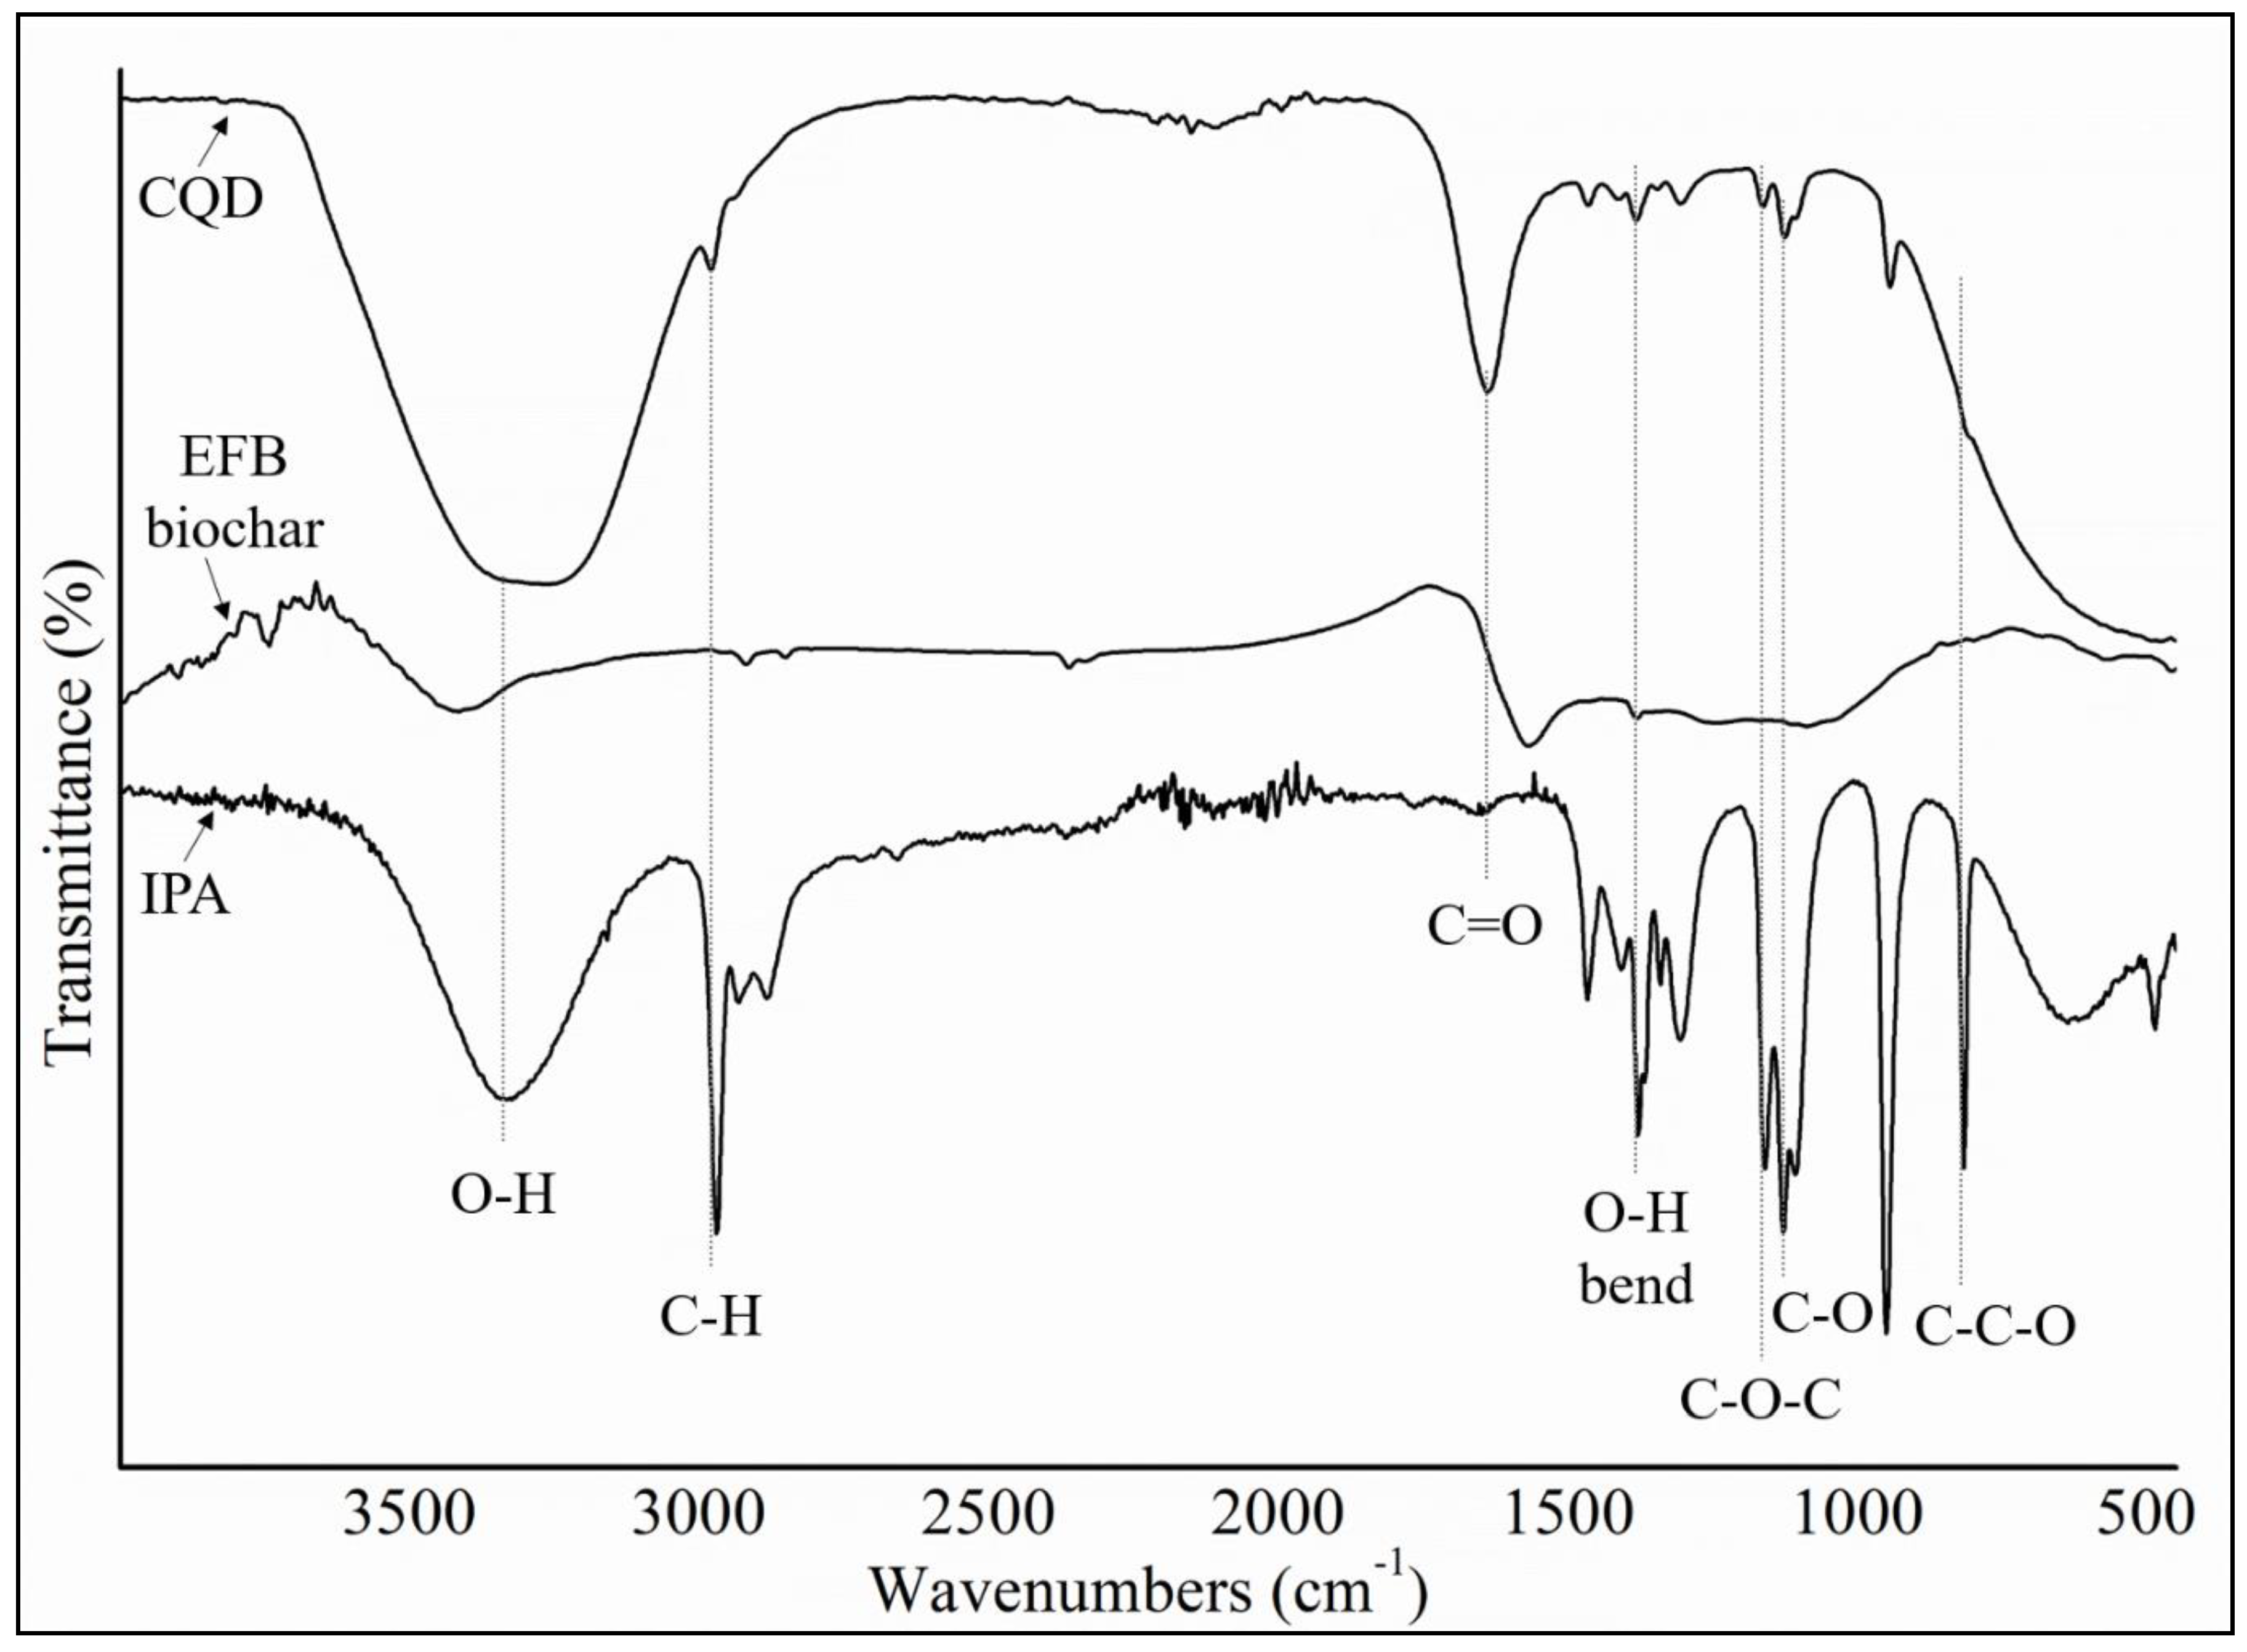
Figure 9a–d shows the IR spectra for different structure of CQD. Based on the experimental FTIR result, the main peaks occurred at 3290, 1641, 1421, and 1047 cm
−1.
Figure 9b shows the main peaks of CQD at 3292, 2990, 1638, 1457, 1049 cm
−1 assigned to the O–H, C–H, C=O, C=C, and C–O stretching vibrations, respectively. As a comparison with the experimental FTIR result as presented in
Figure 4, the position and intensity peaks for CQD structure with 10 rings matched with the intensity and position of FTIR peaks in experimental results well. The FTIR simulation spectra for 9 and 12 rings show the main peaks in other position of the intensity peaks which are greater or lower than the experimental FTIR result for CQD. In the FTIR spectrum for 10 rings, not only the position of the peaks for O–H, C=O, C=C, and C–O stretching vibrations appeared near the experimental FTIR spectrum but also the peak intensity of FTIR spectrum are near to experimental results. Furthermore, the FTIR spectrum for CA-B3LYP method is better matched to experimental FTIR results that B3LYP method. As a result, molecule structure of CQD with 10 rings is a suitable model to propose structure of CQD.
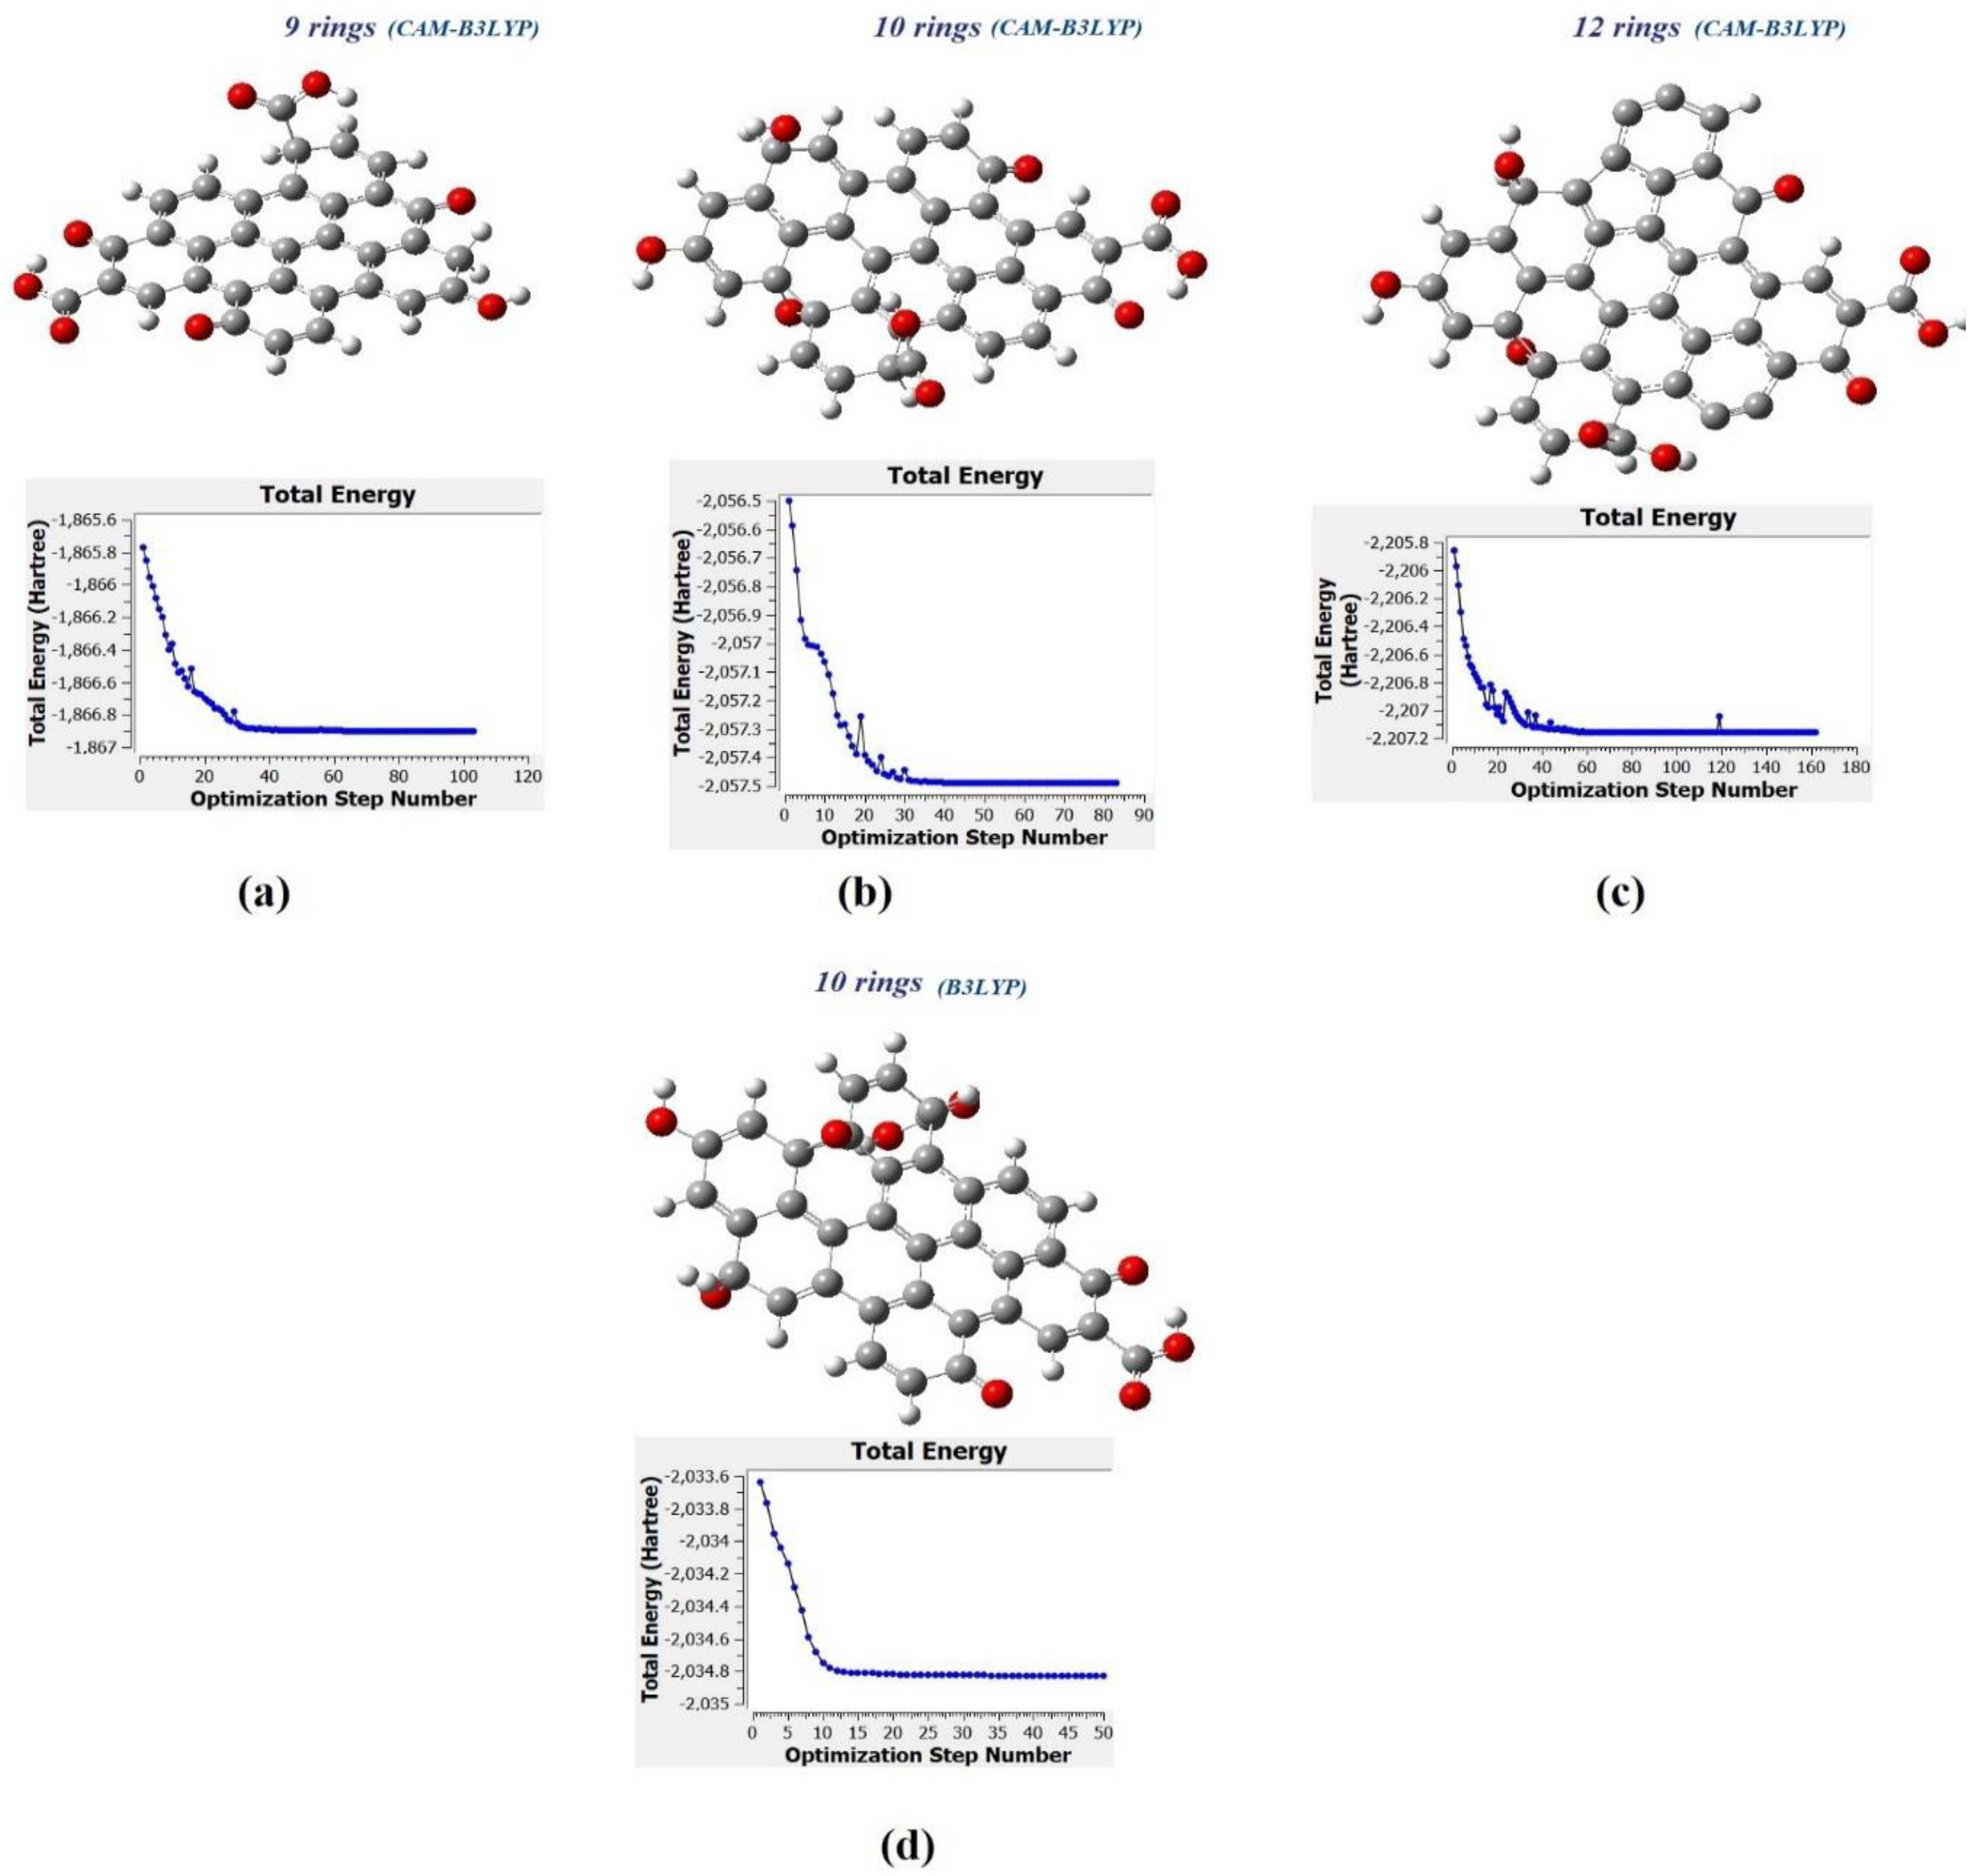
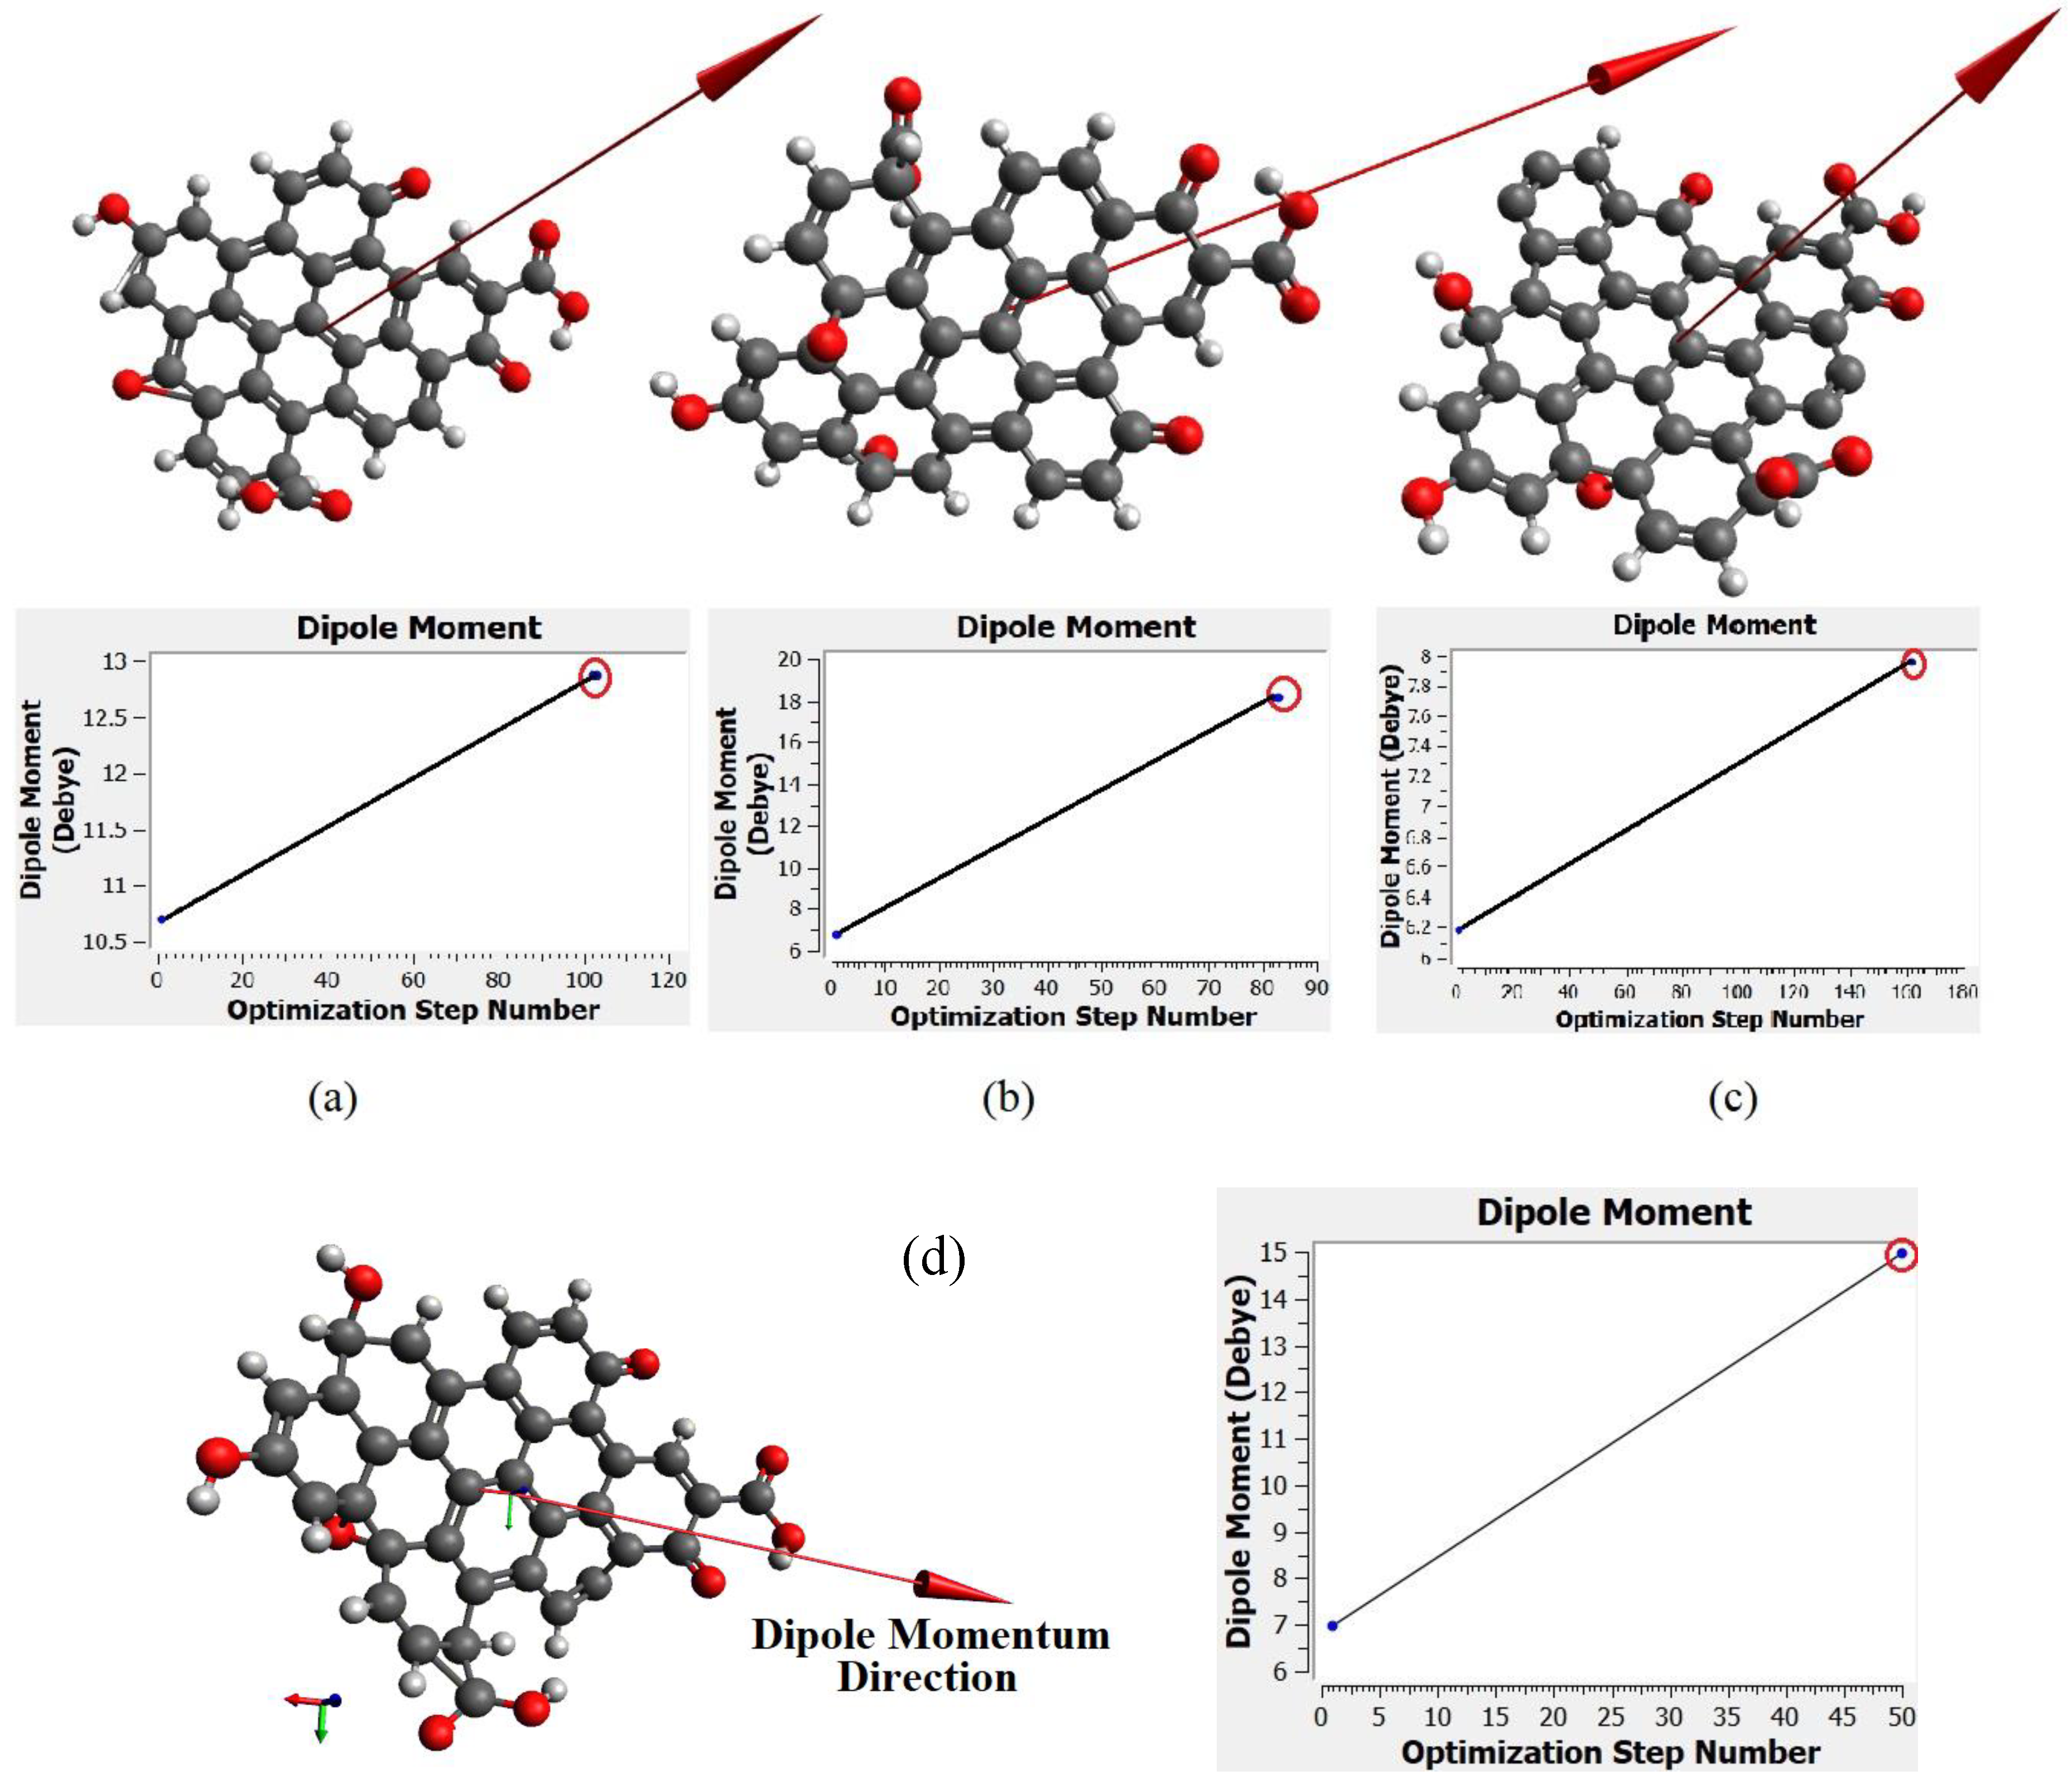
Figure 10a–c show the molecular structure of CQD with 9, 10, 12 rings, respectively that was obtained with the CAM-B3LYP method; and
Figure 10d shows the molecule structure of CQD with 10 rings (B3LYP) that found from B3LYP method. These molecular structures are in the stable form with minimum energy equal to −1866.9022, −2057.4905, −2207.1601, and −2034.8 Hartree which were derived from
Figure 10. The optimal structure was obtained when the maximum force and maximum displacement were less than threshold and the minimum energy was achieved. The pertinent parameter is summarized in
Table 4.
Figure 11a–d show the dipole momentum direction and amount. The dipole momentum for first and last structure can derive from each plot, and the dipole momentum were 12.8650, 18.1699, 7.9503 and 14.979 Debye, at the stable molecular structure of CQD at minimum energy. Consequently, the optimal structure was derived from DFT/CAM-B3LYP/6-31G (p).
To continue the calculation, CAM-B3YLP method was used based on 6-31G (p) for a 10-ring molecule of CQD. The optimum structure at ground state was used for Natural Bond Orbital NBO analysis. The NBO analysis is significant to investigate the intra and inter molecular bonding, interaction among bonds, and charge distribution on the surface of CQD molecule. NBO provides molecular information such as population of Lewis and non-Lewis structure, the number of core (CR), two-centre bond (BD), three-centre bond (3C), long-pair NBO, non-Lewis (NL) with high occupancy, and Lewis (L) with low-occupancy orbital as shown in
Table 5. In order to obtain the acceptable Lewis structure, the occupancy of orbitals should exceed the occupancy threshold.
Hence, the analysis of CQD in the optimum structure was continued in order to obtain the natural analysis orbital (NAO) using NBO Gaussian module. The angular momentums were s, px, py, and pz and the natural orbitals type were core, valance and Rydberg [
45,
66,
67]. The natural population of orbitals and natural charge were sorted as in the supporting data [
40,
49,
50]. The total natural charge, natural population of core, valance and Rydberg orbitals were 0, 89.9509, 213.4373, and 0.6119, respectively. This calculation reveals that the total population of natural orbital is 304.0 and 99.8% and 0.2% of total orbital are natural minimal basis and natural Rydberg basis, respectively. The maximum occupancy is 1.99971 ≈ 2 related to core orbital (1 s) with energy about −20.2569 au and the minimum occupancy is 0.00027 and occurred in Rydberg orbital (3p) with energy equal to 1.91183. The DFT calculation depends on charge distribution on the surface of molecular. Hence, an effective valance electron configuration was achieved from the natural population of orbitals and these results are summarised in
Table 6.
The occupancy of each orbital is decimal number, but the effective valance electron configuration can correspond with atomic state. For example, first carbon, first oxygen (No. 35), 39th carbon, first hydrogen (No. 44) in the
Table 7 can be described by an 1 s
22 s
0.872 p
2.943 p
0.01 (idealised sp
3), 2 s
1.732 p
4.84, 2 s
0.812 p
2.213 p
0.04 (idealised sp
2), and 1 s
0.74 electron configuration, respectively.

 ,
, 


