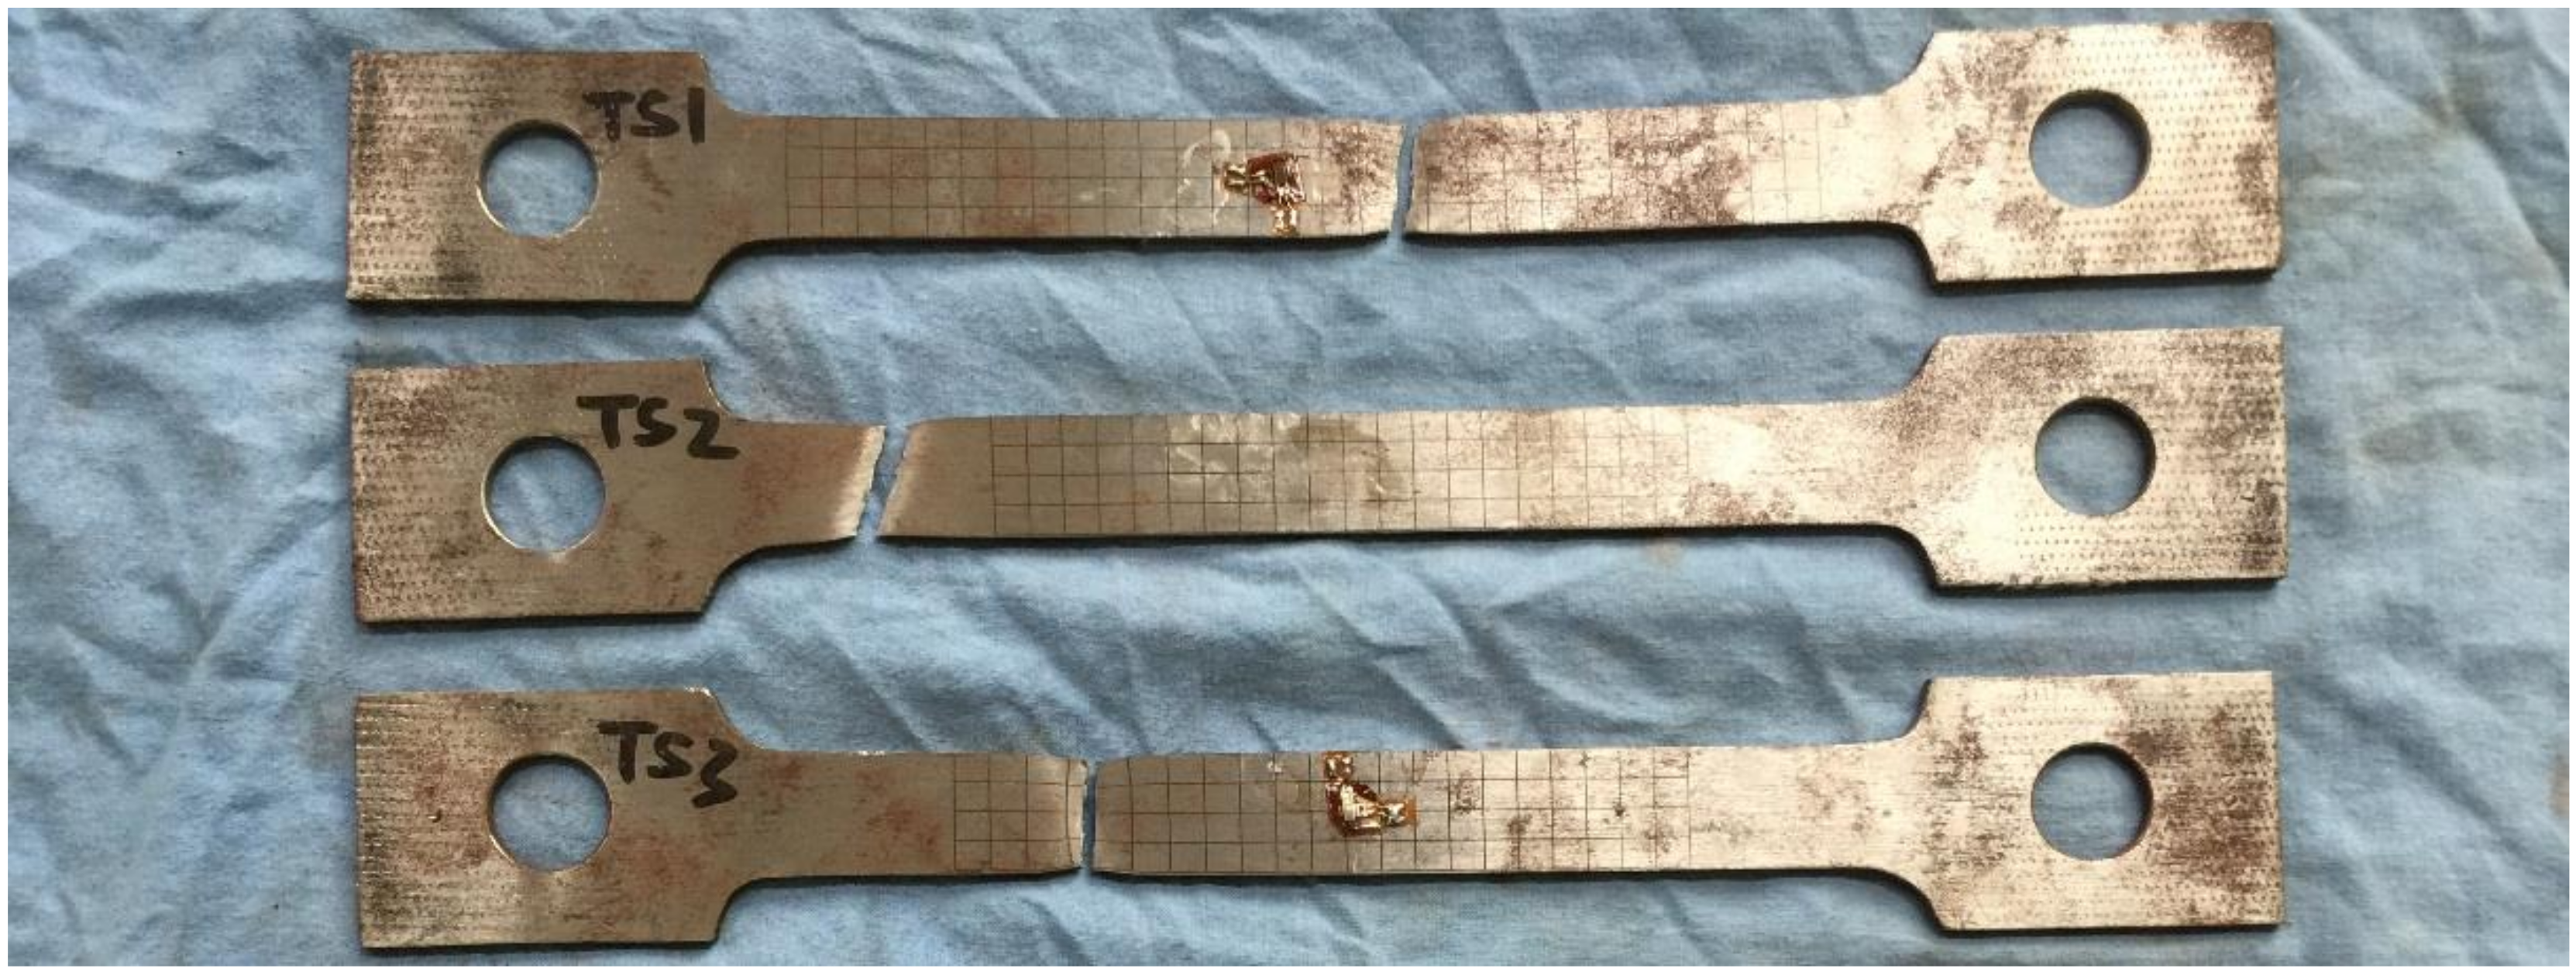
Figure 1.
Specimens of tensile testing after failure.
Figure 1.
Specimens of tensile testing after failure.
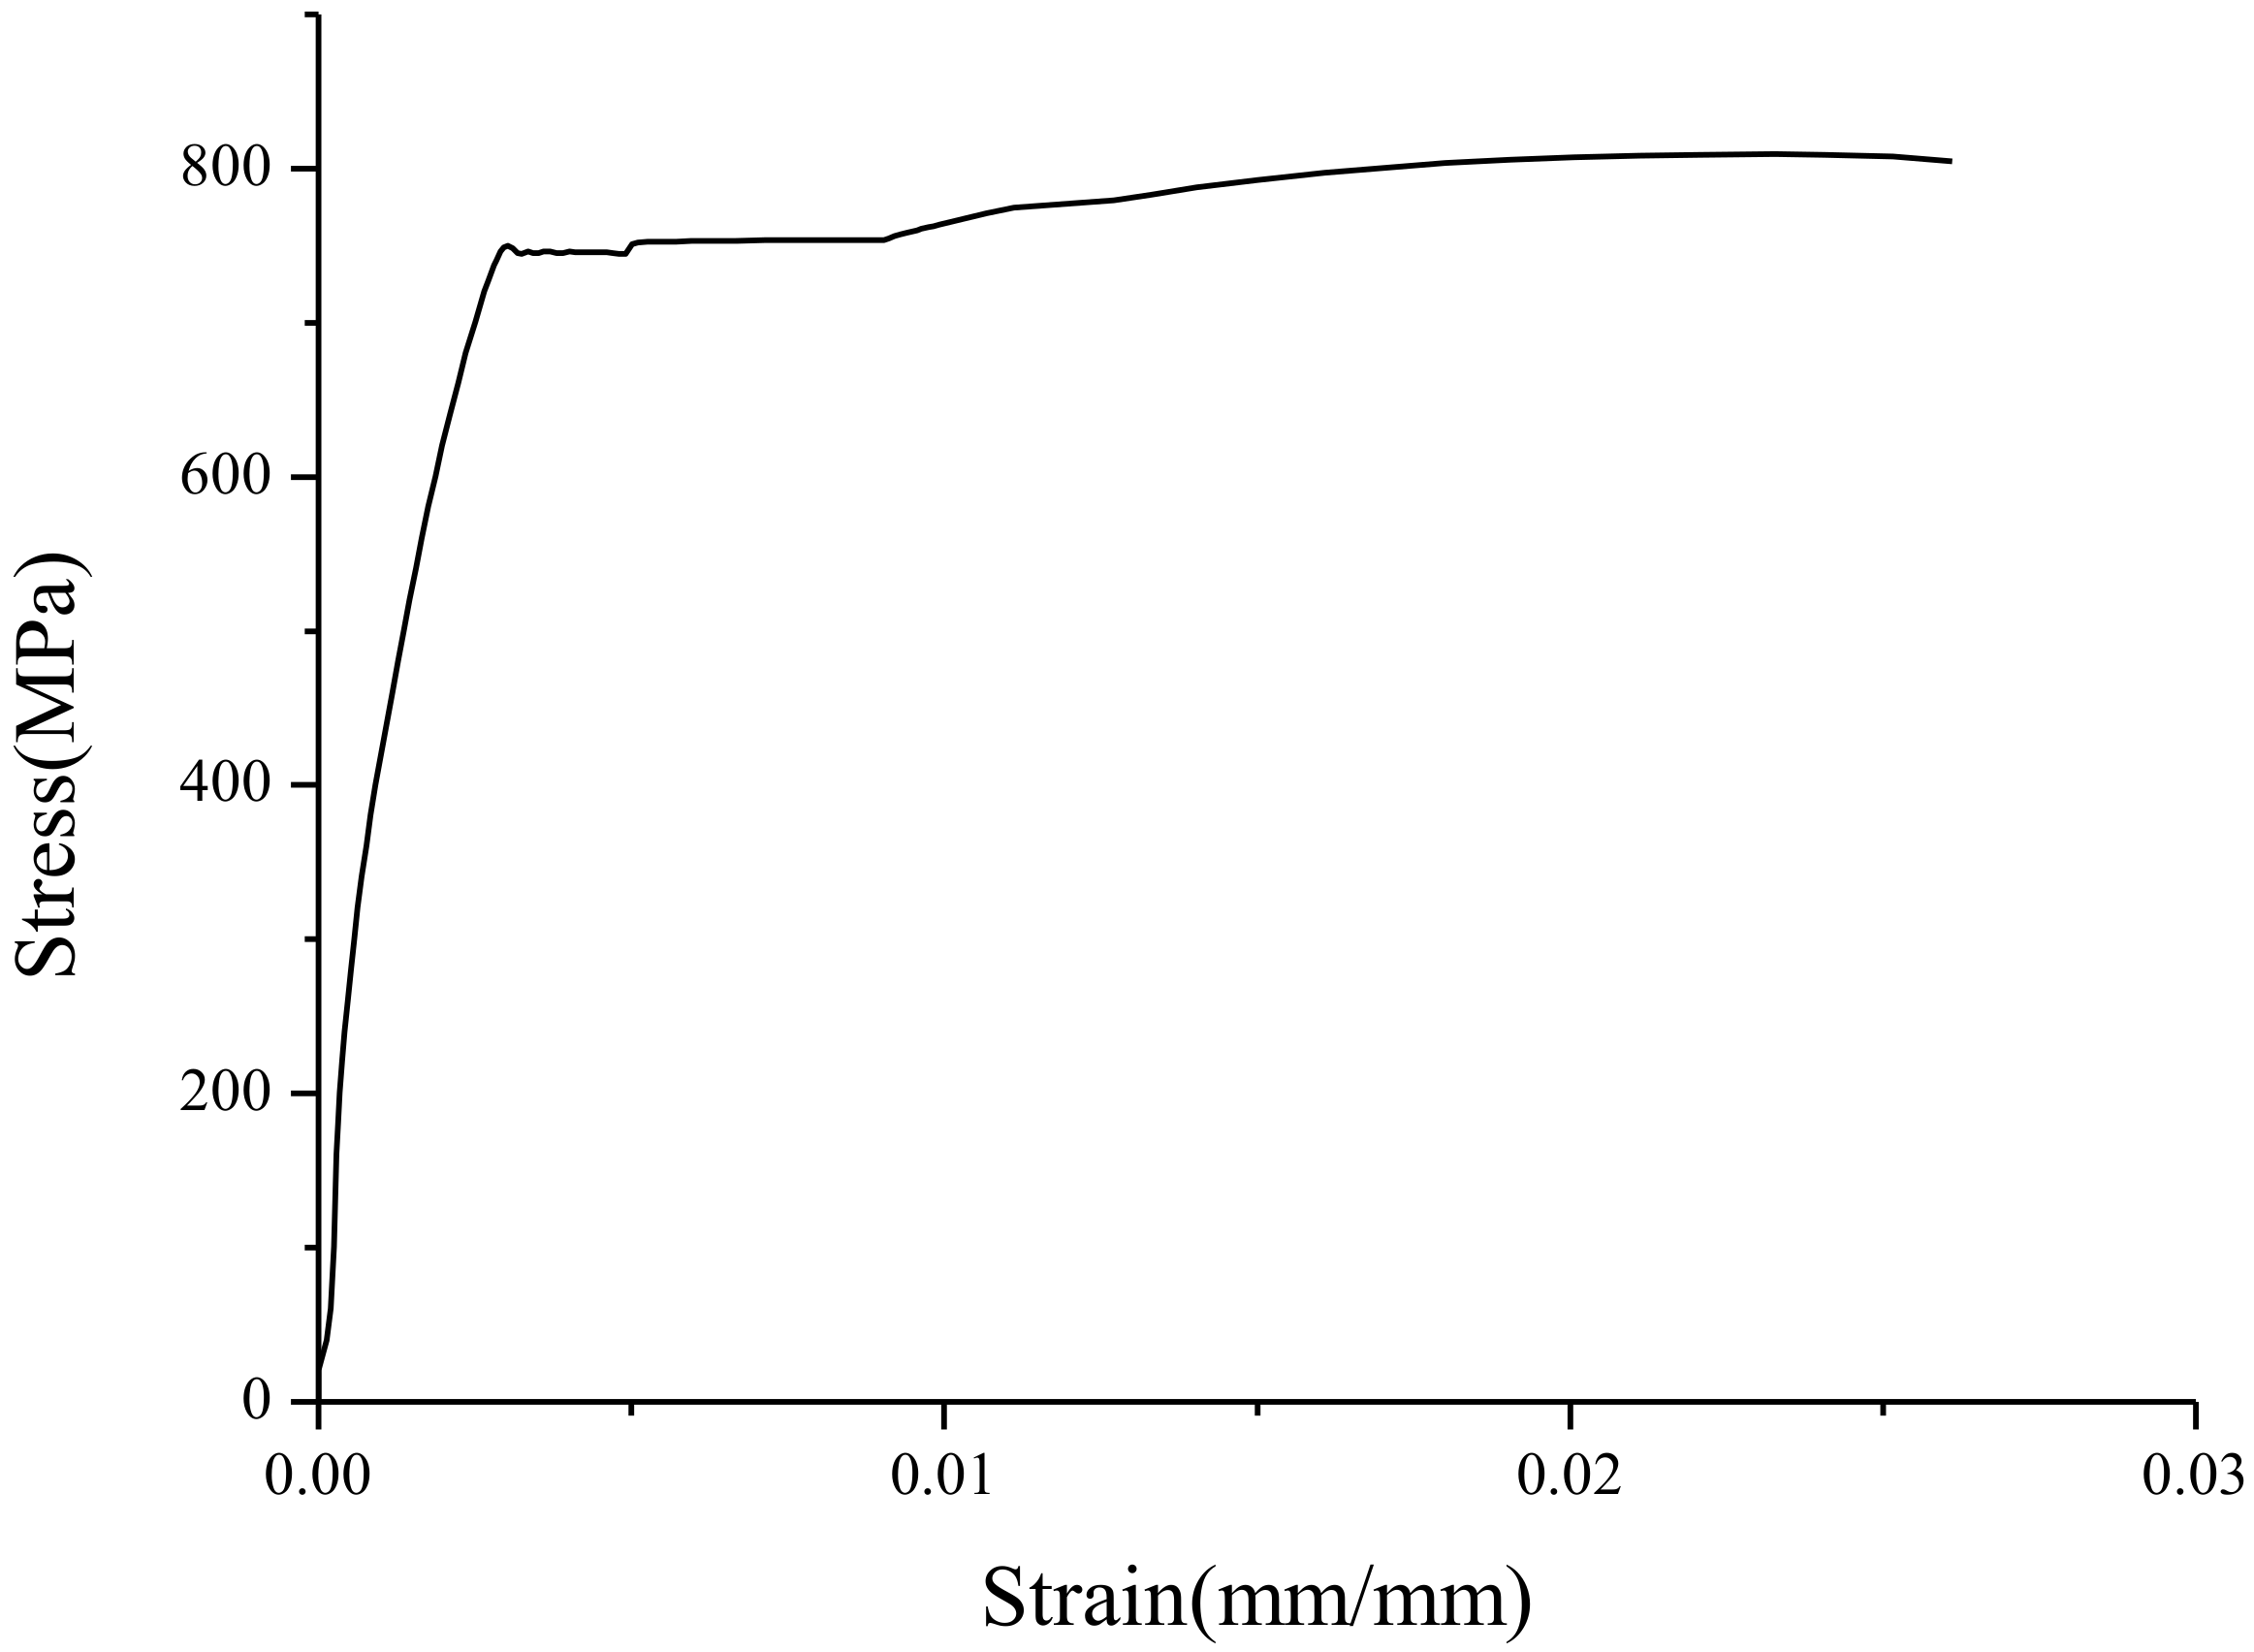
Figure 2.
Stress-strain curve of the BS700 high-strength steel TS1 specimen.
Figure 2.
Stress-strain curve of the BS700 high-strength steel TS1 specimen.
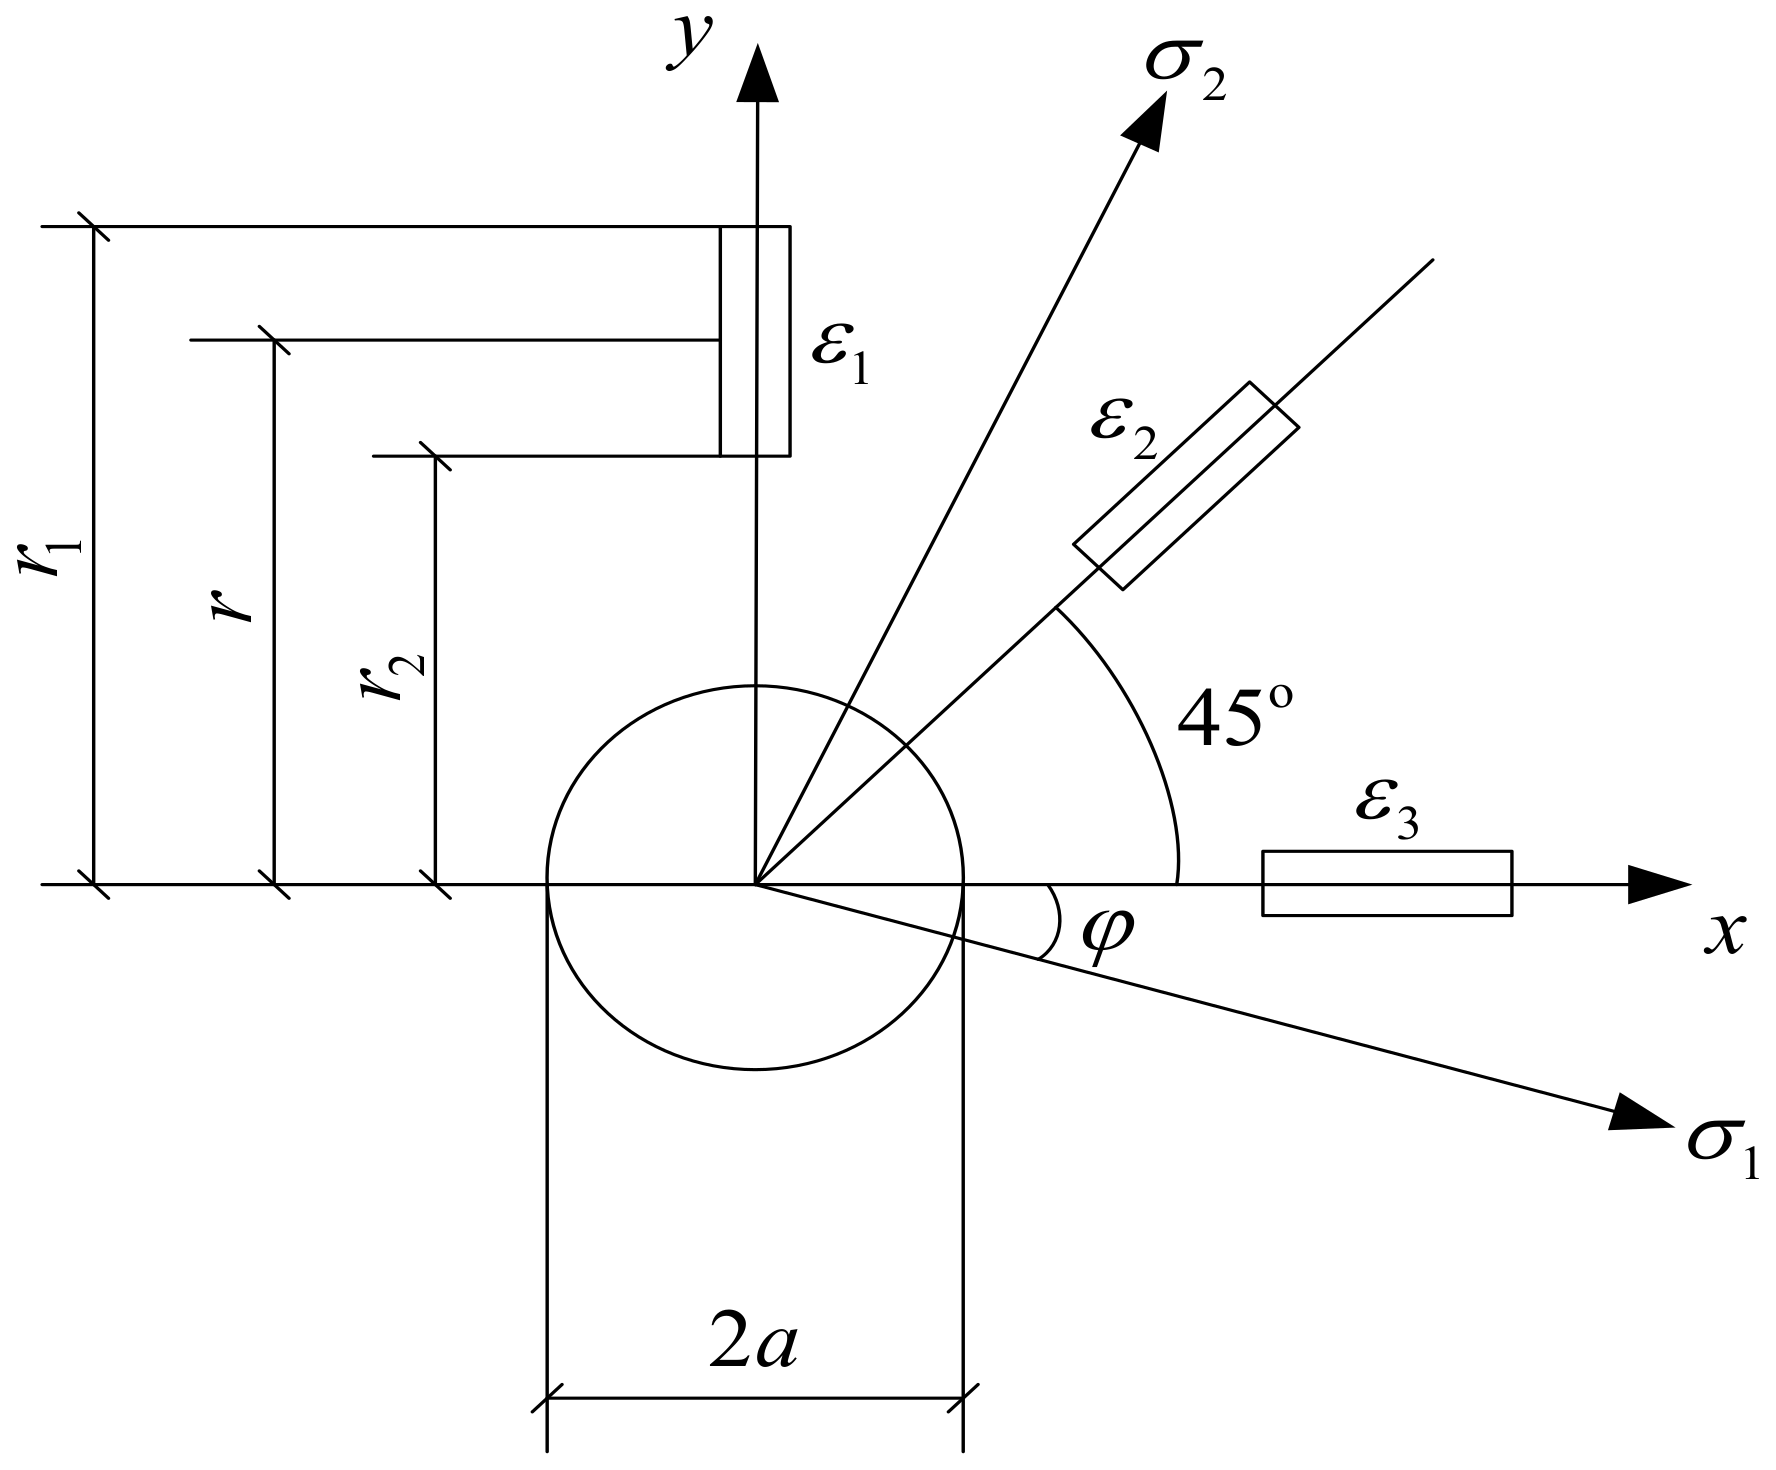
Figure 3.
Principle of blind-hole drilling method.
Figure 3.
Principle of blind-hole drilling method.
Figure 4.
Calibration specimen strain rosette’s layout.
Figure 4.
Calibration specimen strain rosette’s layout.
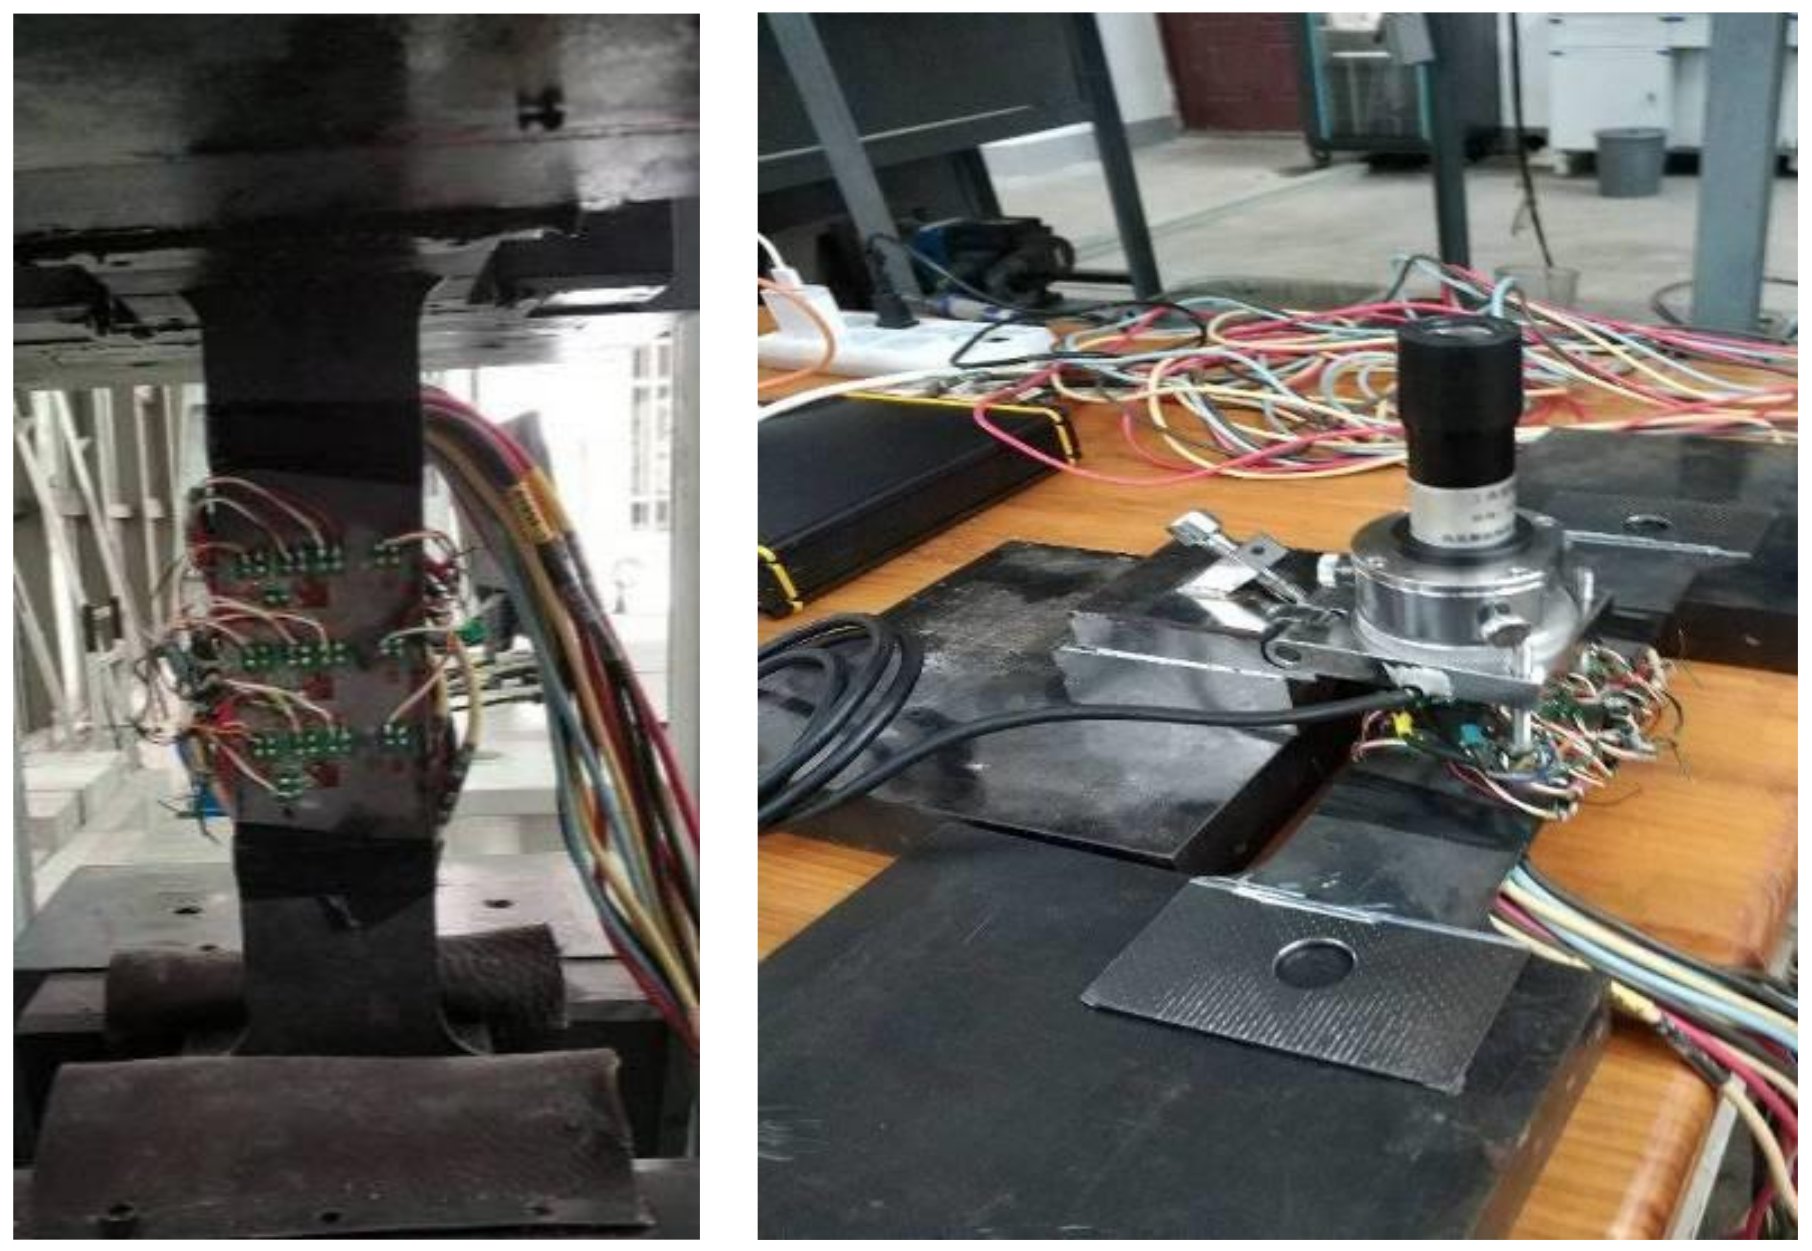
Figure 5.
Calibration coefficient test.
Figure 5.
Calibration coefficient test.
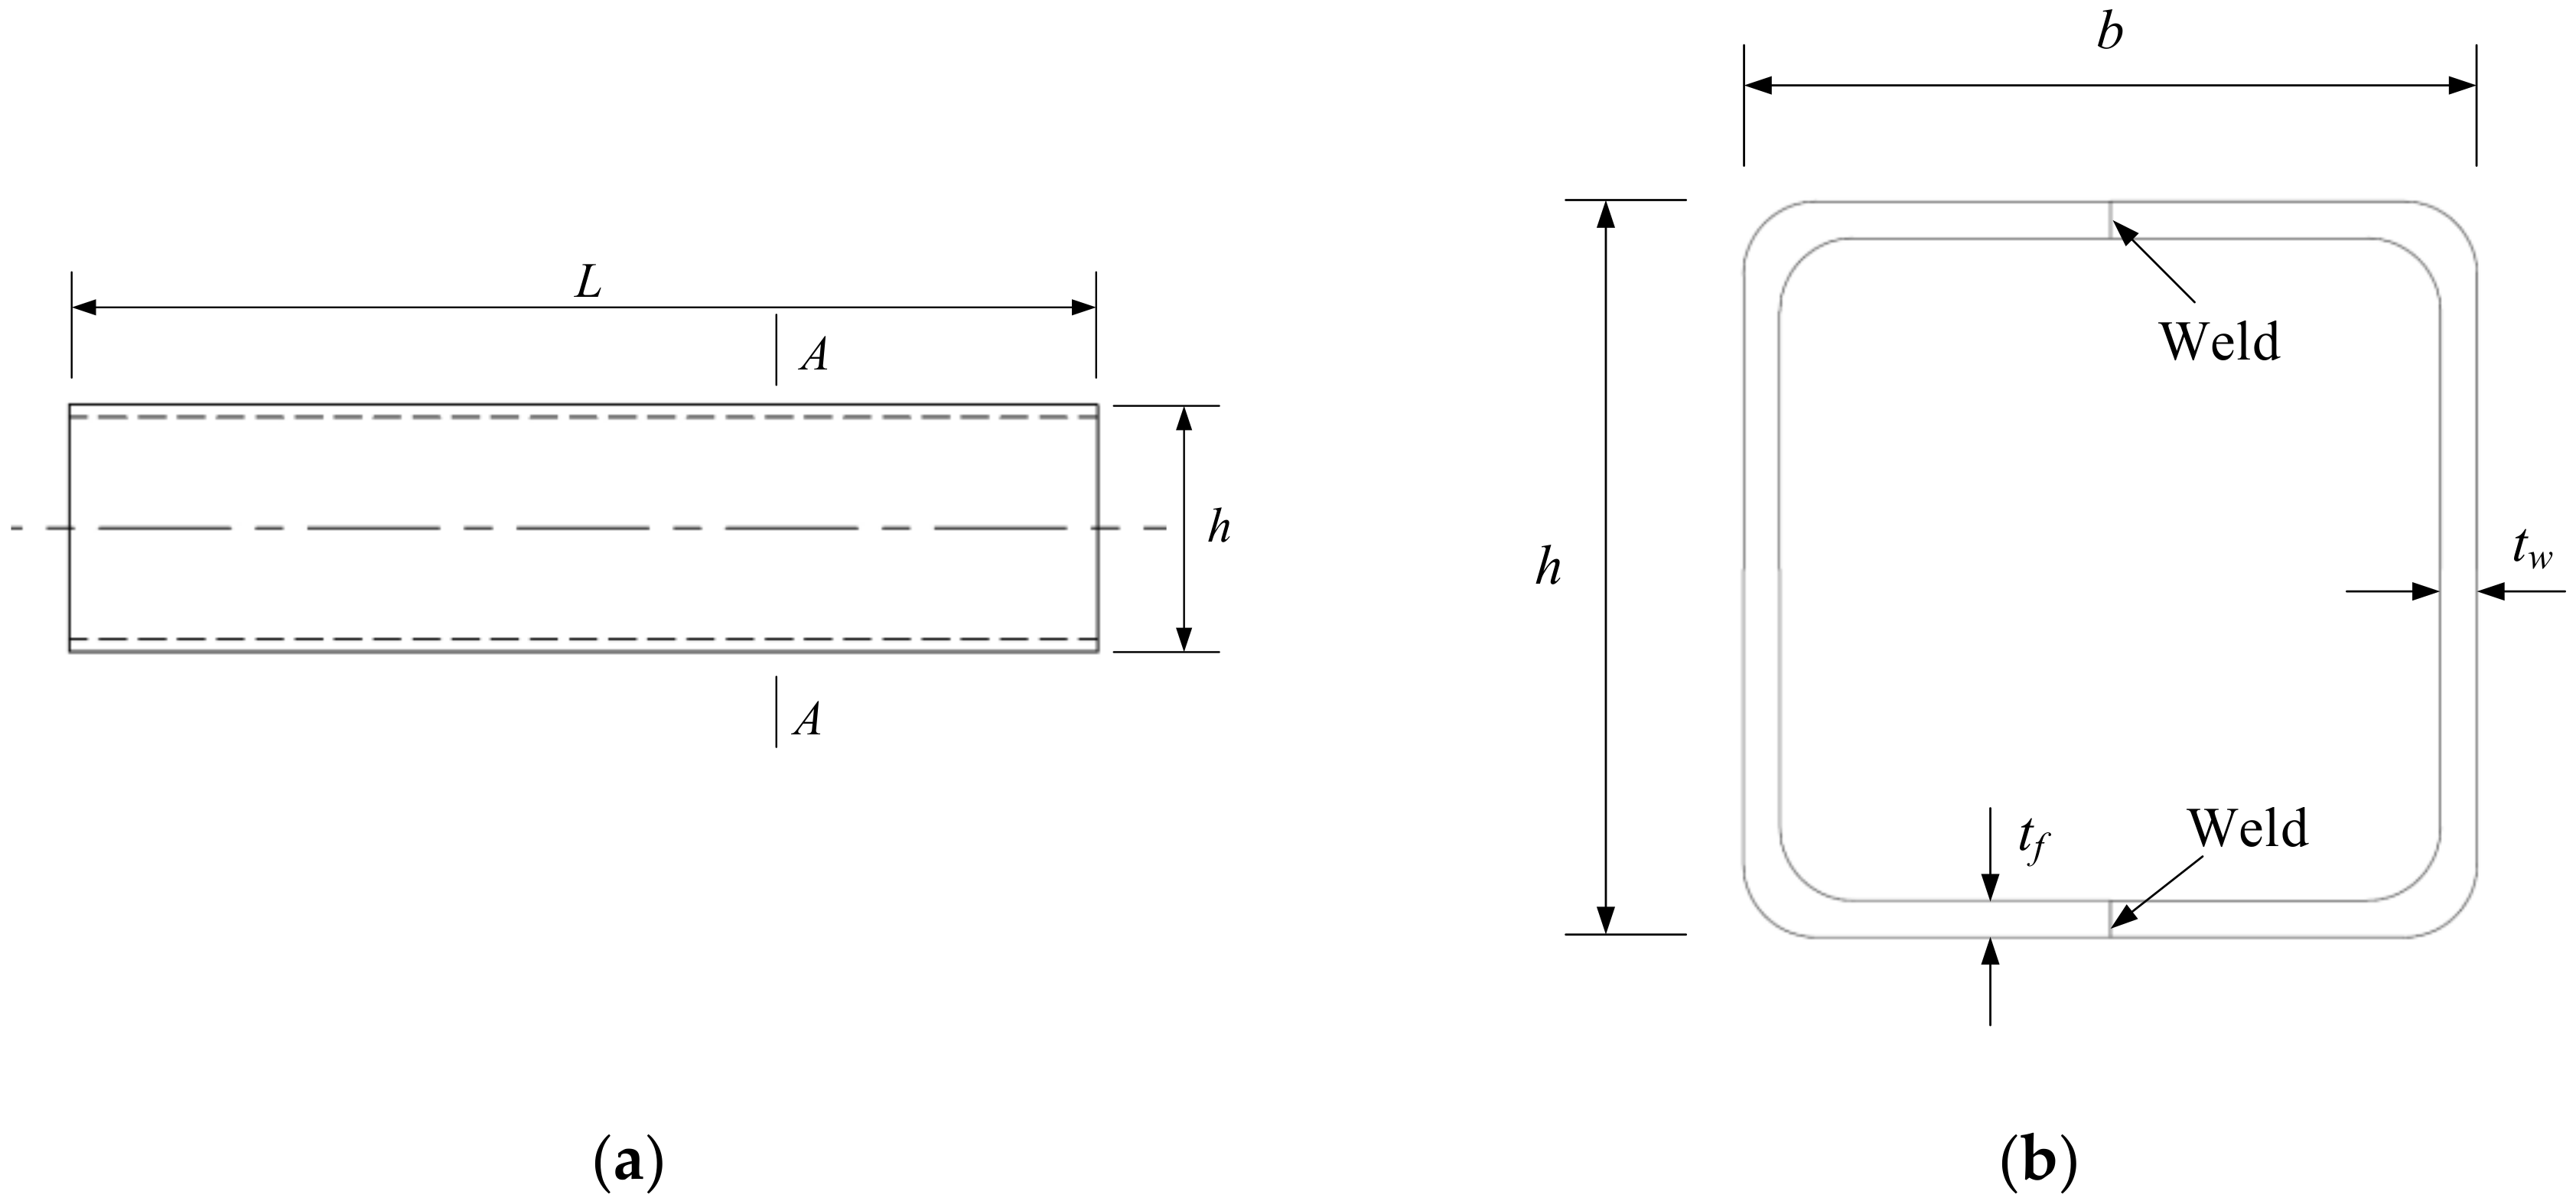
Figure 6.
Drawings of samples. (a) Layout of the samples (b) Section A-A.
Figure 6.
Drawings of samples. (a) Layout of the samples (b) Section A-A.
Figure 7.
Test point location diagram of the welded box section RS1 specimen. (a) Points 1 to 4, (b) Points 5 to 8.
Figure 7.
Test point location diagram of the welded box section RS1 specimen. (a) Points 1 to 4, (b) Points 5 to 8.
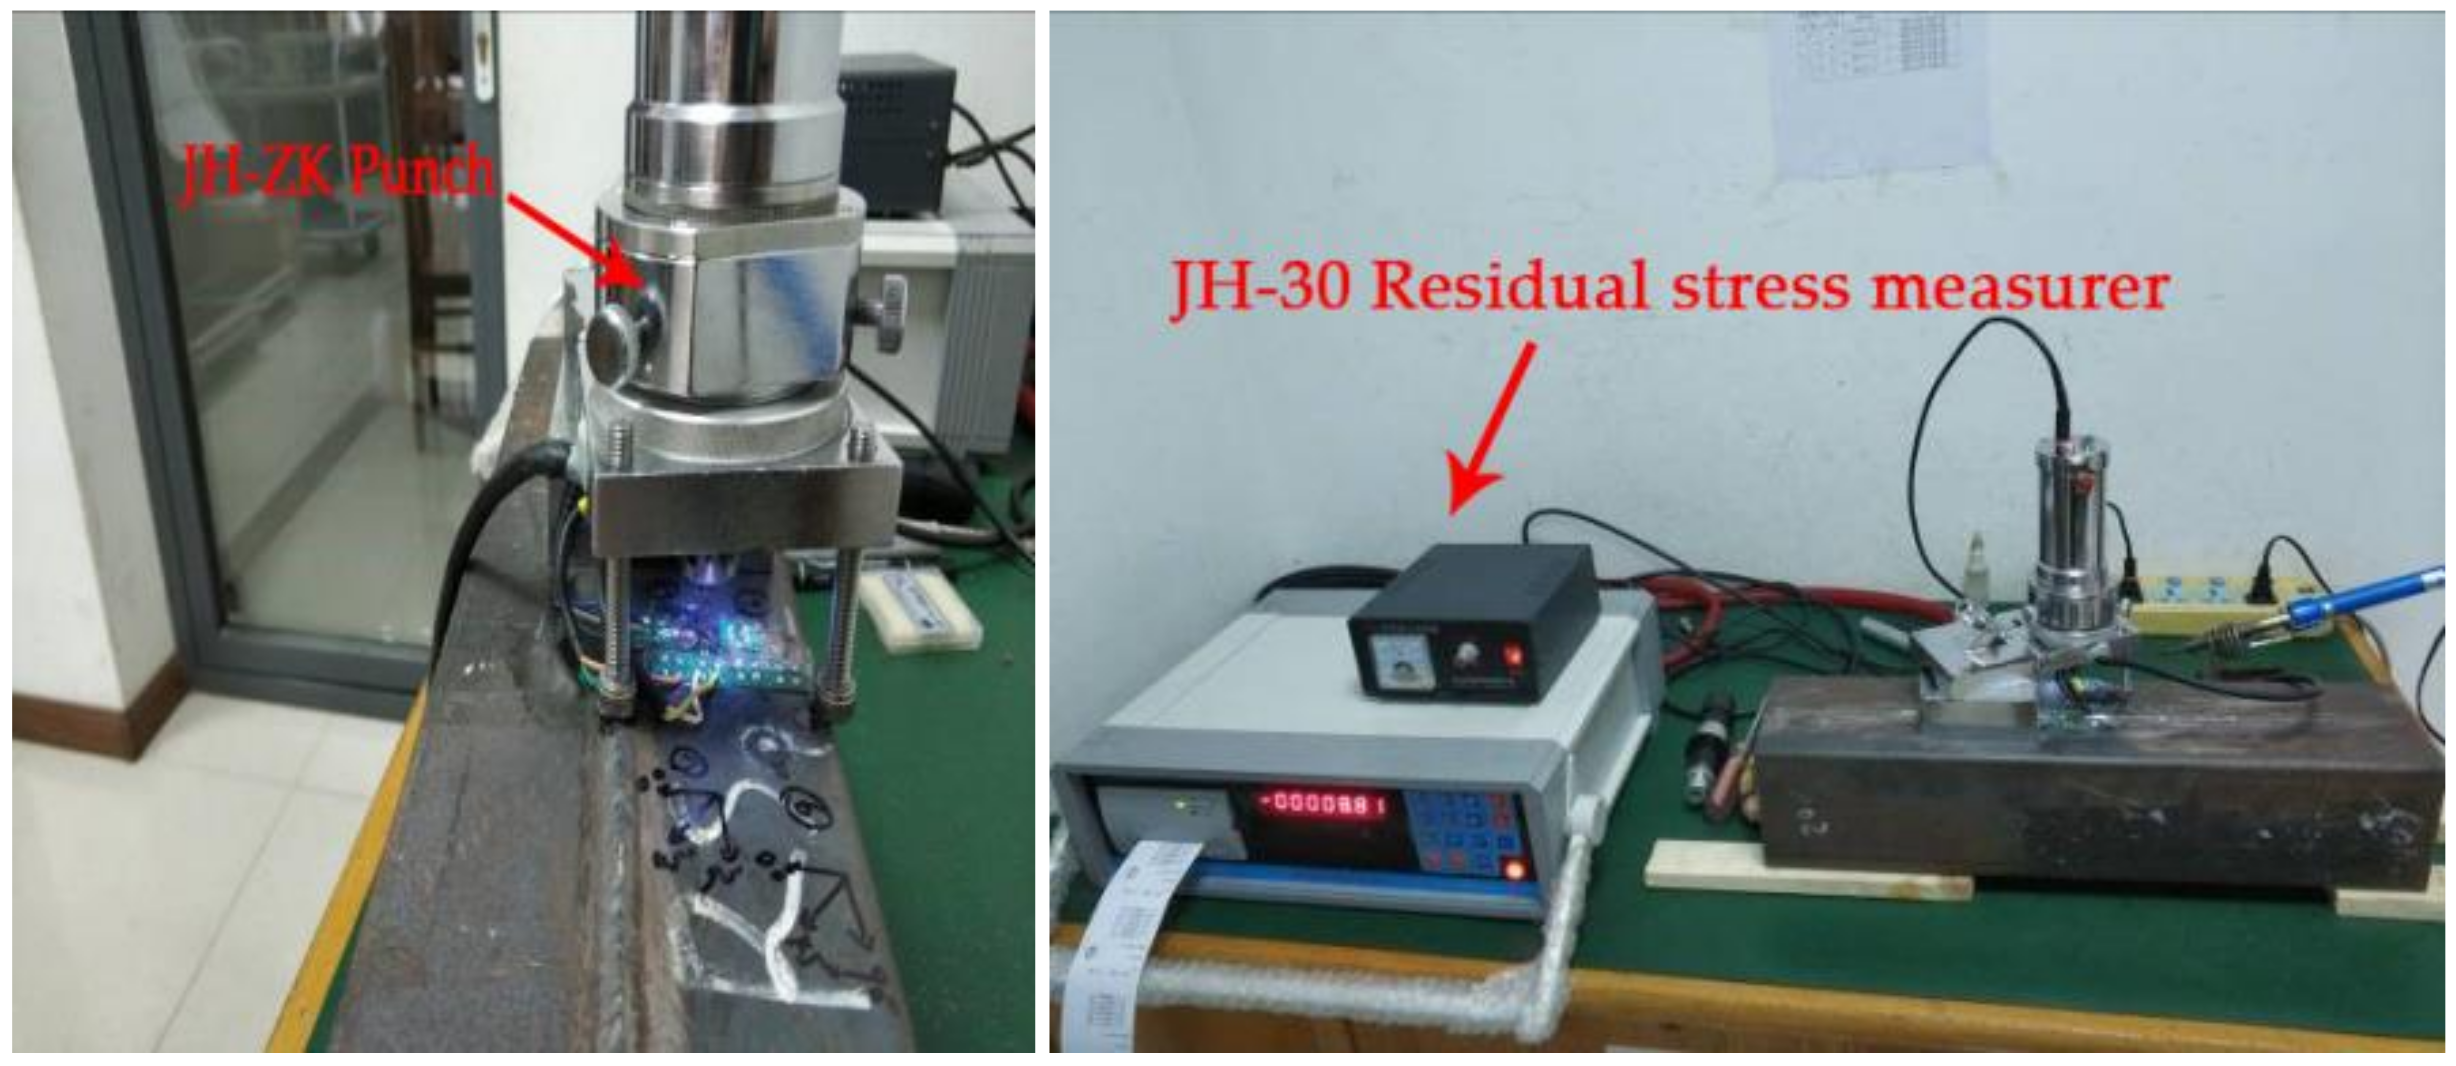
Figure 8.
Residual stress measurement test.
Figure 8.
Residual stress measurement test.
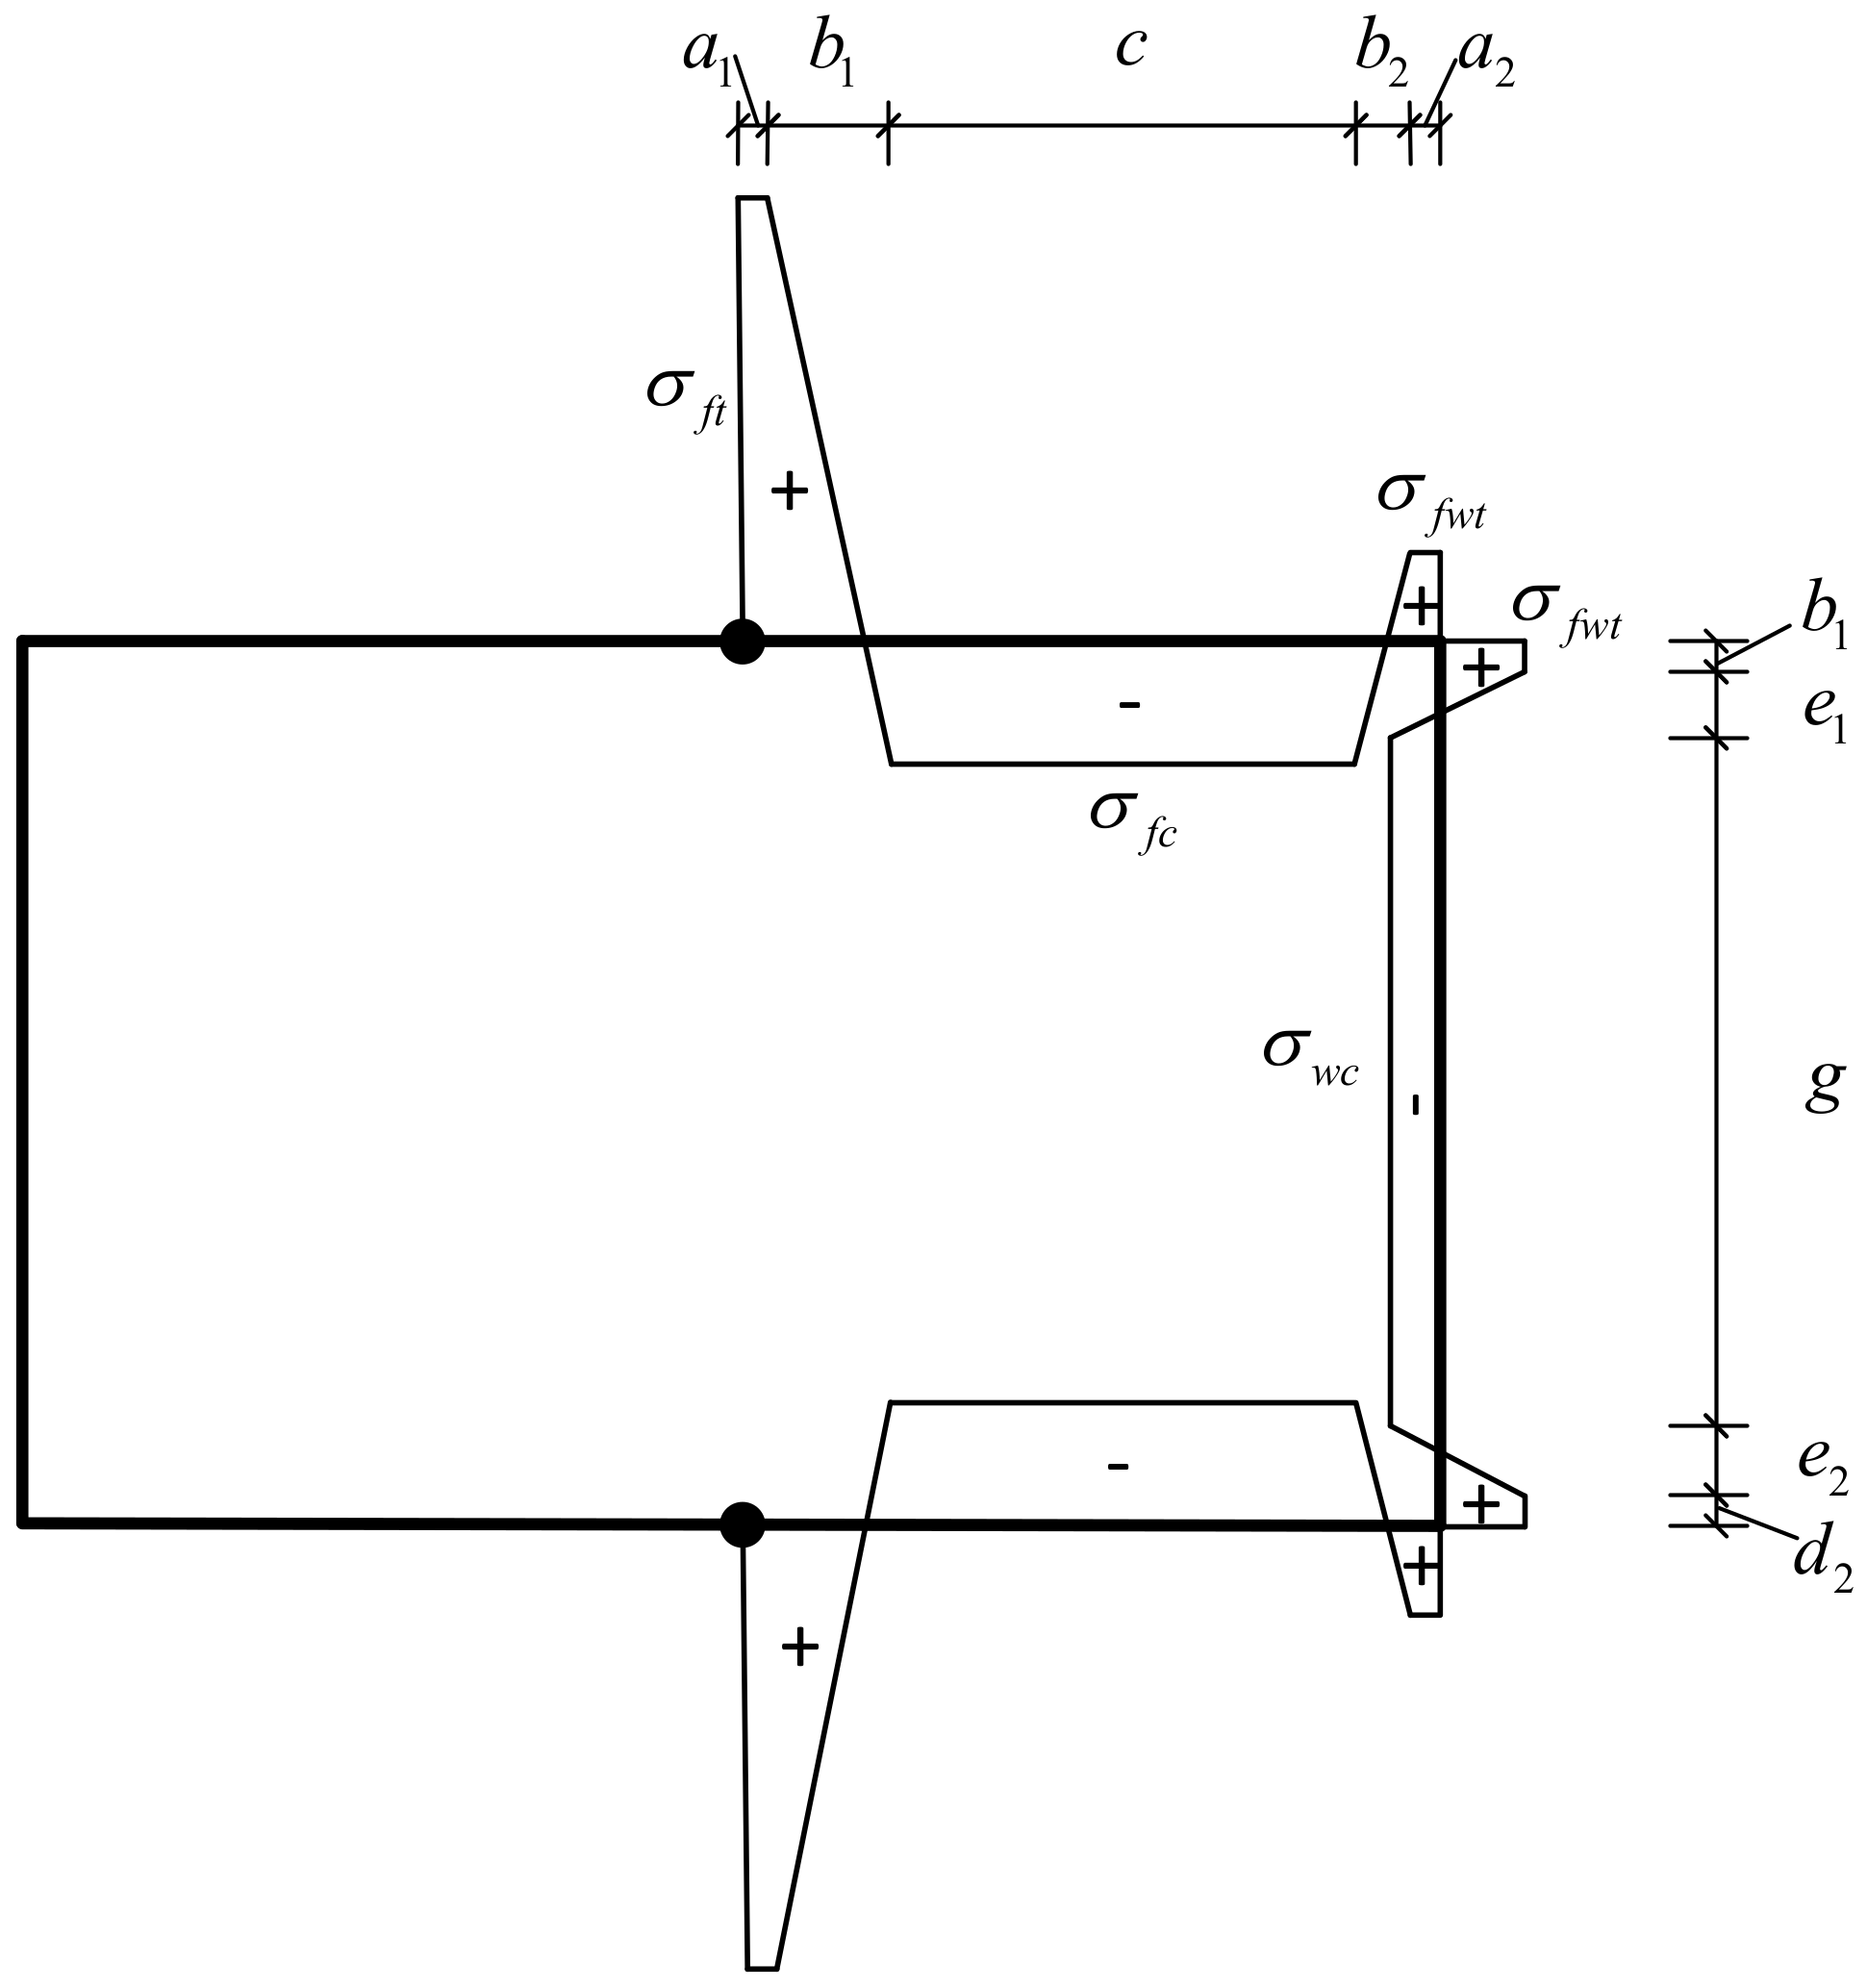
Figure 9.
Residual stress model.
Figure 9.
Residual stress model.
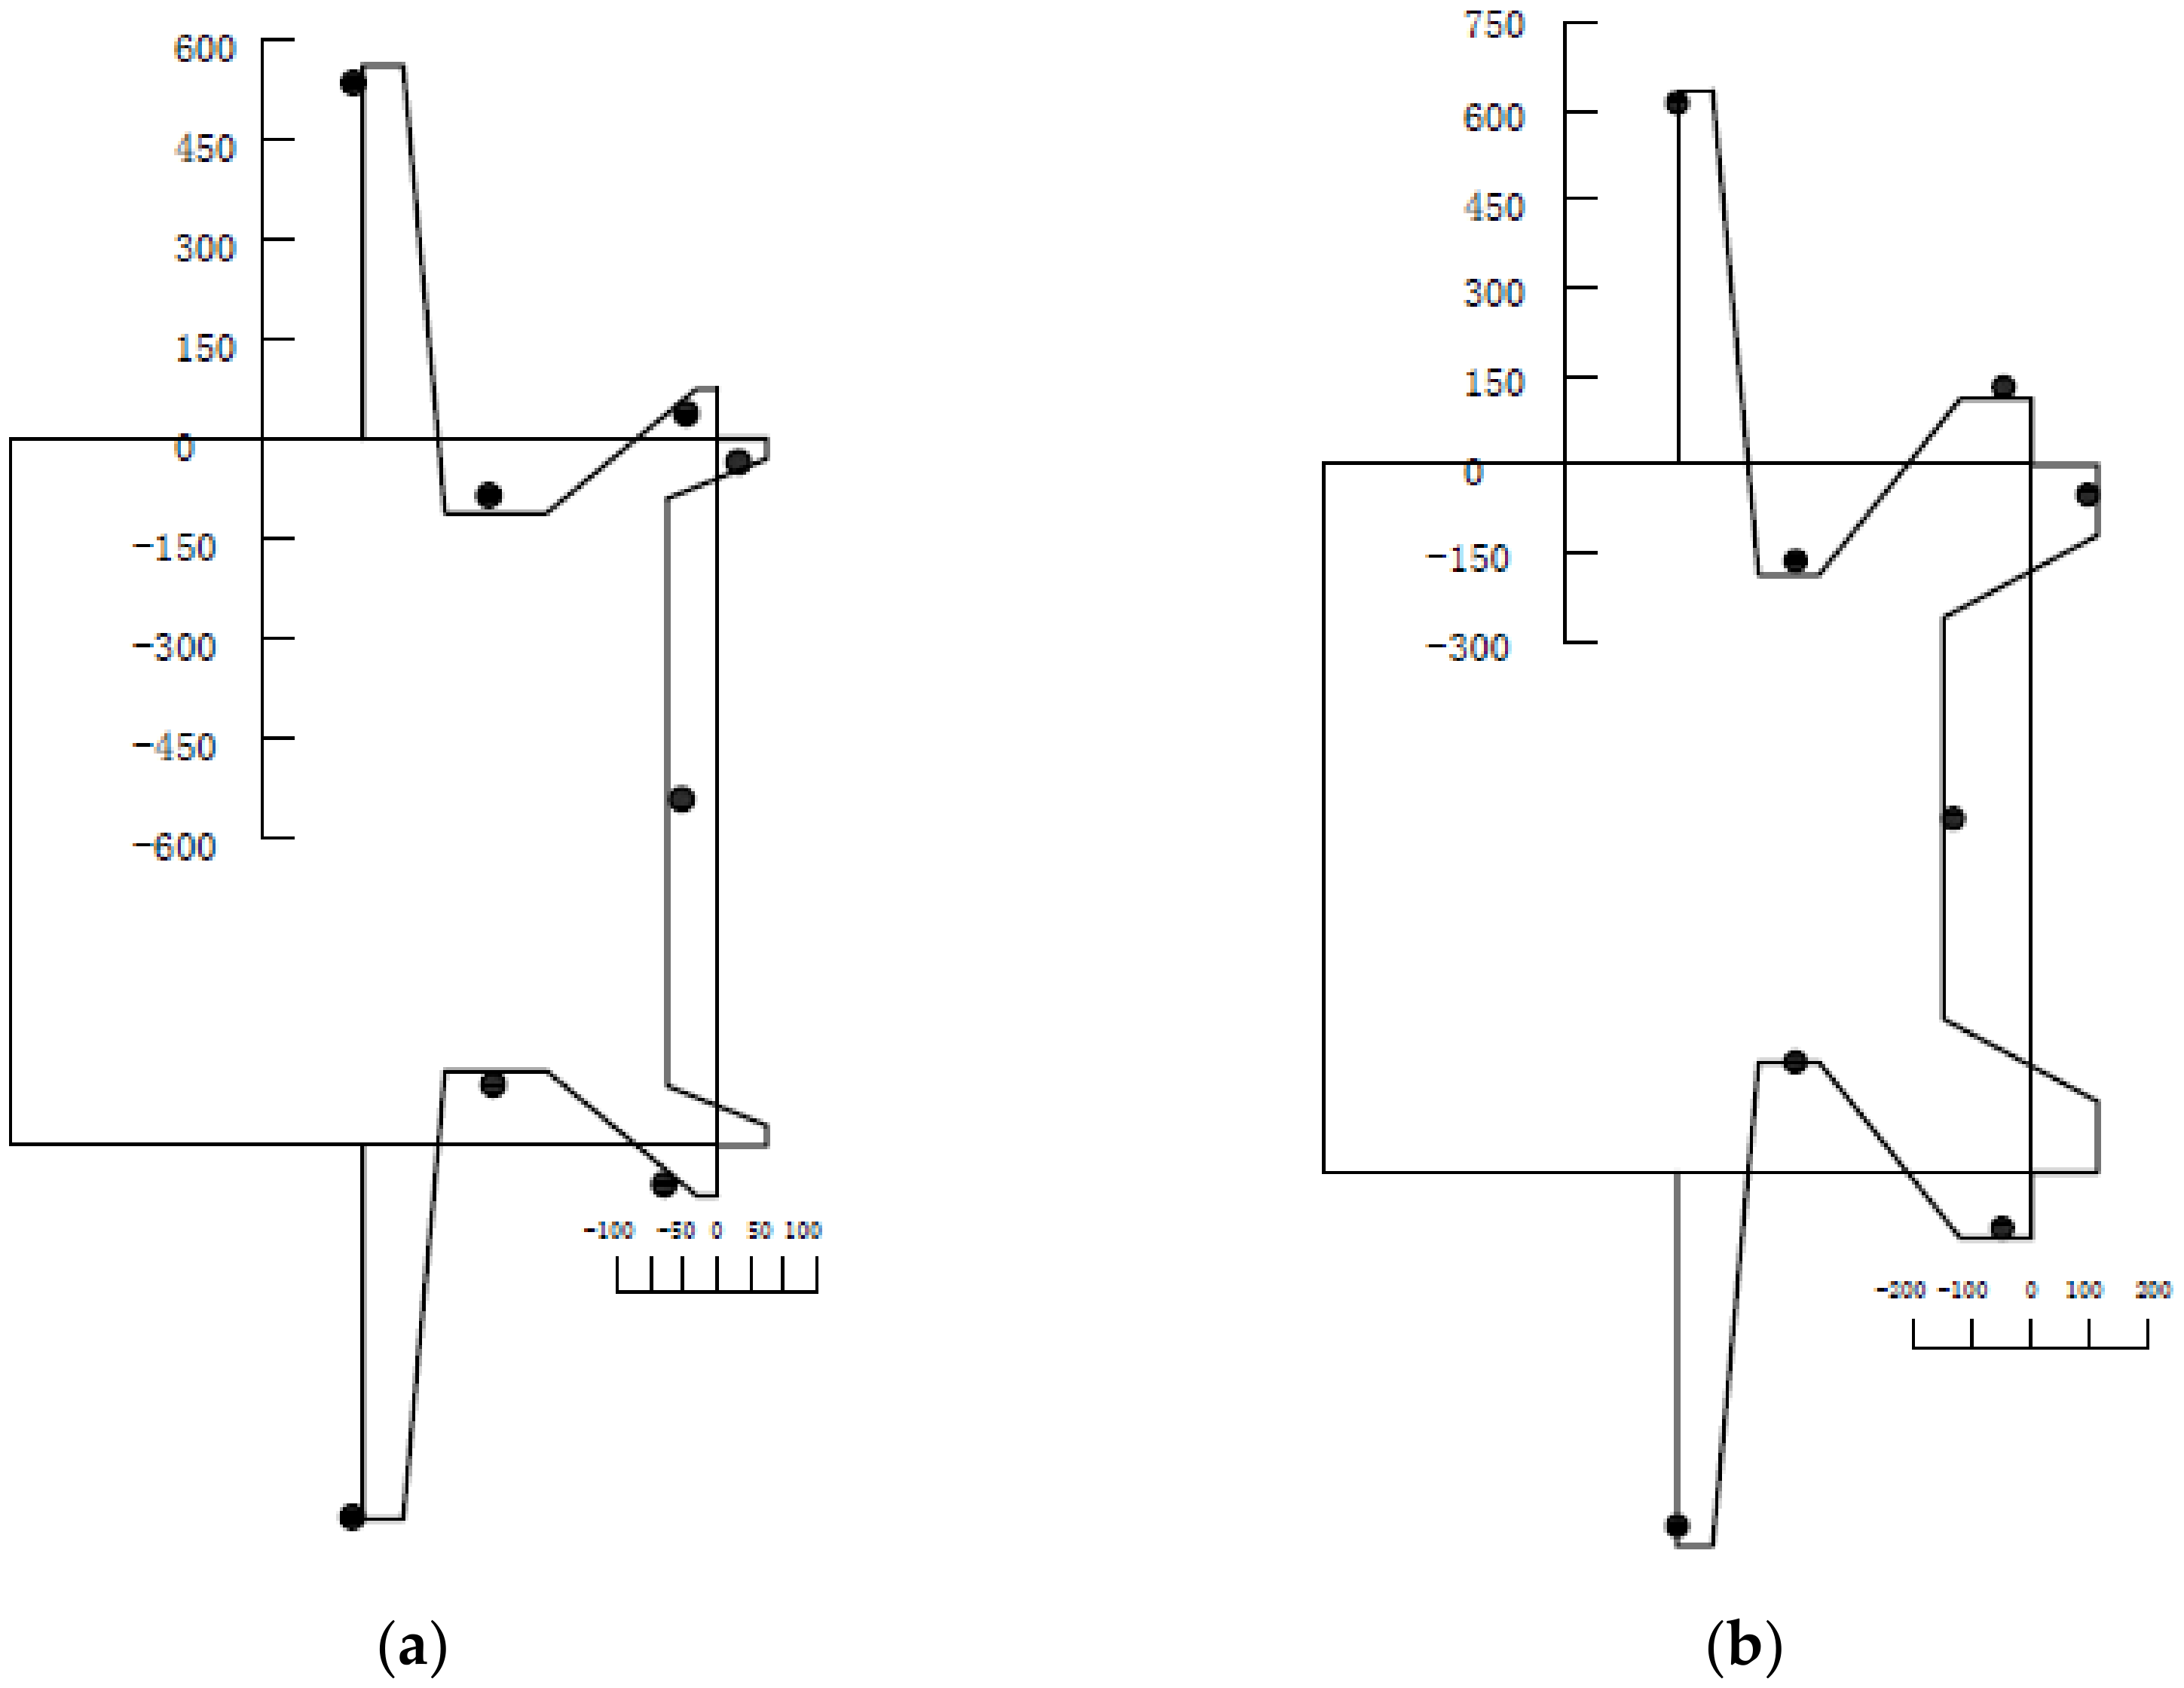
Figure 10.
Residual stress model and measured data (Unit: MPa): (a) RS1, (b) RS4.
Figure 10.
Residual stress model and measured data (Unit: MPa): (a) RS1, (b) RS4.
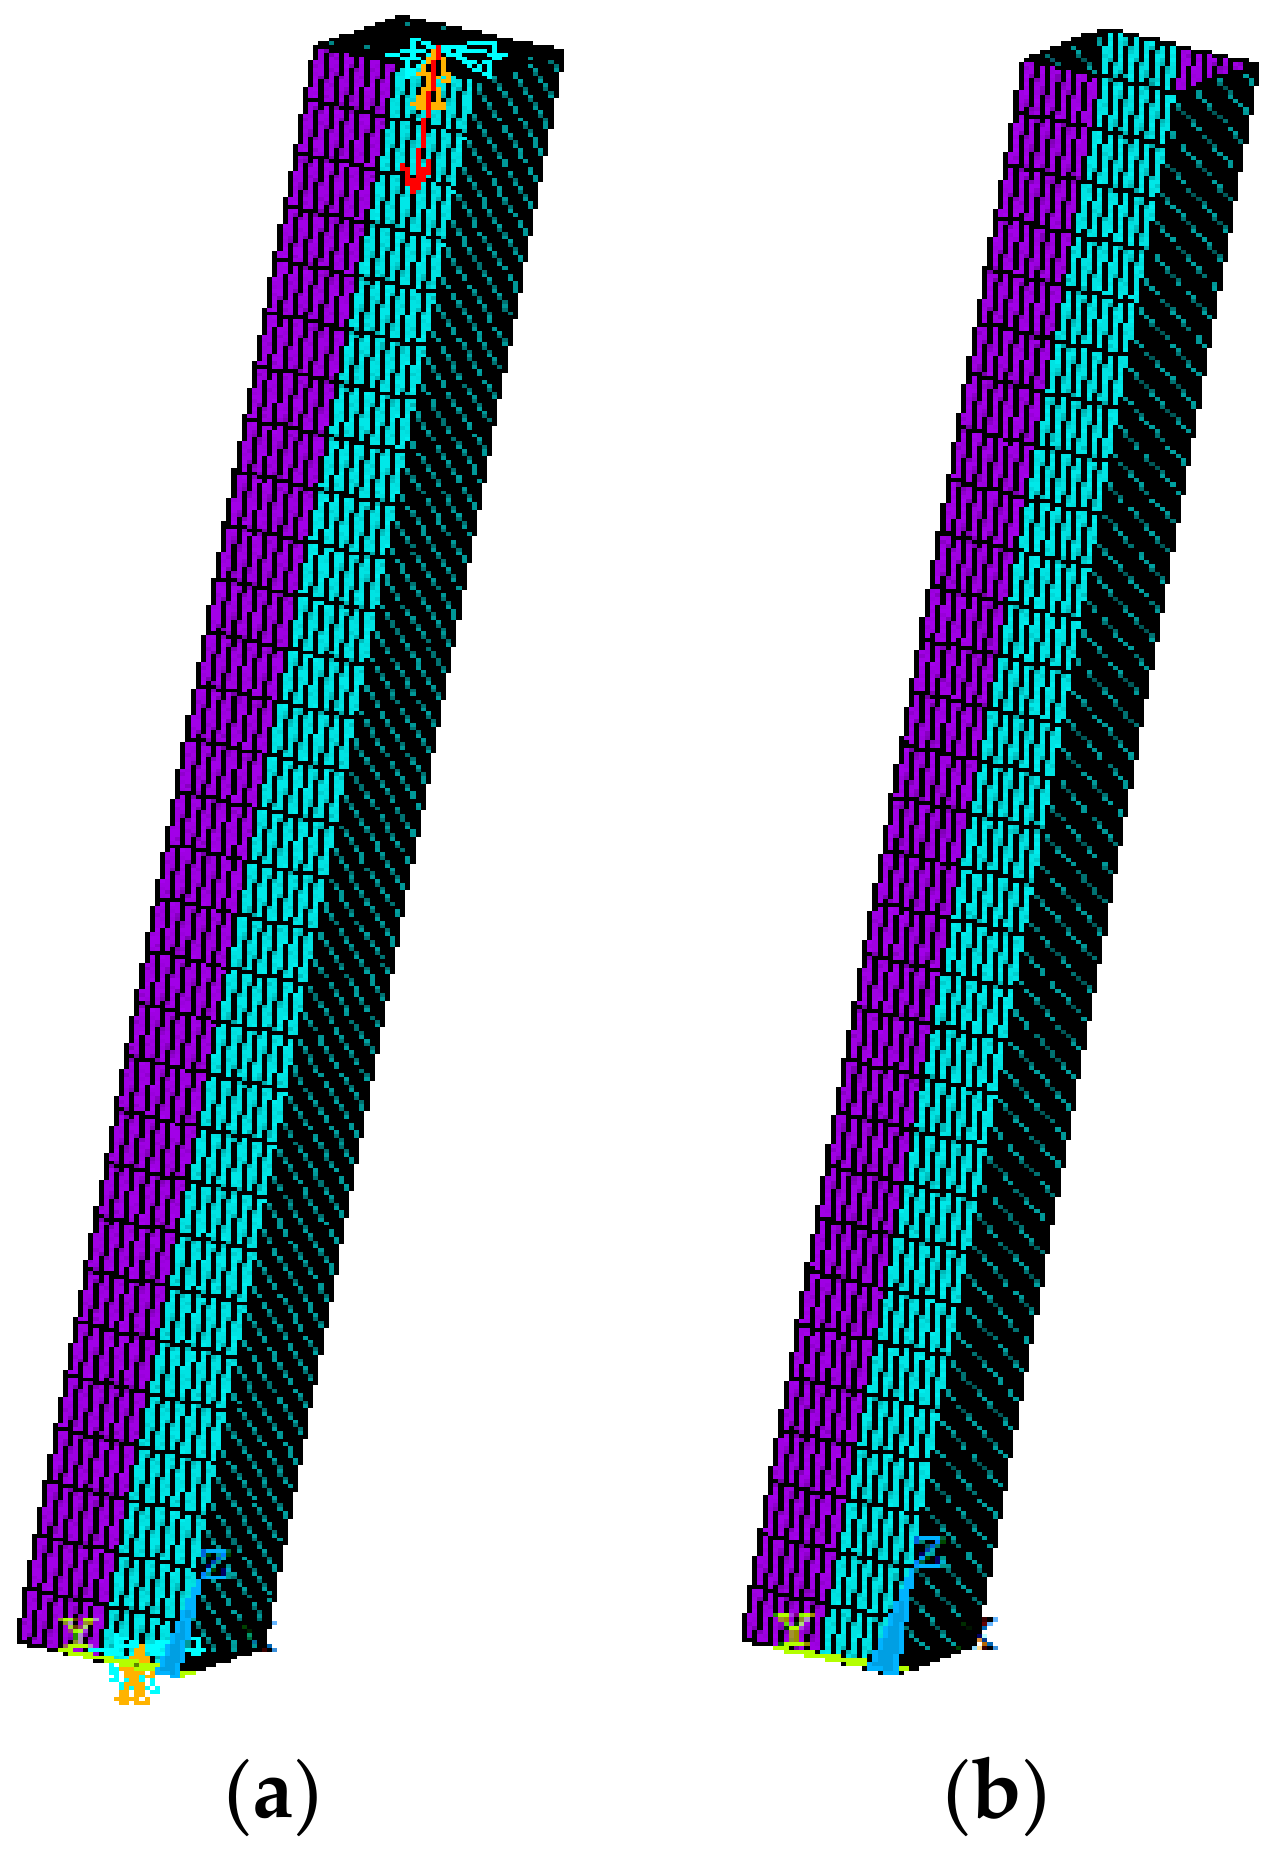
Figure 11.
Basic finite element model. (a)with constraint, (b) without constraint
Figure 11.
Basic finite element model. (a)with constraint, (b) without constraint
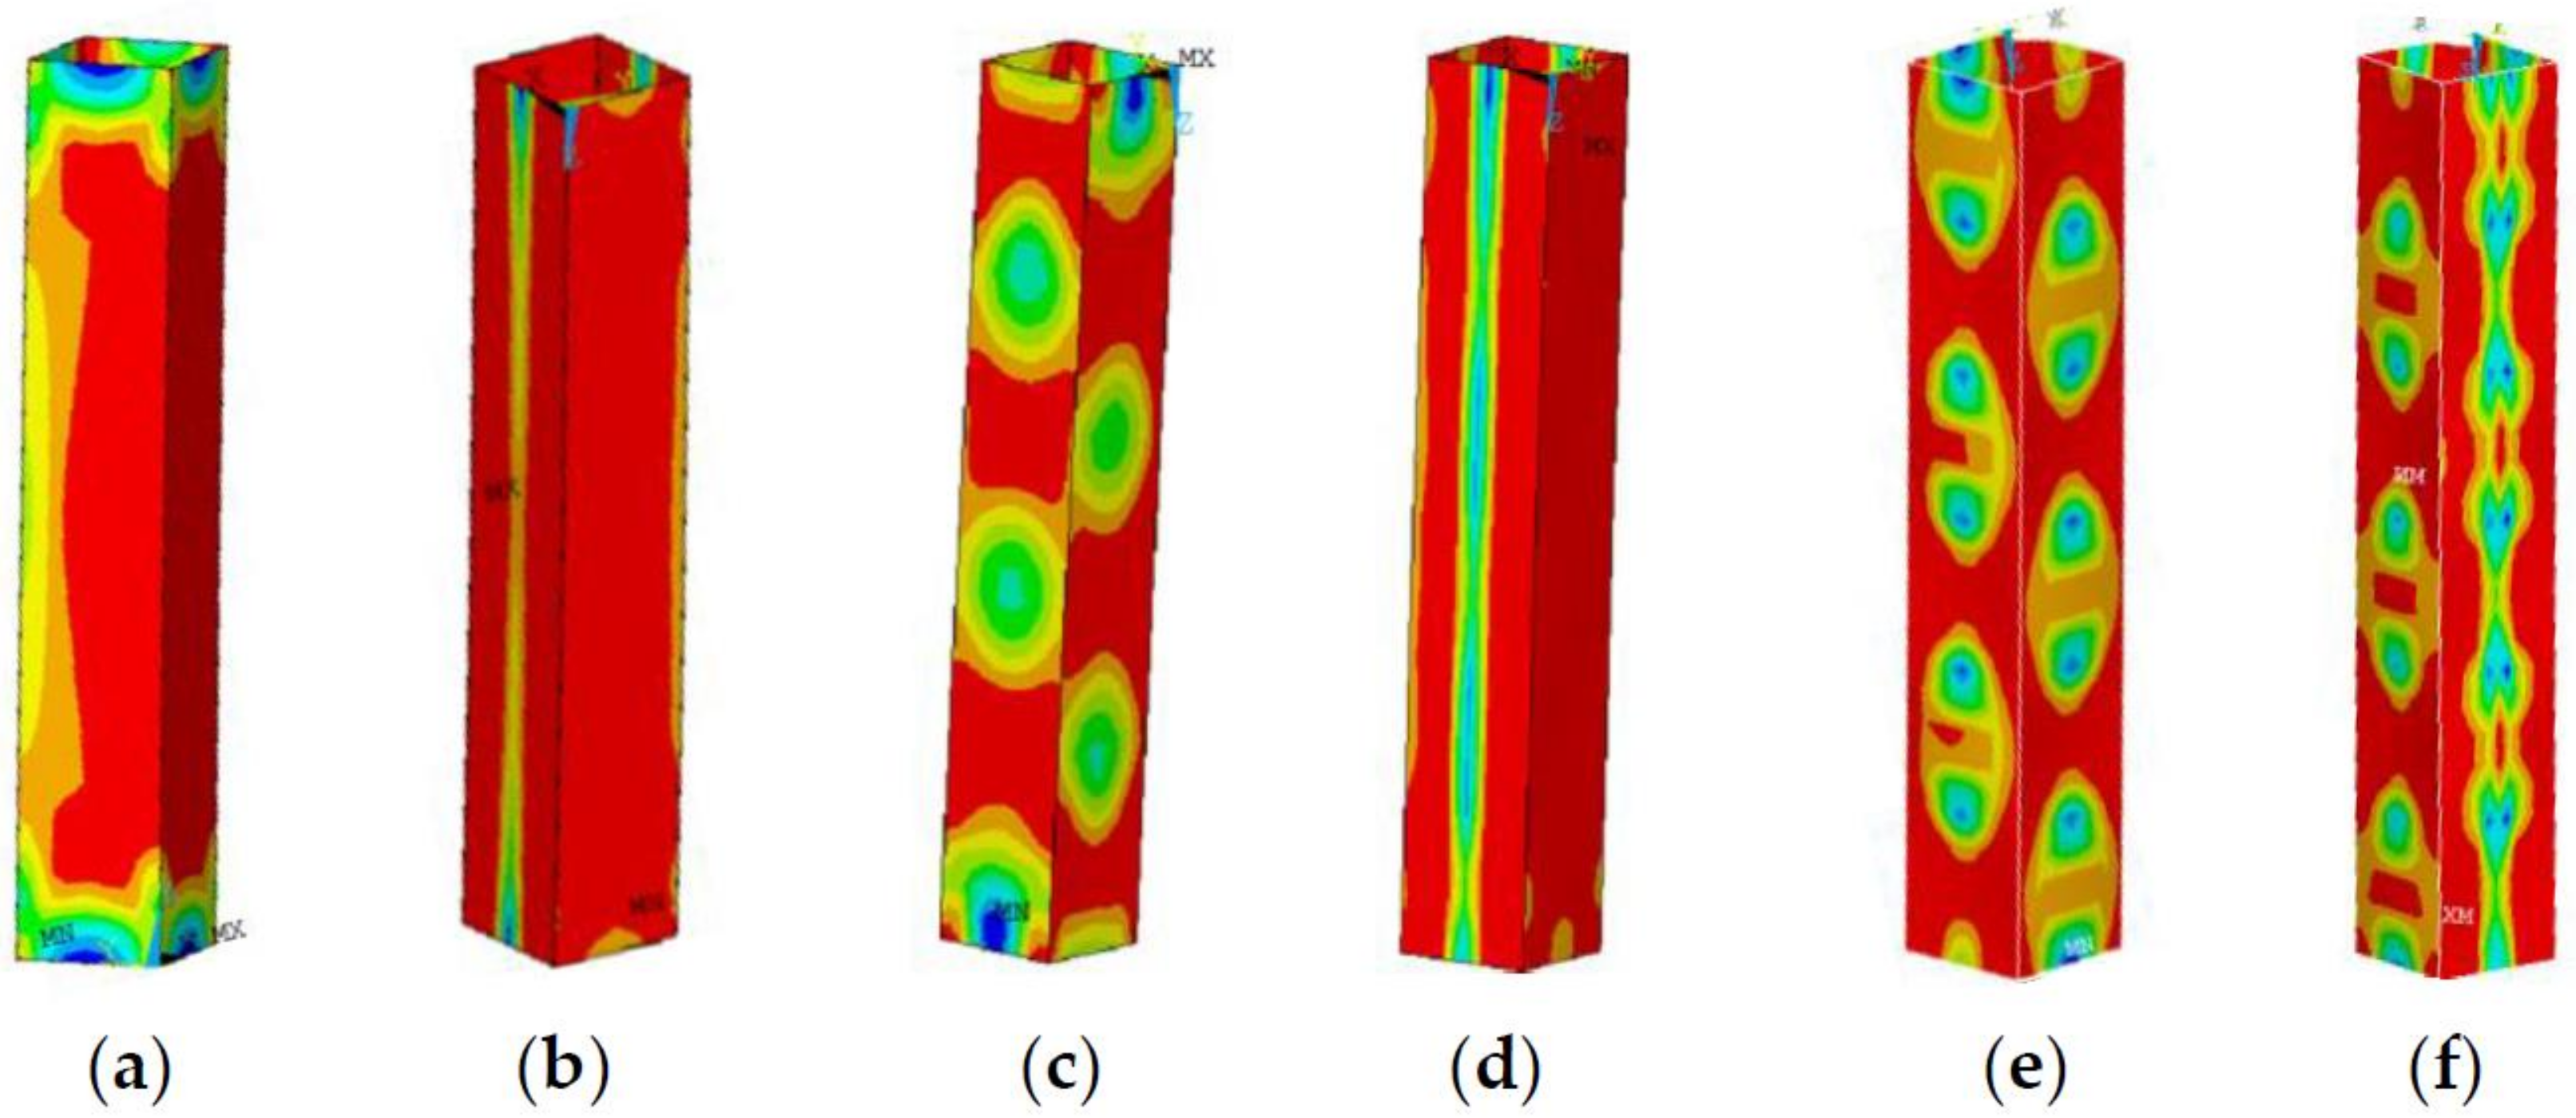
Figure 12.
Local buckling modes of members.
Figure 12.
Local buckling modes of members.
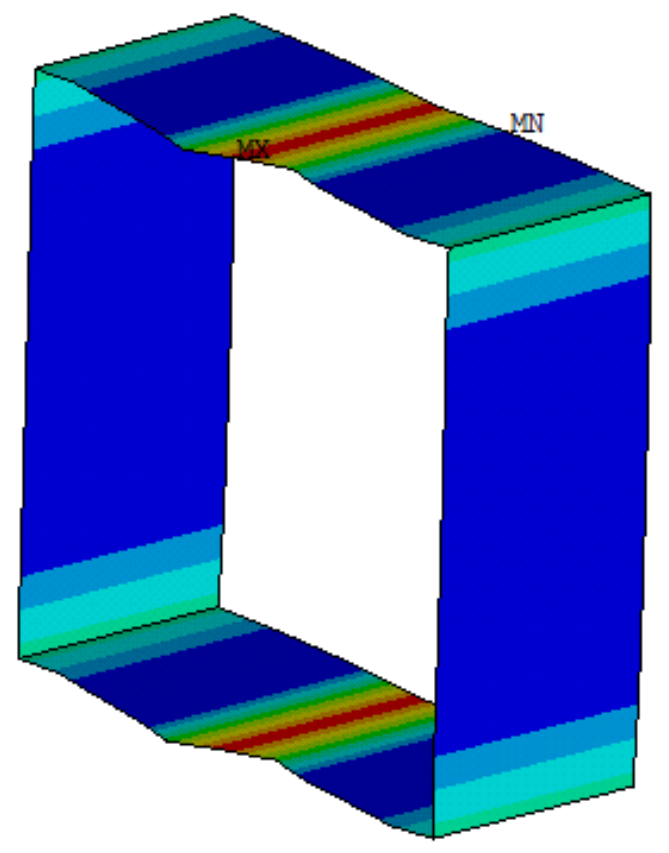
Figure 13.
Stress cloud diagram of a section after applying residual stress.
Figure 13.
Stress cloud diagram of a section after applying residual stress.
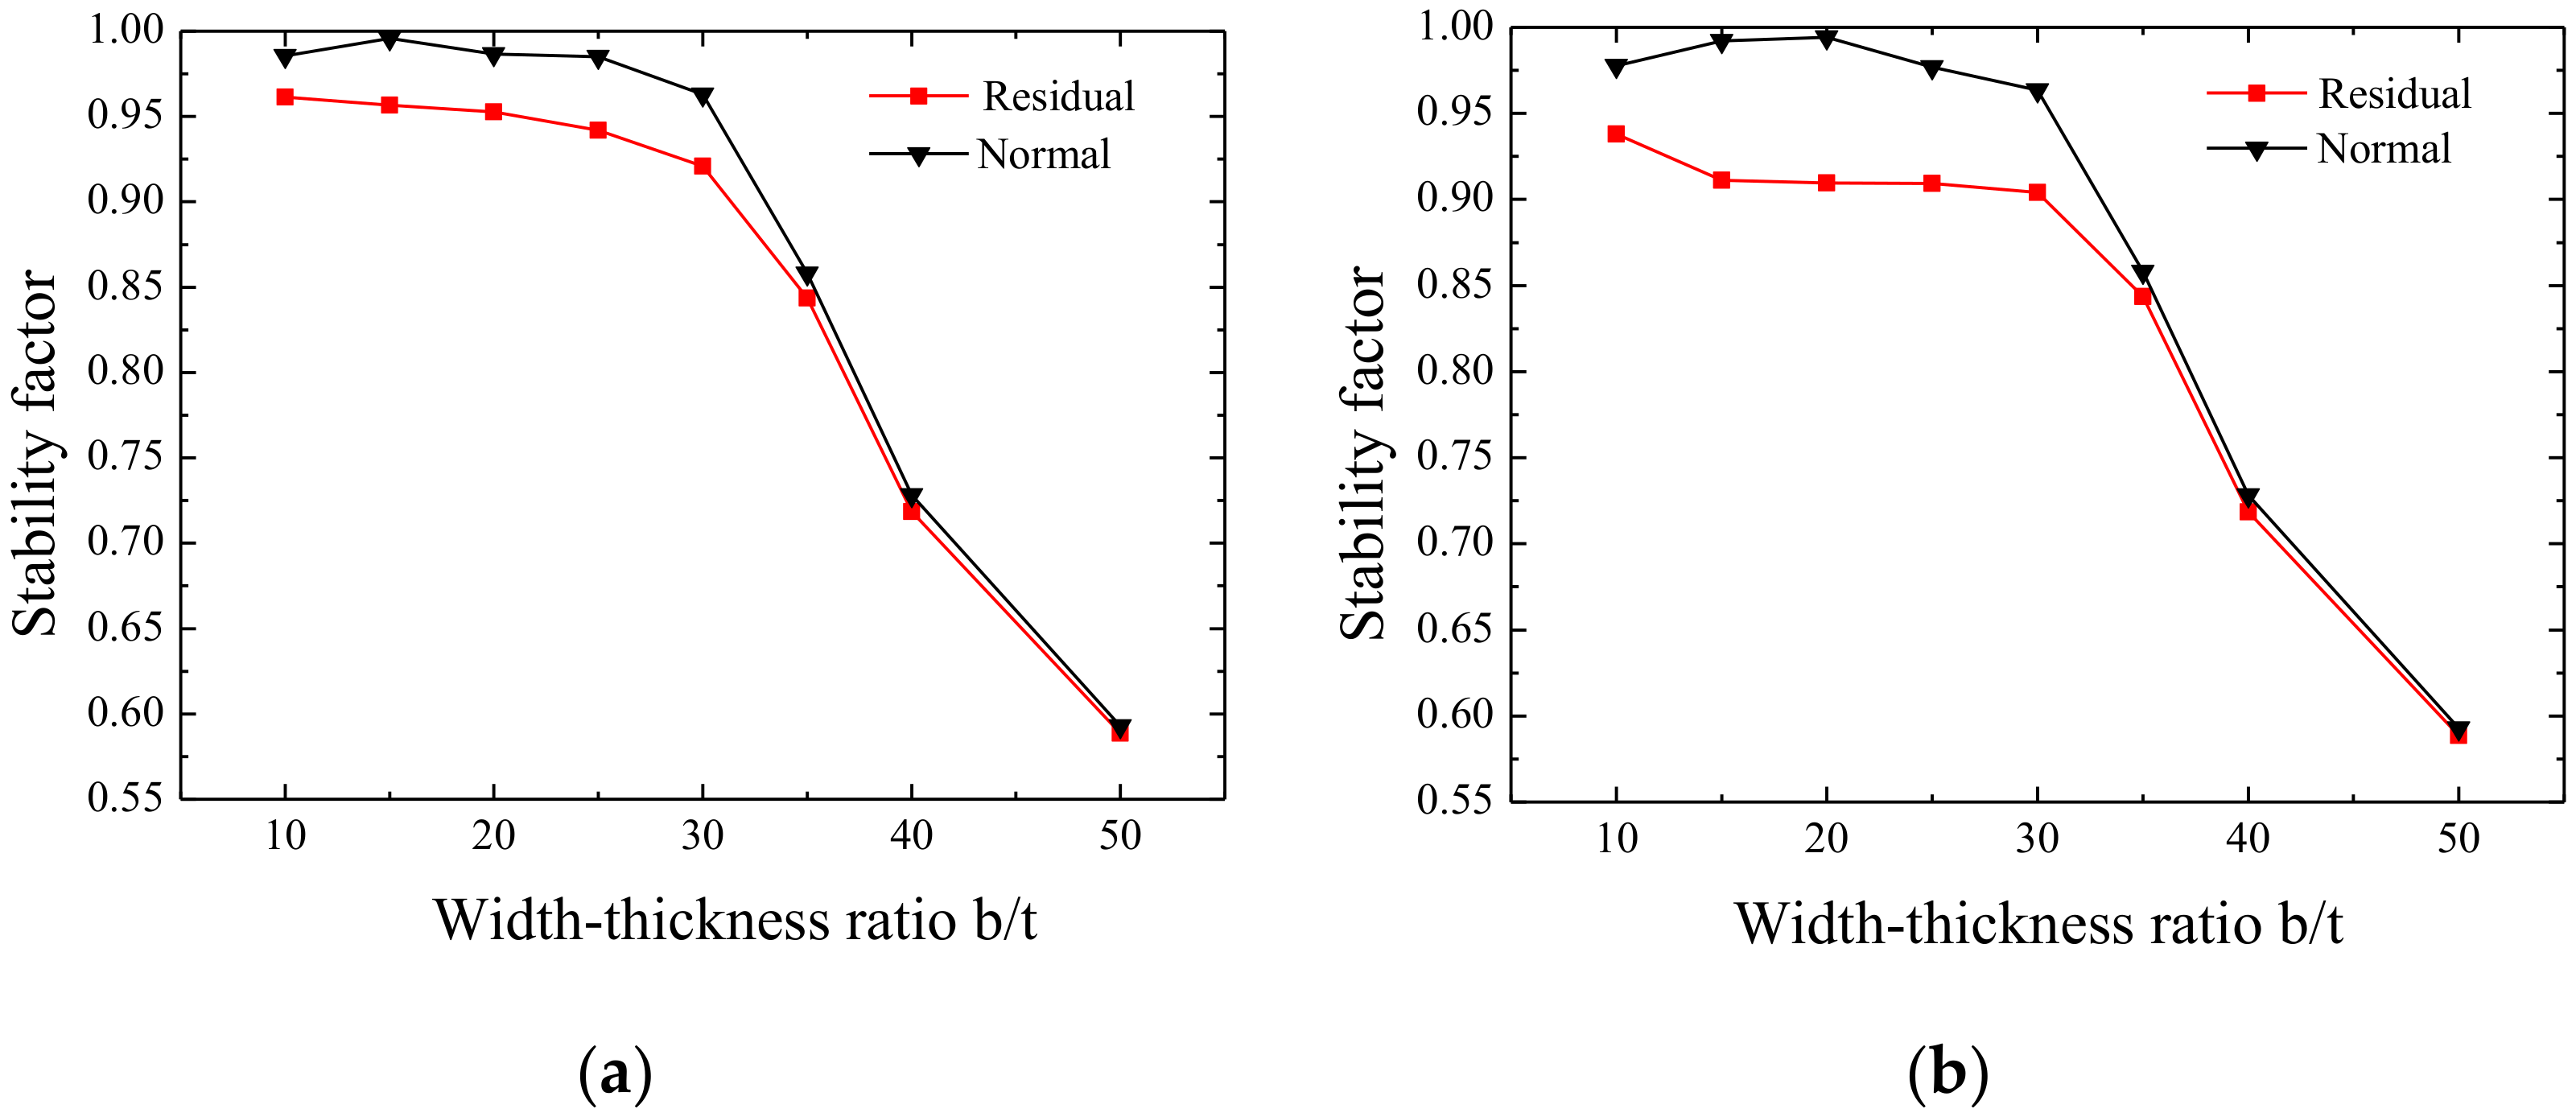
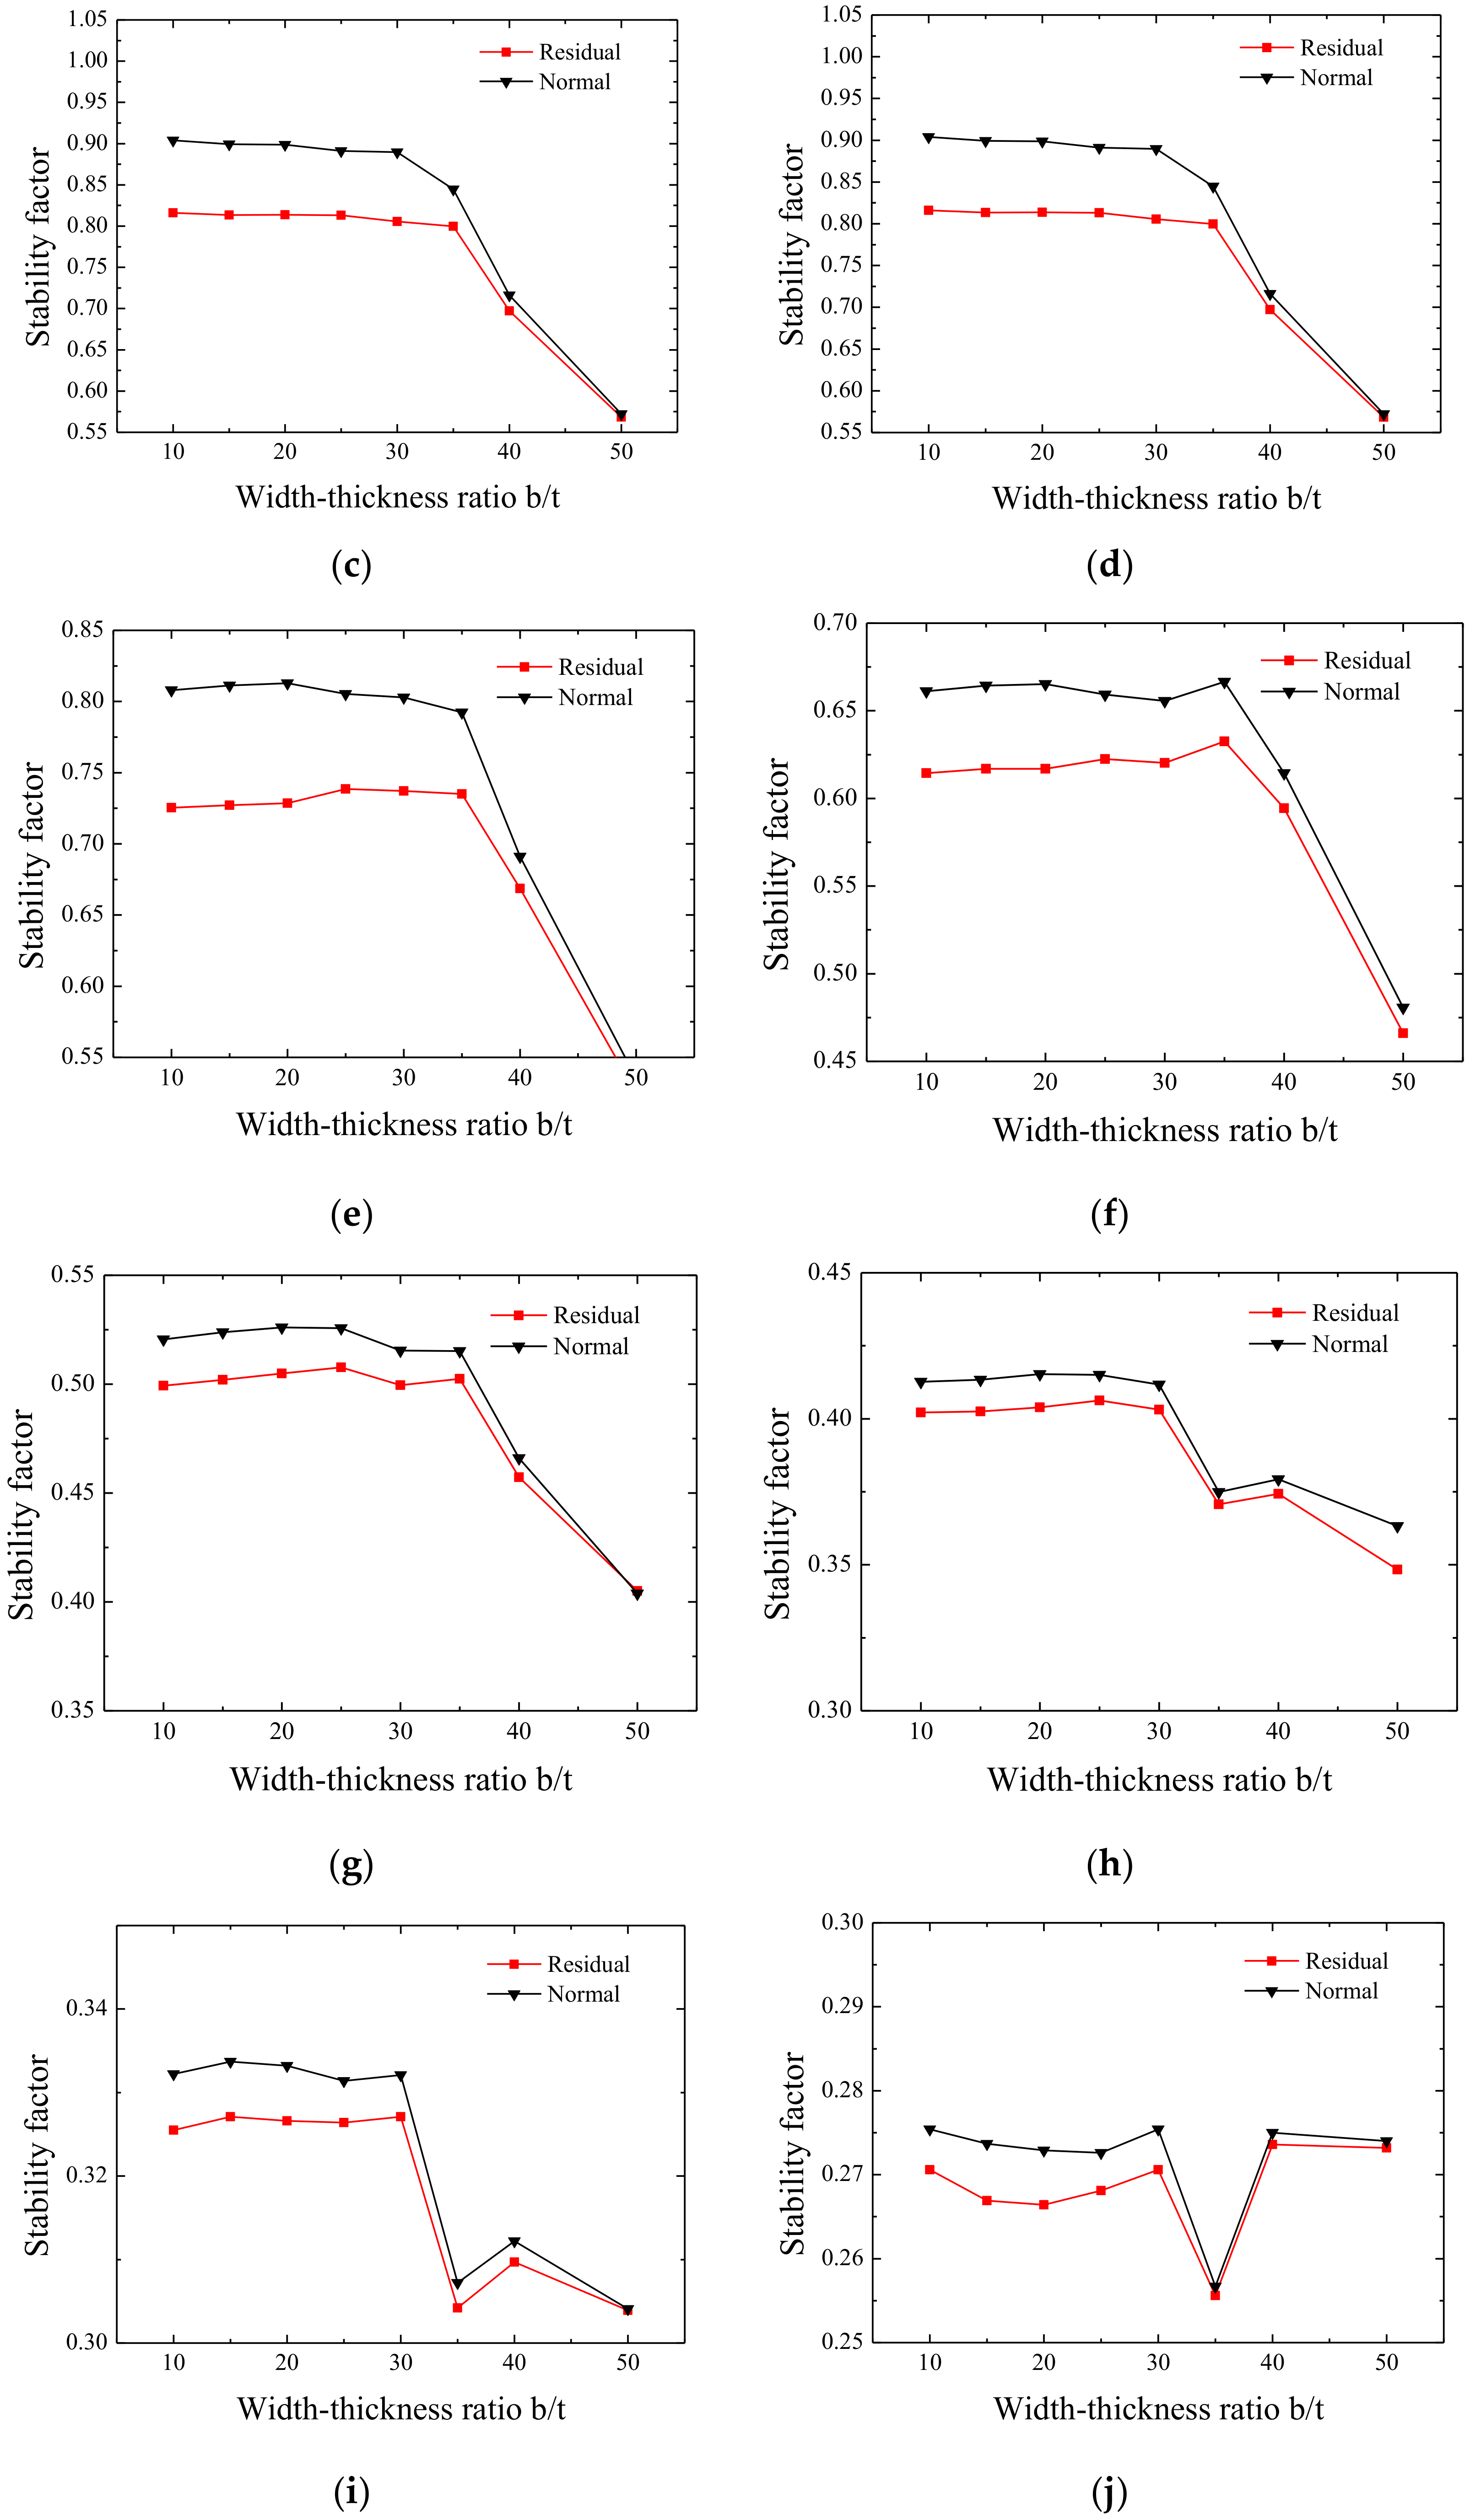
Figure 14.
Influence of different width‒thickness ratios on residual stress: (a) λ = 15, (b) λ = 20, (c) λ = 30, (d) λ = 40, (e) λ = 50, (f) λ = 60, (g) λ = 70, (h) λ = 80, (i) λ = 90, and (j) λ = 100.
Figure 14.
Influence of different width‒thickness ratios on residual stress: (a) λ = 15, (b) λ = 20, (c) λ = 30, (d) λ = 40, (e) λ = 50, (f) λ = 60, (g) λ = 70, (h) λ = 80, (i) λ = 90, and (j) λ = 100.
Figure 15.
The buckling equivalent stress cloud diagram when λ = 15. (a) b/t = 10, (c), b/t = 30, and (e) b/t = 50 without residual stress; (b) b/t = 10, (d) b/t = 30, and (f) b/t = 50 with residual stress.
Figure 15.
The buckling equivalent stress cloud diagram when λ = 15. (a) b/t = 10, (c), b/t = 30, and (e) b/t = 50 without residual stress; (b) b/t = 10, (d) b/t = 30, and (f) b/t = 50 with residual stress.
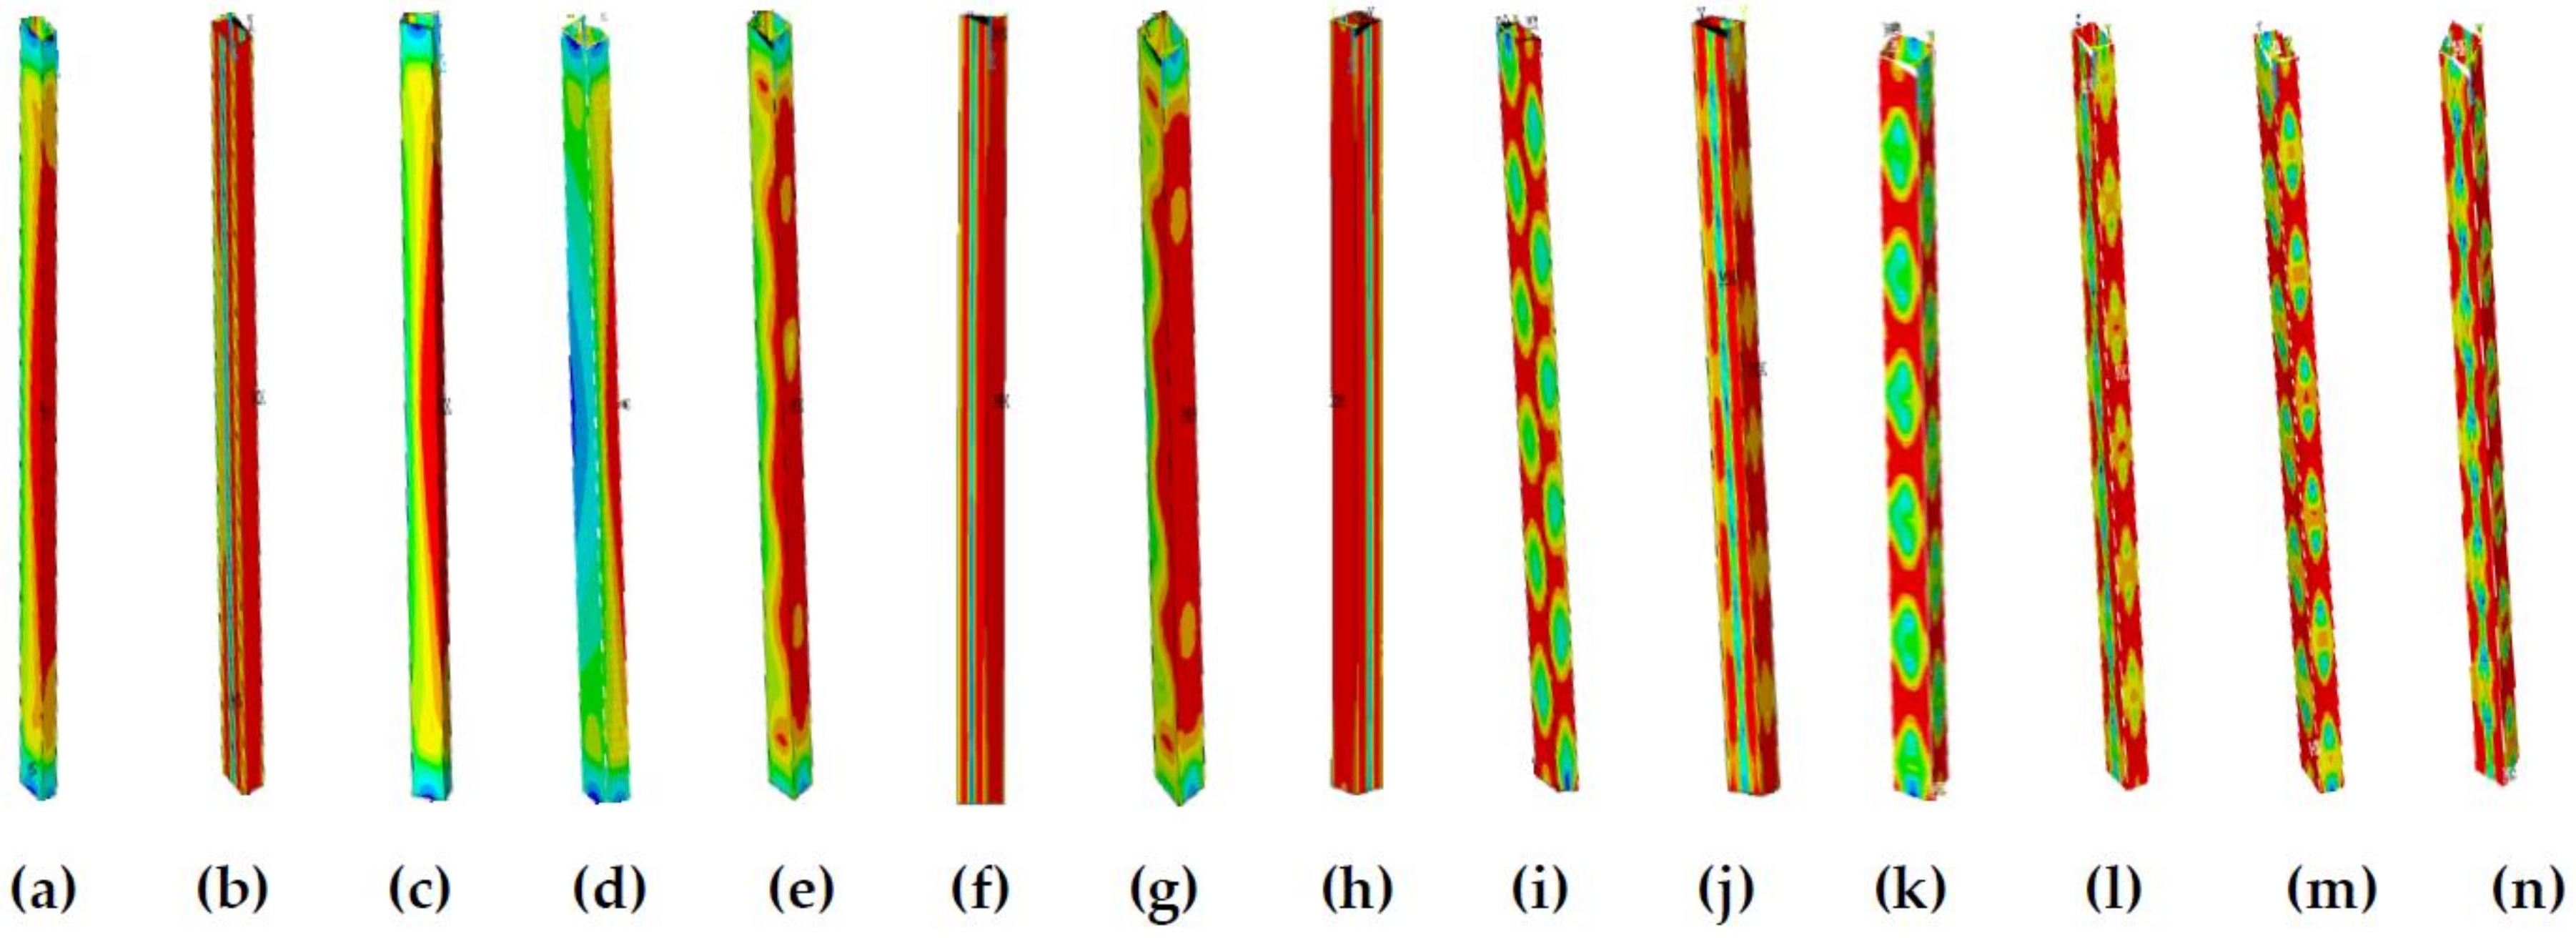
Figure 16.
The buckling equivalent stress cloud diagram when λ = 30. (a) b/t = 10, (c), b/t = 15, (e) b/t = 20, (g) b/t = 25, (i) b/t = 35, (k) b/t = 40, and (m) b/t = 50 without residual stress; (b) b/t = 10, (d) b/t = 15, (f) b/t = 20, (h) b/t = 25, (j) b/t = 35, (l) b/t = 40, and (n) b/t = 50 with residual stress.
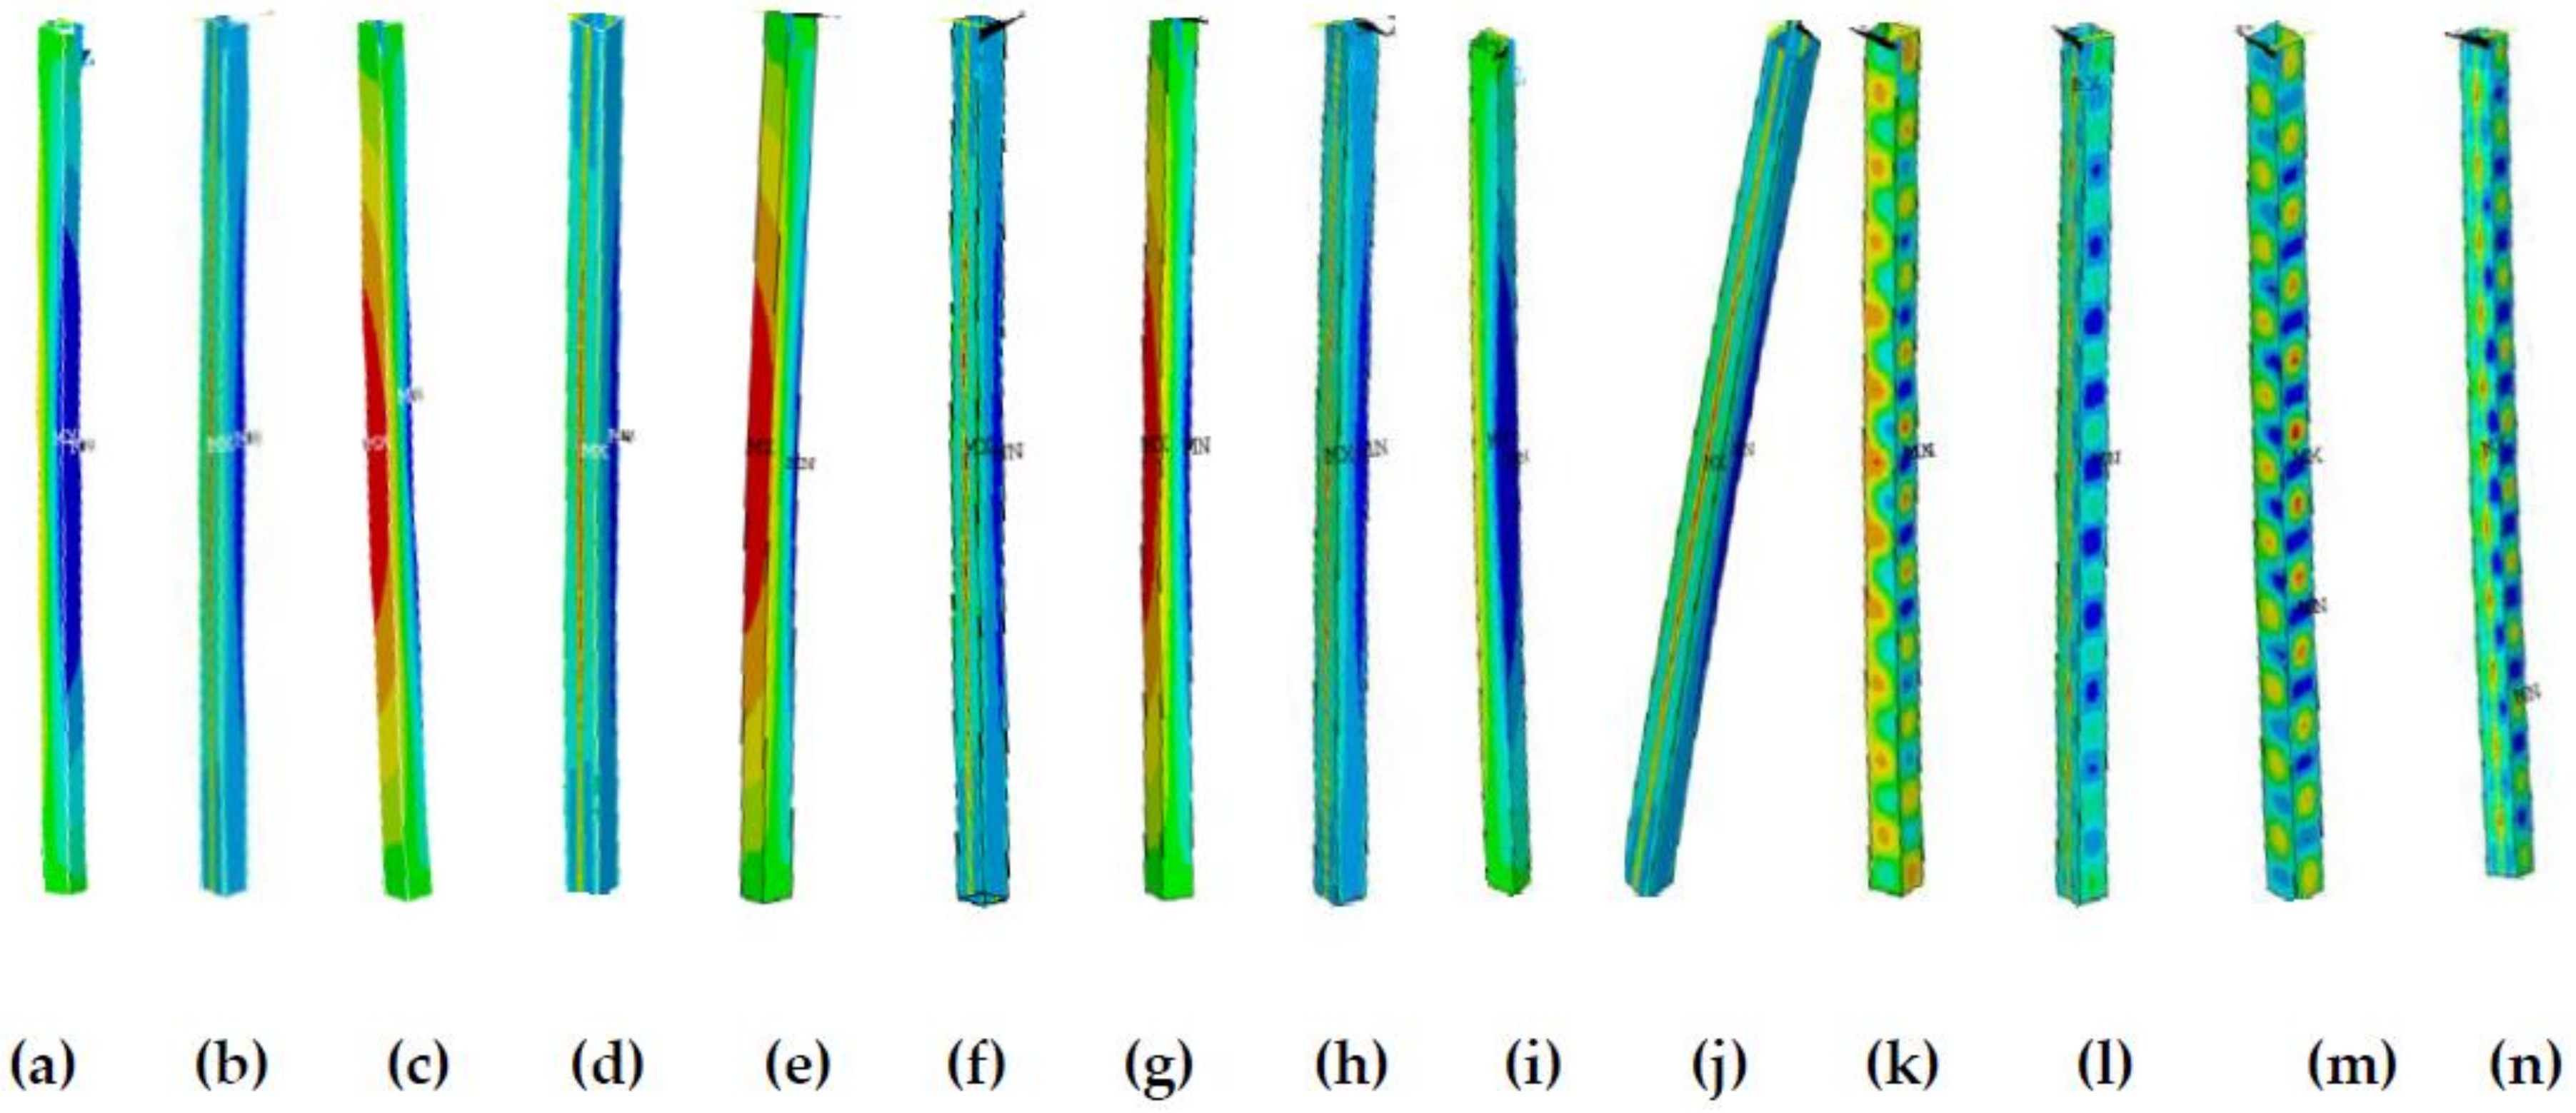
Figure 17.
The buckling equivalent stress cloud diagram when λ = 60. (a) b/t = 10, (c), b/I5, (e) b/t = 20, (g) b/t = 25, (i) b/t = 35, (k) b/t = 40, and (m) b/t = 50 without residual stress; (b) b/t = 10, (d) b/t = 15, (f) b/t = 20, (h) b/t = 25, (j) b/t = 35, (l) b/t = 40, and (n) b/t = 50 with residual stress.
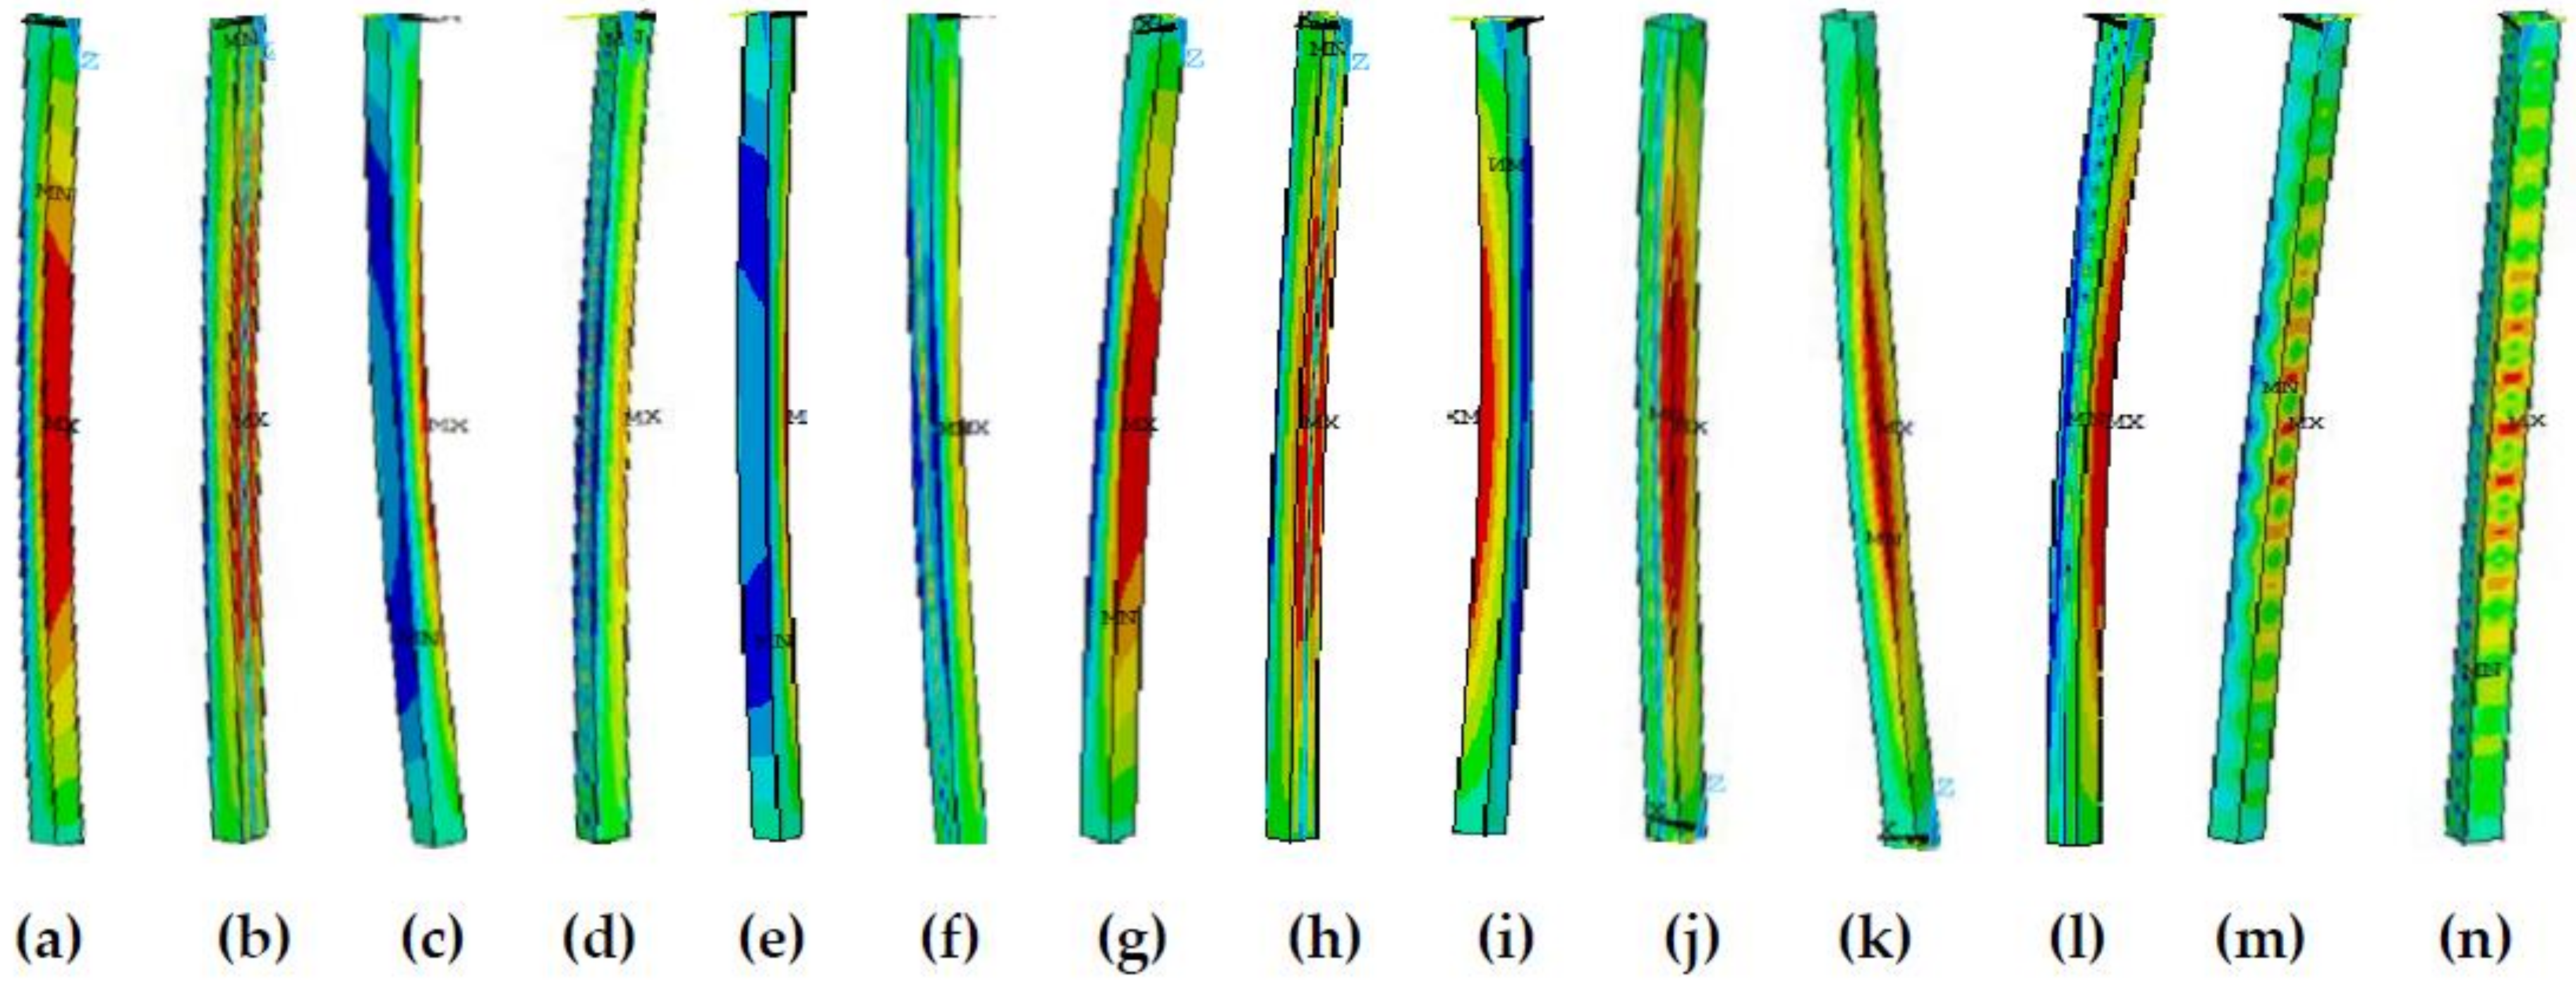
Figure 18.
The buckling equivalent stress cloud diagram when λ = 80. (a) b/t = 10, (c), b/t = 15, (e) b/t = 20, (g) b/t = 25, (i) b/t = 35, (k) b/t = 40, and (m) b/t = 50 without residual stress; (b) b/t = 10, (d) b/t = 15, (f) b/t = 20, (h) b/t = 25, (j) b/t = 35, (l) b/t = 40, and (n) b/t = 50 with residual stress.
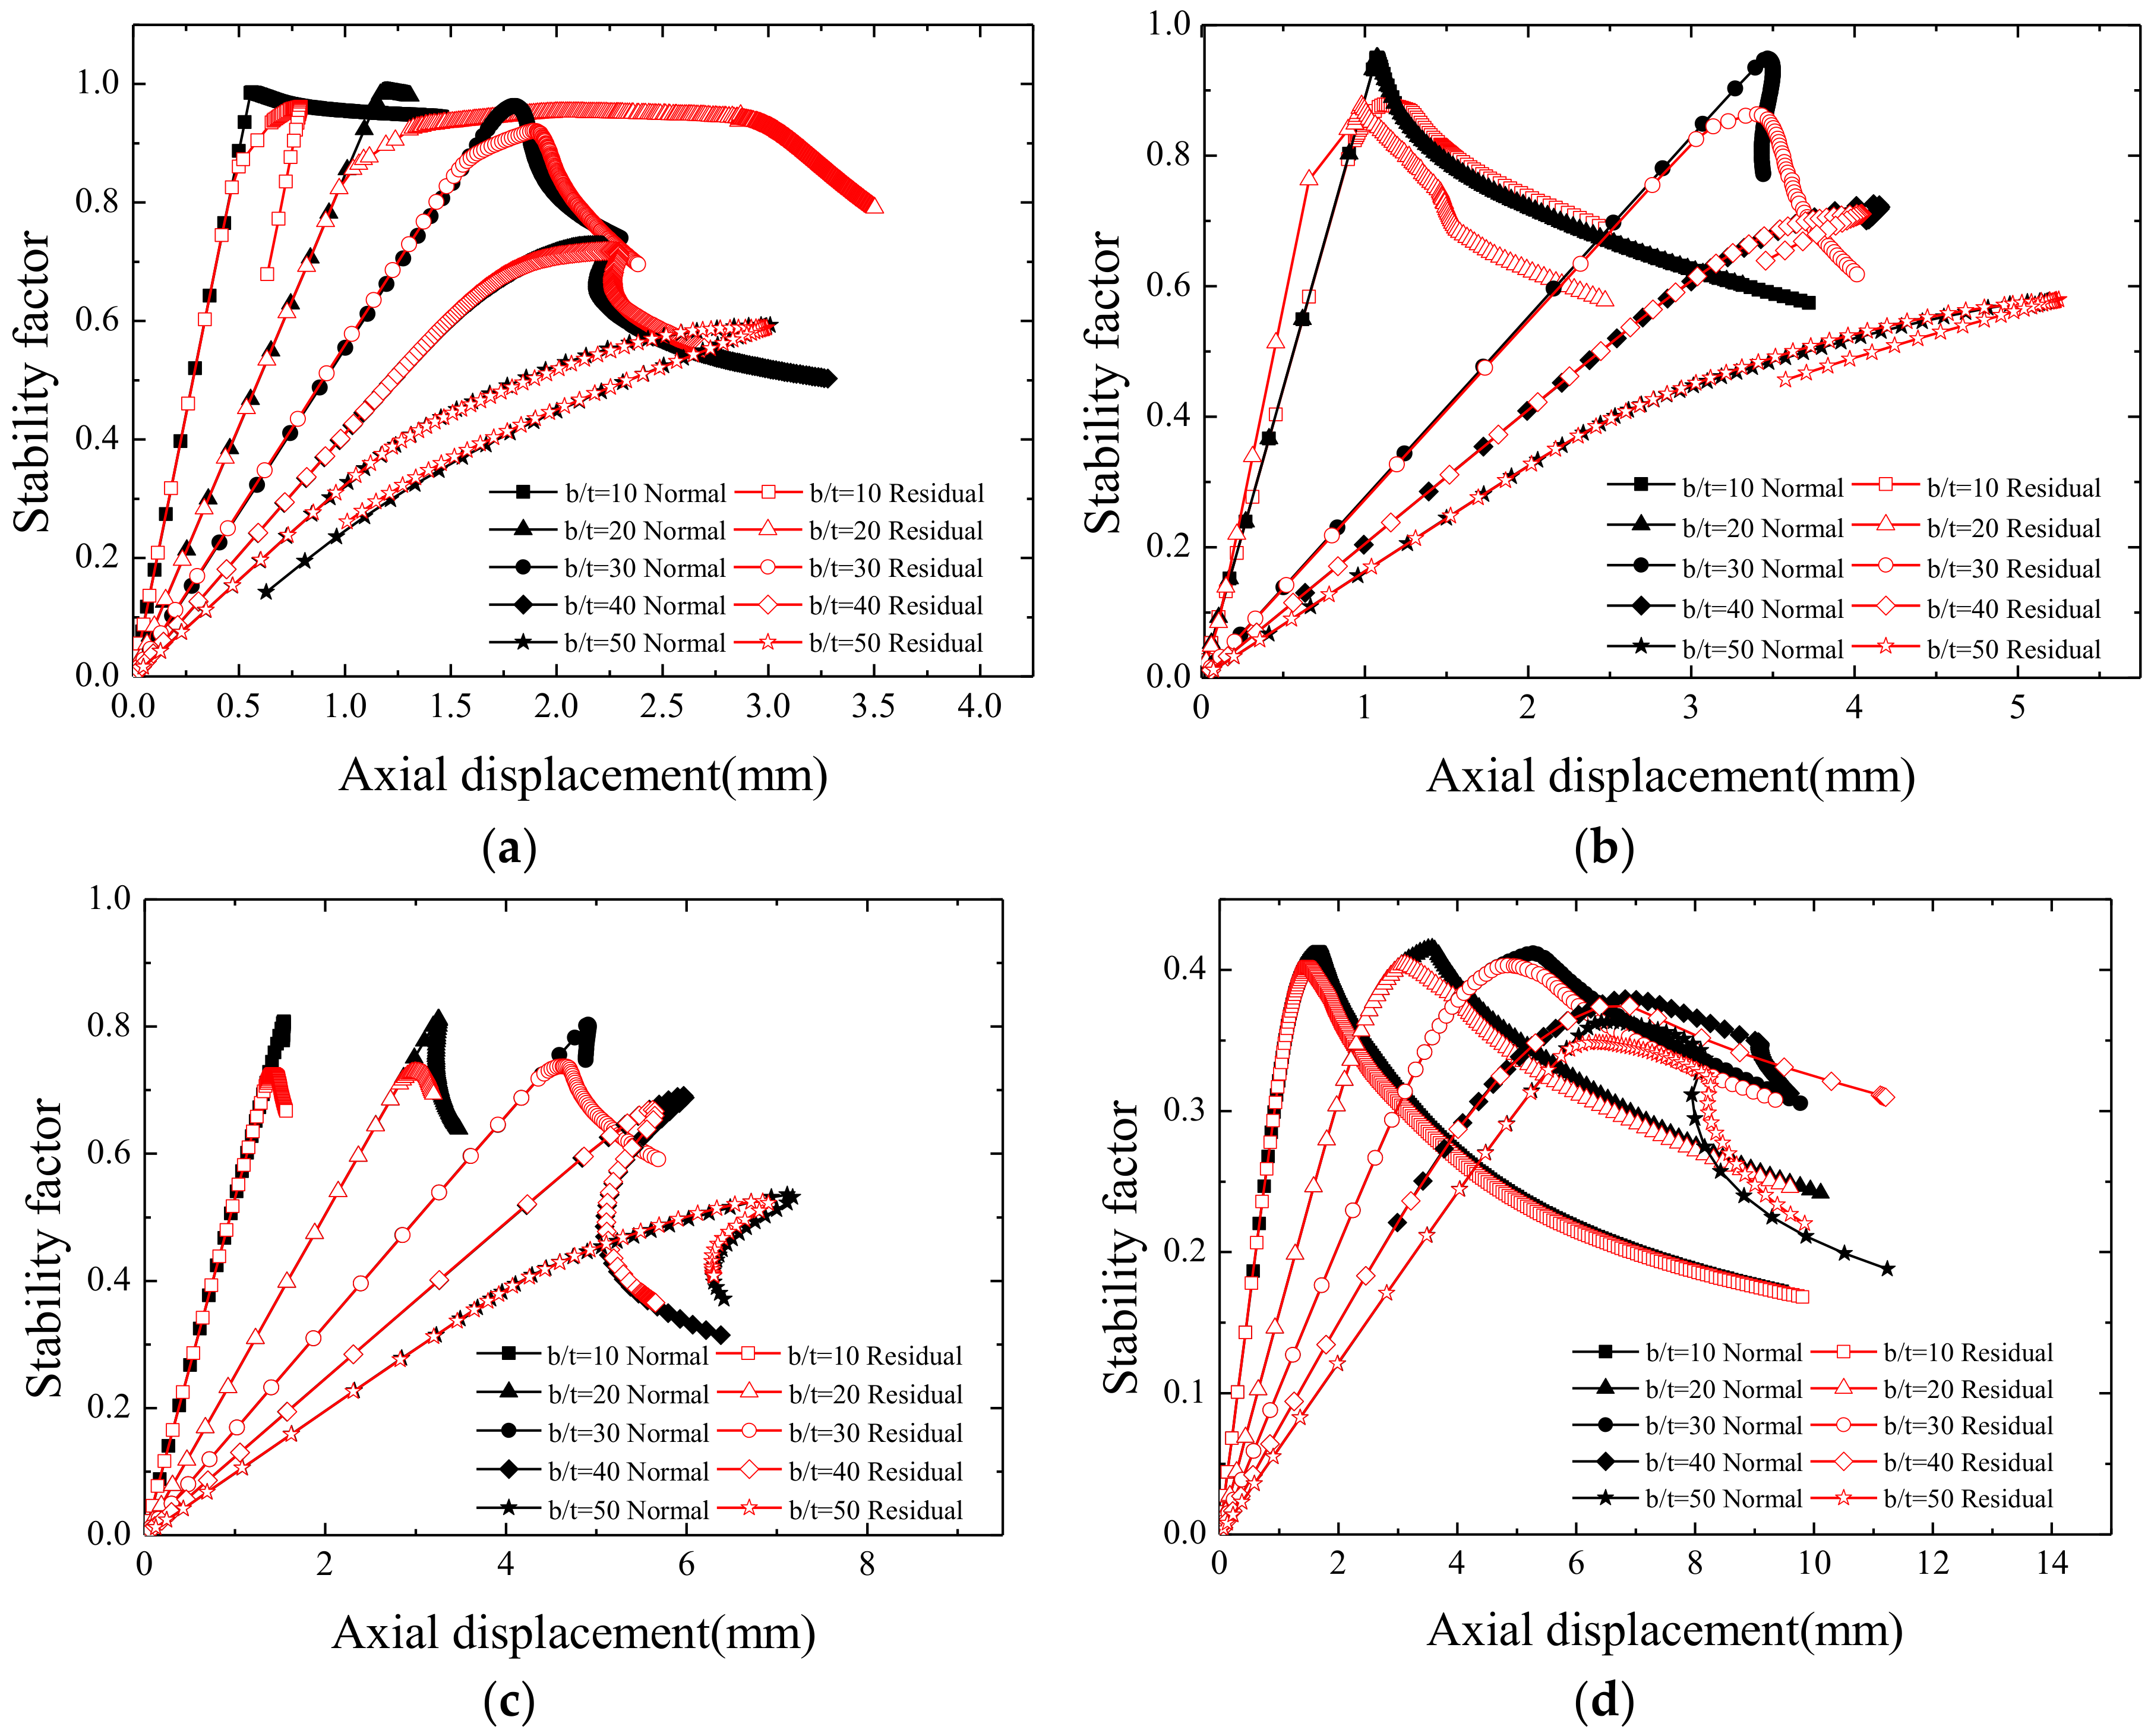
Figure 19.
Load axial displacement curves with different slenderness and width-thickness ratios. (a) λ = 15, (b) λ = 30, (c) λ = 50, and (d) λ = 80.
Figure 19.
Load axial displacement curves with different slenderness and width-thickness ratios. (a) λ = 15, (b) λ = 30, (c) λ = 50, and (d) λ = 80.
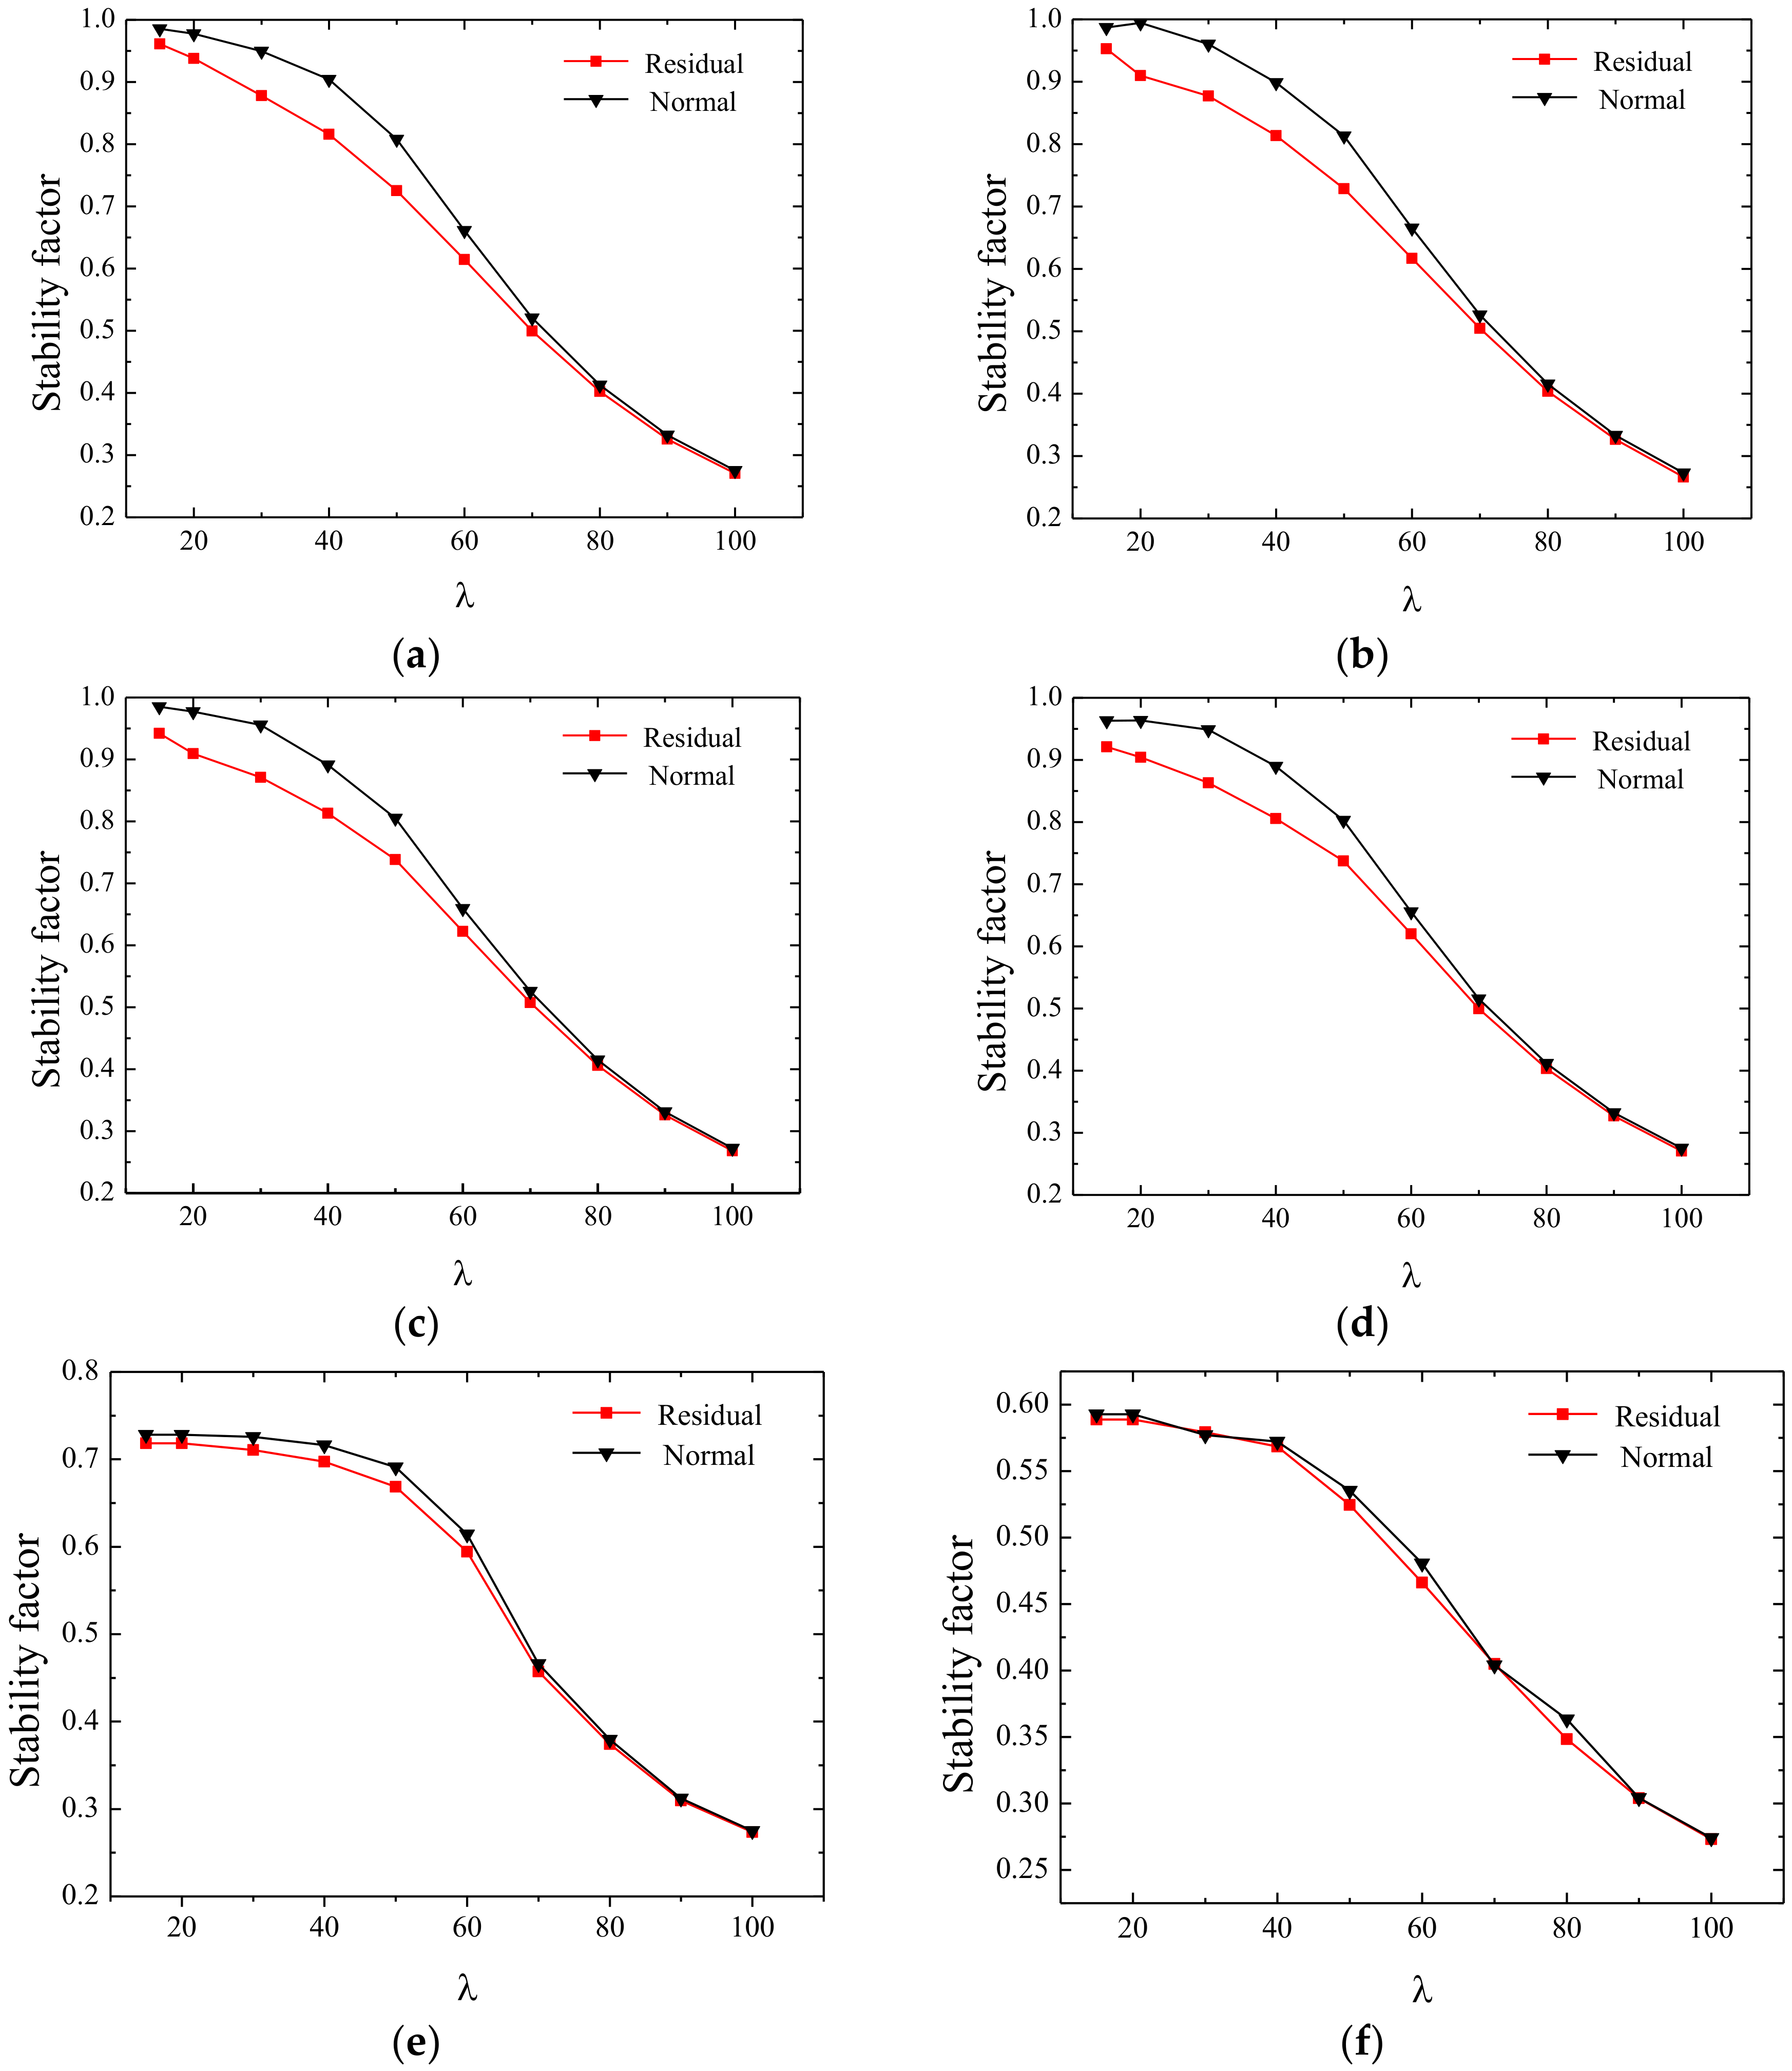
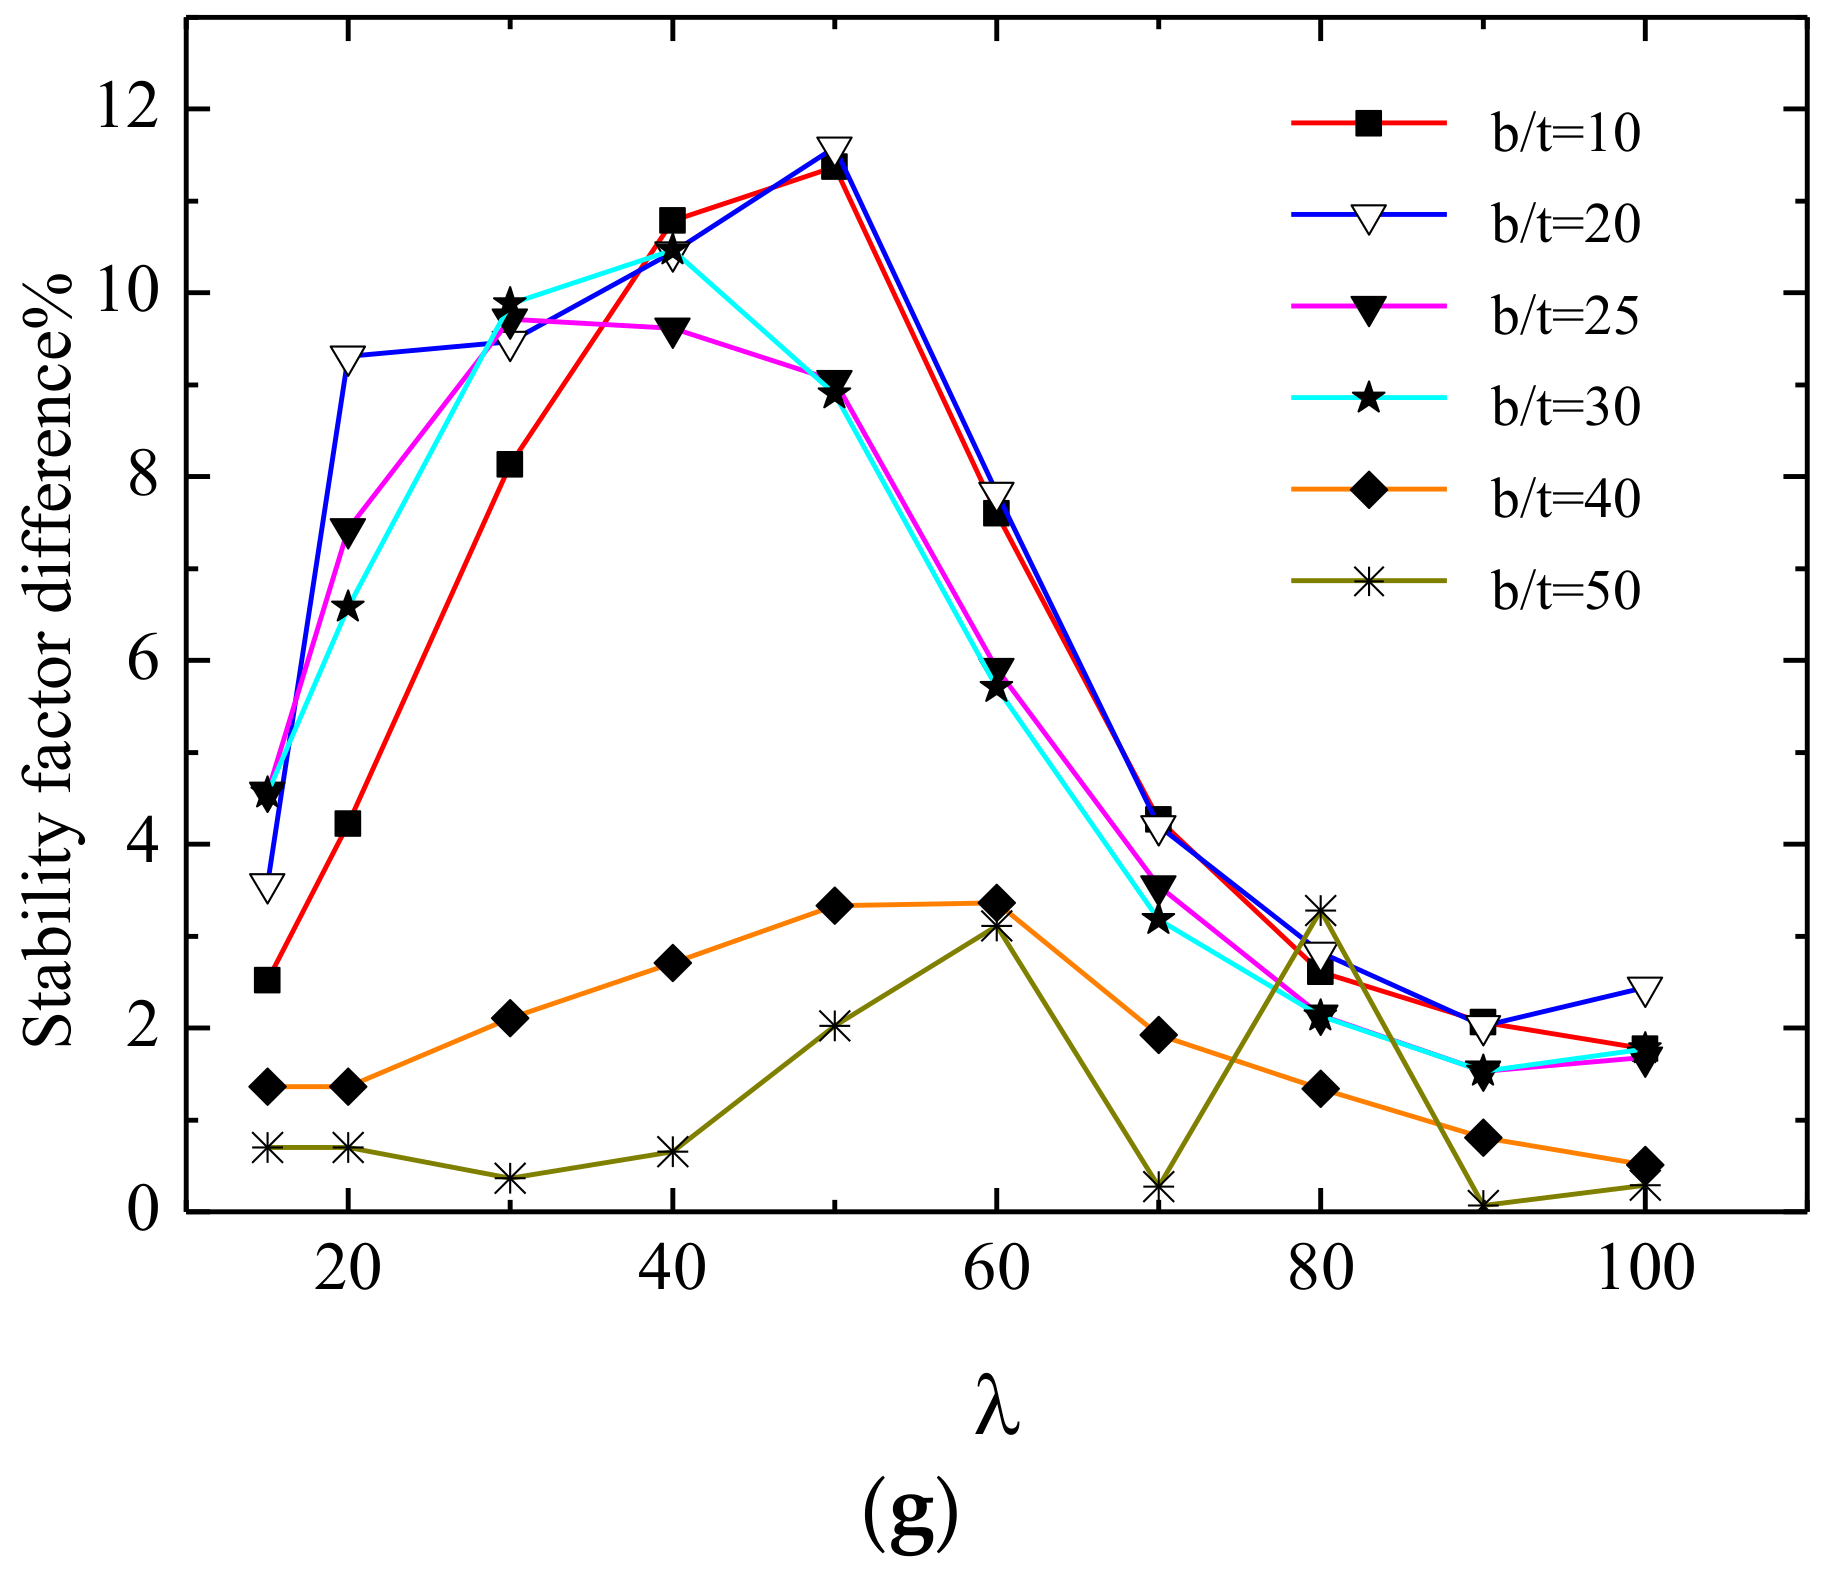
Figure 20.
Effect of residual stress on the stability factor when the width-thickness ratio is certain. (a) b/t = 10, (b) b/t = 20, (c) b/t = 25, (d) b/t = 30, (e) b/t = 40, (f) b/t = 50, and (g) percentage difference of stability factor with or without residual stress.
Figure 20.
Effect of residual stress on the stability factor when the width-thickness ratio is certain. (a) b/t = 10, (b) b/t = 20, (c) b/t = 25, (d) b/t = 30, (e) b/t = 40, (f) b/t = 50, and (g) percentage difference of stability factor with or without residual stress.
Table 1.
Chemical composition of experimental BS700 hot-rolled plates.
Table 1.
Chemical composition of experimental BS700 hot-rolled plates.
| Material | C | Si | Mn | P | S | Ti | Nb | V | Fe |
|---|
| BS700MC | ≤0.10 | ≤0.40 | ≤0.10 | 0.014 | ≤0.10 | ≤0.10 | ≤0.10 | ≤0.10 | Base |
Table 2.
Geometric parameters of specimens.
Table 2.
Geometric parameters of specimens.
| Specimens | L (mm) | B (mm) | t (mm) |
|---|
| TS1 | 200.11 | 20.04 | 3.18 |
| TS2 | 200.04 | 20.15 | 3.15 |
| TS3 | 200.16 | 20.04 | 3.10 |
Table 3.
Basic mechanical properties of BS700 high-strength steel.
Table 3.
Basic mechanical properties of BS700 high-strength steel.
| Specimens | Young’s Modulus E (GPa) | Yield Stress fy (MPa) | Ultimate Stress fu (MPa) |
|---|
| TS1 | 208.7 | 746.7 | 807.3 |
| TS3 | 207.1 | 742.1 | 778.9 |
| Average | 207.9 | 744.4 | 793.1 |
Table 4.
Butt size parameters of the cross-section design.
Table 4.
Butt size parameters of the cross-section design.
| Specimen Number | Flange Width b/mm | Flange Thickness tf/mm | b/tf | Web Height h/mm | Web Thickness tw /mm | h/tw | Length L/mm |
|---|
| RS1 | 105.9 | 3.68 | 28.8 | 106.1 | 3.25 | 32.6 | 450 |
| RS2 | 60.3 | 3.21 | 18.8 | 60 | 3.76 | 16.0 | 250 |
| RS3 | 210.2 | 6.46 | 32.5 | 209.8 | 6.23 | 33.7 | 660 |
| RS4 | 120.4 | 6.15 | 19.6 | 120.1 | 5.96 | 20.2 | 400 |
Table 5.
Residual stress values of each test point (MPa).
Table 5.
Residual stress values of each test point (MPa).
| Specimen Number | Point 1 σft1 | Point 2 σr2 | Point 3 σfwt1 | Point 4 σfwt2 | Point 5 σwc | Point 6 σfwt3 | Point 7 σr3 | Point 8 σft2 |
|---|
| RS1 | 542.1 | −98.2 | 46.3 | 32.6 | −62.3 | 65.1 | −82.7 | 564.4 |
| RS2 | 589.2 | 52.1 | 119.4 | 108.7 | −152.8 | 98.5 | 25.4 | 601.5 |
| RS3 | 513.2 | −98.4 | 81.5 | 71.6 | −81.2 | 68.3 | −79.8 | 538.4 |
| RS4 | 619.8 | −162.1 | 128.2 | 103.9 | −141.3 | 76.4 | −185.1 | 592.3 |
Table 6.
Residual stress distribution pattern data of specimens.
Table 6.
Residual stress distribution pattern data of specimens.
| Specimen Number | σft/MPa | σfwt/MPa | σfc/MPa | σwc/MPa | a1/mm | b1/mm | a2/mm | d1/mm |
|---|
| RS1 | 560.0 | 74.7 | −112.0 | −74.7 | 6 | 5.3 | 3 | 3 |
| RS4 | 634.7 | 112.0 | −186.7 | −149.3 | 6 | 3 | 12 | 12 |
Table 7.
Slenderness ratio of equal stability design.
Table 7.
Slenderness ratio of equal stability design.
| Width–Thickness Ratio (b/t) | Slenderness Ratio (λ) |
|---|
| 10 | 20.3 |
| 15 | 30.5 |
| 20 | 40.7 |
| 25 | 50.8 |
| 30 | 61.0 |
