The bimodal-grain-size AA 7075 aluminium alloys containing varied ratios of large and small powders were prepared by SPS sintering. The passive film properties of such alloys were tested and discussed with the corresponding microstructures. This section reveals the microstructure and microchemistry of alloys as well as the electrochemical performance of passive films.
3.1. Microstructure of Alloys
Figure 1 shows the cross section of unsintered 7075 aluminium powders. Both the large (
Φ100 μm) and small (
Φ10 μm) powders were polycrystalline, because the brighter lines, which consist of heavy elements, such as Cu, Zn, Fe, and Cr, almost distributed along grain boundaries. The grains in large powder were several microns in diameter, while those in small powder had a diameter with hundreds of nanometers. Besides, the intermetallic phases (bright lines) in small powders also showed a narrower width than that in large powders. The molten alloy droplet cooling rate is in direct proportion to its specific surface area [
20,
21]. While, the small powder had 10 times bigger specific surface area as compared to the large one and, thus, a faster cooling rate resulted in refined structures (fine grains and intermetallic phases) in small powders.
Figure 2 shows the typical metallographic features of sintered alloys, in where, both the large and small powders are dispersed very well in matrix, and no gaps as well as cracks are observed. The weld bond between powders and the grain boundaries inside powders are clearly observed on etched metal surface. The large powders assembled the coarse grain zone and small powders assembled the fine grain zone. The back scattered electron images (BEI) of sintered alloys obtained by SEM are shown in
Figure 3 in order to reveal the detailed microstructure of sintered alloys. Even though the sintered alloys were not etched, the coarse and fine grain zones still could be distinguished in metal matrix, because the intermetallic phases in them showed different features. The grains in raw powders did not grow bigger after sintering according to
Figure 1,
Figure 2 and
Figure 3, since the SPS procedure was performed at a relatively low temperature (500 °C) with a short dwell time (1 min), which were not enough to sustain the grain growth. However, the relatively continuous intermetallic phases along grain boundaries in unsintered powders were partially re-dissolved into alloy matrix after SPS sintering, since the sintering temperature was 500 °C, which overlapped with the solution treatment temperature (460–480 °C) of 7075 alloy [
22,
23]. Therefore, those intermetallic phases were broken up and showed bone-like features in coarse grain zone and speckle-like features in the fine grain zone. Besides, more and bigger black phases, which were rich in elements Mg and Si, were observed in coarse grain zone. The different features of intermetallic phases in coarse and fine grain zones could be attributed to the different cooling rate of varisized aluminium powders during atomization process, which was similar to quenching. Additionally, the SPS remained most of the quenching structures of powders in bulk alloys after sintering. The density of sintered alloys AL1 to AL6 was 2.81 g/cm
3 according to the Archimedes test and not less than that of commercial 7075 alloy, proving that the micro-porosity, which was inevitable to traditional powder metallurgy, did not exist in SPS sintered aluminium alloys in this study.
The TEM equipped with EDS was used to measurements in order to quantitatively analyze the diameter and microchemistry of intermetallic phases in sintered alloys. The high angle annular dark field (HAADF) images of intermetallic phases in coarse and fine grain zones as well as the EDS line scan results are shown in
Figure 4. The bright-contrast phases in TEM images could be divided into two types. One type was η-phase (and its analogues) and rich in Mg, Cu, and Zn, it usually acted as anode during corrosion. The other type mainly contained Fe, Cu, and Al, and it usually acted as cathode during corrosion [
10,
11,
18,
24]. The EDS line scan results also indicate that both the anodic and cathodic phases in coarse grain zone have a bigger diameter as well as a higher alloying element content. The nucleation and growth of second phases usually result in the depletion of alloying element surrounding these phases, thus the alloying element depletion zone is always adjacent to the second phases. Even though the depletion zone is hardly observed on SEM and TEM images, it is clearly revealed by EDS linear scan, as shown in
Figure 4d–j. The coarse grain zone showed a wider depletion zone with a more severe alloying element depletion when compared to the fine grain zone. While, both the anodic and cathodic phases had higher alloying element content in coarse grain zone, implying that the intermetallic phases exhibited bigger componential difference as compared to their adjacent depletion zone, which always led to more severe electrochemical heterogeneity in matrix.
Table 1 lists the statistical data of intermetallic phases in coarse and fine grain zones obtained by ImageJ software. Most of the intermetallic phases distributed along grain boundaries, they exhibited more continuous feature and larger diameter in coarse grain zone, but also showed higher quantity and smaller diameter in fine grain zone.
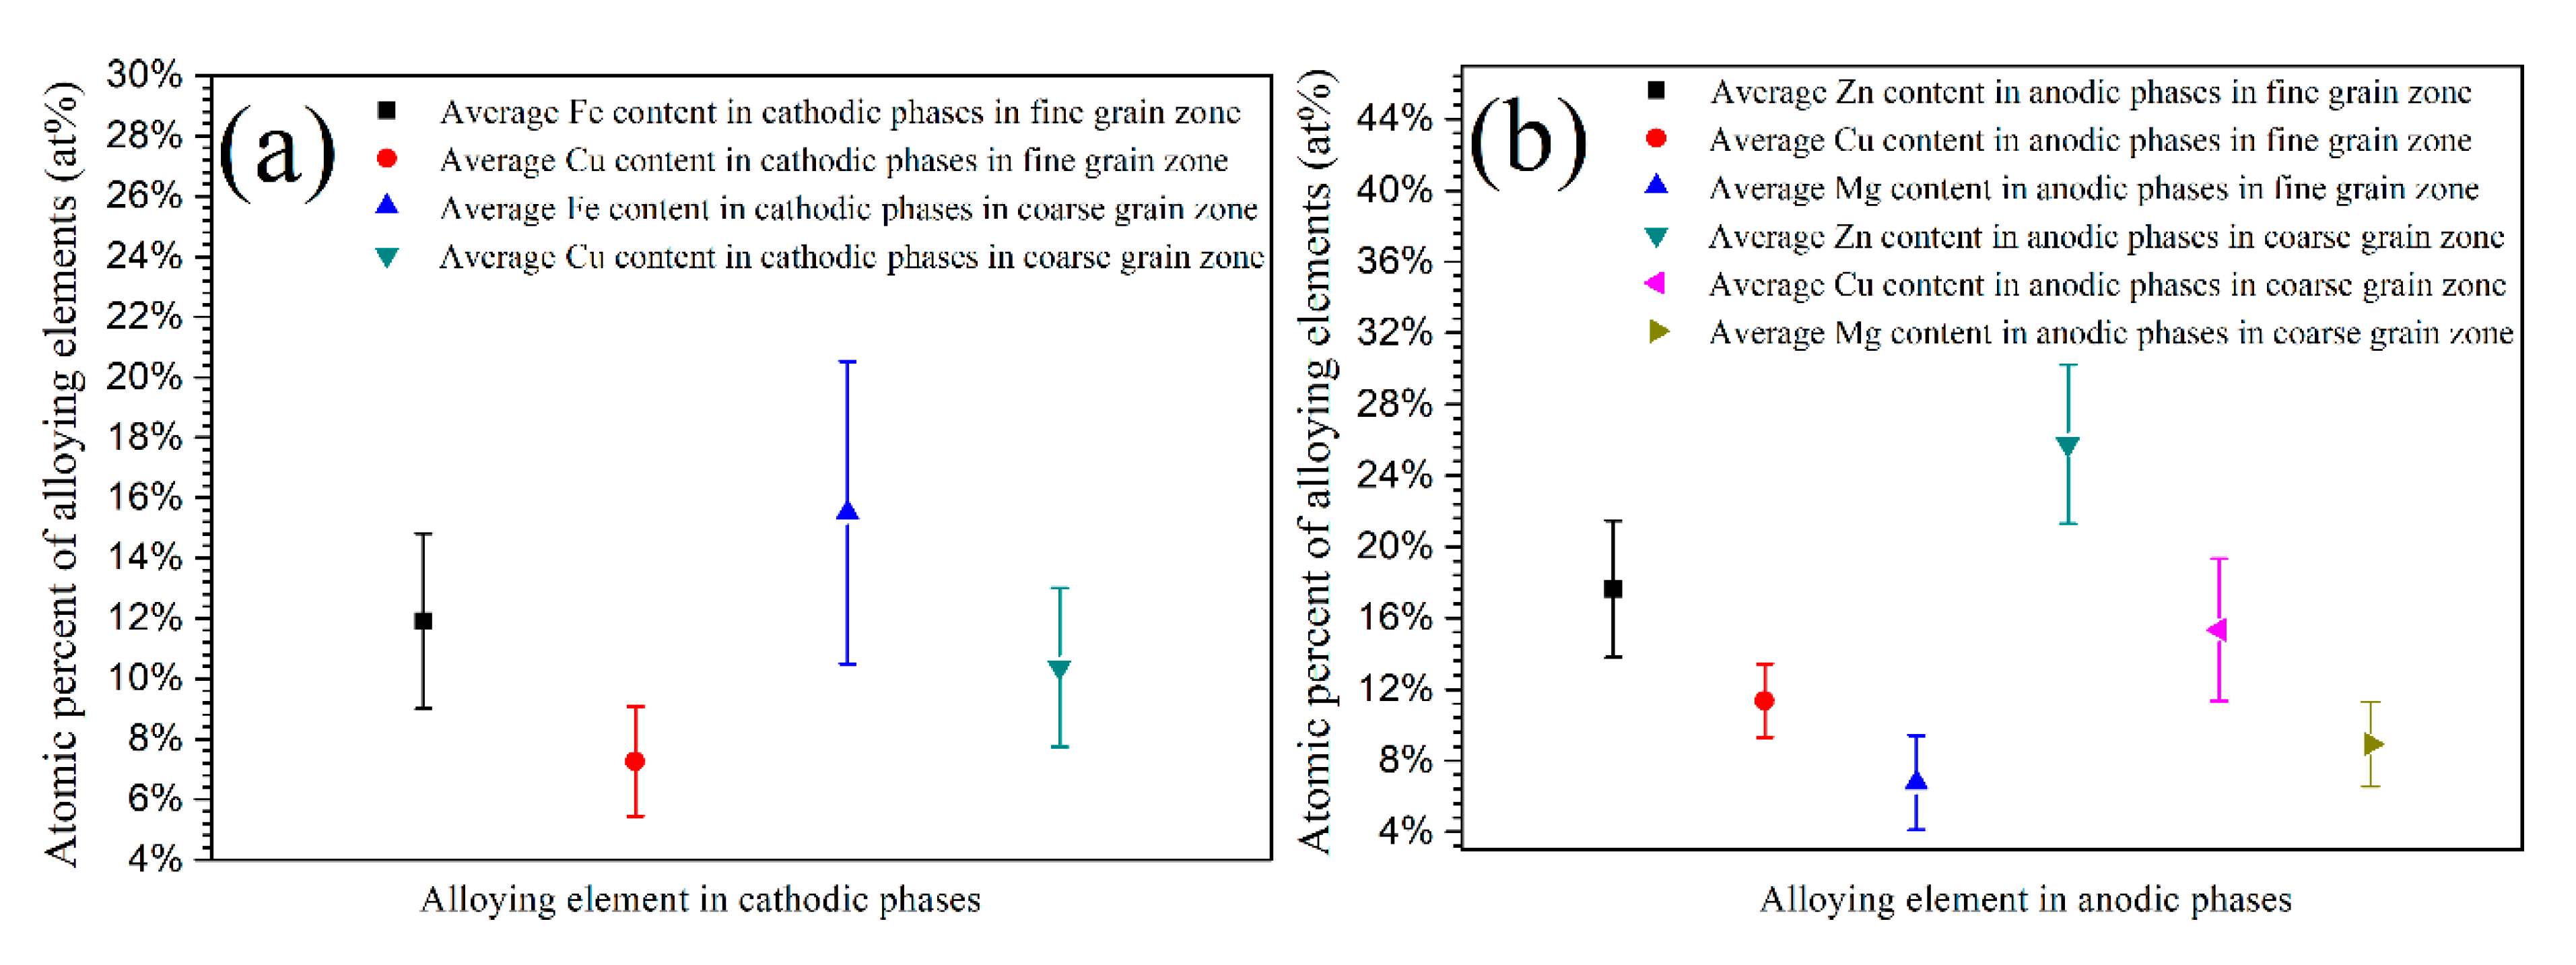
Figure 5 shows the average atomic percent of alloying elements in anodic and cathodic phases obtained from numbers of EDS measurements. In the coarse grain zone, both the anodic and cathodic intermetallic phases contained more alloying elements as compared to those in fine grain zone. The microstructural and microchemical difference between coarse and fine grain zones, as shown in
Figure 4 and
Figure 5 and
Table 1, could be attributed to the different cooling rate of large and small aluminium powders. The cooling rate of metal powders has a significant effect on the diffusion and content of alloying elements in metallic phases and depletion zone on grain boundaries. When compared to small powders, the large powders can maintain a higher temperature for a longer period due to the lower cooling rate, which are favorable for rapid diffusion of alloying elements from matrix to grain boundaries [
8,
9,
10,
11], leading to the formation of more and bigger second phases. Simultaneously, a more severe depletion of solute elements occurs inside the matrix near the grain boundaries, resulting in the formation of wide depletion zone with a low content of alloying element [
10,
11,
21]. In addition, several small phases could grow to merge into large ones due to the precipitation and growth of second phases in coarse grains, forming more continuous and bigger phases. In contrast, fewer and smaller second phases could form during cooling in fine grain zone as a result of higher cooling rate, which suppress the diffusion of alloying elements. The effect of cooling rate on the microstructure of raw metal powders in this study is similar to that of the quench rate on aluminium alloys structure during quench process [
22,
23]. The microstructural and microchemical difference of intermetallic phases between large and small powders would be reserved in bulk alloys after sintering, owing to the low sintering temperature and short processing time of SPS.
The cathodic phases, which are rich in Cu and Fe in 7075 alloy, usually have a 200–600 mV higher volt potential than surrounding metal matrix. While, the anodic phases, which are rich in Zn and Mg, have a 100–300 mV lower volt potential than surrounding matrix. Additionally, the potential difference between intermetallic phases and their surrounding matrix increases with the increasing alloying elements content [
25,
26,
27,
28]. Besides, a wider alloying element depletion zone with a more severe depletion would aggravate this electrochemical heterogeneity in alloys. Therefore, the cathodic phases become more cathodic, and the anodic phases become more anodic in coarse grain zone for bulk alloys and, thus, they exhibit higher electrochemical activity and they are more sensitive to localized corrosion. Based on the above description, the intermetallic phases in coarse grain zone are more likely to lead to passive film collapse.
3.2. Potentiodynamic Polarization Measurement
Figure 6 shows the potentiodynamic polarization curves of sintered alloys after 6 h immersion in 0.2 M Na
2SO
4 + 0.01 M NaCl solution. All of the alloys exhibited the similar polarization behavior according to the similar shape of polarization curves. The alloys AL1–AL6 could keep passivation at corrosion potential
Ecorr and showed obvious passive ranges due to the tiny increasing of anodic current density with increased potential. When the applied over-potential approached dozens or a hundred of millivolts relative to the
Ecorr, the electrode reaction current presented linear relationship with potential and, thus, approached the Tafel-type behavior. Therefore, the Tafel extrapolation was used to reveal the detailed information of polarization curves, and the relevant data are shown in
Table 2. The
Ecorr and the pitting potential
Epit both lightly increased with the increasing content of small powders in metal matrix. While, the corrosion current density
icorr and the passive current density
ipass showed opposite changing trend as compared to those potentials, i.e., obviously decreased with small powders content, implying that fine grain zone provided a better passive capability to sintered alloys. Besides, the passive range of alloys also increased with increasing content of small powders, indicated that the passive film on fine grain zone showed a better stability. The cathodic and anodic Tafel slopes (
bc and
ba) are in direct proportion to the resistance of electrode reaction [
10,
11]. The alloys containing more large powders (coarse grains) exhibited a smaller value of
bc, implying that the bigger second phases containing higher alloying element in coarse grain zone could accelerate the cathodic reaction rate. The
ba value of alloys increased with the increasing content of small powders. A bigger
ba usually indicates a bigger dissolution resistance of passive film on metals; therefore, it could be concluded that the alloys containing more small powders have a better passive ability or a higher corrosion resistance [
10,
11,
29], which could be also proved by the decreased
icorr and
ipass with increasing content of small powders.
The large powders had a larger volume, and thus a slower solidification and cooling rate, resulting that the intermetallic phases in them had a bigger diameter and a higher alloying elements content as compared to that in small powders, as mentioned in
Section 3.1. Furthermore, the small powders had a higher grain boundary density compared to the large one. Additionally, those microstructural difference in powders were indeed retained in alloys matrix after SPS sintering. The bigger intermetallic phases usually result in a bigger cavity during localized corrosion, which will promote the stabilization of localized corrosion, such as pitting, and, thus, facilitate the fracture of passive film. While, a higher grain boundary density usually accelerates the metal atom diffusion to repair the passive film. Therefore, the sintered alloys containing more small powders exhibited a better corrosion resistance according to
Figure 6 and
Table 2. The volt potential difference between intermetallic phases and their surrounding matrix depends on the composition difference, and significantly increases with the increasing content of alloying elements in second phases [
25,
26,
27,
28]. Thus, coarse grain zone in sintered alloys always exhibited higher driving force to resulting in passive film fracture and localized corrosion. In contrast, the fine grain zone showed a lower electrochemical heterogeneity. Consequently, the passive properties of sintered alloys increased with the increasing content of small powders.
3.3. Mott-Schottky Measurement
Oxide or passive film formed on aluminium usually contains some point defects as well as a volt drop and shows semiconducting properties, which is strongly associated with the corrosion resistance of metals according to point defect model [
30,
31,
32,
33,
34,
35]. The defects characteristics of passive film are functions of applied potential, and do not change if the potential scan rate is fast enough (such as over 10 mV/s) [
31,
33,
34]. Therefore, the Mott–Schottky measurement could evaluate the semiconducting properties of passive film at a fast potential scan rate. The interface capacitance of electrode system can be expressed by Equation (1) according to Mott–Schottky theory [
36,
37].
where
C is the interface capacitance of electrode system,
CH is the Helmholtz double layer capacitance,
Csc is the space charge capacitance of passive film,
e is the electron charge (−1.6021 × 10
−19 C),
εo is the vacuum permittivity (8.85 × 10
−12 F/m),
ε is the passive film permittivity of aluminium and has a value of 10 according to literatures [
38,
39,
40],
NA is the acceptor density (or charge carrier density in this study),
E is the applied potential,
Efb is the flat band potential,
κ is the Boltzmann constant (1.3807 × 10
−23 J/K),
T is the kelvin temperature, and
A is the area of electrode. The Helmholtz double layer capacitance of metal has a value of 30 to 50 μF/cm
2 and it is far bigger than the space charge capacitance of passive film of aluminium. Additionally, the high frequency (over 1 to 10 Hz) of AC amplitude also minimize the effects of
CH on
C−2-potentials curves. Thus, the
Csc ≈
C during Mott–Schottky test, and Equation (1) can be simplified into Equation (2) for n-type semiconductor, and Equation (3) for p-type semiconductor [
36,
37,
38,
39,
40].
Figure 7 shows the Mott–Schottky plots of passive films formed on AL1to AL6. All of the plots exhibited a linear relationship between
C−2 and applied potentials in the approximate potential range of −0.5 V to −0.1 V. The negative slopes of curves indicated that the passive films formed on sintered alloys showed p-type semiconductor properties in 0.2 M Na
2SO
4 + 0.01M NaCl solution [
36,
37,
38,
39,
40]. Therefore, the charge carrier in passive film was acceptor, which was mainly represented by Al
3+ vacancy in this study. The semiconducting type of passive film was mainly determined by chemical component of alloys, and it is not affected by the aluminium powder size. The linear relation between
C−2 and potential indicates the existence of space charge layer in passive films [
38,
39,
40], and if let the slope in Equations (2) and (3) to be
m, then the acceptor density (or charge carrier density)
NA can be expressed by Equation (4).
Figure 7 also shows that the absolute value of curve slope increases with the increasing content of small powders in metal matrix. The numerical data of
NA calculated according to
Figure 7 and Equation (4) is shown in
Figure 8 by the black line. It shows that the
NA of passive film decreases with the increasing content of small powders, indicating that the passive film that formed on fine grain zone had less point defect than that formed on coarse grain zone. A higher charge carrier density implies a highly disordered structure in passive films [
36,
37,
38,
39,
40], and more point defects in passive film usually means worse corrosion resistance [
41,
42]. In this study, the main point defect in passive film was assigned to Al
3+ vacancy, which has been reported to increase the conductivity of passive films and, thus, lead to a higher passive current density. This could illustrate why the alloys containing more large powders showed higher passive current density during potentiodynamic polarization. The Mott–Schottky measurements indicated that the passive film that formed on fine grain zone showed better stability and lead to a better corrosion resistance of alloys.
The small and large powders as well as the sintered alloys had identical chemical composition. It is reasonable to suggest that the difference of semiconducting properties (such as
NA value) of passive film can be attributed to the difference of grain size and intermetallic phases features. In the sintered alloys, the fine grain zone showed a far smaller grain size as compared to the coarse grain zone and, thus, contains far more grain boundaries that could accelerate the Al
3+ cation diffusion from metal lattice to passive film. Consequently, promoted the repair of passive film on sintered alloys. In this study, the point defect in passive film was mainly Al
3+ cation vacancy, while a faster Al
3+ cation diffusion rate could reduce those vacancies. The same phenomena of improved passive film were also observed on refine-grained aluminium and stainless steel processed by ECAP, surface rolling, and ion sputtering [
43,
44,
45,
46]. The higher alloying element content, bigger area fraction, and diameter of intermetallic phases in coarse grain zone would increase the disordered structure, such as ion vacancy and micro-crack in passive film, and, thus, increased the point defects. Ryl et al. found that the altitude difference between second phases and their surrounding matrix was several to dozens of nanometers after polishing because of the hardness difference between them, which was determined by original diameter of second phases [
47]. A large intermetallic phase usually results in a large altitude difference between second phases and their surrounding metal matrix and, thus, causes weak interface between second phases and passive film, which should be also responsible for the bigger
NA in passive film formed on coarse grain zone.
AL1 and AL6 just contained pure large and small powders, respectively. AL2 to AL5 contained both large and small powders. The area ratios of coarse grain zone to fine grain zone in alloys AL1 to AL6 were 1:0, 0.72:0.28, 0.57:0.43, 0.43:0.57, 0.28:0.72, and 0:1, respectively. If the passive film that formed on large and fine grain zones does not affect each other, the
NA should exhibit a linear relationship with the area fractions of different grain zones, and Equation (5) can be deduced.
where
NAb and
NAs are the acceptor density of passive films on pure coarse (AL1) and pure fine (AL6) grain zones, respectively;
NA is the acceptor density of passive film formed on one electrode surface; and,
Ab and
As are the area fractions of coarse and fine grain zones on one electrode surface, respectively. The calculated
NA values of alloys is shown in
Figure 8 by the red line. The measured
NA values of AL2 to AL5 were smaller than the theoretically calculated ones, which indicated that the mixture of large and small powders could generate some electrochemical interactions between each other and, thus, reduce the
NA value and improve passive properties of oxide film. The real reason of the passive film improvement caused by mixing the large and small powders is still not clear at present, because of the limitation of the current research methods.
3.4. Electrochemical Impedance Spectra Measurement
The EIS measurement was applied in order to evaluate the capacitance and resistance of passive film in 0.2 M Na
2SO
4 + 0.01 M NaCl solution.
Figure 9 shows the relevant Nyquist and Bode plots. All of the sintered alloys showed a similar response during EIS tests, i.e., a depressed capacitance arc at testing frequency range, which indicated that all of the alloys formed a relatively homogenous oxide film in testing solution [
11]. While the increased radius of Nyquist loop with increasing content of small powders implied that the alloys containing more small powders showed a bigger passive film impedance, which has been also proved by the |Z| value in the Bode plot. A bigger impedance usually means a better corrosion resistance of passive film. The Bode plot for each alloy showed essentially one time constant, which meant that the impedance response comes from just one interface. Two (or more) time constants would occur on bode plots if the metals encounters corrosion, one comes from passive or oxide film and the other comes from actively corroded metal interface [
10,
11]. The one time constant in this work mainly indicated the electrochemical response of passive film, which indicated that the passive films on all of the sintered alloys kept steady and without corrosion during EIS measurement. Therefore, the equivalent circuit, as shown in
Figure 9a, was adopted to fit the EIS spectra in this work, which has been used in literatures to deduce the passive film parameters on aluminium alloys [
38,
47]. In the equivalent circuit,
Rs is the solution resistance,
Rf is the passive film resistance, and
Qf is the constant phase element, which describes the dielectric properties of passive film. The impedance of
Qf can be described by the equation
ZQf =
Y−1(
jω)
−n,
Y is scaling factor,
j is imaginary unit, and
ω is the angular frequency. In many cases,
Qf replaced
Cf (film capacitance) to provide a good fit to multiphase alloys, because it is related to the presence of different components with different capacitances [
38,
42,
47,
48]. The passive film capacitance
Cf can be calculated by Equation (6)
Table 3 lists the fitted results of EIS plots about the passive film properties. They also demonstrate that the alloys containing more small powders have a more protective passive film, since the
Rf increases significantly with the increasing content of small powders. The film resistance is inversely proportional to the corrosion rate, and a bigger one usually implies good corrosion resistance of films or metals. The above results were consistent with the potentiodynamic polarization curves. The
n values of sintered alloys were all above 0.9, which meant a good capacitive character of passive film interface [
47,
48]. The thickness of space charge layer
Lss can be deduced by Equation (7) [
36,
49].
where
A,
ε,
εo, and
Cf have been mentioned above.
Figure 10 shows the calculated
Lss of sintered alloys. Even though the thickness difference was not such significant, it still showed a clear changing trend. The thickness of space charge layer decreased with the increasing content of small powders. The thickness of space charge layer is proportional to the film thickness; therefore, a thicker space charge layer indicates a thicker passive film, which should provide a better protection to sintered alloys from corrosion. Besides, a thicker space charge layer should provide a longer diffusion path and, thus, slow down the carrier flow from metal surface to electrolyte. These properties would promote the corrosion resistance of passive film [
30,
31,
32,
33,
34,
35]. However, the polarization tests, Mott–Schottky tests, and EIS measurements all proved that the alloy containing more small powders had a more protective passive film. Therefore, the
NA value had a more dramatic impact on the corrosion resistance of passive film than the thickness of space charge layer in this study. The intermetallic phases in coarse grain zone were bigger and contained more alloying elements, and they usually resulted in more and bigger weak interfaces between them and passive film, which would facilitate the hydration of passive film during immersion [
10,
11,
47]. This may be a possible reason for passive film on coarse grain zone having a thicker space charge layer but a worse corrosion resistance.
3.5. X-ray Photoelectron Spectroscopy Measurement
The XPS measurements were also performed to further characterize the passive film properties of sintered alloys, and the relevant results are shown in
Figure 11. All of the sintered alloys expressed the extremely similar XPS spectra, which clearly showed the peaks of Al2p, O1s, Mg1s, Zn2p, and Cu2p and C1s [
38,
47,
50,
51]. The surface XPS spectra did not reveal the effects of powders size on the properties of passive film; therefore, the depth profiling of XPS performed by an Ar
+ ion gun, and the etched square was 500 μm × 500 μm.
Figure 12 shows the atom percent of Al (Al2p) and O(O1s) with etching time. The growth and thickening of passive film can be treated as a diffusion of oxygen atom and Al
3+ cation with opposite diffusion direction, hence the oxide/air interface have the highest oxygen concentration and the oxide/metal interface had the highest Al concentration. Therefore, the aluminium atom percent increased, while the oxygen atom percent decreased with the etching time. According to some references, when the oxygen atom percent decreased to about 10% (or the aluminium atom percent increased to about 80%), it could be assumed that the etching have arrived to alloys substrate [
28]. A longer etching time to arrive the alloys substrate means a thicker passive film. Unfortunately, the precise thickness difference of passive film for each alloys was not known, since the accurate thickness for each ion etching pass was not accurate. The AL1 and AL6 showed obvious different element distribution on thickness profile of passive film, as shown in
Figure 12. The coarse grain zone formed a thicker oxide film, and the thickness of alloys passive film increased with the increasing content of large powders, which was consistent with the thickness of space charge layer for passive film. While the above conclusion disagreed with some literatures, in which they claimed that refined grains would increase the thickness of passive film [
43,
44,
45,
46]. For aluminium and its alloys, their passive film growth rate and thickness are usually determined by grain boundary density, at which the Al
3+ cations have a faster diffusion rate and thus promote the thickening of passive film [
43,
44,
45,
46]. The fine grain zone in sintered alloys had smaller grains and higher density of grain boundary, it should have a thicker passive film. However, the XPS results in this work implied that the large electrochemical heterogeneity caused by intermetallic phases was the major driving force to passive film growth. In the other words, the intermetallic phases had a bigger effect on passive film thickening than the grain boundary density. The huge microstructural and microchemical difference between intermetallic phases and their surrounding matrix accelerated the passive film growth, however with more point defects on coarse grain zone. The alloys containing more large powders had a thicker passive film but worse corrosion resistance, which again approved that charge carrier density (
NA) was the decisive factor to the corrosion resistance of passive film on sintered alloys.
For the pure aluminium, the grain boundaries usually act as atom diffusion pass and, thus, sustain the growth and repair of passive film, so that a thicker oxide film usually forms on fine-grained aluminium. However, in the aluminium alloys, the intermetallic phases usually dramatically affect the passive film growth and formation. Ryl et al. found that, in air at 50% relative humidity, the anodic phase would be firstly corroded under thin liquid film, and then the corrosion products covered on them and gradually formed a protective oxide film [
47]. While the cathodic phases acted as passive film nucleation site, since oxygen reduction usually carried out on them, and the oxide film preferentially initiated as well as thickened in the immediate vicinity of them and then propagated to near area. In this study, the intermetallic phases in coarse grain zone had bigger diameter and contained more alloying element, which would increase the electrochemical heterogeneity between them and their surrounding matrix. Therefore, the electrochemical reaction, such as oxygen reduction that occurred on second phases, would be promoted and accelerated on coarse grain zone, resulting in the formation of a thicker passive film [
10,
11,
25,
26,
27,
28]. However, coarse grain zone still exhibited worse corrosion resistance as compared to fine grain zone, since the oxide film that formed on them contained far more point defects, which always acted as charge carrier.
3.6. Atomic Force Microscope Measurement
The polished alloys were exposed in air for 30 days and then immersed in 3.5% NaCl solution for 1 h in order to investigate the breaking down of passive film. AFM was used to measure the morphologies of sintered alloys after immersion testing.
Figure 13 shows the relevant morphologies of coarse and fine grain zones after pitting initiation. The roughness of coarse grain zone was higher than that for fine grain zone. The particles above the metal substrate were intermetallic phases, which usually had a bigger hardness when compared to metal matrix. Obviously, the intermetallic phases in coarse grain zone exhibited a higher altitude and a bigger diameter than that in fine grain zone, which agreed with the SEM and TEM results. Besides, the pits initiated around intermetallic phases were also observed in AFM images and they showed a bigger diameter and a deeper depth on coarse grain zone. The higher electrochemical activity of intermetallic phases caused by bigger diameter and more alloying element would promote the film dissolution and accelerate the pits initiation as well as propagation. As mentioned in the above sections, the intermetallic phases were the initiation site of passive film in air, yet they were also the starting site of corrosion in aerated NaCl solution. Therefore, the big intermetallic phases in coarse grain zone promoted the film thickening in air, but also accelerated the corrosion nucleation and propagation in NaCl solution with the cooperation of Cl
− ions.
A bigger volt potential difference caused by bigger difference of chemical composition between intermetallic phases and surrounding matrix could obviously increase the electrochemical reaction rate [
10,
11]. The reaction is metal dissolution for anodic phases, and it is oxygen reduction for cathodic phases. The localized solution alkalization near the cathodic phases caused by oxygen (or water) reduction could strongly dissolve the surrounding passive film. Even though the coarse grain zone had a thicker passive film, the large and high active intermetallic phases on them increased the point defect in passive film and promoted the corrosion initiation and propagation, and, thus, they showed a worse corrosion resistance than fine grain zone. The passive performance of passive film and the corrosion resistance of sintered alloys both increased with the increasing content of small powders.
In conclusion, the coarse grain zone had bigger intermetallic phases containing higher alloying element, and showed wider alloying element depletion zone with more severe element depletion compared to fine grain zone. The microstructure and microchemistry led to a bigger electrochemical heterogeneity in coarse grain zone, which resulted in the formation of a thicker passive film containing more point defects. The corrosion resistance of alloys increased with increasing content of fine grains, indicating that the passive film resistance was mainly determined by point defect density rather than the film thickness.

 ,
, 


