Article

An Experimental Study on the Thermal Stability of Mg2Si/Ni Interface under Thermal Cycling

Energy Conversion Research Center, Korea Electrotechnology Research Institute, 12 Boolmosan-Ro 10 beon-gil, Changwon 51543, Korea
*
Author to whom correspondence should be addressed.
Materials 2020, 13(14), 3117; https://doi.org/10.3390/ma13143117
Submission received: 22 June 2020 / Revised: 8 July 2020 / Accepted: 10 July 2020 / Published: 13 July 2020
(This article belongs to the Section Energy Materials)

Abstract

:
Mg2Si is a promising eco-friendly thermoelectric material, and Ni is suited for electrical contact on it. In this study, Bi-doped Mg2Si ingots with Ni contacts were fabricated by co-sintering, and thermal stability was investigated by long-time (500 h, 500 cycles) temperature cycling from 25 °C to a peak temperature (Th = 400 and 450 °C) in N2. The as-sintered Ni/Mg2Si interfacial region is a multilayer consisting of Mg3Bi2, a series of MgxSiyNiz ternary compounds (ω, ν, ζ, and η-phases), and MgNi2. In the complex microstructure, the MgNi2 / η-phase interface was vulnerable to stress-induced voiding at Th = 450 °C, which arises from the mismatch of the thermal expansion coefficients. Interfacial voiding was avoided by adding 10 mol% Ag in Ni, which is probably due to the suppression of vacancy migration by the Ag-containing 2nd phase formation at the MgNi2/η-phase interface.

Graphical Abstract

1. Introduction

In recent years, the regulations on greenhouse gases are being strengthened continuously, and the recovery of waste heat is becoming increasingly important as a viable means of raising the energy efficiency of fossil fuels. Thermoelectric generation (TEG) is an energy conversion technique based entirely on solid-state devices utilizing the Seebeck effect, and has many attractive features such as silent operation, long-term reliability, compactness, and scalability. However, along with the potential advantages, thermoelectric technology also has a few drawbacks to be resolved, among which the cost as well as the non-toxicity of the materials are very important requirements. In this regard, Mg2Si is a very attractive material because it is inherently composed of non-toxic earth-abundant elements, which also guarantees a low material cost. Furthermore, thermoelectric performances are also excellent when making solid solutions with Mg2Sn, which has pushed up the dimensionless figure of merit ZT up to about 1.3 in Sb-doped Mg2Si0.3Sn0.7 by utilizing the band convergence and alloy-scattering effects [1,2,3]. Thus, Mg2Si-based materials are surely very promising for future thermoelectric applications.
Meanwhile, a robust electrical contact is another prerequisite for TEG module development. The ideal contact should conduct heat and electricity with low resistances, and the interface with the TE material should be highly stable during the operation lifetime of the module. To date, Ni has been studied most widely for contacts as well as intermediate diffusion barriers for Mg2Si due to the low electrical resistivity (69.3 nΩ·m at 20 °C), a high thermal conductivity (90.9 Wm−1K−1), and a comparable thermal expansion coefficient (TEC) of 13.4 × 10⁻⁶ at 25 °C with that of Mg2Si (13.1 × 10⁻⁶ at 25 °C [4]). Referring to previous studies, the Ni/Mg2Si combination was reported to have contact resistances lower than 10 μΩ·cm2 [5]. Long-time isothermal annealing tests, such as annealing at 450 °C for 600 h [6] or at 550 °C for 168 h [7], also demonstrated good thermal stability. However, isothermal annealing test is not enough to confirm the reliability, and temperature cycling (TC) is more appropriate to examine the robustness of the Ni/Mg2Si interface for real situations. To the authors’ knowledge, there has been no reports on the long-time TC test of the Ni/Mg2Si heterointerface, which is the motivation of this study.
In this study, Ni was co-sintered with Mg2Si to fabricate Ni/Mg2Si/Ni bulk samples, and the long-time stability of the Ni/Mg2Si interfaces was studied by TC. The main goal of the study was to identify the failure mechanism of a Mg2Si/Ni system under repetitive thermal stress, as well as to define the temperature regime for long-term safe operation. The interface compounds and evolution of the microstructure before- and after TC were investigated, and a solution to enhance the interface reliability was devised.

2. Materials and Methods

2.1. Materials and Mg2Si/Ni co-sintering

Highly pure powders of Mg (>99.99 wt.%), Si (>99.9999 wt.%), and Bi (>99.999 wt.%), were used to fabricate the Bi-doped Mg2Si samples. First, source powders of Mg and Si were mixed with approximate molar ratio of 2.08:1 so that the inevitable loss of volatile Mg during the synthesis is compensated. A total of 0.05 mol % Bi was also added for n-type doping, and then the mixed powders were cold-pressed, sealed in an Ar-filled quartz tube, and heated for 24 h at 700 °C for solid state reaction. The reacted material was then crushed manually and milled by using a planetary ball miller at 300 RPM (PM-100, Retsch, Inc., Haan, Germany). After ball milling, the powders were sieved to filter out large particles (diameter > 45 μm), and loaded into a graphite mold (diameter = 12.7 mm) where Ni powders (>99.9 wt.% purity, diameter <3.0 μm) were loaded first at the bottom. Ni powders were also carefully loaded on top of the Mg2Si powders to form a Ni/Mg2Si/Ni structure, and the co-sintering was implemented by applying 150 MPa pressure at 800 °C for 60 min using a hot press (HP) system. The sintered ingots had cylindrical shapes with the diameter and height of 12.7 mm and about 12 mm, respectively, and the thickness of the Ni layers on both sides of the Mg2Si was about 300 μm. In some experiments, mixed powders of Ni and Ag with a molar ratio of 9:1 were used for co-sintering to examine the effect of Ag addition on the interface morphology and thermomechanical stability, and the purity and the average particle size of the Ag powder were 99.9% and about 50 nm, respectively.

2.2. Temperature Cycling and Characterization

After sintering, the ingots were diced into smaller pieces for thermal tests. TC was implemented in a furnace equipped with a movable sample holder, which enables periodic movements of the samples into and out of the hot zone as programmed. A thermocouple attached to the holder measured the real-time temperature of the samples. After loading the samples, the furnace was evacuated to a base pressure of about 5 mTorr, and then filled with high purity N2 (>99.999%) to 1 atm. This procedure of evacuation and N2 purging was repeated several times to minimize the O2 partial pressure, and thermal tests were initiated under 1 atm N2 atmosphere with continuous replenishment of fresh N2 into the furnace. One cycle of the TC tests consisted of moving the samples into the hot zone of the furnace where the temperature was fixed at Th (400 and 450 °C), staying for 30 min, moving out of the hot zone, and natural cooling for 30 min in the unheated zone. This was repeated 500 times without stopping, which took about 500 h for the whole process.
After TC, the samples were grinded with SiC abrasives and polished with fine colloidal silica suspension (0.04 μm), after which the cross sections were investigated using a field emission scanning electron microscope (SEM) equipped with an energy dispersive X-ray spectroscopy (EDS) system (Tescan, MIRA II, Brno, Czechia). Multi-purpose thin-film X-ray diffractometer (XRD, Rigaku D/MAX-2500, Tokyo, Japan) was also utilized to identify the phases in the samples. The specific contact resistance (SCR) was measured by a potential Seebeck microprobe (PSM) equipment (Panco, Muelheim Kaerlich, Germany), where the electrical resistivity and the Seebeck coefficient (a measure of the magnitude of an induced voltage within a material versus a temperature difference applied across that material) of a material are simultaneously measured with a spatial resolution of tens of micrometers [8].

3. Results and Discussion

3.1. As-Sintered Mg2Si/Ni Interfaces

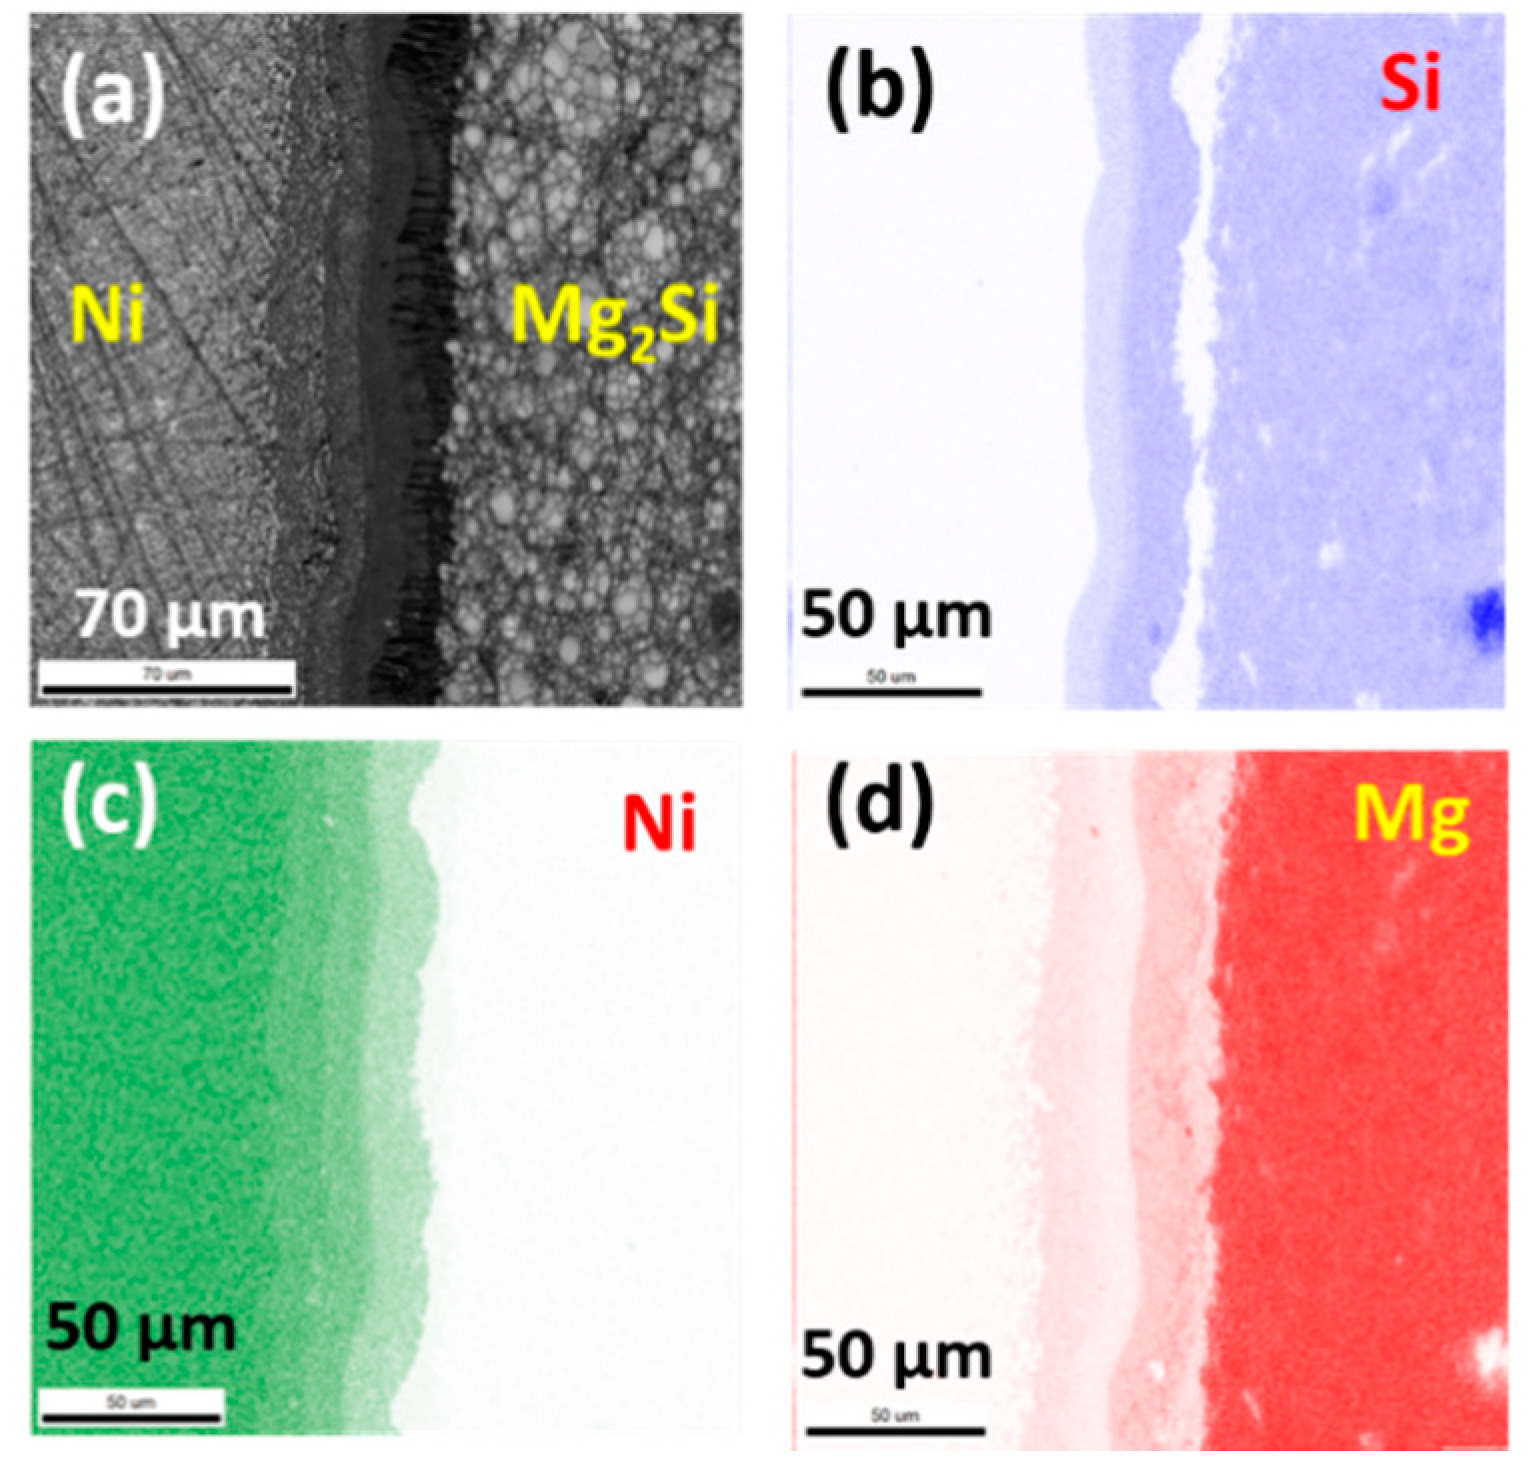
Figure 1 shows an optical microscope image of the cross section of an as-sintered sample, where the multiple reaction layers are clearly visible at the Ni/Mg2Si interface. The total thickness of the reaction layers was about 50 μm, and the multilayer was continuous across the whole interface. Cracks or voids were not observed at the interface of the as-sintered samples. EDS was employed to identify the multilayer, and Figure 2 shows the two-dimensional maps of the major elements; Si, Ni, and Mg, respectively, and an SEM image. The clear contrast in the maps indicates that each layer has distinctly different stoichiometry, and from Figure 2 we can also see that multiple layers of MgxSiyNiz ternary compounds exist at the interface.
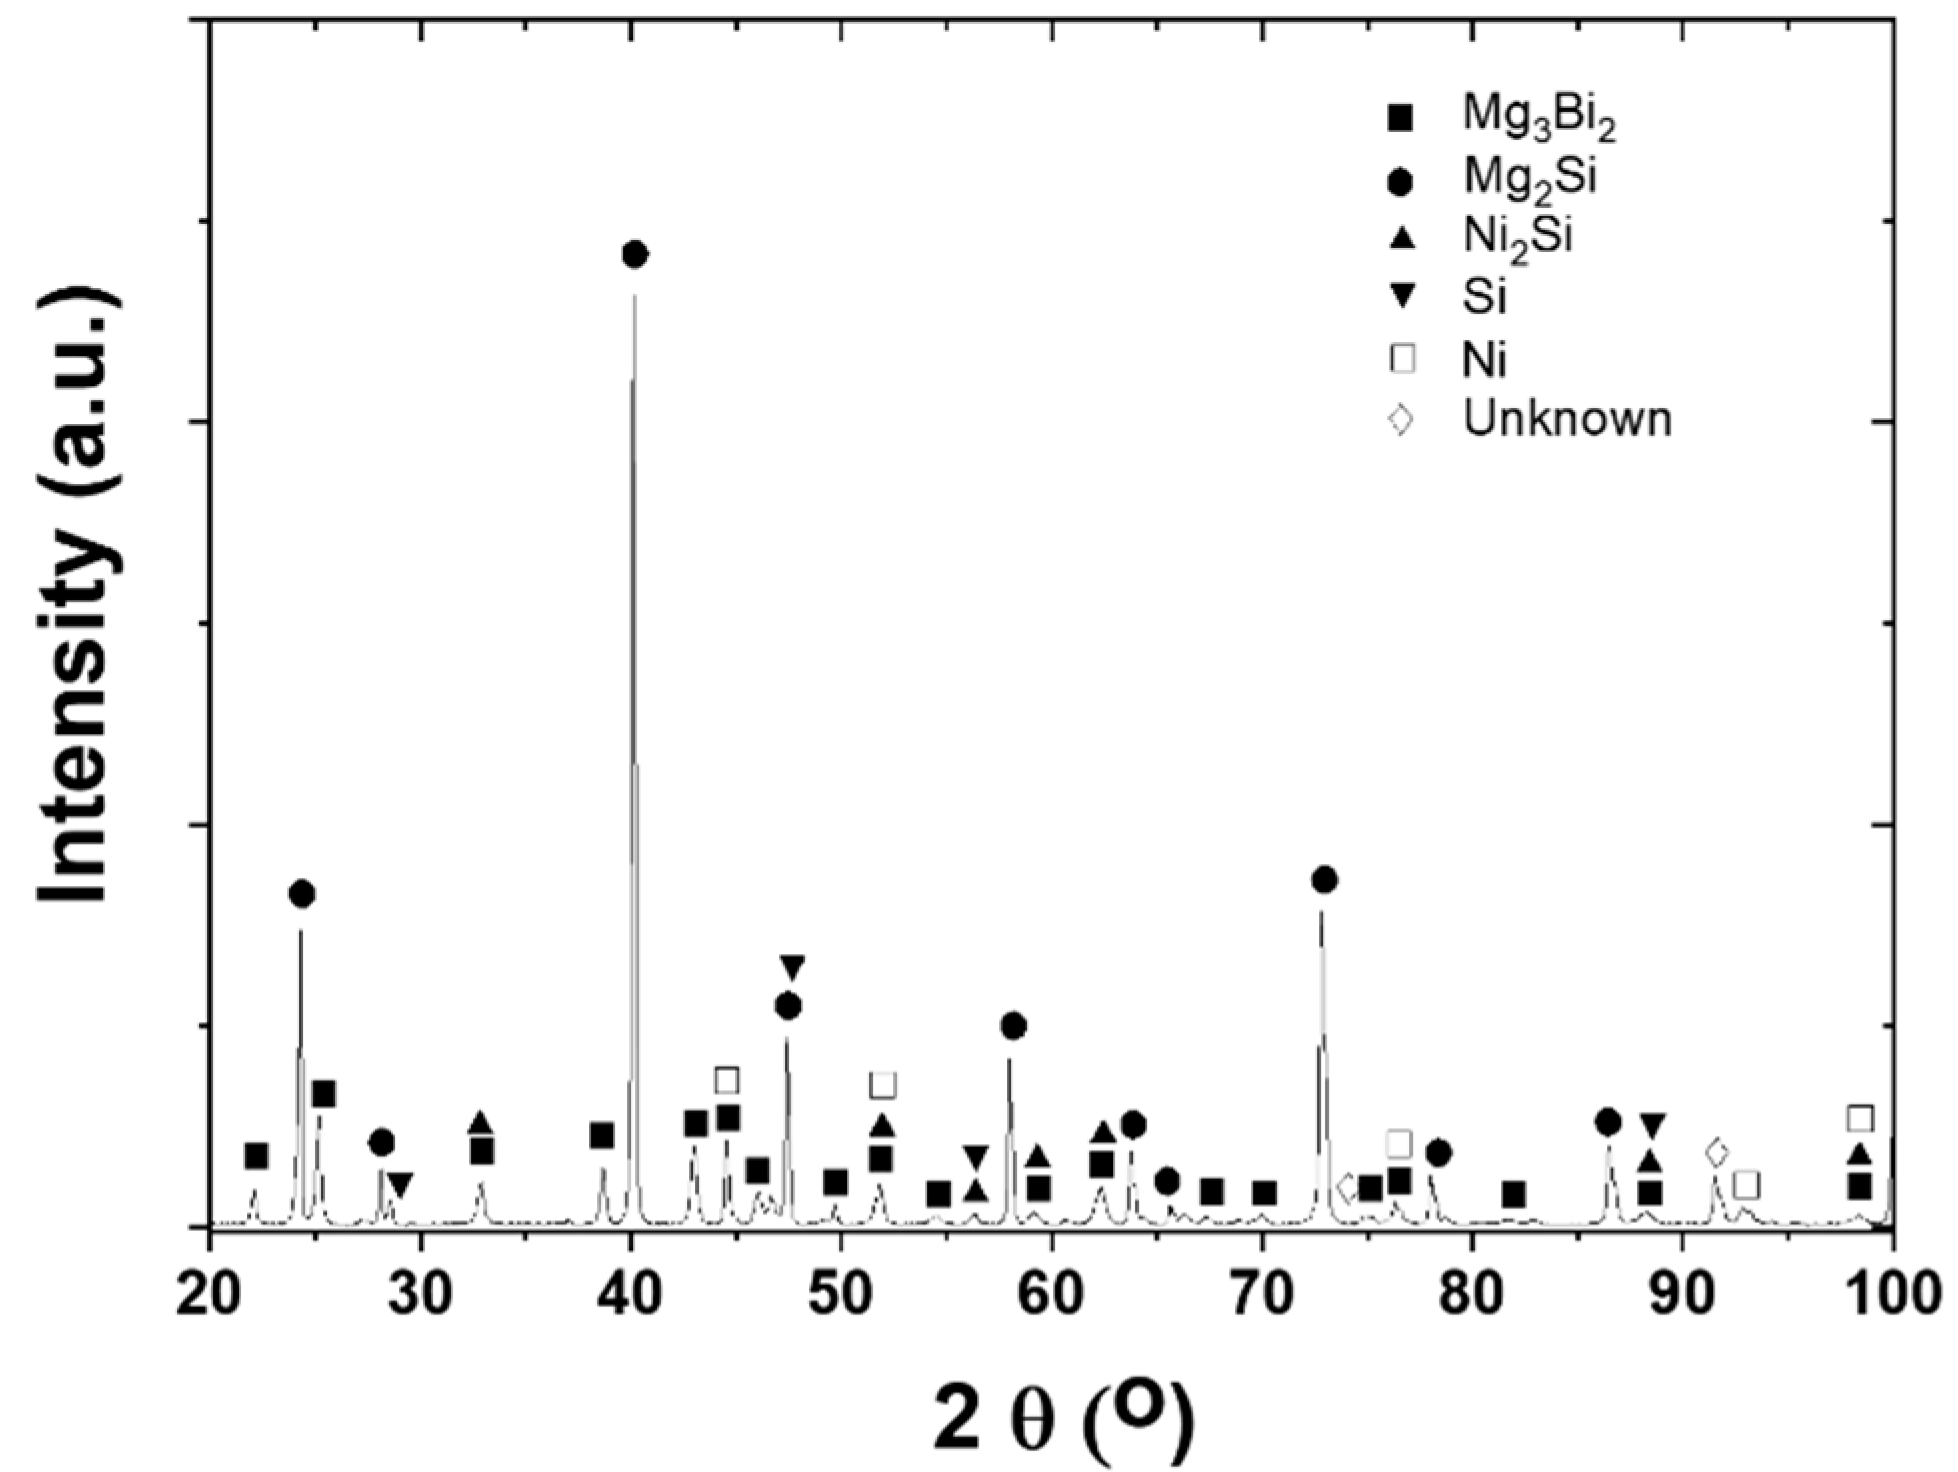
XRD was employed to identify the phases in the interfacial reaction layers, and Figure 3 shows the result. Naturally, the most prominent peaks coincide with those of Mg2Si, while many small peaks suggest the possible existence of Mg3Bi2, Ni2Si, and Si. A few peaks could not be clearly identified as marked in Figure 3, and the overlap of peak positions from different phases made it difficult to interpret the XRD patterns unambiguously. Unfortunately, any MgxSiyNiz ternary compounds were not identified from the XRD patterns according to the material database, which is inconsistent with the EDS result of Figure 2. Basically, the weak signal from the interfacial layers may not be easily observable in the XRD patterns, so more detailed analysis of the interfacial microstructure was implemented using SEM and EDS.
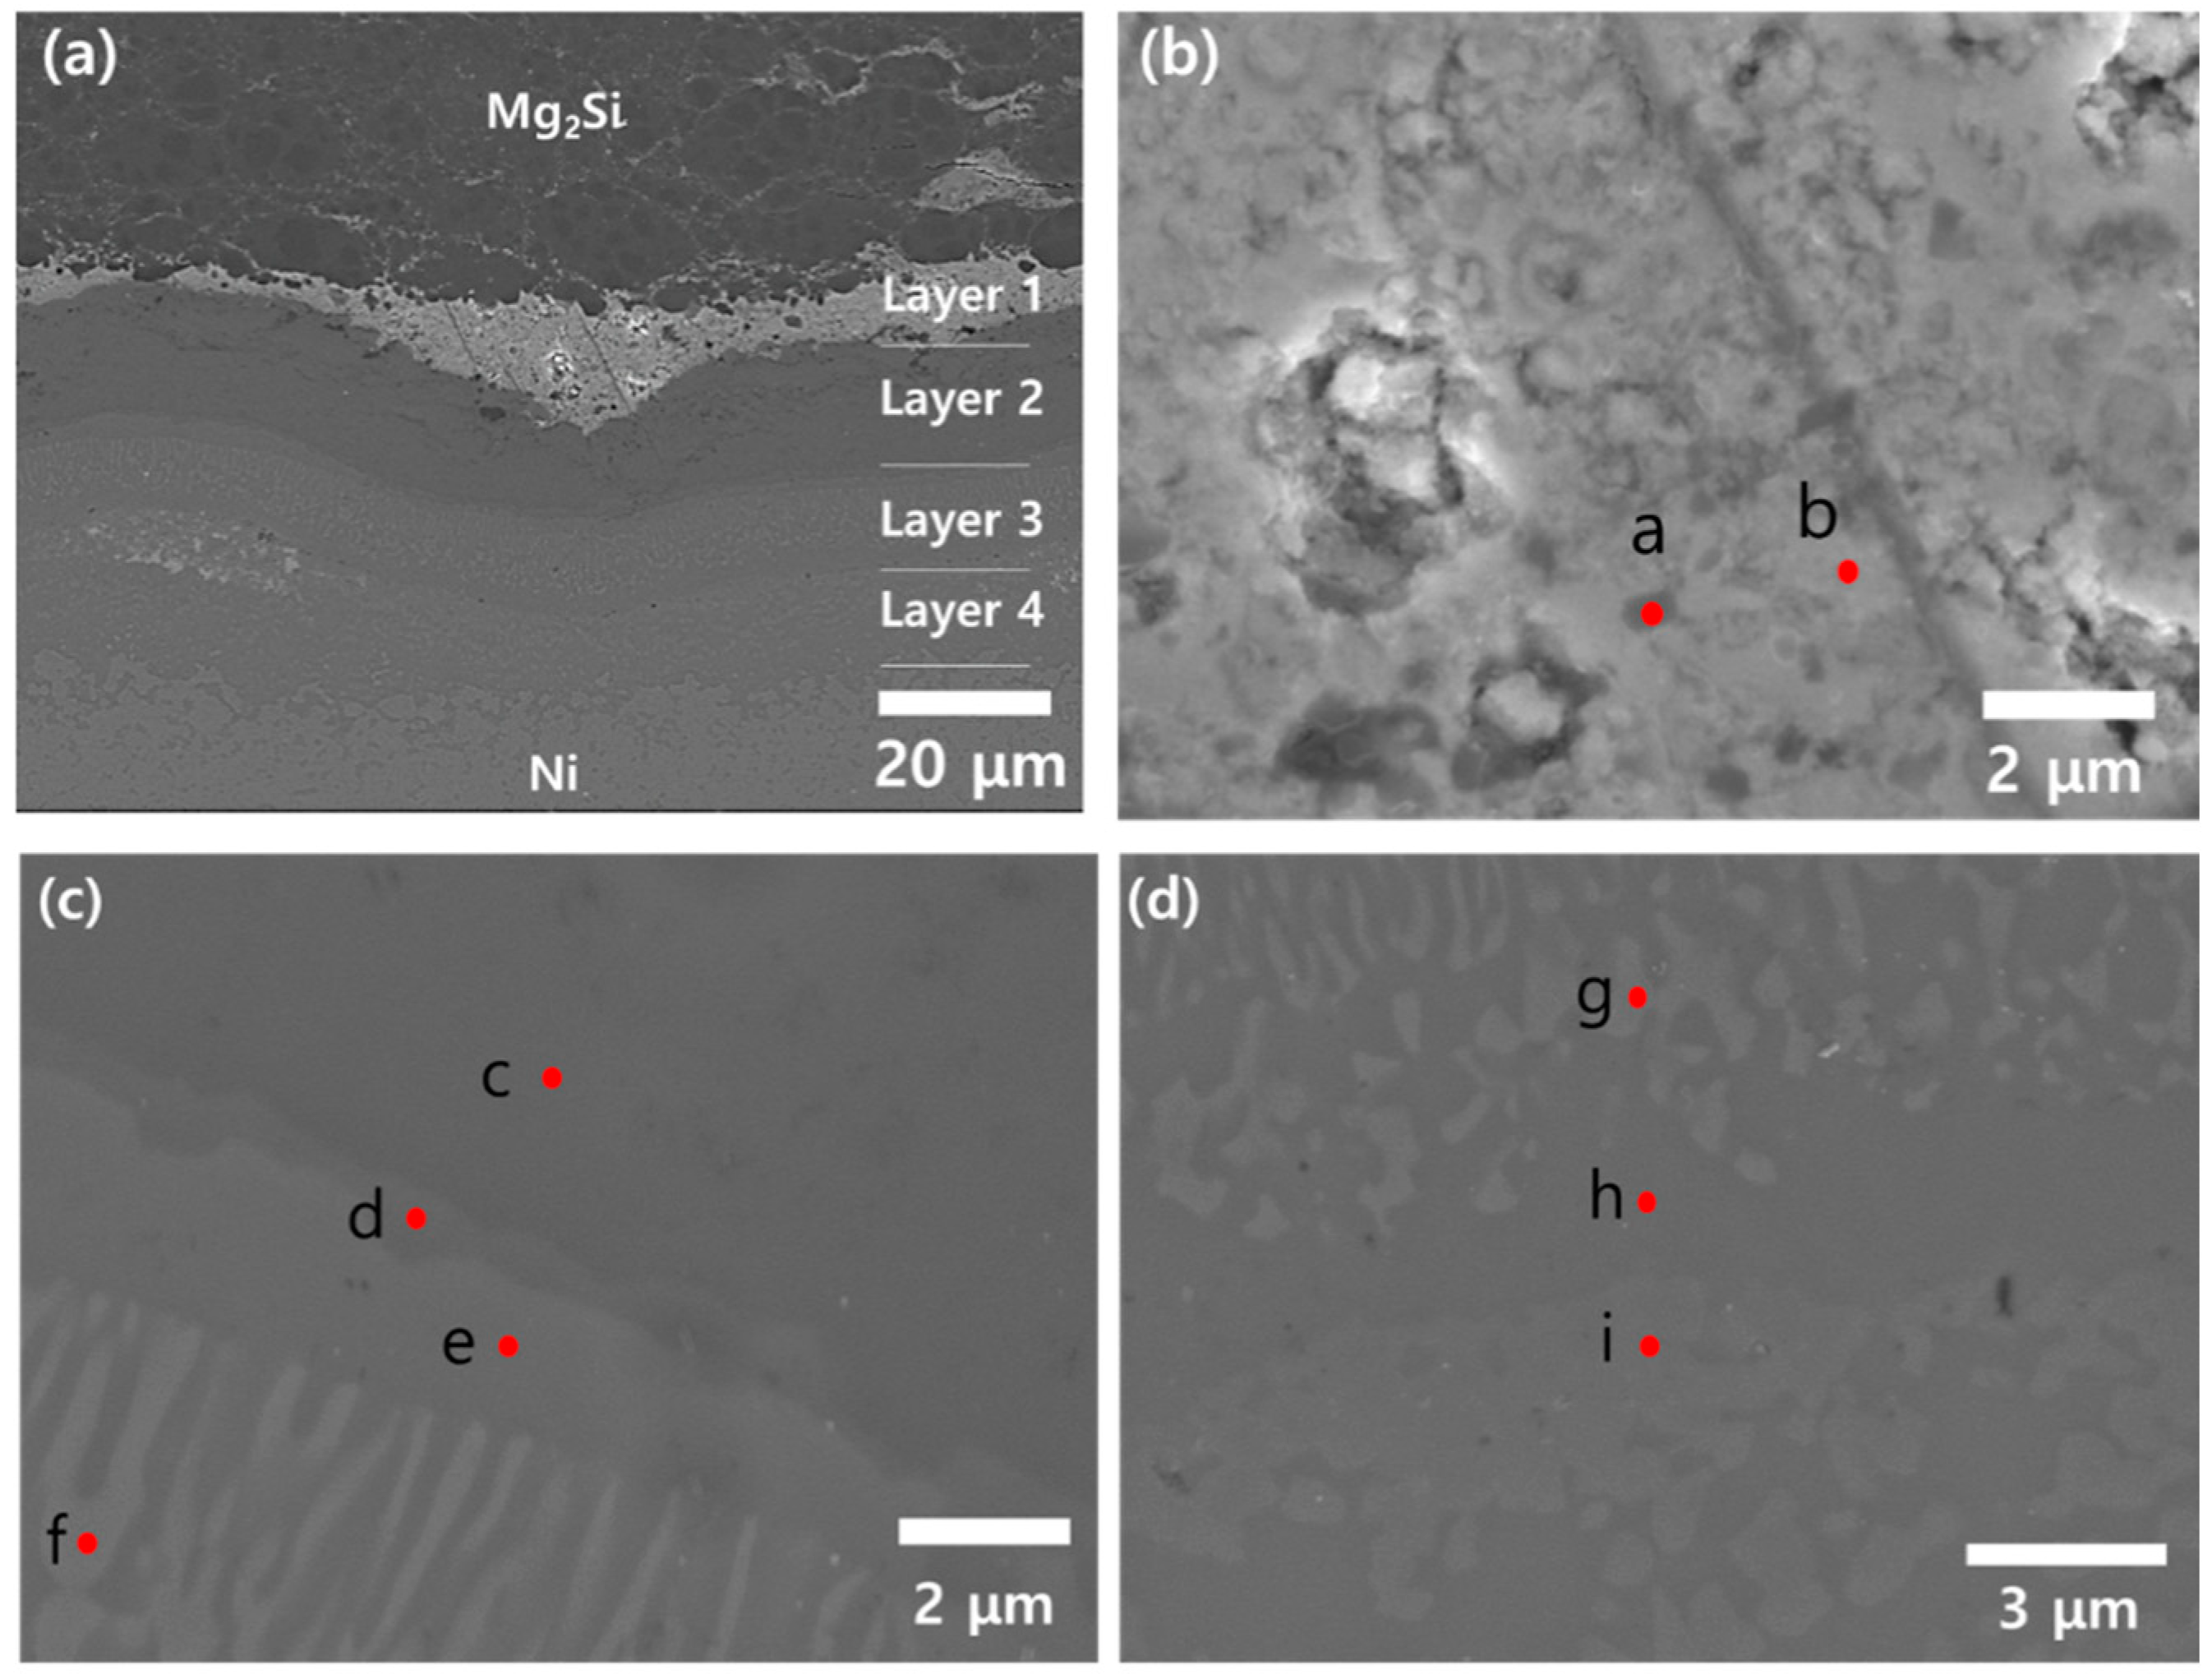
Figure 4a shows a typical SEM image of the interfacial region between the Bi-doped Mg2Si and Ni just after co-sintering, and four distinct layers are clearly visible, which were marked as Layer 1, 2, 3, and 4, respectively. First, Figure 4 b shows the magnified image of the Layer 1, and the quantitative EDS results on the points a and b are summarized in Table 1, which confirms that Mg, Bi, and O are the dominant elements in Layer 1. Referring to the XRD result of Figure 3, it is appropriate to conclude that Layer 1 is composed of Mg3Bi2 and oxide phases such as MgO and Bi2O3. It is noted that Bi was originally added as an n-type dopant, but a considerable amount of Bi was consumed for Mg3Bi2 formation at the interfacial region. According to a previous report, thermodynamic calculations and experimental data show that Mg3Bi2 formation is a thermodynamically favorable process with a large negative Gibbs free energy (about −28 kJ/mole) at the temperatures of 702 °C and 850 °C [9], which are close to the sintering temperature (800 °C) of this study.
Next, Figure 4c shows a magnified image of the interface between the Layer 2 and 3. The spot c belongs to the homogeneous Layer 2, and the major constituent is Mg, Si, and Ni, as shown in Table 1. Therefore, the Layer 2 is a MgxSiyNiz ternary layer. According to the previous studies there are many different MgxSiyNiz ternary phases [10,11,12], and clearly identifying a specific phase from a full list of ternary compounds is not straightforward. Nevertheless, the composition ratio at the point c suggests that the Layer 2 is the ω-phase, whose approximate composition and suggested stoichiometry are Mg33Si37Ni30 and (Mg0.52Ni0.48)7Si4, respectively [10]. Moving downward, the point d represents a thin layer adjacent to ω-phase, and the quantitative EDS analysis suggests that ν-phase (Mg11Si10Ni12) is highly probable. The points e and f belong to the Layer 3 and have slightly different contrast in the SEM image. However, EDS results suggest that both spots are ζ-phase (Mg3Si7Ni10).
Figure 4d shows the interfacial region of the Layer 3 and 4, and it is shown that isolated regions of Ni2Si (spot g) are surrounded by η-phase (spot h, Mg20Si24Ni56). Adjacent to the point h, the phase at the point i was confirmed to be MgNi2, and the Layer 4 was identified to be a mixed zone of MgNi2 and Ni, without any MgxSiyNiz ternary phase. Finally, the region below the Layer 4 in Figure 4a is Ni.
Summarizing the results, the as-sintered Ni/Bi-doped Mg2Si contacts were composed of intermediate reaction layers including Mg3Bi2, Ni2Si, MgxSiyNiz ternary compounds (ω, ν, ζ, η phases), and MgNi2. Basically, this feature was reproduced identically in every as-sintered sample. It is noted that four different MgxSiyNiz ternary phases were observed simultaneously. Referring to a previous study, Iida et al. reported that ω- and η-phases were observed at the Ni/(Al, Sb)-doped Mg2Si, but formation of the ν- and the ζ-phases was not noted [13].
Although interfacial reaction is inevitable and indispensable for bonding strength and conductivity, intermediate layers with complex structures may result in unexpected effects to degrade a structural reliability, which is demonstrated in the next section.

3.2. Mg2Si/Ni Interfaces after Temperature Cycling

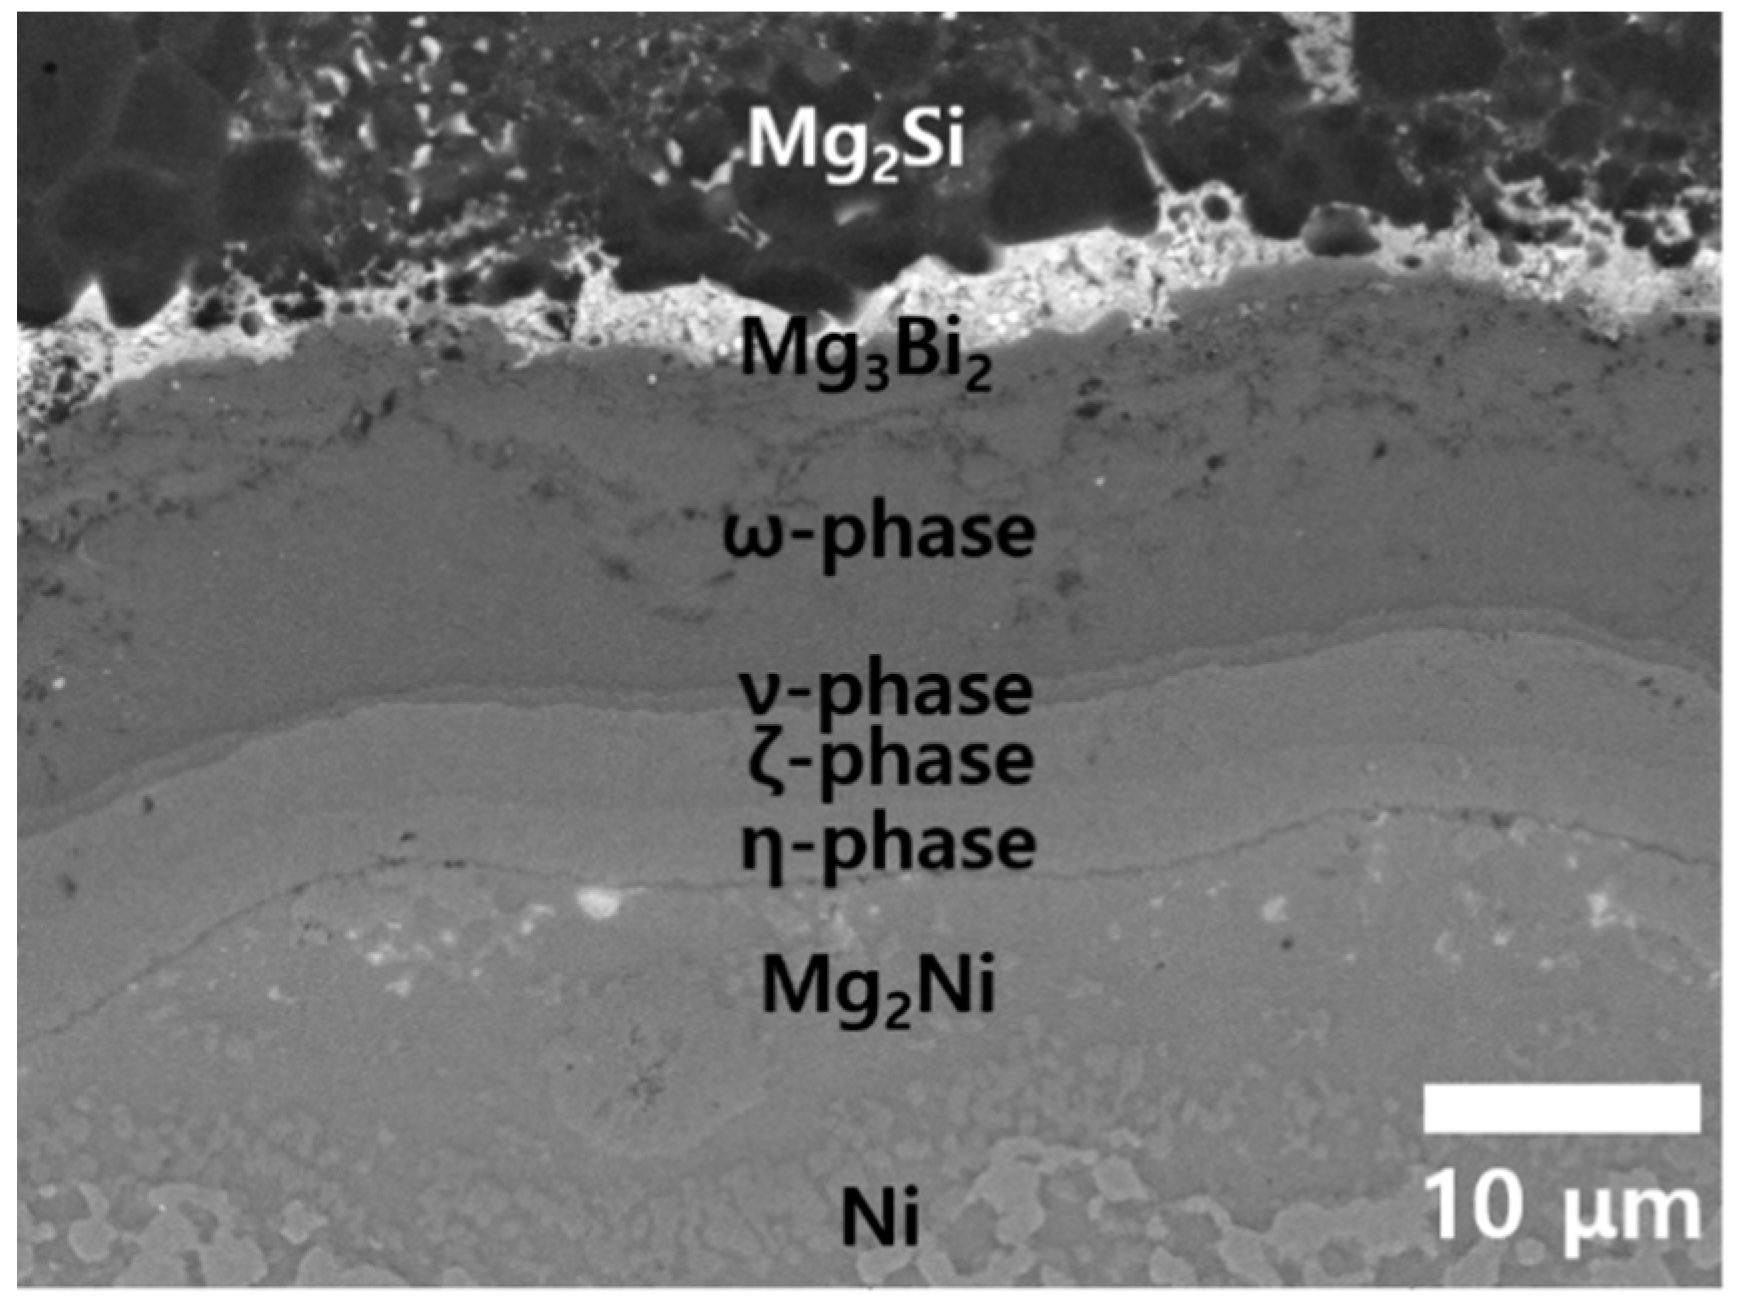
Figure 5 shows a cross-sectional SEM image of a Ni/Mg2Si sample after TC for 500 times from 25 to 400 °C. The basic features of the interfacial reaction layers from Mg3Bi2 to Mg2Ni, including a series of ternary phases ω, ν, ζ, and η, are the same after long-time TC, and the thickness of each layer also did not show noticeable change. Any structural imperfections, such as voids and cracks, are not observed at the interfaces, indicating that the Ni/Mg2Si interface has thermomechanical stability against TC with Th ≤ 400 °C.
However, when Th was raised to 450 °C during the TC, a different result was obtained, as shown in Figure 6. Many voids were produced along the η-phase/MgNi2 interface, and this means that Ni/Mg2Si interface is not structurally reliable when exposed repeatedly to temperatures above 450 °C over a long time, mainly due to the weakness of the η-phase/MgNi2 interface. The void formation shown in Figure 6 is regarded to be a typical case of stress-induced voiding (SIV), and the driving force arises from the thermal stress σt due to the difference of the TECs
σt = E × (α1 – α2) × ΔT
where E, α, ΔT is the elastic modulus, TEC, and temperature difference, respectively. It is well known that the thermal stress activates vacancy diffusion at the heterointerface, and SIV has been a critical problem in the multi-level metallization process for semiconductor microchip fabrication [14,15,16,17]. The SIV is expected to be more severe in mid-temperature Mg2Si thermoelectric modules because the operation temperature as well as the temperature swing are much higher. Nonetheless, we suppose that this is the first relevant report to the best of the authors’ knowledge. For now, the critical σt above which SIV begins cannot be estimated because the E and α of MgNi2 and the η-phase are unknown, which requires further study.
Meanwhile, a solution to mitigate the SIV at Ni/Mg2Si system was devised. Figure 7 shows the cross-section of a sample containing 10 mol% Ag in Ni, which has undergone 500 times TC of Th = 450 °C. The reason that Ag was mixed with Ni was based on the initial guess that Ag can form the 2nd phase within the Ni matrix without forming intermetallic compounds with Ni, which would possibly retard the vacancy diffusion. Indeed, Figure 7 confirms that the 2nd phase agglomerates containing Ag, Mg, and O have formed along the η-phase/MgNi2 interface, and the SIV was not observed. Meanwhile, the dark region in the middle of {Mg2Si + ω-phase} layer is not a crack, but a mixed zone of MgO and the ω-phase, as marked in Figure 7a. Although more thorough study based on experimental data is required to draw a definite conclusion, we think that suppressing SIV by 2nd phase inclusions would be a plausible idea to enhance the structural reliability of a Ni/Mg2Si heterointerface.

3.3. PSM Analysis of Mg2Si/Ni Interfaces

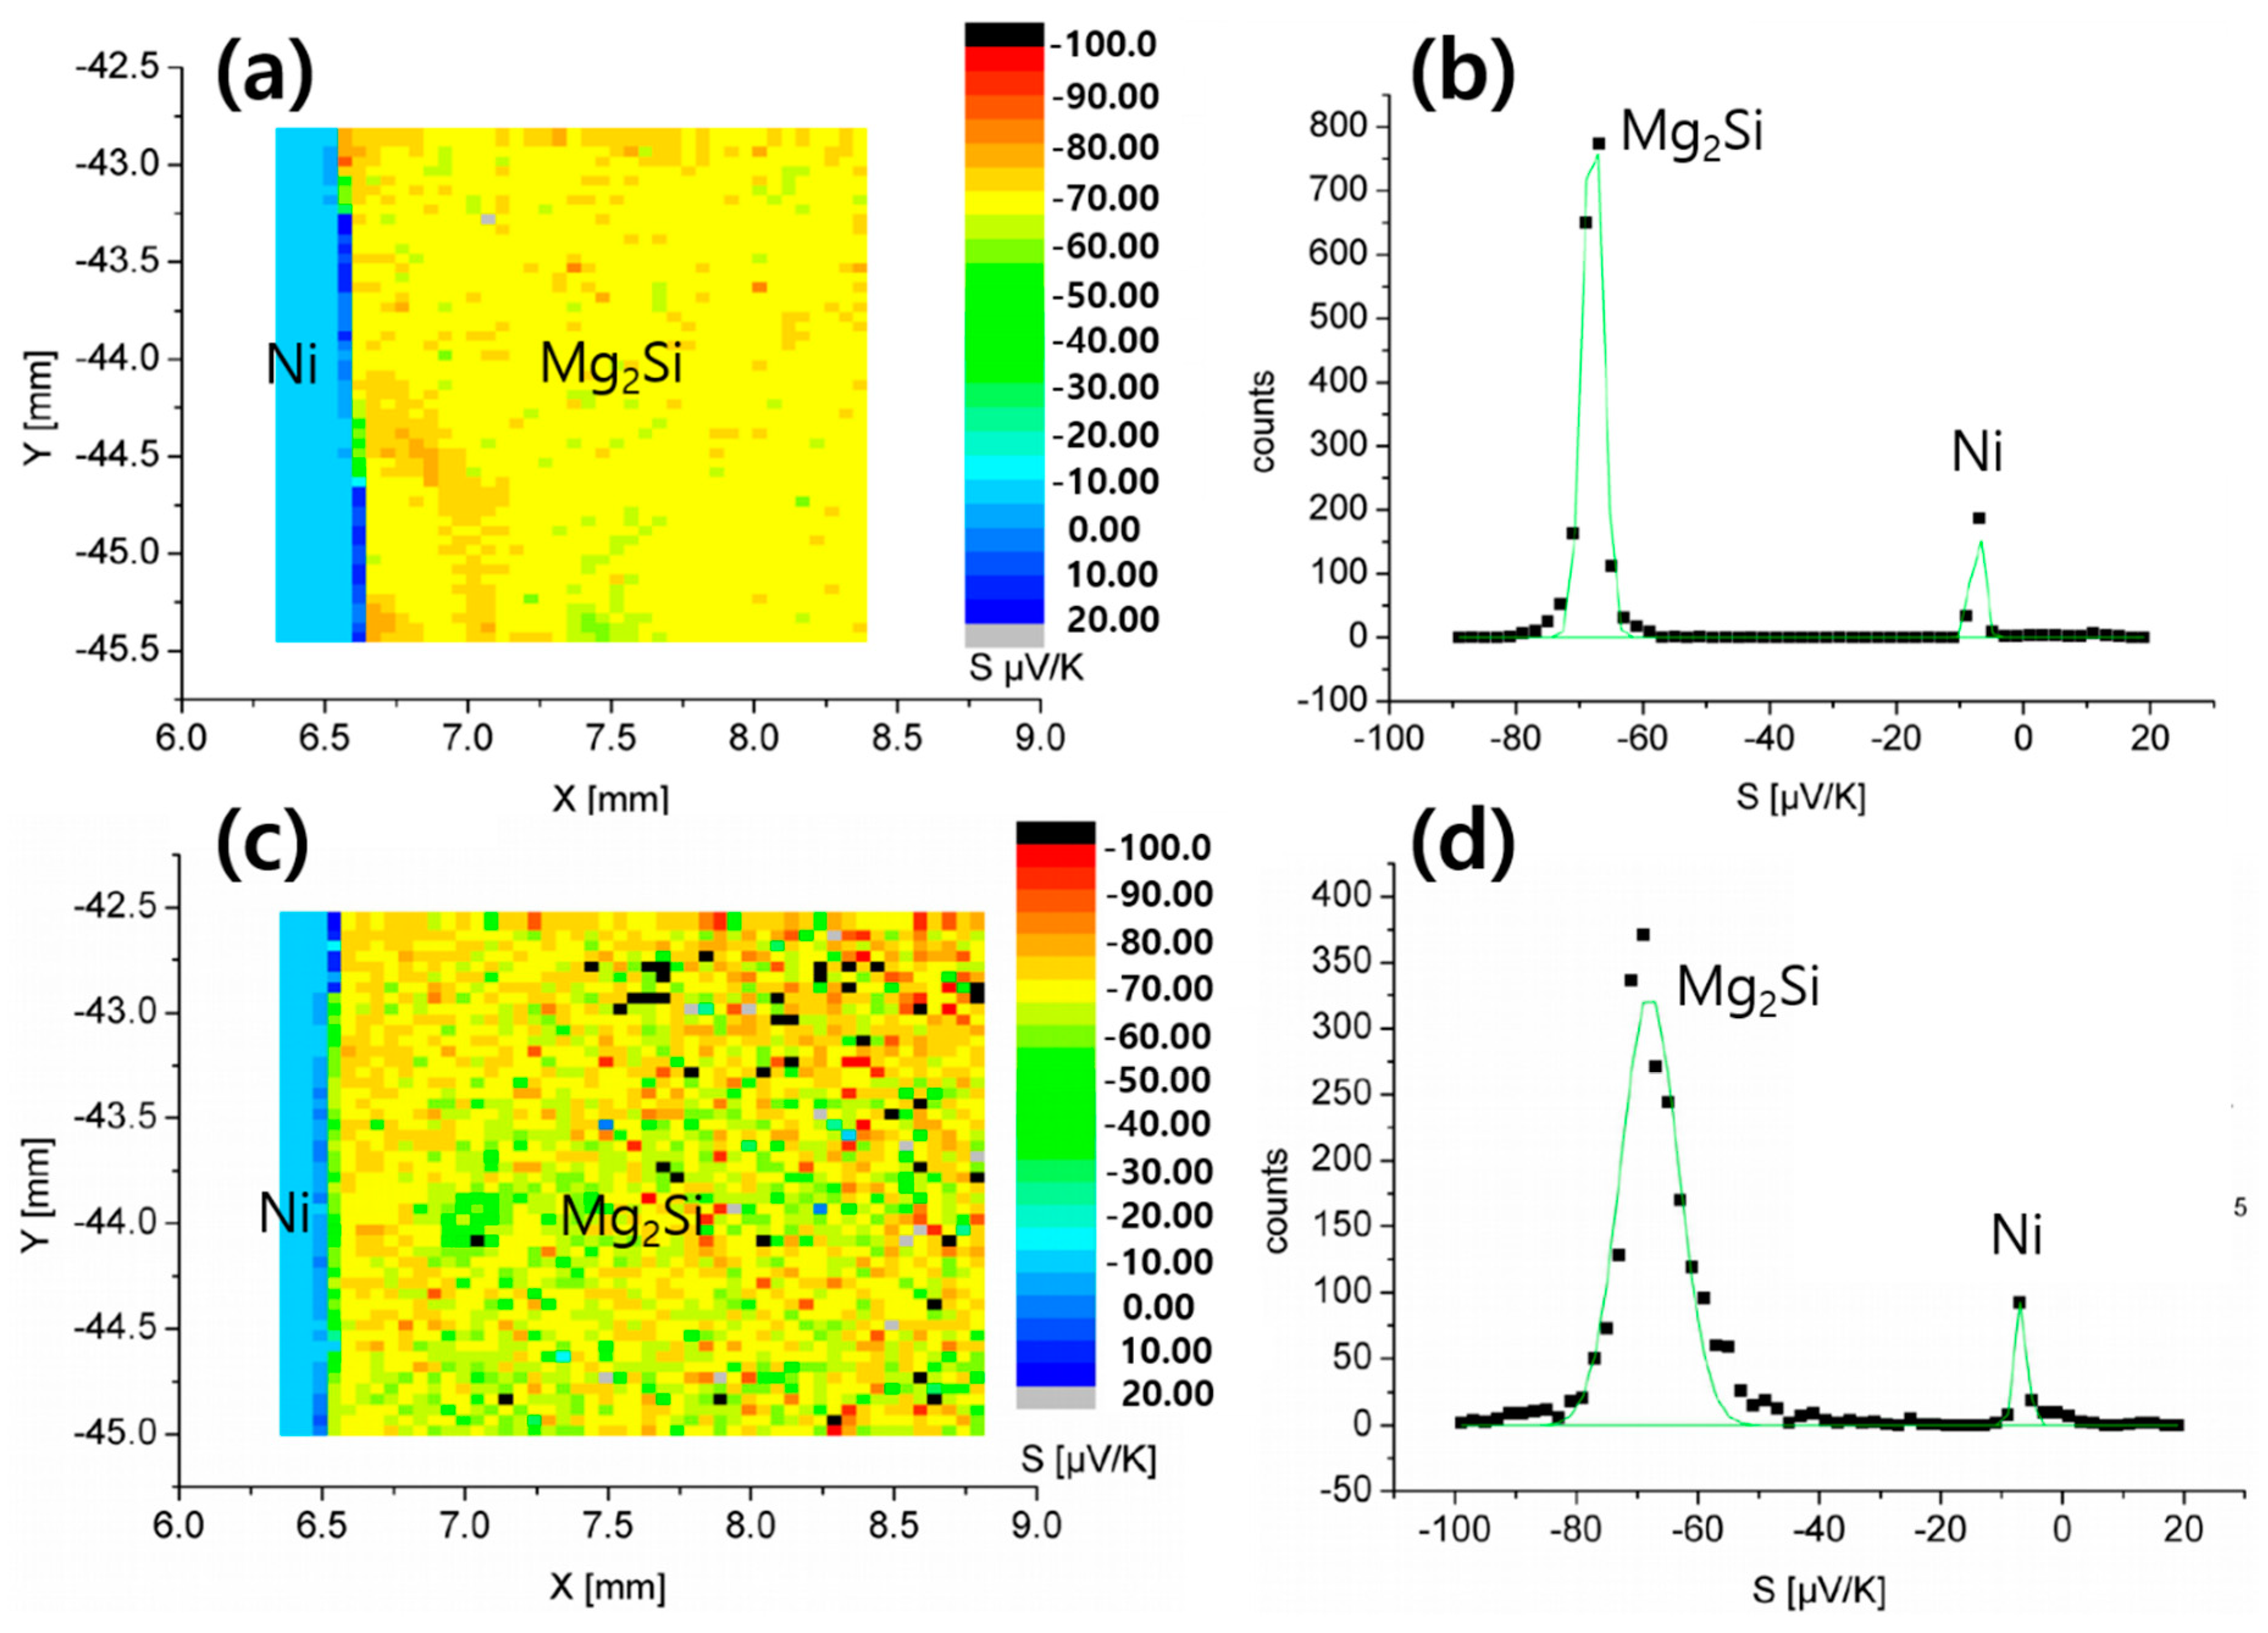
Figure 8 shows the 2-dimensional maps of Seebeck coefficients S and corresponding S-value distribution profiles near the Ni/Mg2Si interfaces before and after 500-times TC (Th = 400 °C), which were obtained by PSM analysis. The distribution profiles shown in Figure 8b,d have two peaks originating from Mg2Si and Ni, respectively, among which that of Ni is naturally close to zero. The average S of Mg2Si changed little after TC, from−67.88 to−67.98 μV/K, but the peak became broader as confirmed from the increase in the full width at half maximum (FWHM) from 3.09 to 9.43 μV/K. The change in local composition by Mg outdiffusion as well as oxidation at the interface region may have contributed to the FWHM increase.
The SCR was also measured by PSM, and Table 2 summarizes the results. Contrary to Seebeck coefficient, the mean value of SCR decreased by about 73% after TC, and the standard deviation was also reduced. The reason why the SCR has decreased considerably after TC remains to be discovered, and, for now, we suppose that many interfacial mid-gap states impeding electron conduction would have been annealed out during the heat process. The mean value of the SCR was about 11.4 μΩ⋅cm2 after 500 times TC with Th = 400 °C, which is comparable with the previous result of SCR < 10 μΩ⋅cm2 obtained by de Boor et al. [5,7]. Therefore, a Ni contact on Mg2Si shows a superior performance in terms of contact resistance even after TC.

4. Conclusions

In this study, Ni contacts on Mg2Si were formed by co-sintering, and the interfacial microstructure and the thermal stability of the Ni/Mg2Si heterointerfaces were investigated. The interfacial region of the as-sintered Ni/Mg2Si samples was composed of reaction multilayers including Mg3Bi2, Ni2Si, MgxSiyNiz ternary compounds (ω, ν, ζ, and η phases), and MgNi2. Long-term TC was applied to samples to investigate the thermomechanical reliability, and the Ni/Mg2Si heterointerface was confirmed to be robust below 400 °C without any structural imperfections. However, above the peak temperature of 450 °C, SIV was initiated at the η-phase/MgNi2 interface, which was found to be the weakest part in the Ni/Mg2Si contacts. Accordingly, a smart solution to mitigate the TEC difference at the η-phase/MgNi2 interface would be required for operation at higher temperatures. By adding 10 mol% Ag in Ni before co-sintering, the SIV was suppressed at 450 °C. The SCR of the Ni/Mg2Si heterointerface was about 11.4 μΩ⋅cm2 after 500 times TC with Th = 400 °C, which is low enough for practical application.

Author Contributions

S.-J.J. designed the experiments, performed the data analysis, prepared and revised the manuscript. J.E.L., B.-S.K., and B.-K.M. interpreted the data, provided additional insights, and revised manuscript together. All authors have read and agreed to the published version of the manuscript.

Funding

This research was supported by Korea Electrotechnology Research Institute (KERI) Primary research program through the National Research Council of Science & Technology (NST) funded by the Ministry of Science and ICT (MSIT) (No. 20A01028).

Acknowledgments

All authors thank Suji Park for her help in the sample preparation and data analysis.

Conflicts of Interest

All authors declare no conflict of interest.

References

  1. Zaitsev, V.K.; Fedorov, M.I.; Gurieva, E.A.; Eremin, I.S.; Konstantinov, P.P.; Samunin, A.Y.; Vedernikov, M.V. Highly effective Mg2Si1−xSnx thermoelectrics. Phys. Rev. B 2006, 74, 045207. [Google Scholar] [CrossRef]
  2. Liu, W.; Tan, X.; Yin, K.; Liu, H.; Tang, X.; Shi, J.; Zhang, Q.; Uher, C. Convergence of conduction bands as a means of enhancing thermoelectric performance of n-type Mg2Si(1−x)Snx solid solutions. Phys. Rev. Lett. 2012, 108, 166601. [Google Scholar] [CrossRef] [PubMed] [Green Version]
  3. Liu, X.; Zhu, T.; Wang, H.; Hu, L.; Xie, H.; Jiang, G.; Snyder, G.J.; Zhao, X. Low electron scattering potentials in high performance Mg2Si0.45Sn0.55 based thermoelectric solid solutions with band convergence. Adv. Energy Mater. 2013, 3, 1238–1244. [Google Scholar] [CrossRef]
  4. Imai, M.; Isoda, Y.; Udono, H. Thermal expansion of semiconducting silicides β-FeSi2 and Mg2Si. Intermetallics 2015, 67, 75–80. [Google Scholar] [CrossRef]
  5. de Boor, J.; Gloanec, C.; Kolb, H.; Sottong, R.; Ziolkowski, P.; Müller, E. Fabrication and characterization of nickel contacts for magnesium silicide based thermoelectric generators. J. Alloys Compd. 2015, 632, 348–353. [Google Scholar] [CrossRef] [Green Version]
  6. Yang, R.; Chen, S.; Fan, W.; Gao, X.; Long, Y.; Wang, W.; Munir, Z.A. Interfacial properties of Cu/Ni/Mg2Si joints prepared in one step by the spark plasma sintering method. J. Alloys Compd. 2017, 704, 545–551. [Google Scholar] [CrossRef] [Green Version]
  7. de Boor, J.; Droste, D.; Schneider, C.; Janek, J.; Müller, E. Thermal stability of magnesium silicide/nickel contacts. J. Electron. Mater. 2016, 45, 5313–5320. [Google Scholar] [CrossRef]
  8. Platzek, D.; Karpinski, G.; Stiewe, C.; Ziolkowski, Z.; Drasar, C.; Müller, E. Potential-Seebeck-Microprobe: Measuring the spatial resolution of the Seebeck coefficient and the electric potential. In Proceedings of the 24th International Conference on Thermoelectrics, Clemson, SC, USA, 19–23 June 2005; pp. 13–16. [Google Scholar]
  9. Oh, C.S.; Kang, S.Y.; Lee, D.N. Assessment of the Mg-Bi system. Calphad 1992, 16, 181–191. [Google Scholar]
  10. Song, Y.K.; Varin, R.A. Phase equilibria and intermetallic phases in the Ni-Si-Mg ternary system. Metall. Mater. Trans. A 2001, 32, 5–18. [Google Scholar] [CrossRef]
  11. Song, Y.K.; Varin, R.A. New intermetallic phases in the Ni-Si-Mg ternary system. Intermetallics 1998, 6, 43–59. [Google Scholar] [CrossRef]
  12. Barri, N.; Salasel, A.R.; Abbasi, A.; Mirzadeh, H.; Emamy, M.; Malekan, M. A new intermetallic phase formation in Mg-Si-Ni magnesium-based in-situ formed alloys. Vacuum 2019, 164, 349–354. [Google Scholar] [CrossRef]
  13. Iida, T.; Kogo, Y.; Yasumori, A.; Nishio, K.; Hirayama, N. Silicide Modules—Practical Issues in Developing Mg2Si with Good Stability for Generating Power from Waste Heat Sources. In Advanced Thermoelectrics—Materials, Contacts, Devices, and Systems; CRC Press: Boca Raton, FL, USA, 2018; pp. 697–717. [Google Scholar]
  14. Domae, S.; Eto, R.; Okuma, K. Stress-induced voiding in stacked tungsten via structure. Microelectron. Reliab. 1999, 39, 507–513. [Google Scholar] [CrossRef]
  15. Dalleau, D.; Weide-Zaage, K.; Danto, Y. Simulation of time depending void formation in copper, aluminum and tungsten plugged via structures. Microelectron. Reliab. 2003, 43, 1821–1826. [Google Scholar] [CrossRef]
  16. Nguyen, H.V.; Salm, C.; Krabbenborg, B.H.; Bisschop, J.; Ton Mouthaan, A.J.; Kuper, F.G. Fast thermal cycling-enhanced electromigration in power metallization. IEEE Trans. Device Mater. Reliab. 2004, 4, 246–255. [Google Scholar] [CrossRef]
  17. Tio Castro, D.; Hoofman, R.J.O.M.; Michelon, J.; Gravesteijn, D.J.; Bruynseraede, C. Void growth modeling upon electromigration stressing in narrow copper lines. J. Appl. Phys. 2007, 102, 123515. [Google Scholar] [CrossRef]
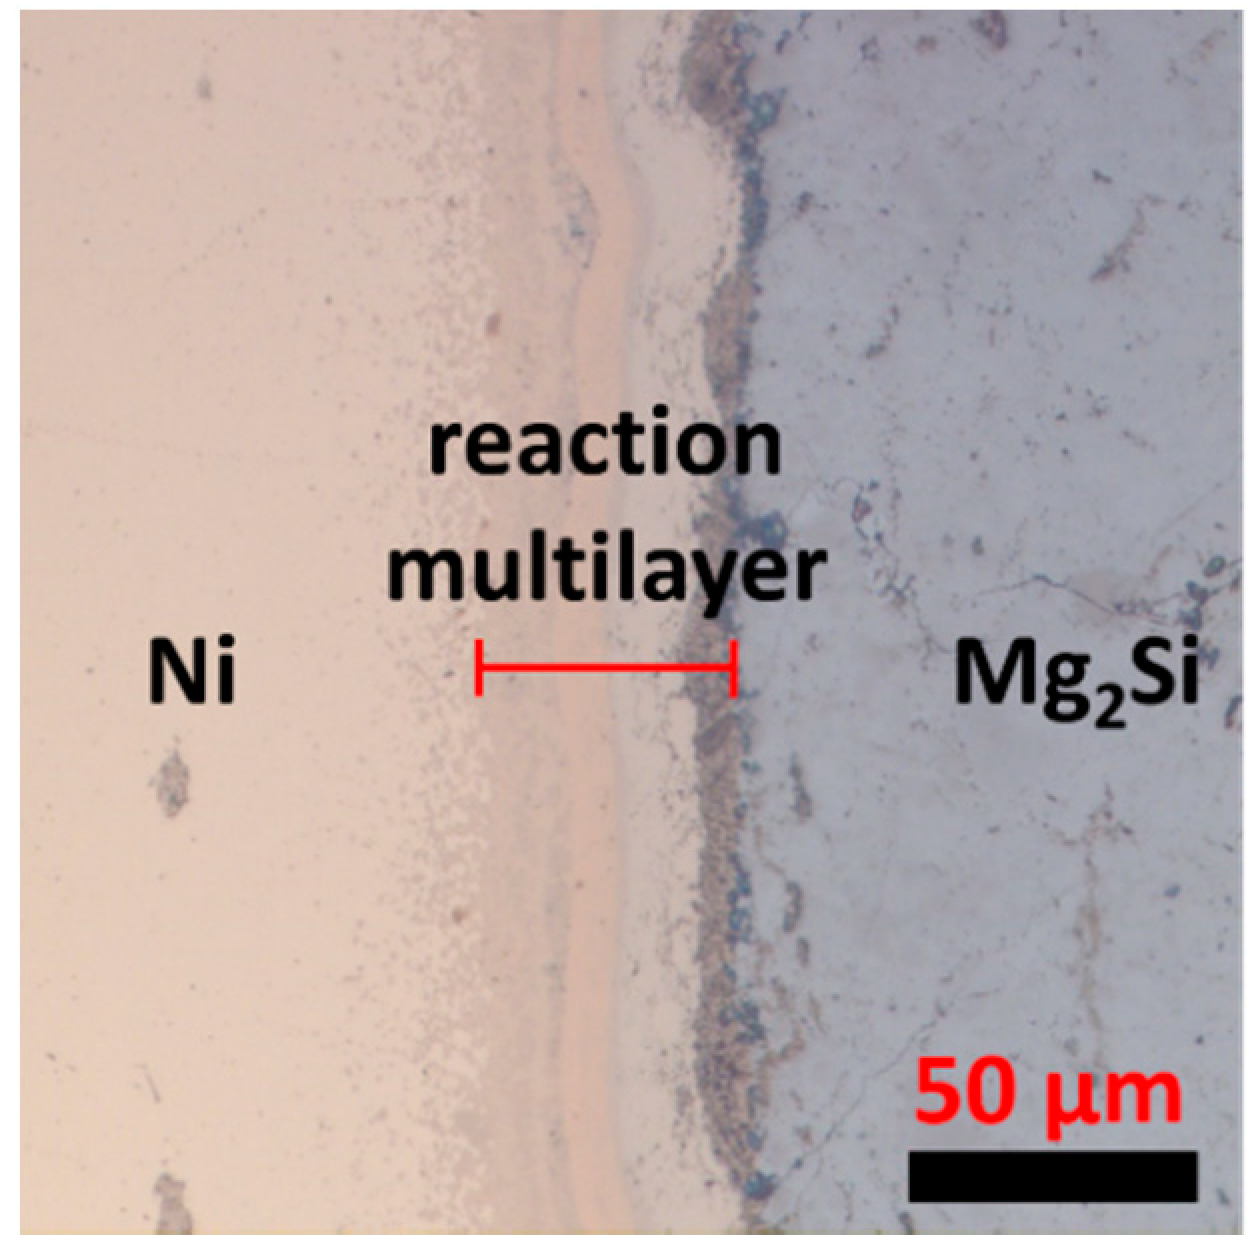
Figure 1. A cross-sectional optical microscope image of the Ni/Mg2Si interfacial region of an as-sintered sample.
Materials 13 03117 g001
Figure 2. (a) A cross-sectional SEM image of an as-sintered sample, and the corresponding 2-dimensional element maps of (b) Si, (c) Ni, and (d) Mg, respectively.
Materials 13 03117 g002
Figure 3. XRD patterns from an as-sintered Ni/Mg2Si sample.
Materials 13 03117 g003
Figure 4. (a) A cross-sectional SEM image of an as-sintered sample showing 4 distinct layers, and magnified images of (b) the Layer 1, (c) the interface between the Layer 2 and 3, and (d) the interface between the Layer 3 and 4, respectively.
Materials 13 03117 g004
Figure 5. A cross-sectional SEM image after TC from 25 °C to the peak temperature Th = 400 °C for 500 times.
Materials 13 03117 g005
Figure 6. A cross-sectional SEM image after TC from 25 °C to the peak temperature Th = 450 °C for 500 times, showing many voids at the η-phase/MgNi2 interface.
Materials 13 03117 g006
Figure 7. (a) A cross-sectional SEM image of a sample containing 10 mol% Ag in Ni, showing Ag-containing agglomerates at the η-phase/MgNi2 interface. A 500 times TC from 25 to 450 °C was applied to the sample. The EDS results of (b), (c), and (d) show the distribution of elements; O, Mg, Ag, in the same area, respectively.
Materials 13 03117 g007
Figure 8. 2-dimensional maps of the Seebeck coefficient S and the corresponding S-value distribution profiles. (a) and (b): an as-sintered sample, (c) and (d) a TC-applied sample at Th = 400 °C, 500 cycles.
Materials 13 03117 g008
Table 1. Quantitative EDS results on the spots in Figure 4.
SpotMg (at.%)Si (at.%)Ni (at.%)Bi (at.%)O (at.%)C (at.%)Candidate Phase
a41.12-1.8116.5733.267.24Mg3Bi2 + oxides
b30.95-2.2118.6336.0612.15Mg3Bi2 + oxides
c20.7522.6718.04-3.2735.26(Mg0.52Ni0.48)7Si4 (ω-phase)
d17.2121.3226.40-3.0831.99Mg11Si10Ni12(ν-phase)
e12.8422.5730.41-3.7130.47Mg3Si7Ni10 (ζ-phase)
f9.9718.2336.93-2.9831.89
g2.5620.2839.46-2.9734.74Ni2Si
h14.2015.9335.49-2.6631.72Mg20Si24Ni56(η-phase)
i16.85-45.20-2.8935.07MgNi2, Ni
Table 2. SCRs of the sample before- and after TC measured by PSM method.
As-Sintered SampleTemperature Cycled Sample
(Th = 400 °C, 500 Cycles)
43.4 ± 24.5 μΩ·cm211.4 ± 5.0 μΩ·cm2