Abstract
This paper analyzes the dynamic magneto-mechanical response in magnetization-graded ferromagnetic materials (MGFM) comprised of high-permeability Finemet and traditional magnetostrictive materials. The theoretical modeling of the piezomagnetic coefficient that depends on the bias magnetic field of MGFM is proposed by using the nonlinear constitutive model of a piezomagnetic material, the magnetoelectric equivalent circuit method, and the simulation software Ansoft. The theoretical variation of piezomagnetic coefficients of MGFM on the bias magnetic field is in good agreement with the experiment. Using the piezomagnetic coefficient in the magnetoelectric voltage model, the theoretical longitudinal resonant magnetoelectric voltage coefficients have also been calculated, which are consistent with the experimental values. This theoretical analysis is beneficial to comprehensively understand the self-biased piezomagnetic response of MGFM, and to design magnetoelectric devices with MGFM.
1. Introduction
Magnetoelectric (ME) laminate composites comprising of piezomagnetic and piezoelectric phases have been extensively investigated in recent years for use in potential smart devices due to their low cost, lightweight, and flexible features [1,2,3]. The principal of ME response can be determined from the product properties of the piezomagnetic and piezoelectric phases. The ME coefficient is expressed as
where kc is a coupling factor (0 ≤ kc ≤ 1) between the two phases, dm is the piezomagnetic coefficient, and dp is the piezoelectric coefficient. The dm and dp are decided by the choice of piezomagnetic materials (Terfenol-D, Metglas, Gafenol, etc.) and piezoelectric materials (Pb(Zr1−xTix)O3 ceramics, PMN-PT single crystal, AlN films, etc.), respectively [1,2,3]. The coupling factor kc, according to previous reports, is mainly influenced by configuration [4,5,6], boundary conditions [7], and composite mode (epoxy bonding [8], magnetron sputtering [9], and spin-wave interactions [10,11,12]). The configuration and boundary conditions determine the mechanical structure of ME composites. The composite mode determines the interface coupling between two phases.
For most magnetostrictive materials with a small magnetic hysteresis, the value of dm is near zero without an external magnetic field [1,2,3,4,5,6,7,8,9]. Thus, a magnetoelectric composite requires a DC biased magnetic field (Hdc) to obtain an enhanced value of dm [13]. Generally, the Hdc is provided by a pair of permanent magnets resulting in a possible noise source in the sensor array, a reduction of the spatial resolution, and an increase in the device volume.
For weakening the dependence of Hdc, the self-biased piezomagnetic effect has been presented by researchers. Using the inherent remanence of magnetic material is an effective way [14,15,16], but the self-biased ME coupling is still weak. The antiferromagnetic–ferromagnetic exchange coupling effect is the other effective method [17,18], but the processing technology is complex. Beyond that, the ME laminate with magnetization-graded ferromagnetic materials (MGFM) consisting of high-permeability ribbons and traditional magnetostrictive materials also has an effective self-biased ME response [19,20,21,22,23]. Up until now, the experimental self-biased ME response for the asymmetric piezoelectric/MGFM laminate and the symmetric MGFM/piezoelectric/MGFM structure have been studied [19,20,21,22,23]. However, up until now, few studies have focused on the theoretical magneto-mechanical response for MGFM.
In this paper, we analyze the magneto-mechanical response of MGFM consisting of Finemet and traditional piezomagnetic layers (Ni or FeNi alloy). The theoretical modeling of the magneto-mechanical behavior of MGFM is established using the nonlinear piezomagnetic constitutive model and the method of the equivalent circuit. Compared with the experimental data, the bias field dependences of piezomagnetic coefficients are in good agreement with the calculation from the presented model.
2. Theoretical Analysis
2.1. Dynamic Effective Piezomagnetic Coefficient d33,m of MGFM
The MGFM FeCuNbSiB/Ni is shown in Figure 1. The phase m1 is Finemet (FeCuNbSiB), phase m2 is traditional magnetostrictive material (Ni or FeNi). According to the principle of wave mechanics, the displacement direction of the laminate is the same as the propagation direction of the vibration, so the wave formed by elastic vibration is a longitudinal wave. Under the free boundary conditions, the MGFM vibrates freely.
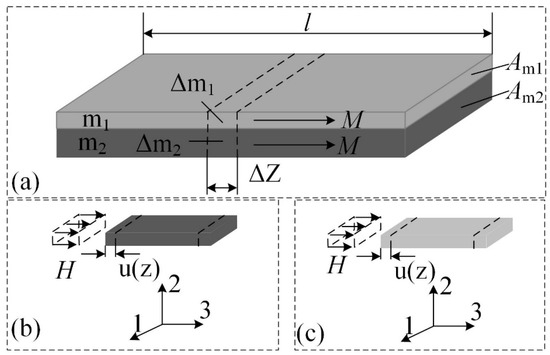
Figure 1.
(a) Schematic diagram of magnetization-graded ferromagnetic material FeCuNbSiB/Ni. The local coordinate systems in (b) FeCuNbSiB ribbon and (c) Ni plate when the magnetic field is applied along the longitudinal 3-direction. The symbol M is magnetization. The m1 and m2 is the mass of the FeCuNbSiB ribbon and Ni plate, respectively. The Δm1 and Δm2 are small mass units in the FeCuNbSiB ribbon and Ni plate, respectively. The Am1 and Am2 is the cross-sectional area of the FeCuNbSiB ribbon and Ni plate, respectively. The l is the length of FeCuNbSiB/Ni. The H is the applied magnetic field. The u(z) is the displacement.
Then, the mechanical vibration equation can be derived as follows [24,25]
where , , , , Fl and F2 are forces at the two end faces of the structure, and the and are the corresponding displacements. is the average density of the laminate. and are the magneto-elastic coupling factor. The d33,m1 and d33,m2 is the longitudinal piezomagnetic coefficient of FeCuNbSiB and Ni, respectively. is the average density of the laminate. The k is the wavenumber and v is the sound velocity. and is the elastic compliance under constant H for FeCuNbSiB and Ni, respectively.
In this paper, the method of equivalent circuit is used to deal with the magneto-elastic interaction, as shown in Figure 2.
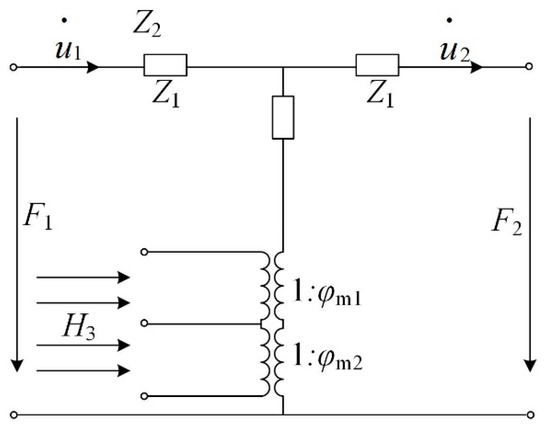
Figure 2.
Magneto-elastic equivalent circuit of the magnetization-graded ferromagnetic materials (MGFM).
From the equivalent circuit, the relationship for φm of FeCuNbSiB/Ni, φm1 of FeCuNbSiB phase and φm2 of Ni phase is
Then
where is the average compliant coefficient and . tm1 and tm2 are the thicknesses of FeCuNbSiB and Ni, respectively. So, the d33,m of MGFM is
2.2. Effective Dynamic Piezomagnetic Coefficient d33,m1 of FeCuNbSiB in MGFM
According to the nonlinear magnetostrictive constitutive relationship, the d33,m of magnetostrictive material is [26]
where M is the magnetization, ε is the stain, λs is the saturation magnetostrictive coefficient and H is the external magnetic field. η = 3χm/Ms χm is the initial magnetic susceptibility, Ms is the saturation magnetization.
Due to the remanent magnetism of Ni, an additional magnetic field Hf in FeCuNbSiB is generated. Thus, the effective magnetic field of the FeCuNbSiB ribbons in the FeCuNbSiB/Ni laminate (Heff,m1) is
where Nd,m1 is the demagnetizing factor of FeCuNbSiB. Hdc is the bias magnetic field. Hac is the alternating current magnetic field. Therefore, the effective dynamic effective piezomagnetic coefficient d33,m1 of FeCuNbSiB in the FeCuNbSiB/Ni laminate is
In order to obtain the value of Hf, we use the magnetic field simulation software, Ansoft 11.0. In the simulation, the residual magnetization of Ni is assumed as the parameter input, so Ni provides the magnetic field Hf. For magnetostrictive Ni with cubic magnetocrystalline anisotropy and , the remanent magnetization is Mr = 0.866Ms, μ0Ms = 0.616 T. The simulation settings are as follows; Ni: μ0Mr = 0.534 T, μr = 220; dimensions are 12 × 6 × 1 mm3; FeCuNbSiB: μr = 30,000; dimensions are 12 × 6 × 0.120 mm3.
Figure 3a,b illustrates the distributions of magnetic fields of the FeCuNbSiB/Ni laminate and the FeCuNbSiB ribbon in FeCuNbSiB/Ni, respectively. In the absence of Hdc, it can be clearly displayed from Figure 3 that the Ni plate provided a Hdc to FeCuNbSiB due to the residual magnetization. When the layer of FeCuNbSiB ribbon L = 1, Hf = 276.78 (A/m).
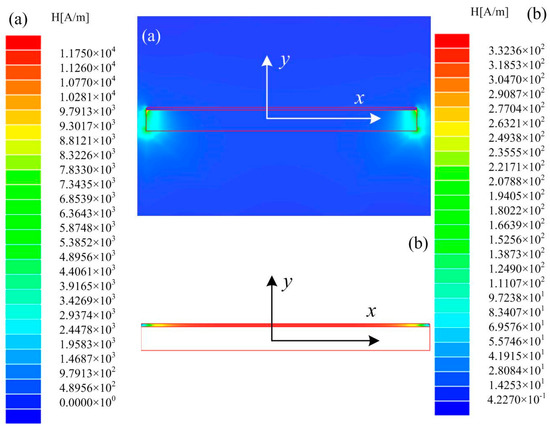
Figure 3.
(a) The distribution diagrams of magnetic fields of the FeCuNbSiB/Ni laminate, and (b) The distribution diagrams of magnetic fields of the FeCuNbSiB ribbon in the FeCuNbSiB/Ni laminate.
2.3. Dynamic Effective Piezomagnetic Coefficient d33,m2 of Ni Plate in MGFM
For FeCuNbSiB as a soft magnetic material, the permeability μrf = 30,000, saturation magnetization μ0Ms = 1.45 T, and the anisotropic constant is −30,000 J/m3. Comparatively, for pure Ni, the permeability (μr = 60) and saturation magnetization (μ0Ms = 0.616 T) are lower, and the anisotropic constant (100 J/m3) is smaller. The magnetic properties of the FeCuNbSiB ribbons and the Ni plate are significantly different, which results in an additional magnetic field being generated in the Ni plate due to the flux concentration effect of the high-permeability FeCuNbSiB ribbons [9,23]. According to previous reports [9,23], a magnetic material with high-permeability can be assumed as a static magnetic source, which results in the flux concentration effect and generates an effective magnetic field around it. Thus, the effective magnetic field in Ni of FeCuNbSiB/Ni (Heff,m2f) is larger than that of a single Ni plate without FeCuNbSiB (Heff,m2n) due to the flux concentration effect of FeCuNbSiB. Here, we assume that the coefficient of the flux concentration effect is δ. So, both Hdc and Hac in Ni are amplified δ times. In general, Hdc is far larger than the Hac. Furthermore, the internal magnetic field in the Ni plate is influenced by the demagnetizing field Hd which is completely opposite to the magnetization. The effective magnetic field Heff,m2n of the single Ni plate and Heff,m2f of Ni in the FeCuNbSiB/Ni laminate are
From Equation (9a) and (9b), the piezomagnetic coefficient of single Ni d33,m2n, and Ni in FeCuNbSiB/Ni d33,m2f are
According to the principle of magnetic charge, the magnetic charges of the Ni plate are gathered and distributed at the two end faces. So the amplitude of the magnetic field at the face ends of the Ni plate can reflect its magnetization state, assuming that the amplitude of the magnetic field at the end of the single Ni plate is HNi and Ni in FeCuNbSiB/Ni is HF-Ni. In order to obtain the values of HNi and HF-Ni, we use the Ansoft 11.0 software package (2D magnetostatic simulation) so we can obtain δ = HF-Ni/HNi. The two-dimensional simulation parameters are set as follows: permanent magnet NdFeB-N35 (75 mm length × 5 mm width, the distance of two magnets is 90 mm); Ni (μ = 220, 12 mm length × 1 mm height); and FeCuNbSiB (μ = 3 × 10⁴, 75 mm length × 0.03 mm height). When the layers of FeCuNbSiB ribbon L = 1, the distribution of flux lines of FeCuNbSiB/Ni; the distribution of the magnetic field of the FeCuNbSiB/Ni laminate are shown in Figure 4.
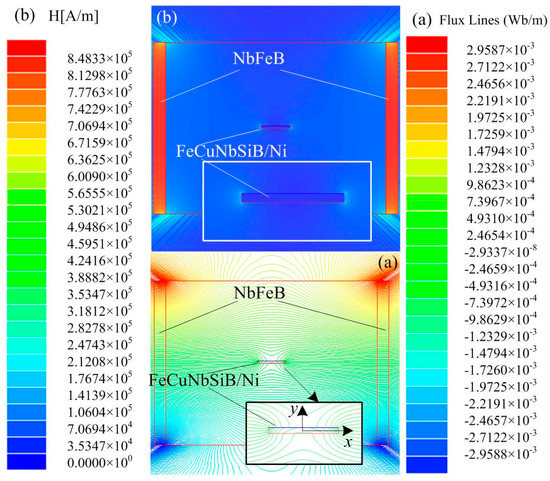
Figure 4.
When the layers of the FeCuNbSiB ribbon L = 1, the distribution diagrams of (a) flux lines and (b) magnetic field of the FeCuNbSiB/Ni laminate.
As shown in Figure 5, when centerline x changes, the magnetic field H curves along the x-direction near the two ends of the Ni plate. Clearly, the magnetic field of the Ni plate in FeCuNbSiB/Ni is far greater than that in the single Ni plate, which is attributed to the flux concentration effect of FeCuNbSiB. For a single Ni plate, HNi is 908 (A/m) at the end face. When the FeCuNbSiB layer number L = 1–5, HF-Ni at the end faces of the Ni plate in FeCuNbSiB/Ni are 1631.15395 (A/m), 1653.96385 (A/m), 1658.66092 (A/m), 1662.78705 (A/m), and 1657.69218 (A/m), respectively. When L = 4, the end face magnetic field intensity is the maximum. Therefore, according to the simulation results, the magnetic field convergence factor is δ = HF-Ni/HNi, which is about 1.83 times.
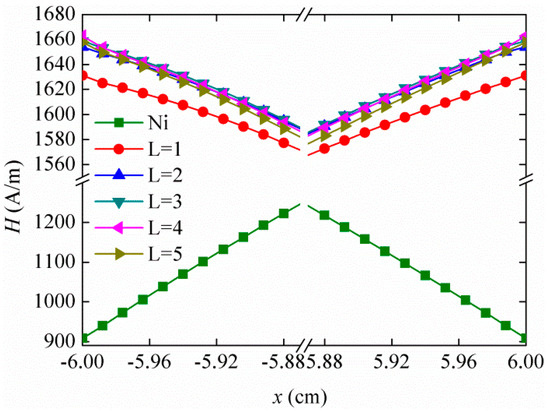
Figure 5.
The amplitude of the magnetic field along x-direction for the single Ni plate and Ni in FeCuNbSiB/Ni (L = 1–5).
3. Results and Discussion
In the present work, we compare the calculated results to the experiments to prove the effectiveness of our model for the magneto-mechanical and ME coupling characteristics. Substituting the material’s parameters shown in Table 1 into Equations (5), (8), (10a) and (10b), the theoretical results of d33,m versus Hdc for FeCuNbSiB/Ni can be obtained, as shown in Figure 6. The FeCuNbSiB is a positive magnetostrictive material, and Ni is a negative magnetostrictive material. In the calculation, d33,m1 and d33,m2 in Equation (5) are converse.

Table 1.
Material parameters of the FeCuNbSiB ribbon, Ni plate, FeNi plate, and the Pb(Zr1−xTix)O3 (PZT) plate.
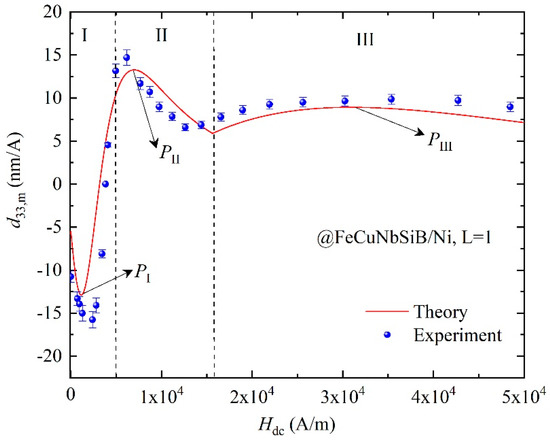
Figure 6.
The calculated and experimental d33,m as a function of Hdc for the FeCuNbSiB/Ni laminate. The layer of FeCuNbSiB is one (L = 1).
In experiments, the Doppler vibrometer (Polytec OFV-5000) was used to measure the vibration velocity v at the end faces of the FeCuNbSiB/Ni laminate, then the d33,m was calculated by d33,m = dλ/dH = v/(πƒlHac). The Hac is the external AC magnetic field, ƒ is the vibration frequency, and l is the length. It shows clearly that the calculated d33,m agrees well with the experimental data, and a large zero-biased d33,m of FeCuNbSiB/Ni can be achieved. The errors in experimental data originally from the magnetization state of piezomagnetic material is inconsistent in each measurement during all the processes of repeated measurements.
From Figure 6, there is an error between the calculation result and the experimental values. The reason for this phenomenon is that the experimental device was not fully demagnetized in the actual experimental process, and some simulation parameters are used in the theoretical calculation. We can obtain the results:
- (i)
- For the outstanding soft magnetic performance of FeCuNbSiB, the magneto-mechanical coupling of FeCuNbSiB is larger than Ni in Section 1 (d33,m1 > d33,m2). As Hdc increases, the d33,m1 increases rapidly, and the maximum value PI = 12.9 nm/A is obtained under the optimal Hdc = 1184 A/m.
- (ii)
- When Hdc increases to a certain value, the magneto-mechanical effects of FeCuNbSiB and Ni cancel each other out, and the dynamic d33,m appears at the zero-cross point as shown in Figure 6.
- (iii)
- Due to the flux concentrate effect of FeCuNbSiB, the internal magnetic moments of Ni rotate rapidly. Then, the d33,m2 becomes larger. In Section 2 of Figure 6, the d33,m is originated from the magneto-mechanical coupling of Ni with the flux concentrate effect. After the zero-crossing point, the d33,m rapidly increases to the maximum value PII. However, when Hdc increases to a certain value, FeCuNbSiB gradually saturates, the flux concentration effect is abate, which results in the appearance of the downward trend in the II area.
- (iv)
- With the increase of Hdc, the flux concentration effect gradually decreases, so in Section 3 of Figure 6, the d33,m is attributed to the magneto-mechanical coupling of Ni itself. From Equation (10a) and (10b), we assume that d33,m2f = d33,m2n when Hdc = Hn, andd33,m2f is far larger than d33,m2n when Hdc < Hn. As Hdc increases gradually, the flux concentration effect disappears when Hdc > Hn. So for the d33,m of the Ni plate in the theoretical calculation, d33,m2 =d33,m2f when Hdc < Hn and d33,m2 = d33,m2n when Hdc > Hn. From Figure 6, the magnetic field Hn for d33,m2f = d33,m2n in Equation (10a) and (10b) is ~12,800 (A/m) in experiments, and is ~15,600 (A/m) in theory.
Using the method of the magneto-mechanical-electric equivalent circuit, the longitudinal resonant ME voltage coefficient αME,r for L–T mode laminate structure is given by [24,25]
where Qm is the mechanical quality factor, n is the volume ratio of the magnetostrictive phase, ε33 is the permittivity tensor, d33,m is the piezomagnetic coefficient, d31,p is the piezoelectric coefficient, k31 is the electromechanical coupling coefficient of the piezoelectric material, is the elastic compliance of the piezoelectric phase, and is the elastic compliance of the piezomagnetic phase.
Using Pb(Zr1−xTix)O3 (PZT) ceramic as the piezoelectric material, the ME composite FeCuNbSiB/Ni/PZT can be obtained. Taking the material’s parameters in Table 1 and Equation (5) into Equation (11), the theoretical αME,r can be obtained, as shown in Figure 7. For comparison, the experimental data for FeCuNbSiB/Ni/PZT with L = 1 are used, as shown in Figure 7. It can be seen from the figure that the theoretical calculation and experimental value of αME,r is consistent with the variation trend of the Hdc. From Equation (11), one can derive αME,r d33,m. Therefore, the curve of αME,r vs. Hdc in Figure 7 is consistent with that of d33,m vs. Hdc in Figure 6. The theoretical calculation result is different from the experimental result. The reason is that the experimental device is not demagnetized in the actual experimental process. In addition, the composite structure of FeCuNbSiB/Ni/PZT has a certain thickness of glue, which was not considered in the theoretical calculation results.
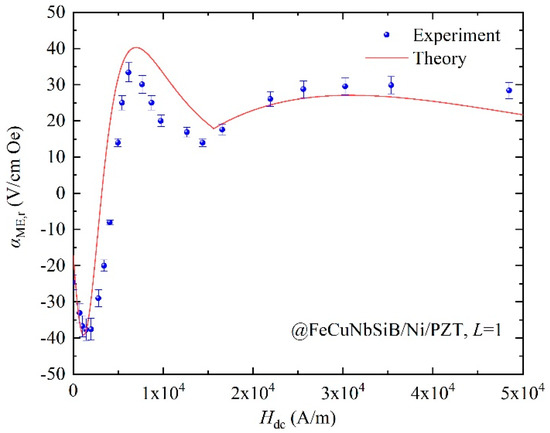
Figure 7.
The theoretical and experimental αME,r vs. Hdc for the FeCuNbSiB/Ni/PZT composite.
In previous work, FeCuNbSiB shows positive magnetostriction and Ni shows negative magnetostriction. In order to check the validity of the theoretical model, the other magnetostrictive material FeNi with positive magnetostrictive properties was chosen to replace Ni. Then, we also compared the theoretical results with the experimental data using MGFM FeCuNbSiB/FeNi and ME laminate FeCuNbSiB/FeNi/PZT.
Substituting the material’s parameters, shown in Table 1, into Equations (5), (8), (10a) and (10b), the calculated d33,m versus Hdc for FeCuNbSiB/FeNi is achieved, as shown in Figure 8. The result in Figure 8 is different from that of Figure 6. The reason is that the Ni shows negative magnetostriction and FeNi shows positive magnetostriction. In Section 1, the d33,m of FeCuNbSiB/FeNi originates from d33,m1 of FeCuNbSiB and d33,mf (Equation (10b)) of FeNi with the flux concentration effect. In Section 2, the d33,m of FeCuNbSiB/FeNi originates from d33,mn (Equation (10a)) of FeNi.
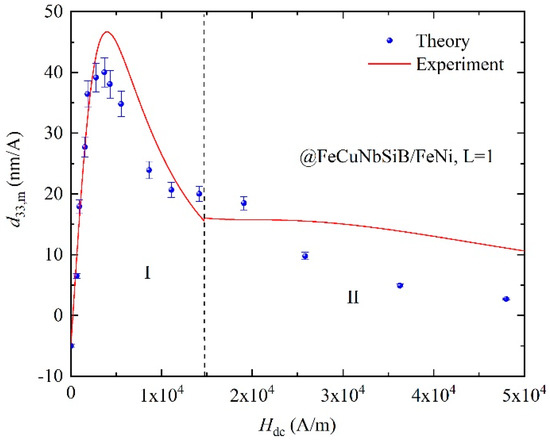
Figure 8.
Dynamic piezomagnetic coefficient d33,m of FeCuNbSiB/FeNi as a function of Hdc. The layer of FeCuNbSiB is one (L = 1).
To make further efforts to verify the proposed theoretical model, the FeCuNbSiB/FeNi/PZT composite is used, and the calculated and experimental data are shown in Figure 9. The curve of αME,r vs. Hdc in Figure 9 is consistent with that of d33,m vs. Hdc in Figure 8. The theoretical result for d33,m, and αME,r agrees well with those of experiments. Clearly, the proposed theoretical models are also proven to be useful for the other MGFM and ME laminated composite with MGFM.
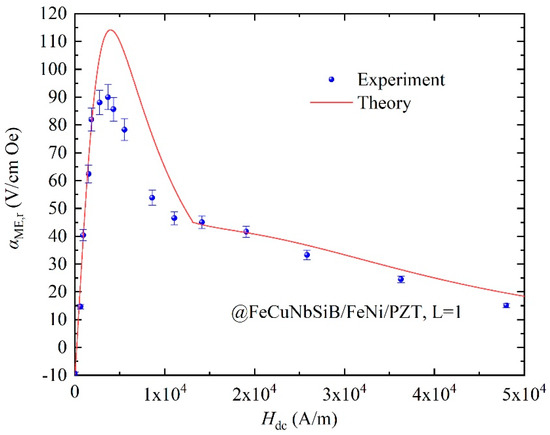
Figure 9.
The theoretical and experimental αME,r as a function of Hdc for FeCuNbSiB/FeNi/PZT.
4. Conclusions
According to the nonlinear constitutive model of piezomagnetic material, magnetoelectric equivalent circuit method, and simulation software Ansoft, a theoretical model about d33,m vs. Hdc is effectively and accurately established for MGFM. The theoretical d33,m of FeCuNbSiB/Ni, or FeCuNbSiB/FeNi has been compared with the experimental data. By using the presented piezomagnetic model of MGFM, the resonant ME voltage coefficient αME,r as a function of Hdc for FeCuNbSiB/Ni/PZT or FeCuNbSiB/FeNi/PZT composite has been investigated. The theoretical calculated result agrees well with that of the experiments. Therefore, the proposed piezomagnetic model will provide an effective tool to fully understand the dynamic magneto-mechanical behavior of MGFM and self-biased ME coupling of composites with MGFM. It is useful to guide the designing of ME devices with MGFM, such as magnetic sensors and energy harvesters.
Author Contributions
Conceptualization, H.Z. and C.L.; methodology, C.L.; software, F.Y.; validation, H.Z. and X.J.; investigation, H.Z.; resources, C.L. and H.G.; data curation, H.Z.; writing—original draft preparation, H.Z.; writing—review and editing, C.L. and Z.C.; supervision, C.L. and X.C.; funding acquisition, C.L. and A.Y. All authors have read and agreed to the published version of the manuscript.
Funding
This work was supported by the National Natural Science Foundation of China (Grant Nos. 61801402, 51775452), Science and Technology program of Sichuan Province (20JDJQ0038), Fundamental Research Funds for the Central Universities (2682020CX26), and the Science and Technology Program of State Grid Jiangxi Electric Power Co., Ltd. (No. 521820180004).
Conflicts of Interest
The authors declare no conflict of interest.
References
- Chu, Z.; PourhosseiniAsl, M.; Dong, S. Review of multi-layered magnetoelectric composite materials and devices applications. J. Phys. D Appl. Phys. 2018, 51, 243001. [Google Scholar] [CrossRef]
- Ou-Yang, J.; Liu, X.; Zhou, H.; Zou, Z.; Yang, Y.; Li, J.; Zhang, Y.; Zhu, B.; Chen, S.; Yang, X. Magnetoelectric laminate composites: An overview of methods for improving the DC and low-frequency response. J. Phys. D Appl. Phys. 2018, 51, 324005. [Google Scholar] [CrossRef]
- Carlos, A.F.V.; Hoffman, J.; Ahn, C.H.; Ramesh, R. Magnetoelectric coupling effects in multiferroic complex oxide composite Structures. Adv. Mater. 2010, 22, 2900–2918. [Google Scholar]
- Lu, C.; Li, P.; Wen, Y.; Yang, A. Large Self-Biased Magnetoelectric Properties in Heterostructure of Graded-Magnetostrictive Layers and a Rosen-Type Piezoelectric Transformer. IEEE Sens. J. 2014, 15, 402–407. [Google Scholar] [CrossRef]
- Wang, W.; Ou-Yang, J.; Wu, X.; Zhang, Y.; Yang, X.; Chen, S. High-Isotropic Magnetic Sensor Based on Ring Terfenol-D/PZT Composites. IEEE Trans. Magn. 2018, 54, 1–5. [Google Scholar] [CrossRef]
- Jing, W.Q.; Fang, F. Stress-induced self-biasing of magnetoelectric coupling in embedded Ni/PZT/FeNi composite. Appl. Phys. Lett. 2015, 106, 212901. [Google Scholar] [CrossRef]
- Nguyen, T.; Mininger, X.; Daniel, L.; Bouillault, F. Influence of Mechanical Boundary Conditions on Magnetoelectric Sensors. IEEE Trans. Magn. 2013, 49, 2009–2012. [Google Scholar] [CrossRef]
- Lu, C.; Zhou, H.; Yang, A.; Ou, Z.; Yu, F.; Gao, H. Nonlinear Magnetoelectric Response of Fe73.5Cu1Nb3Si13.5B9/Piezofiber Composite for a Pulsed Magnetic Field Sensor. Materials 2019, 12, 2866. [Google Scholar] [CrossRef]
- Li, M.; Matyushov, A.; Dong, C.; Chen, H.; Lin, H.; Nan, T.; Qian, Z.; Rinaldi, M.; Lin, Y.; Sun, N.-X. Ultra-sensitive NEMS magnetoelectric sensor for picotesla DC magnetic field detection. Appl. Phys. Lett. 2017, 110, 143510. [Google Scholar] [CrossRef]
- Sadovnikov, A.V.; Grachev, A.A.; Sheshukova, S.E.; Sharaevskii, Y.P.; Serdobintsev, A.A.; Mitin, D.M.; Nikitov, S.A. Magnon Straintronics: Reconfigurable Spin-Wave Routing in Strain-Controlled Bilateral Magnetic Stripes. Phys. Rev. Lett. 2018, 120, 257203. [Google Scholar] [CrossRef]
- Sadovnikov, A.V.; Grachev, A.A.; Serdobintsev, A.A.; Sheshukova, S.E.; Yankin, S.S.; Nikitov, S.A. Magnon Straintronics to Control Spin-Wave Computation: Strain Reconfigurable Magnonic-Crystal Directional Coupler. IEEE Magn. Lett. 2019, 10, 1–5. [Google Scholar] [CrossRef]
- Gusev, N.S.; Sadovnikov, A.V.; Nikitov, S.A.; Sapozhnikov, M.V.; Udalov, O.G. Manipulation of the Dzyaloshinskii-Moriya Interaction in Co/Pt Multilayers with Strain. Phys. Rev. Lett. 2020, 124, 157202. [Google Scholar] [CrossRef]
- Leung, C.M.; Li, J.; Viehland, D.; Zhuang, X. A review on applications of magnetoelectric composites: From heterostructural uncooled magnetic sensors, energy harvesters to highly efficient power converters. J. Phys. D Appl. Phys. 2018, 51, 263002. [Google Scholar] [CrossRef]
- Zhou, Y.; Priya, S. Near-flat self-biased magnetoelectric response in geometry gradient composite. J. Appl. Phys. 2014, 115, 104107. [Google Scholar] [CrossRef]
- Zhang, J.; Li, P.; Wen, Y.; He, W.; Yang, A.; Lu, C. Giant self-biased magnetoelectric response with obvious hysteresis in layered homogeneous composites of negative magnetostrictive material Samfenol and piezoelectric ceramics. Appl. Phys. Lett. 2013, 103, 202902. [Google Scholar] [CrossRef]
- Tang, C.; Lu, C. Strong self-biased magnetoelectric charge coupling in a homogenous laminate stack for magnetic sensor. J. Alloy Compd. 2016, 686, 723–726. [Google Scholar] [CrossRef]
- Lage, E.; Kirchhof, C.; Hrkac, V.; Kienle, L.; Jahns, R.; Knöchel, R.; Quandt, E.; Meyners, D. Exchange biasing of magnetoelectric composites. Nat. Mater. 2012, 11, 523–529. [Google Scholar] [CrossRef]
- Röbisch, V.; Yarar, E.; Urs, N.O.; Teliban, I.; Knöchel, R.; Mccord, J.; Quandt, E.; Meyners, D. Exchange biased magnetoelectric composites for magnetic field sensor application by frequency conversion. J. Appl. Phys. 2015, 117, 17B513. [Google Scholar] [CrossRef]
- Laletin, U.; Sreenivasulu, G.; Petrov, V.M.; Garg, T.; Kulkarni, A.R.; Venkataramani, N.; Srinivasan, G. Hysteresis and remanence in magnetoelectric effects in functionally graded magnetostrictive-piezoelectric layered composites. Phys. Rev. B 2012, 85, 104404. [Google Scholar] [CrossRef]
- Ou, Z.; Lu, C.; Yang, A.; Zhou, H.; Cao, Z.; Zhua, R.; Gao, H. Self-biased magnetoelectric current sensor based on SrFe12O19/FeCuNbSiB/PZT composite. Sens. Actuators A 2019, 290, 8–13. [Google Scholar] [CrossRef]
- Mandal, S.K.; Sreenivasulu, G.; Petrov, V.M.; Srinivasan, G. Magnetization-graded multiferroic composite and magnetoelectric effects at zero bias. Phys. Rev. B 2011, 84, 014432. [Google Scholar] [CrossRef]
- Chen, L.; Li, P.; Wen, Y.; Zhu, Y. Theoretical analyses of nonlinear magnetoelectric response in self-biased magnetostrictive/piezoelectric laminated composites. Compos. Struct. 2015, 119, 685–692. [Google Scholar] [CrossRef]
- Lu, C.; Li, P.; Wen, Y.; Yang, A.; He, W.; Zhang, J.; Yang, J.; Wen, J.; Zhu, Y.; Yu, M. Investigation of magnetostrictive/piezoelectric multilayer composite with a giant zero-biased magnetoelectric effect. Appl. Phys. A 2013, 113, 413–421. [Google Scholar] [CrossRef]
- Dong, S.; Li, J.-F.; Viehland, D. Longitudinal and transverse magnetoelectric voltage coefficients of magnetostrictive/piezoelectric laminate composite: Theory. IEEE Trans. Ultrason. Ferroelectr Freq. Control 2003, 50, 1253–1261. [Google Scholar] [CrossRef]
- Yang, F.; Wen, Y.-M.; Li, P.; Zheng, M.; Bian, L. Resonant magnetoelectric response of magnetostrictive/piezoelectric laminate composite in consideration of losses. Sens. Actuators A Phys. 2008, 141, 129–135. [Google Scholar] [CrossRef]
- Zheng, X.; Liu, X.E. A nonlinear constitutive model for Terfenol-D rods. J. Appl. Phys. 2005, 97, 053901. [Google Scholar] [CrossRef]
© 2020 by the authors. Licensee MDPI, Basel, Switzerland. This article is an open access article distributed under the terms and conditions of the Creative Commons Attribution (CC BY) license (http://creativecommons.org/licenses/by/4.0/).