Effect of Heat Treatment on Gradient Microstructure of AlSi10Mg Lattice Structure Manufactured by Laser Powder Bed Fusion


Abstract
1. Introduction
2. Experimental Procedure
3. Results
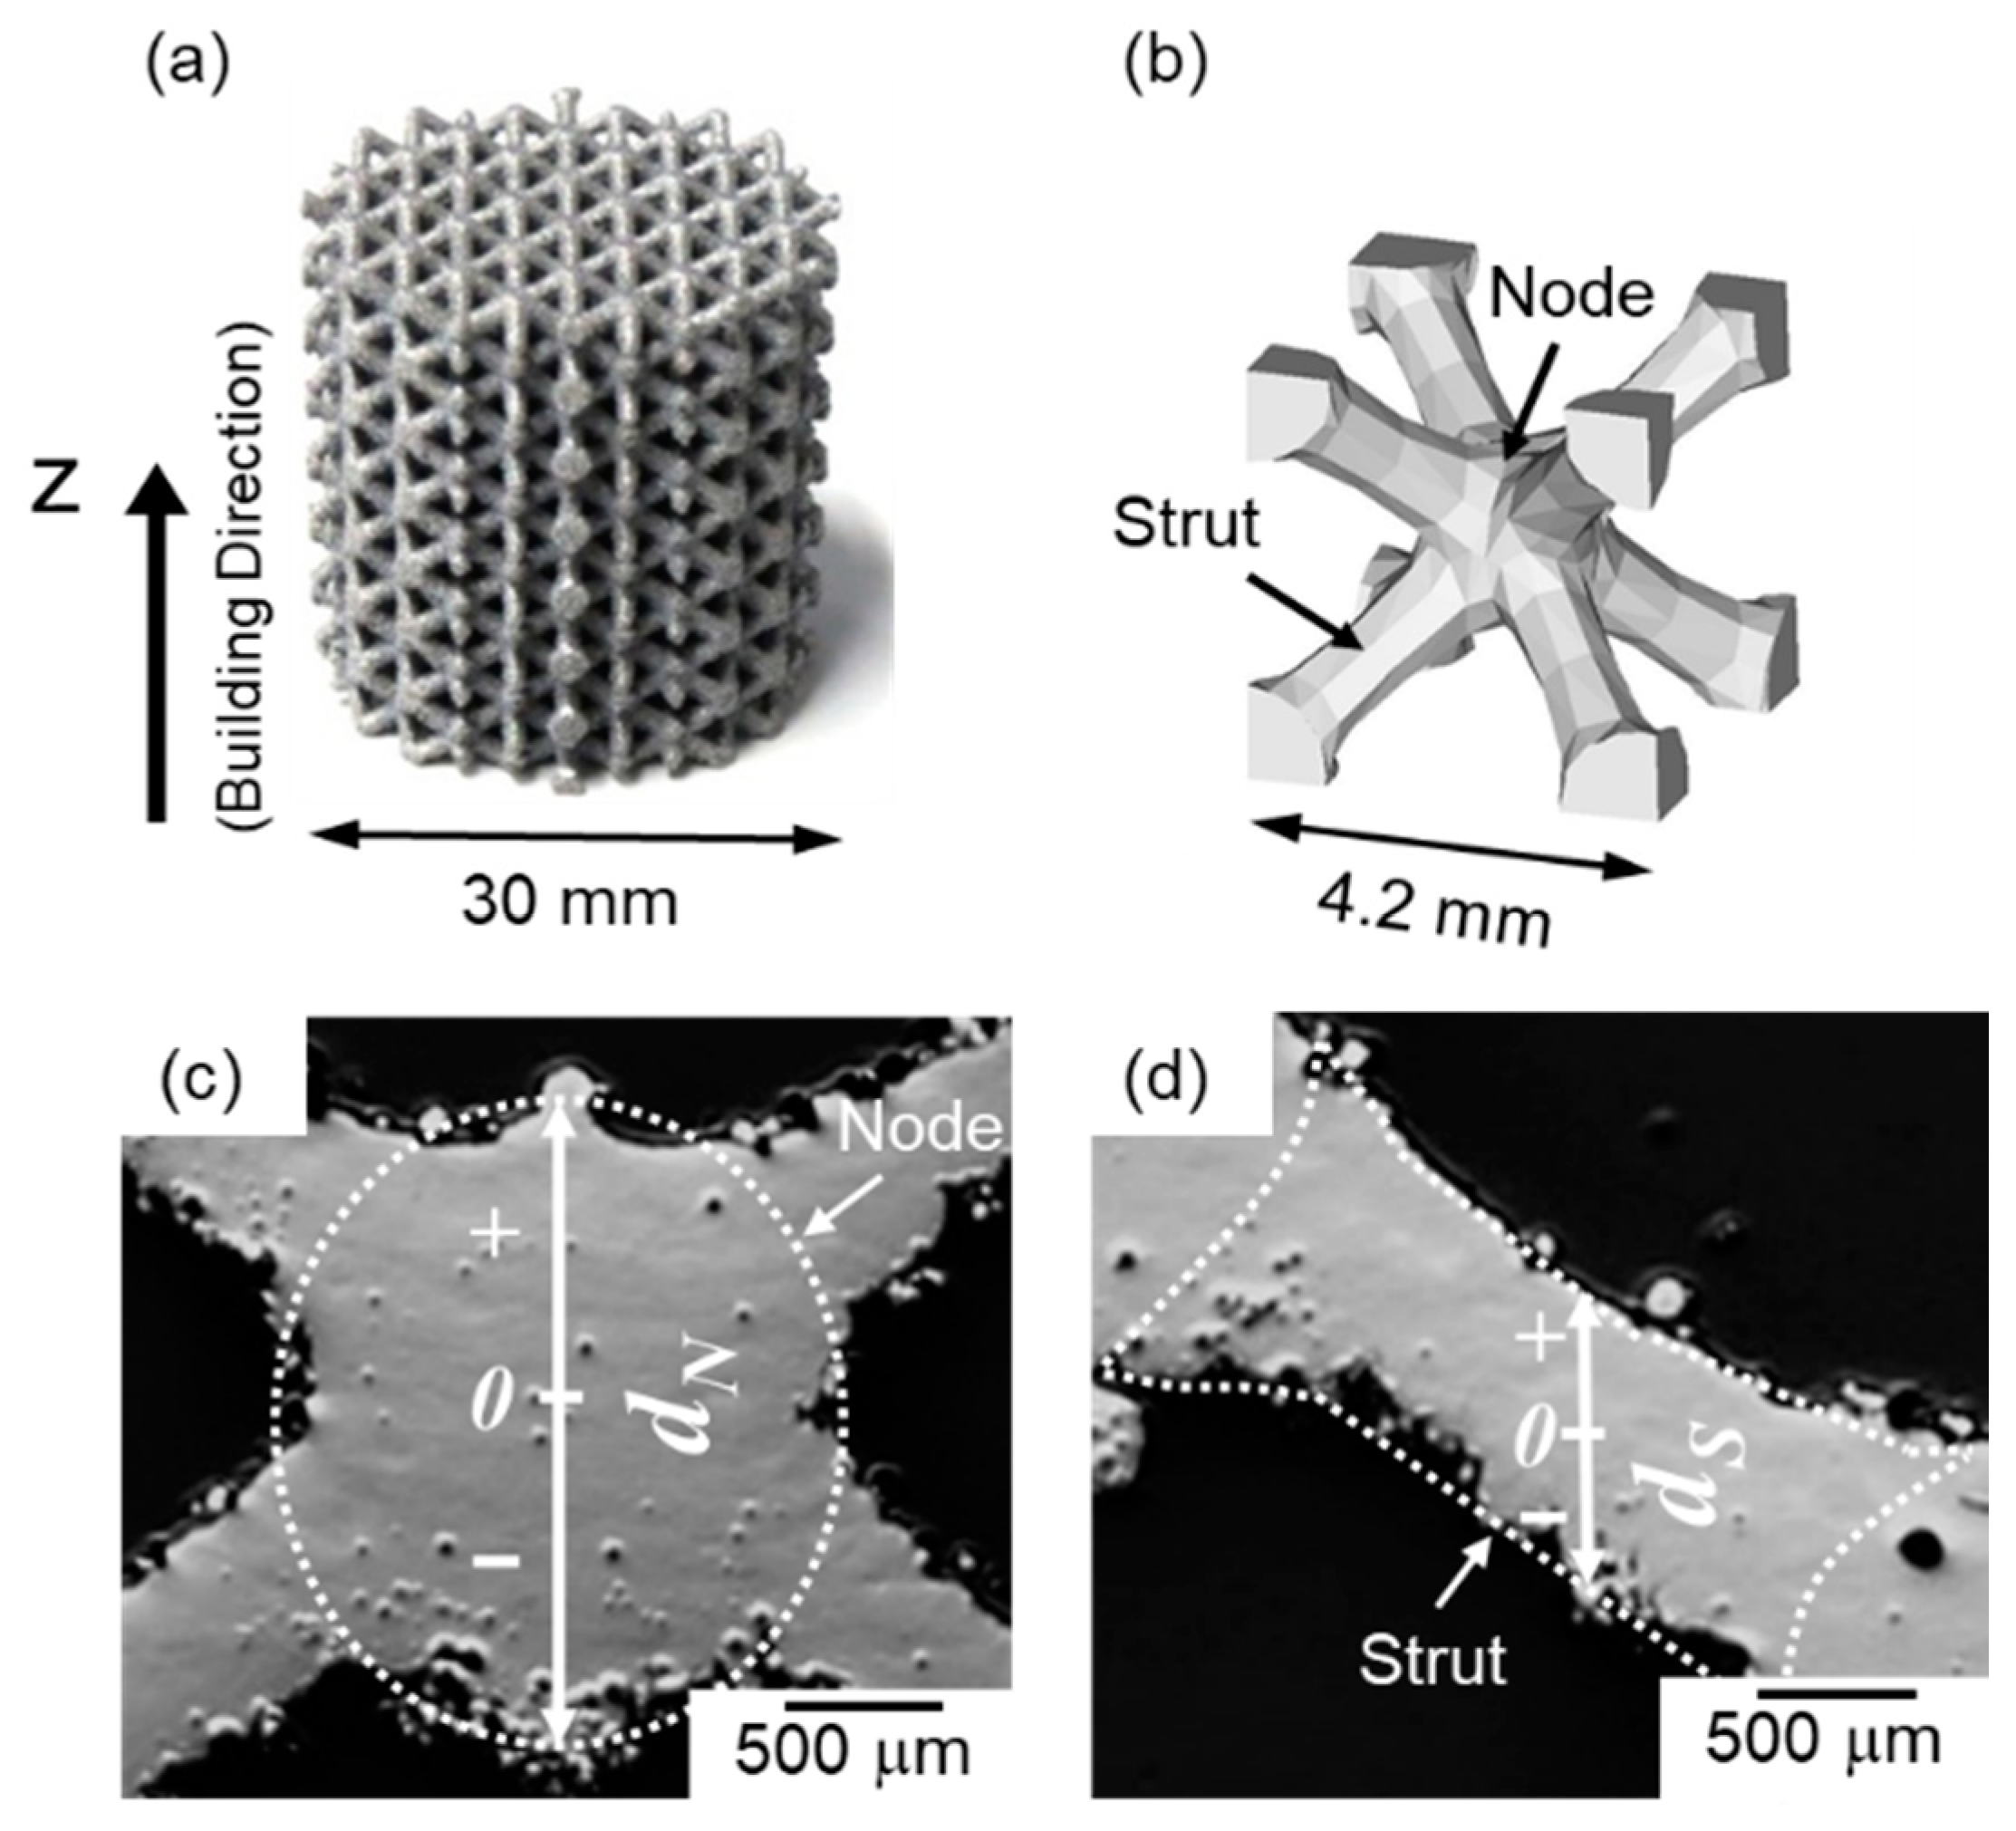
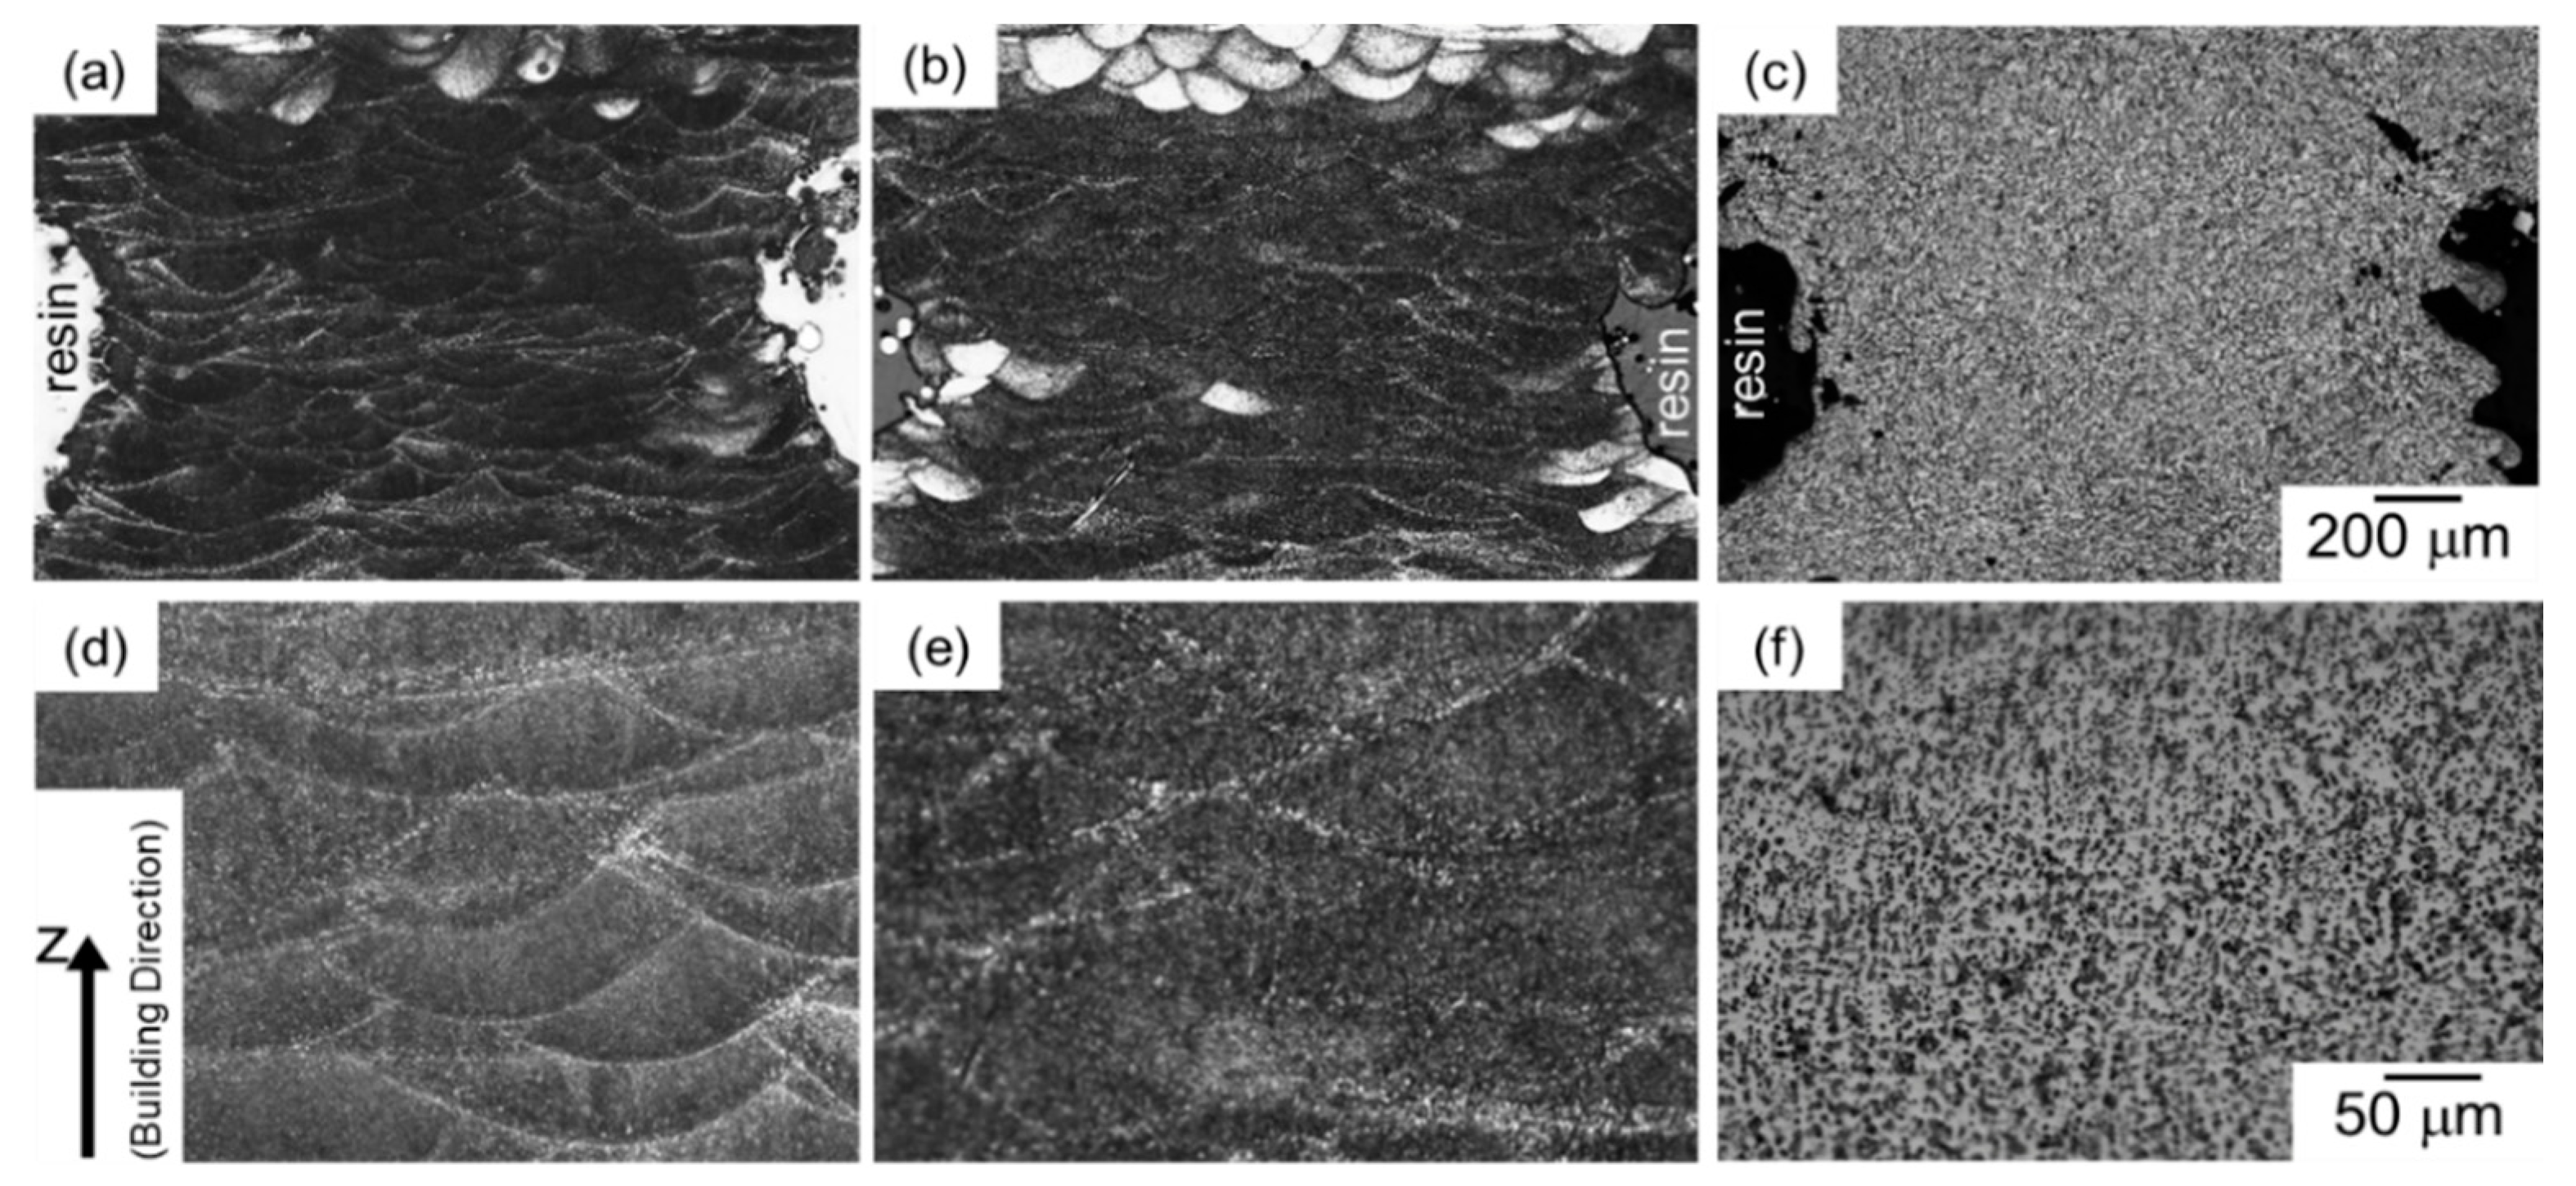
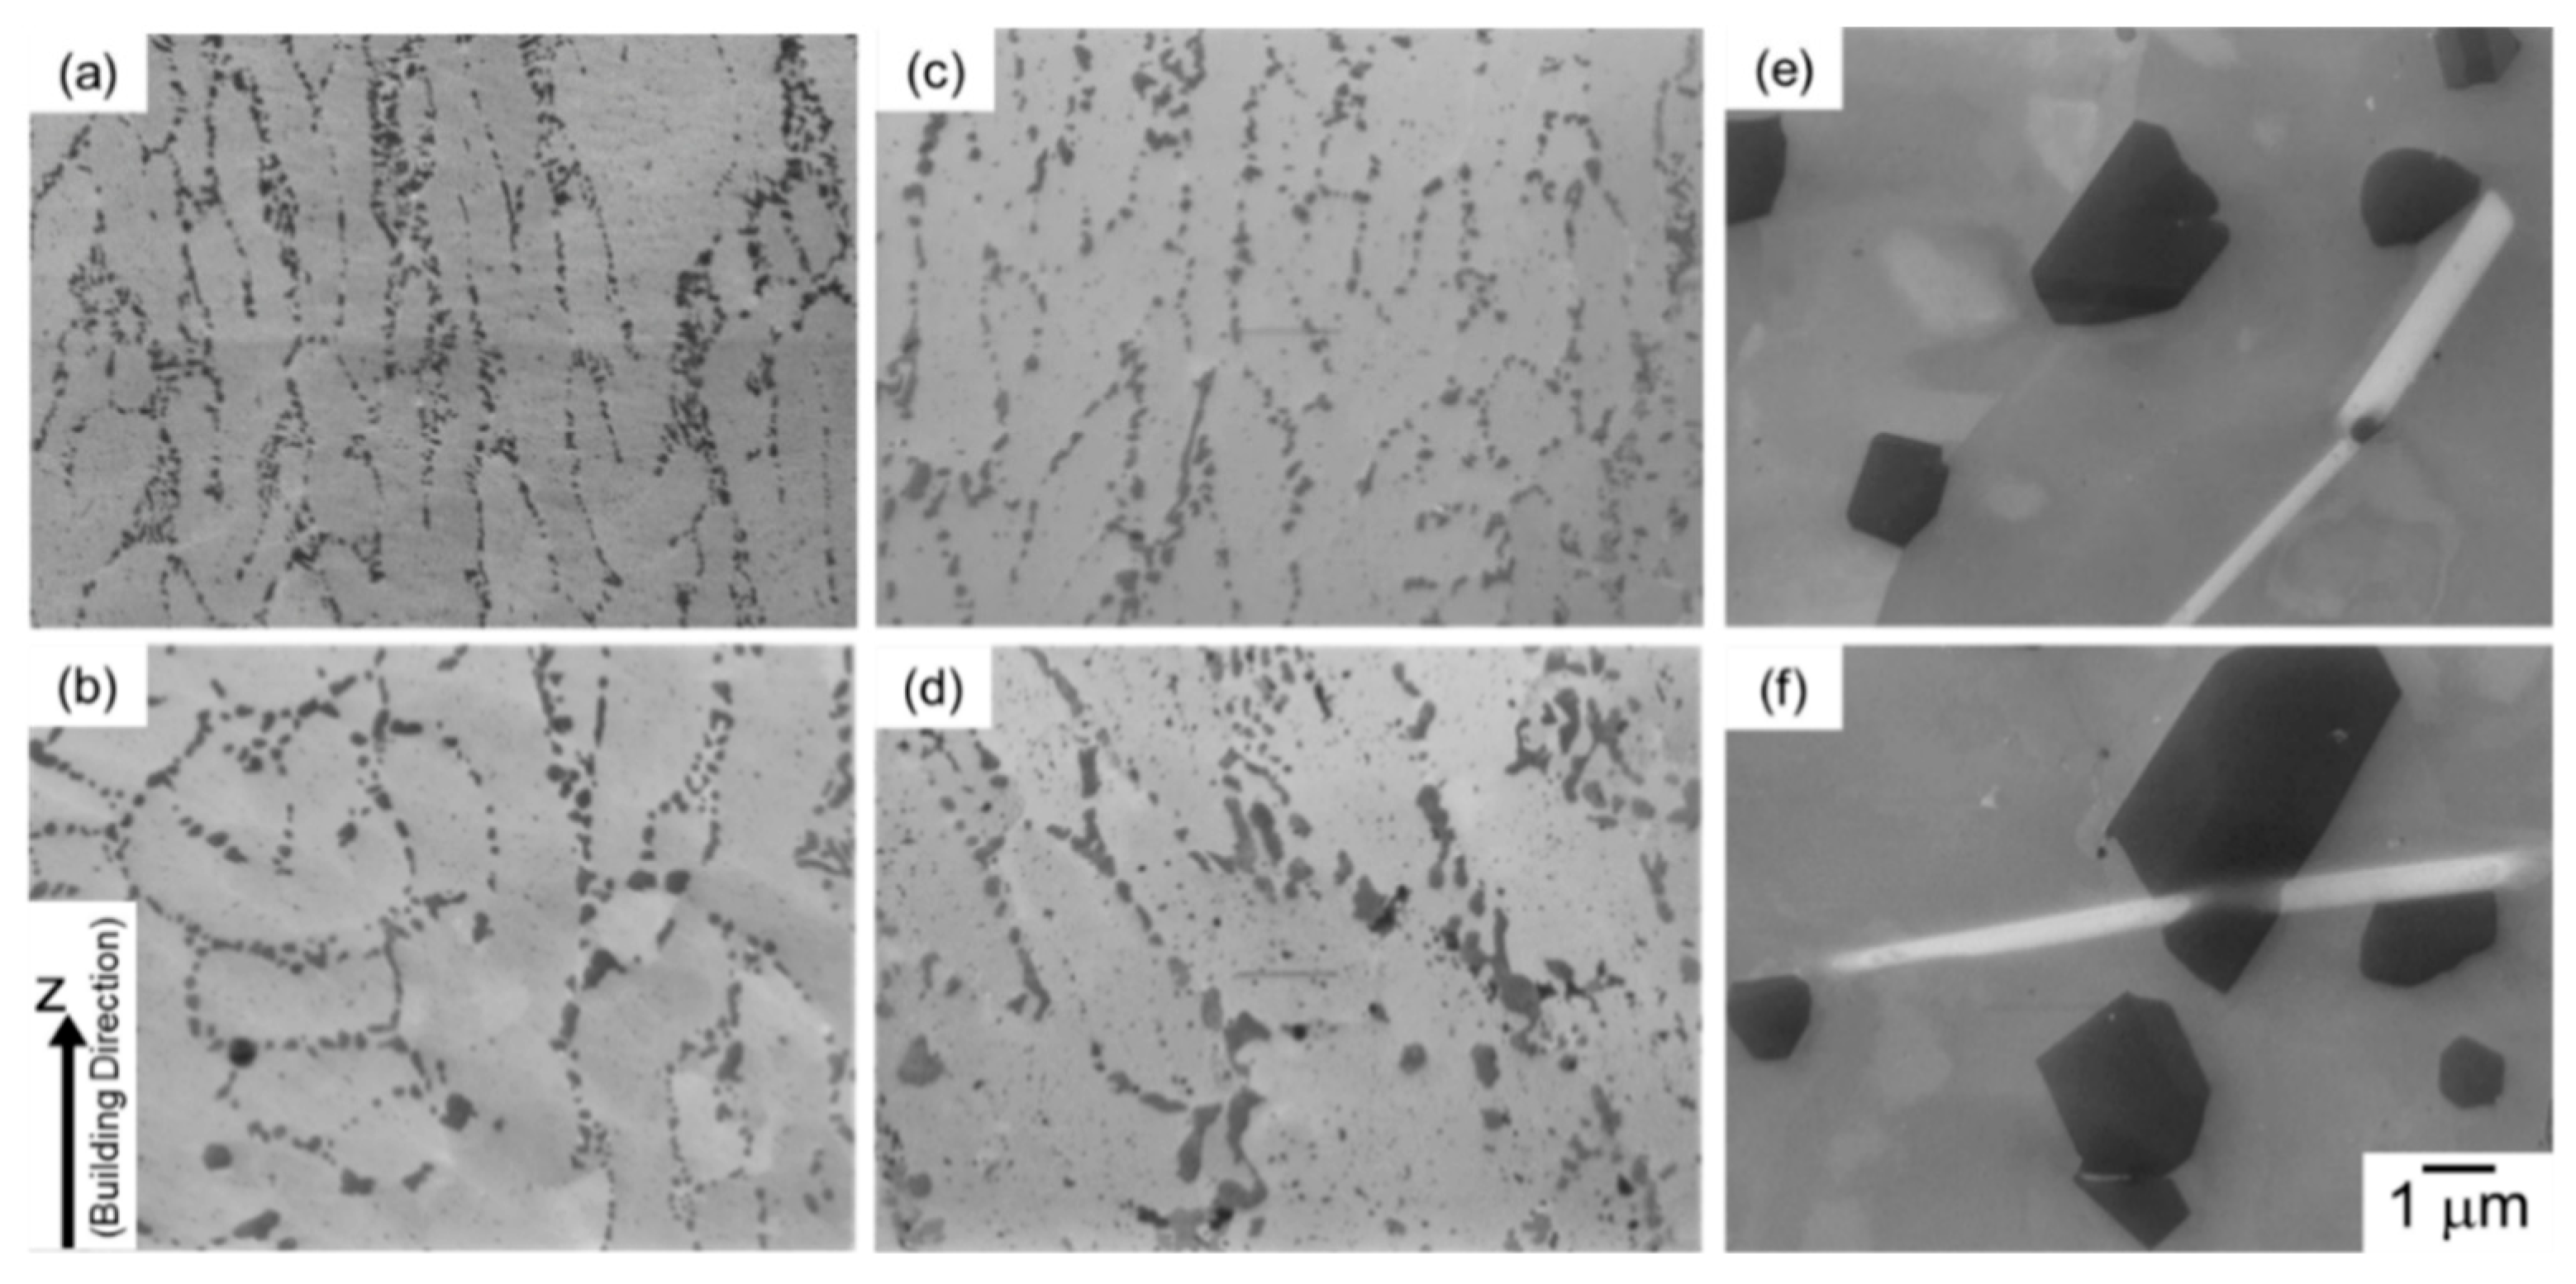
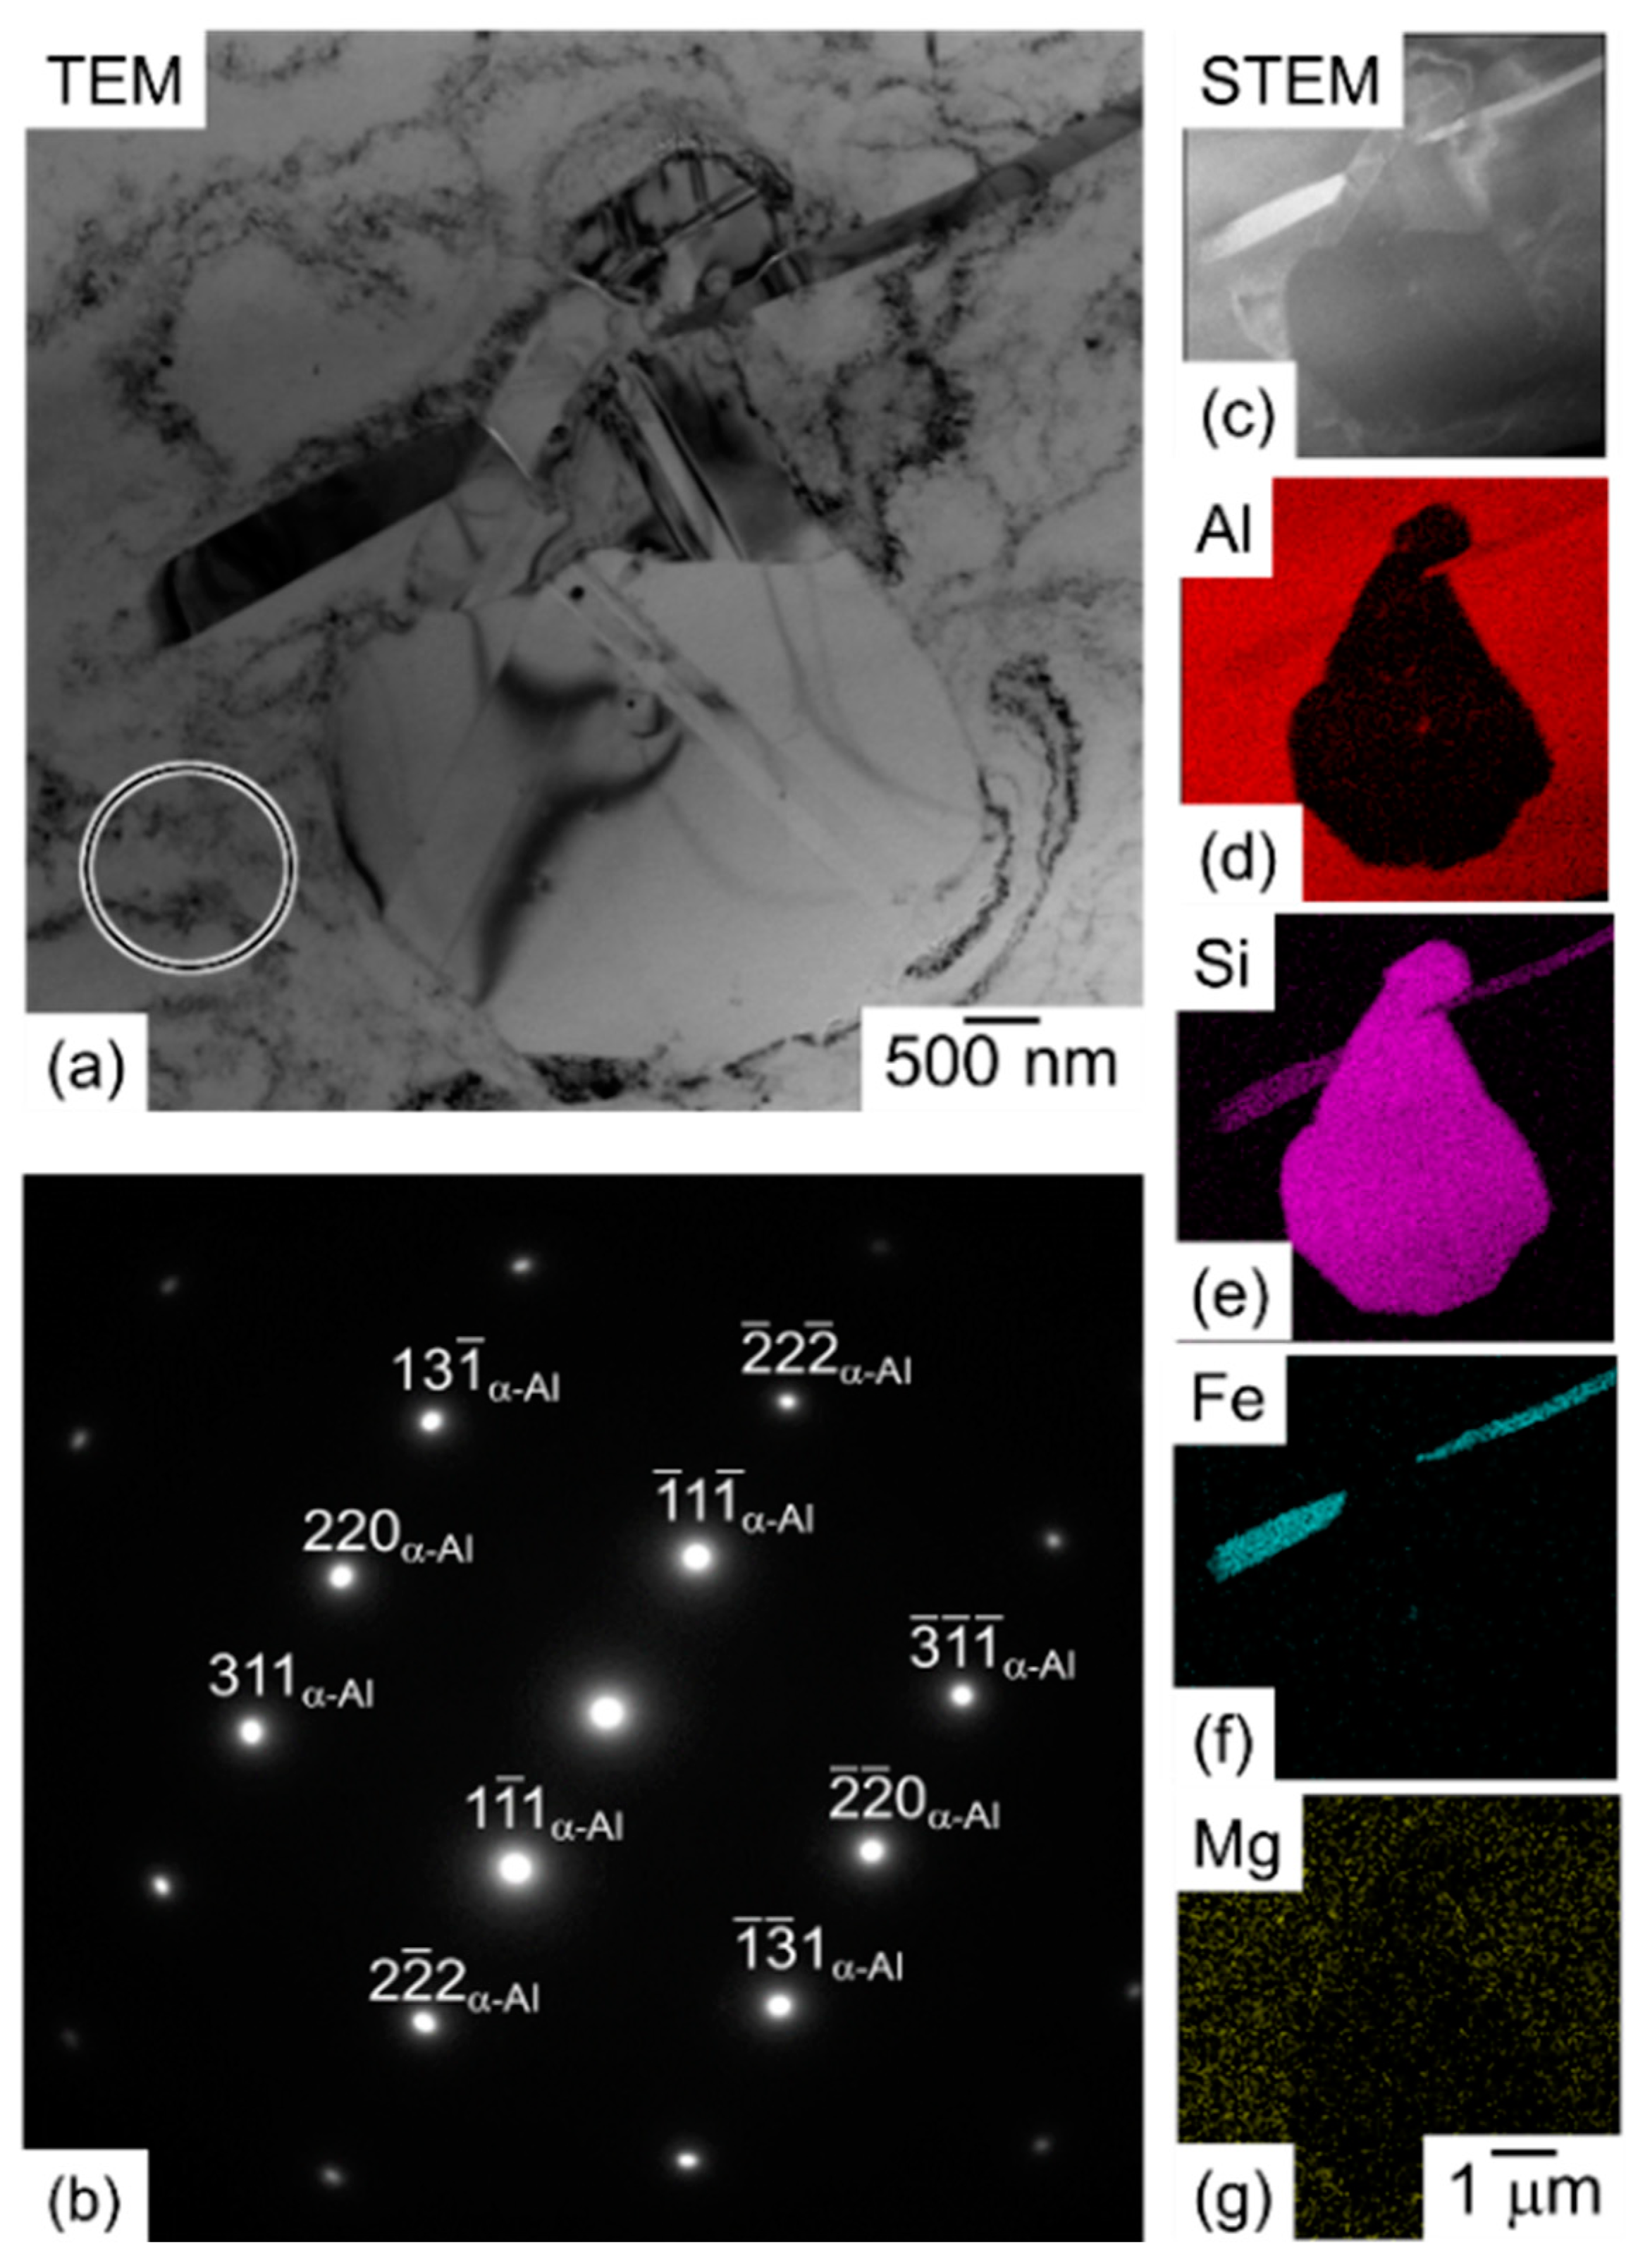
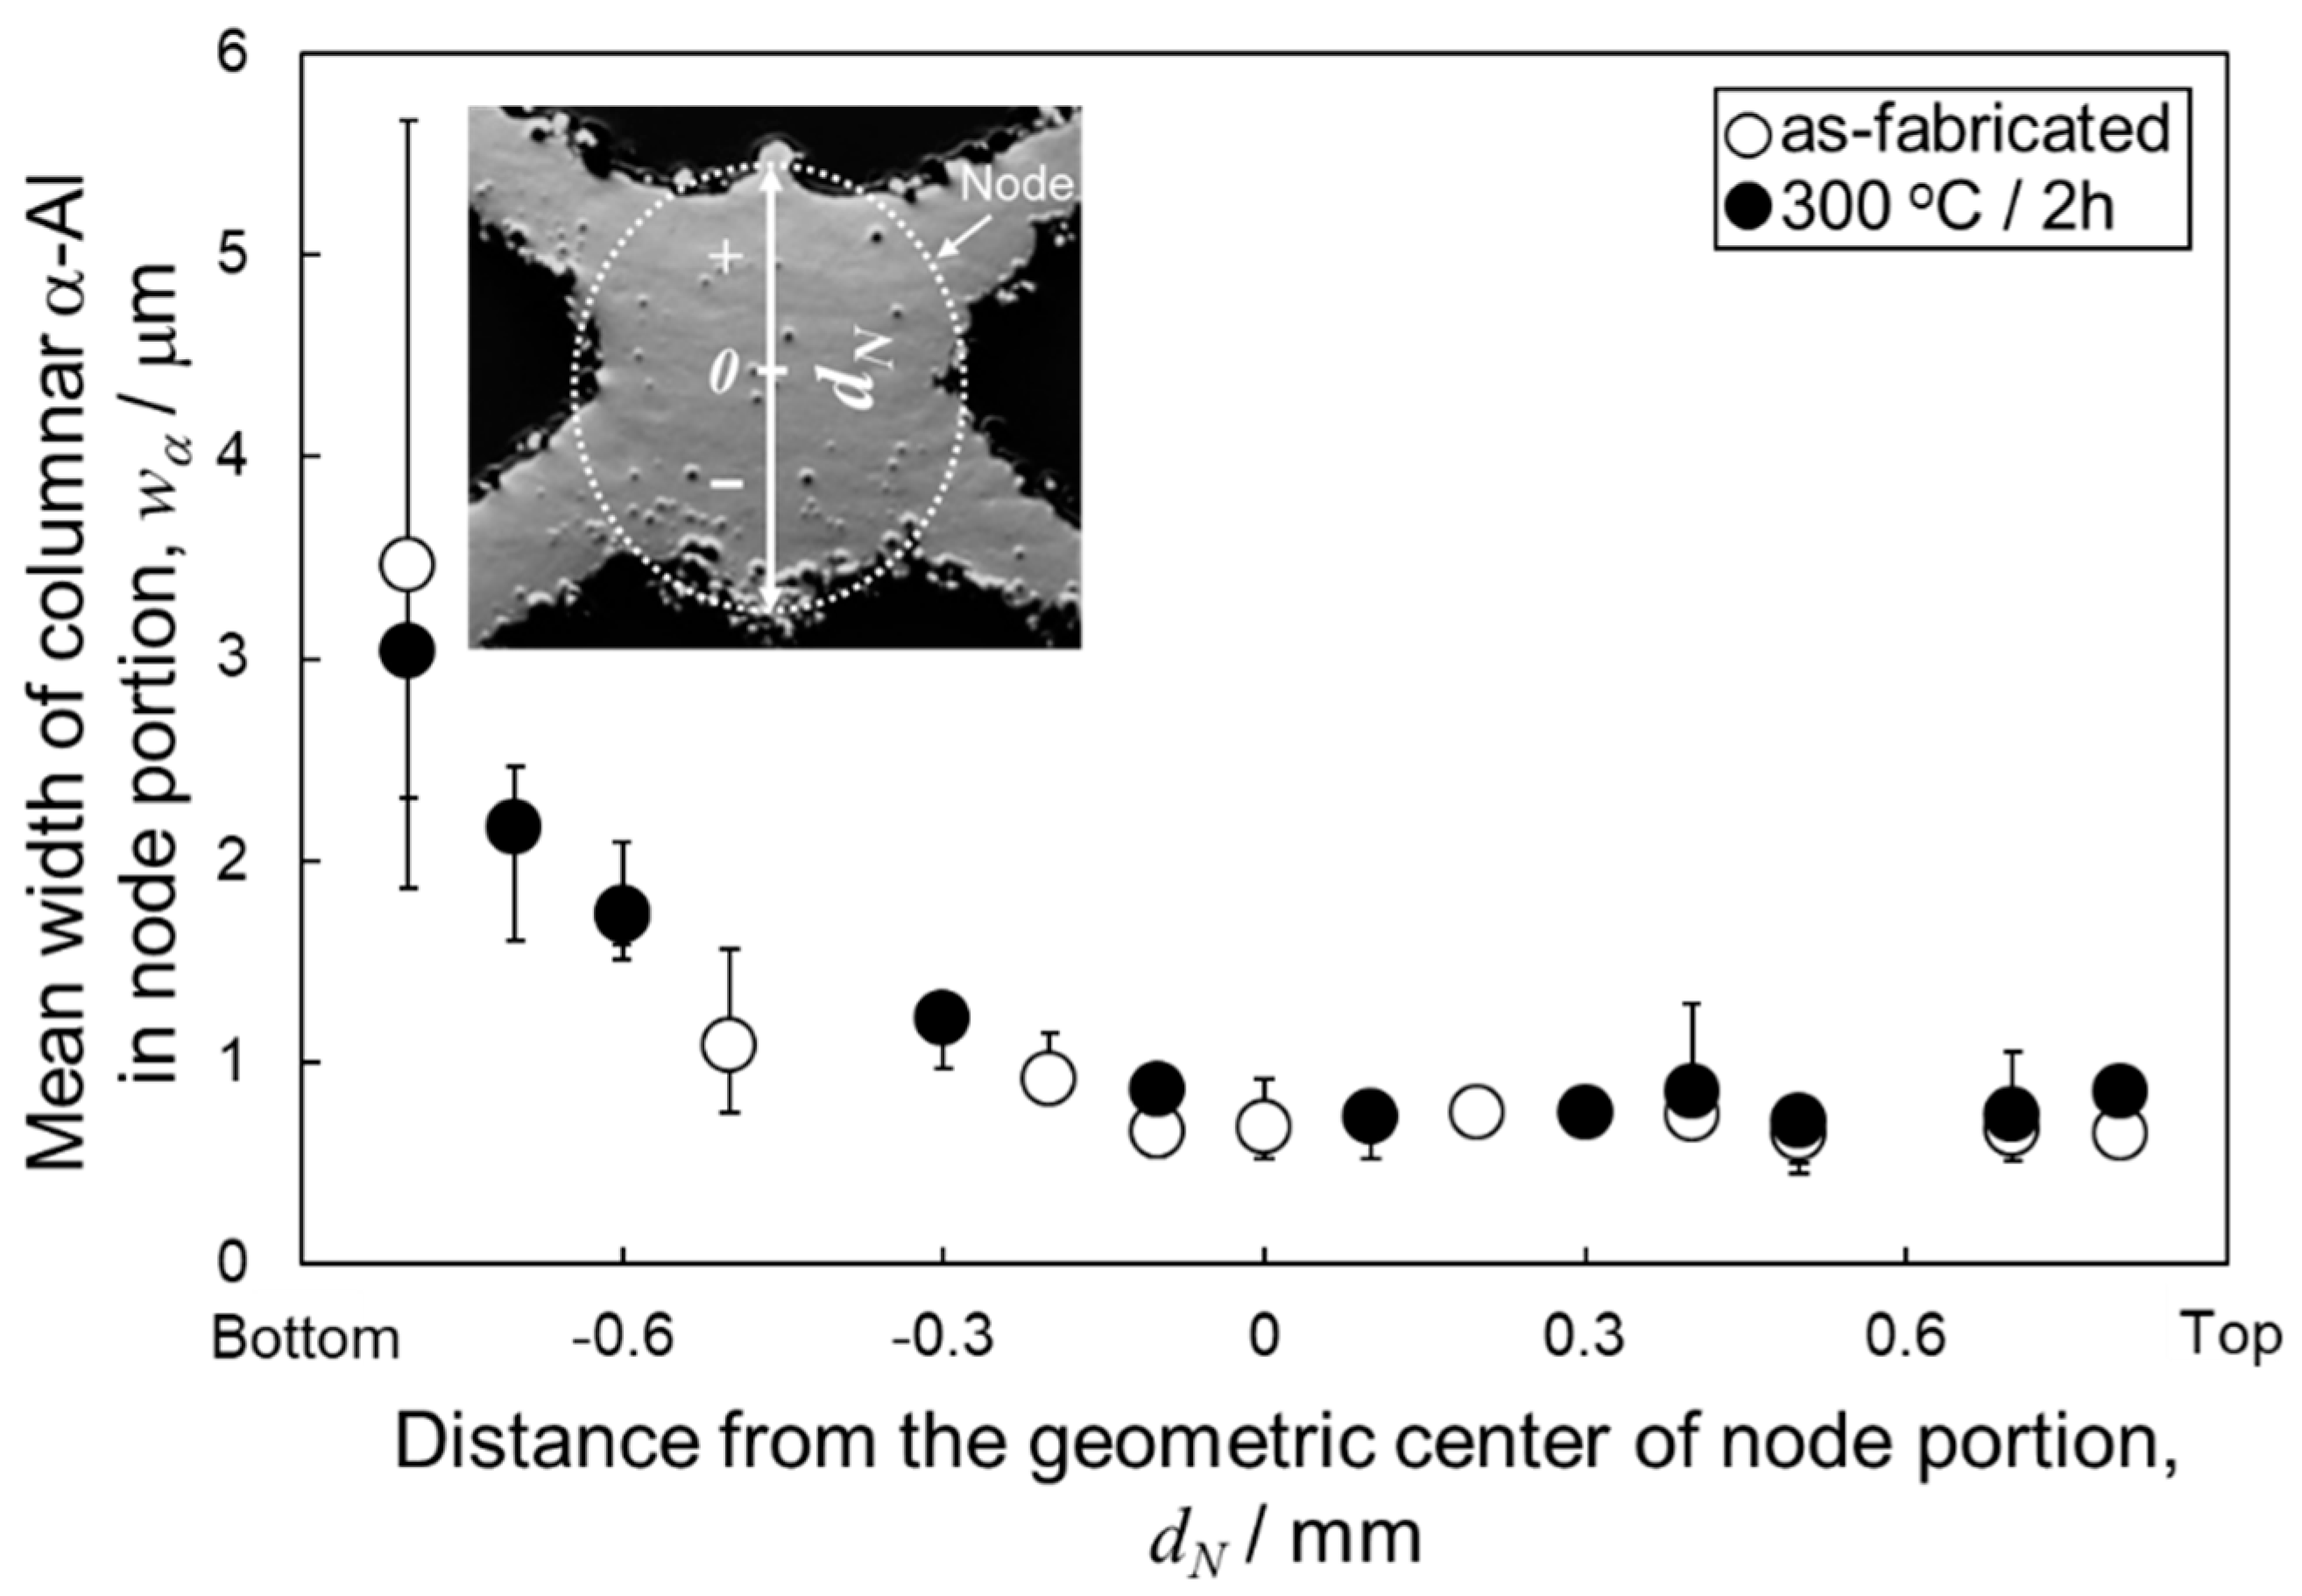
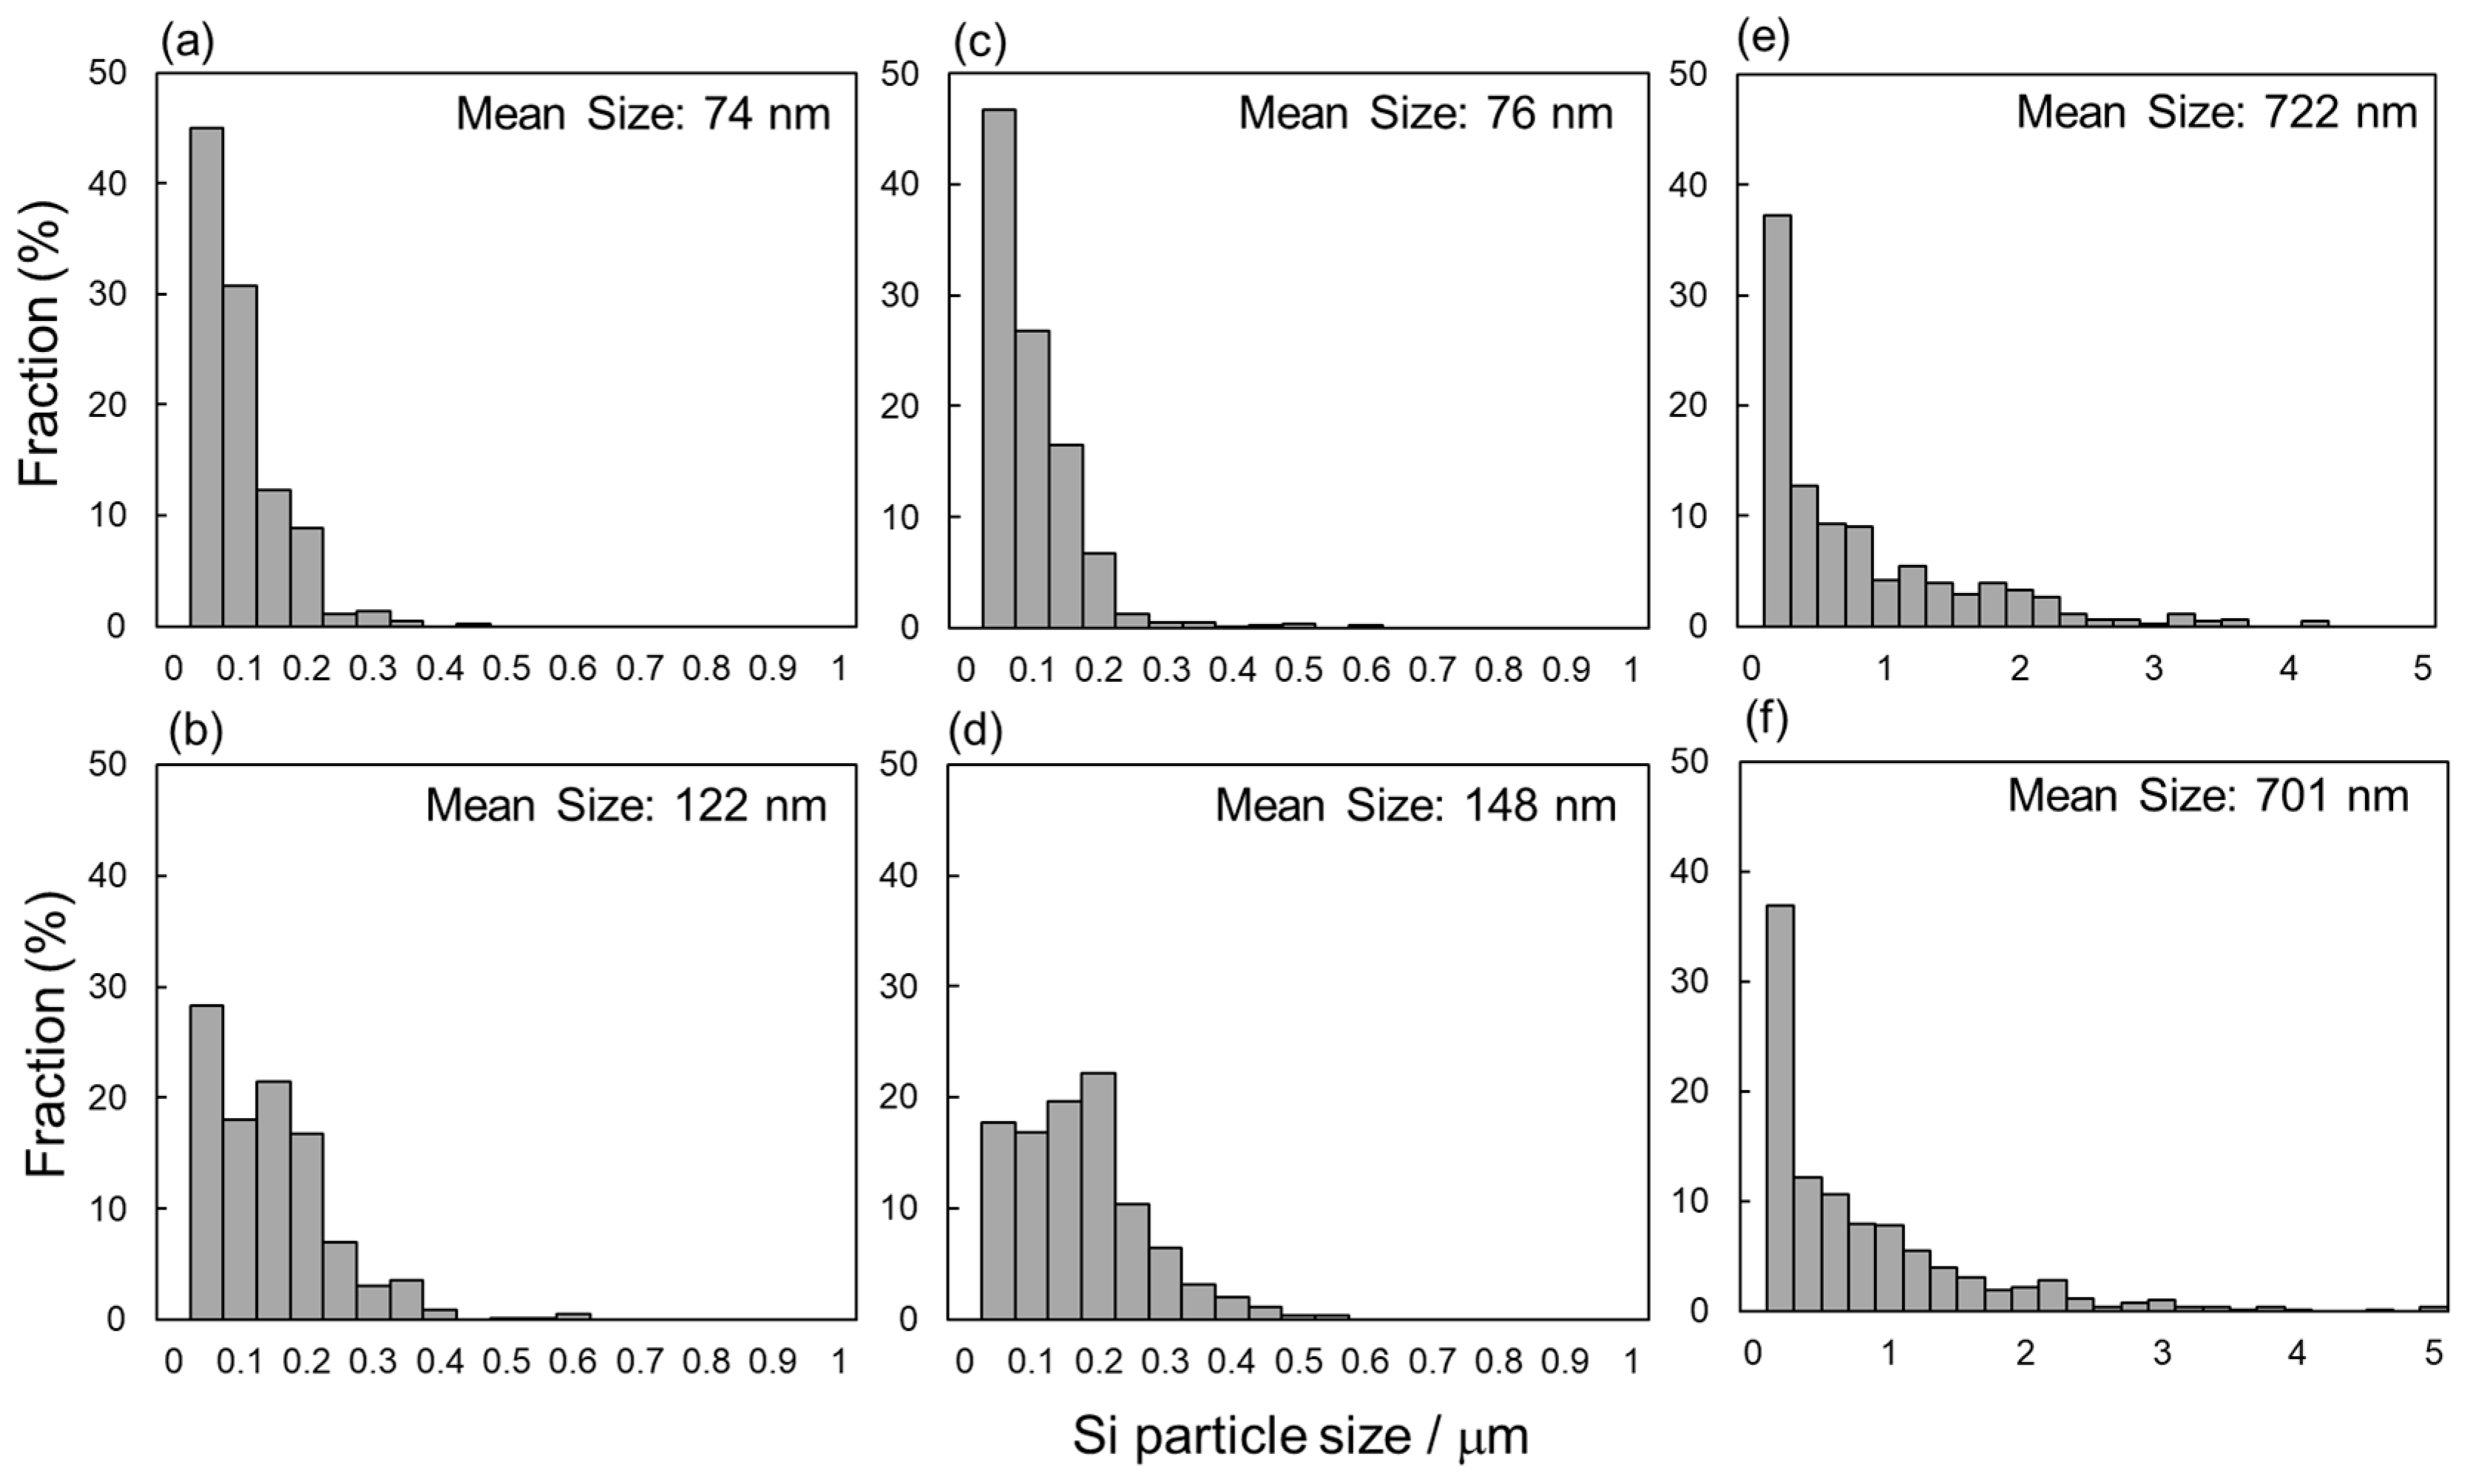
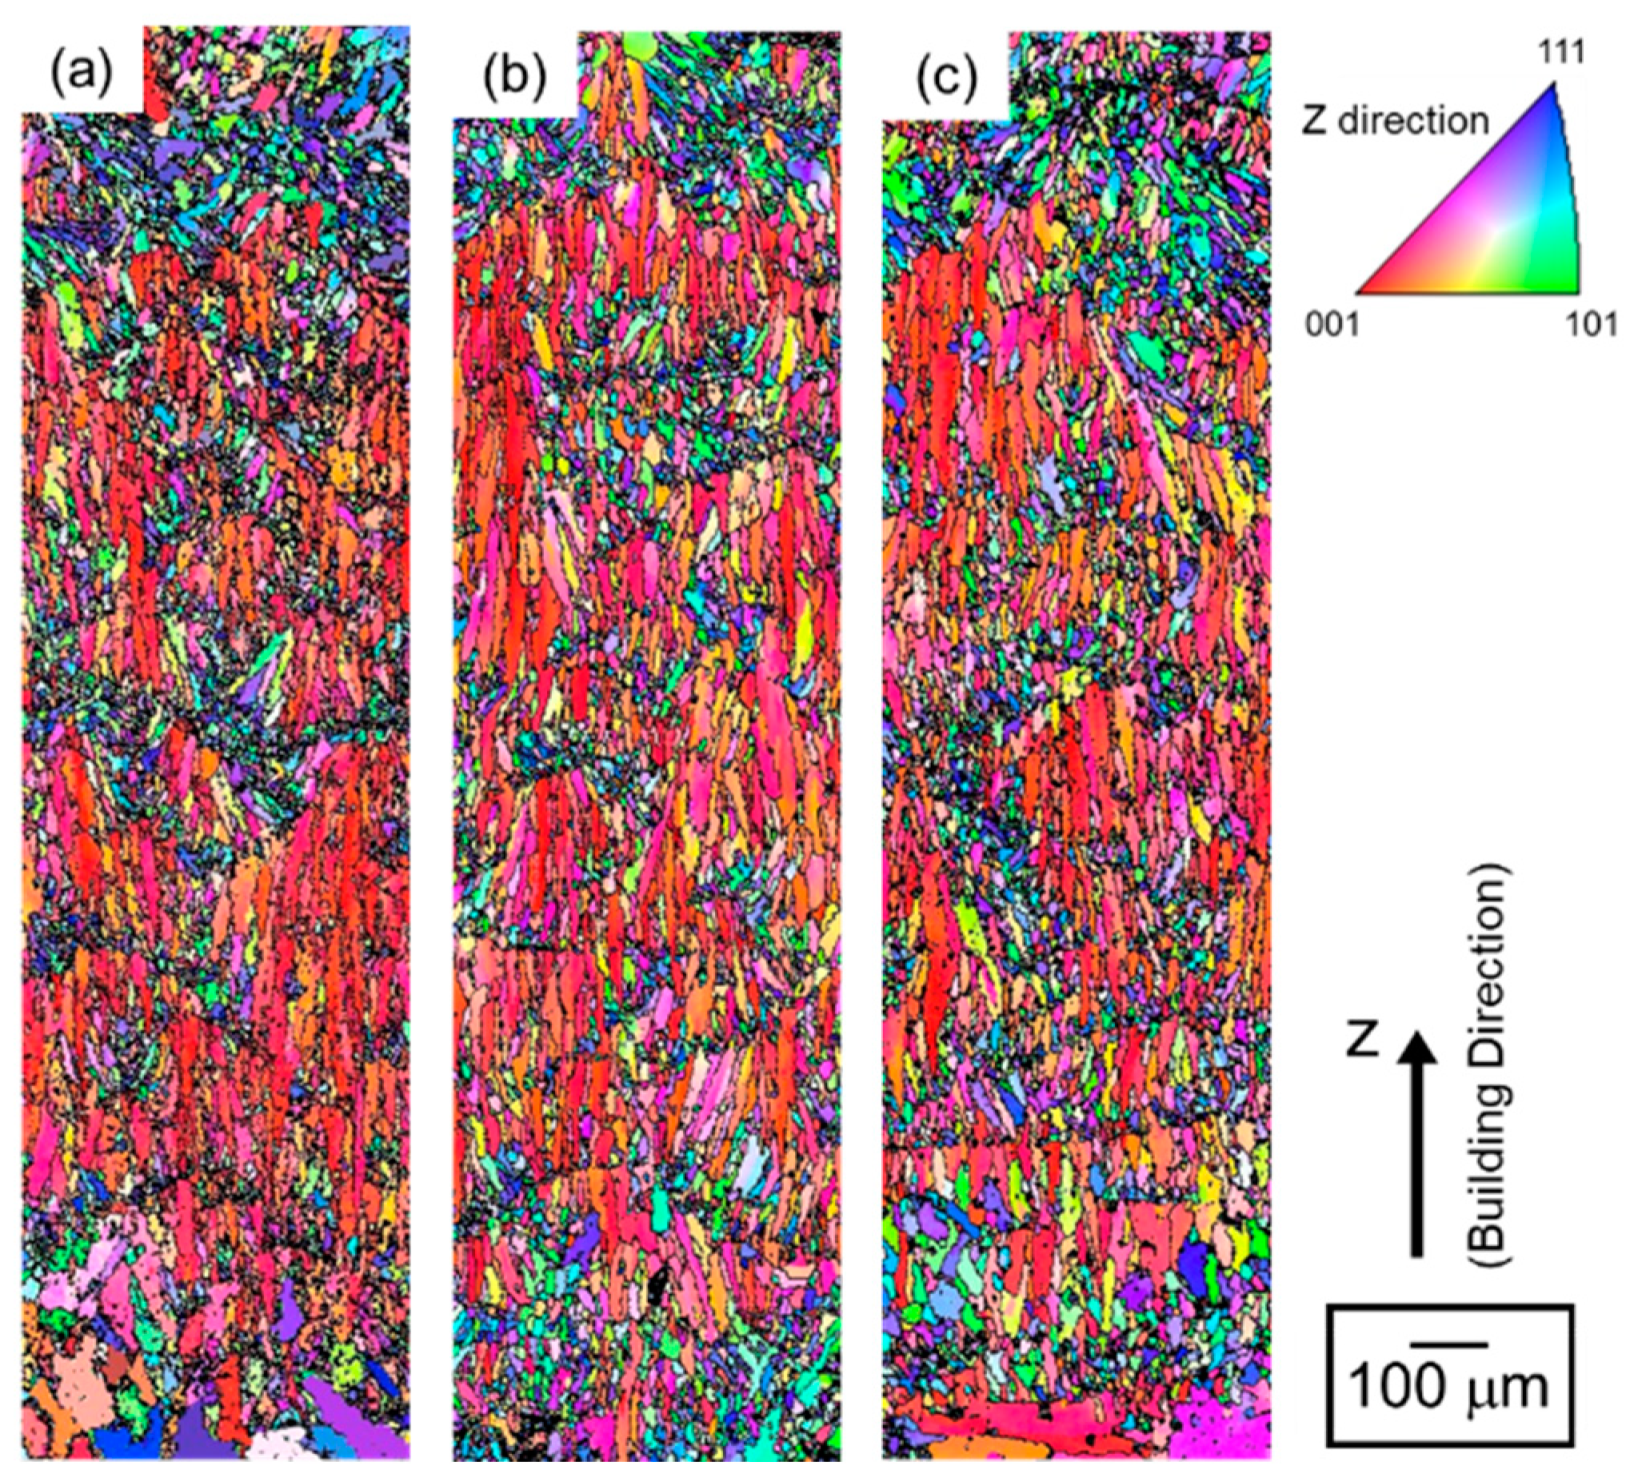
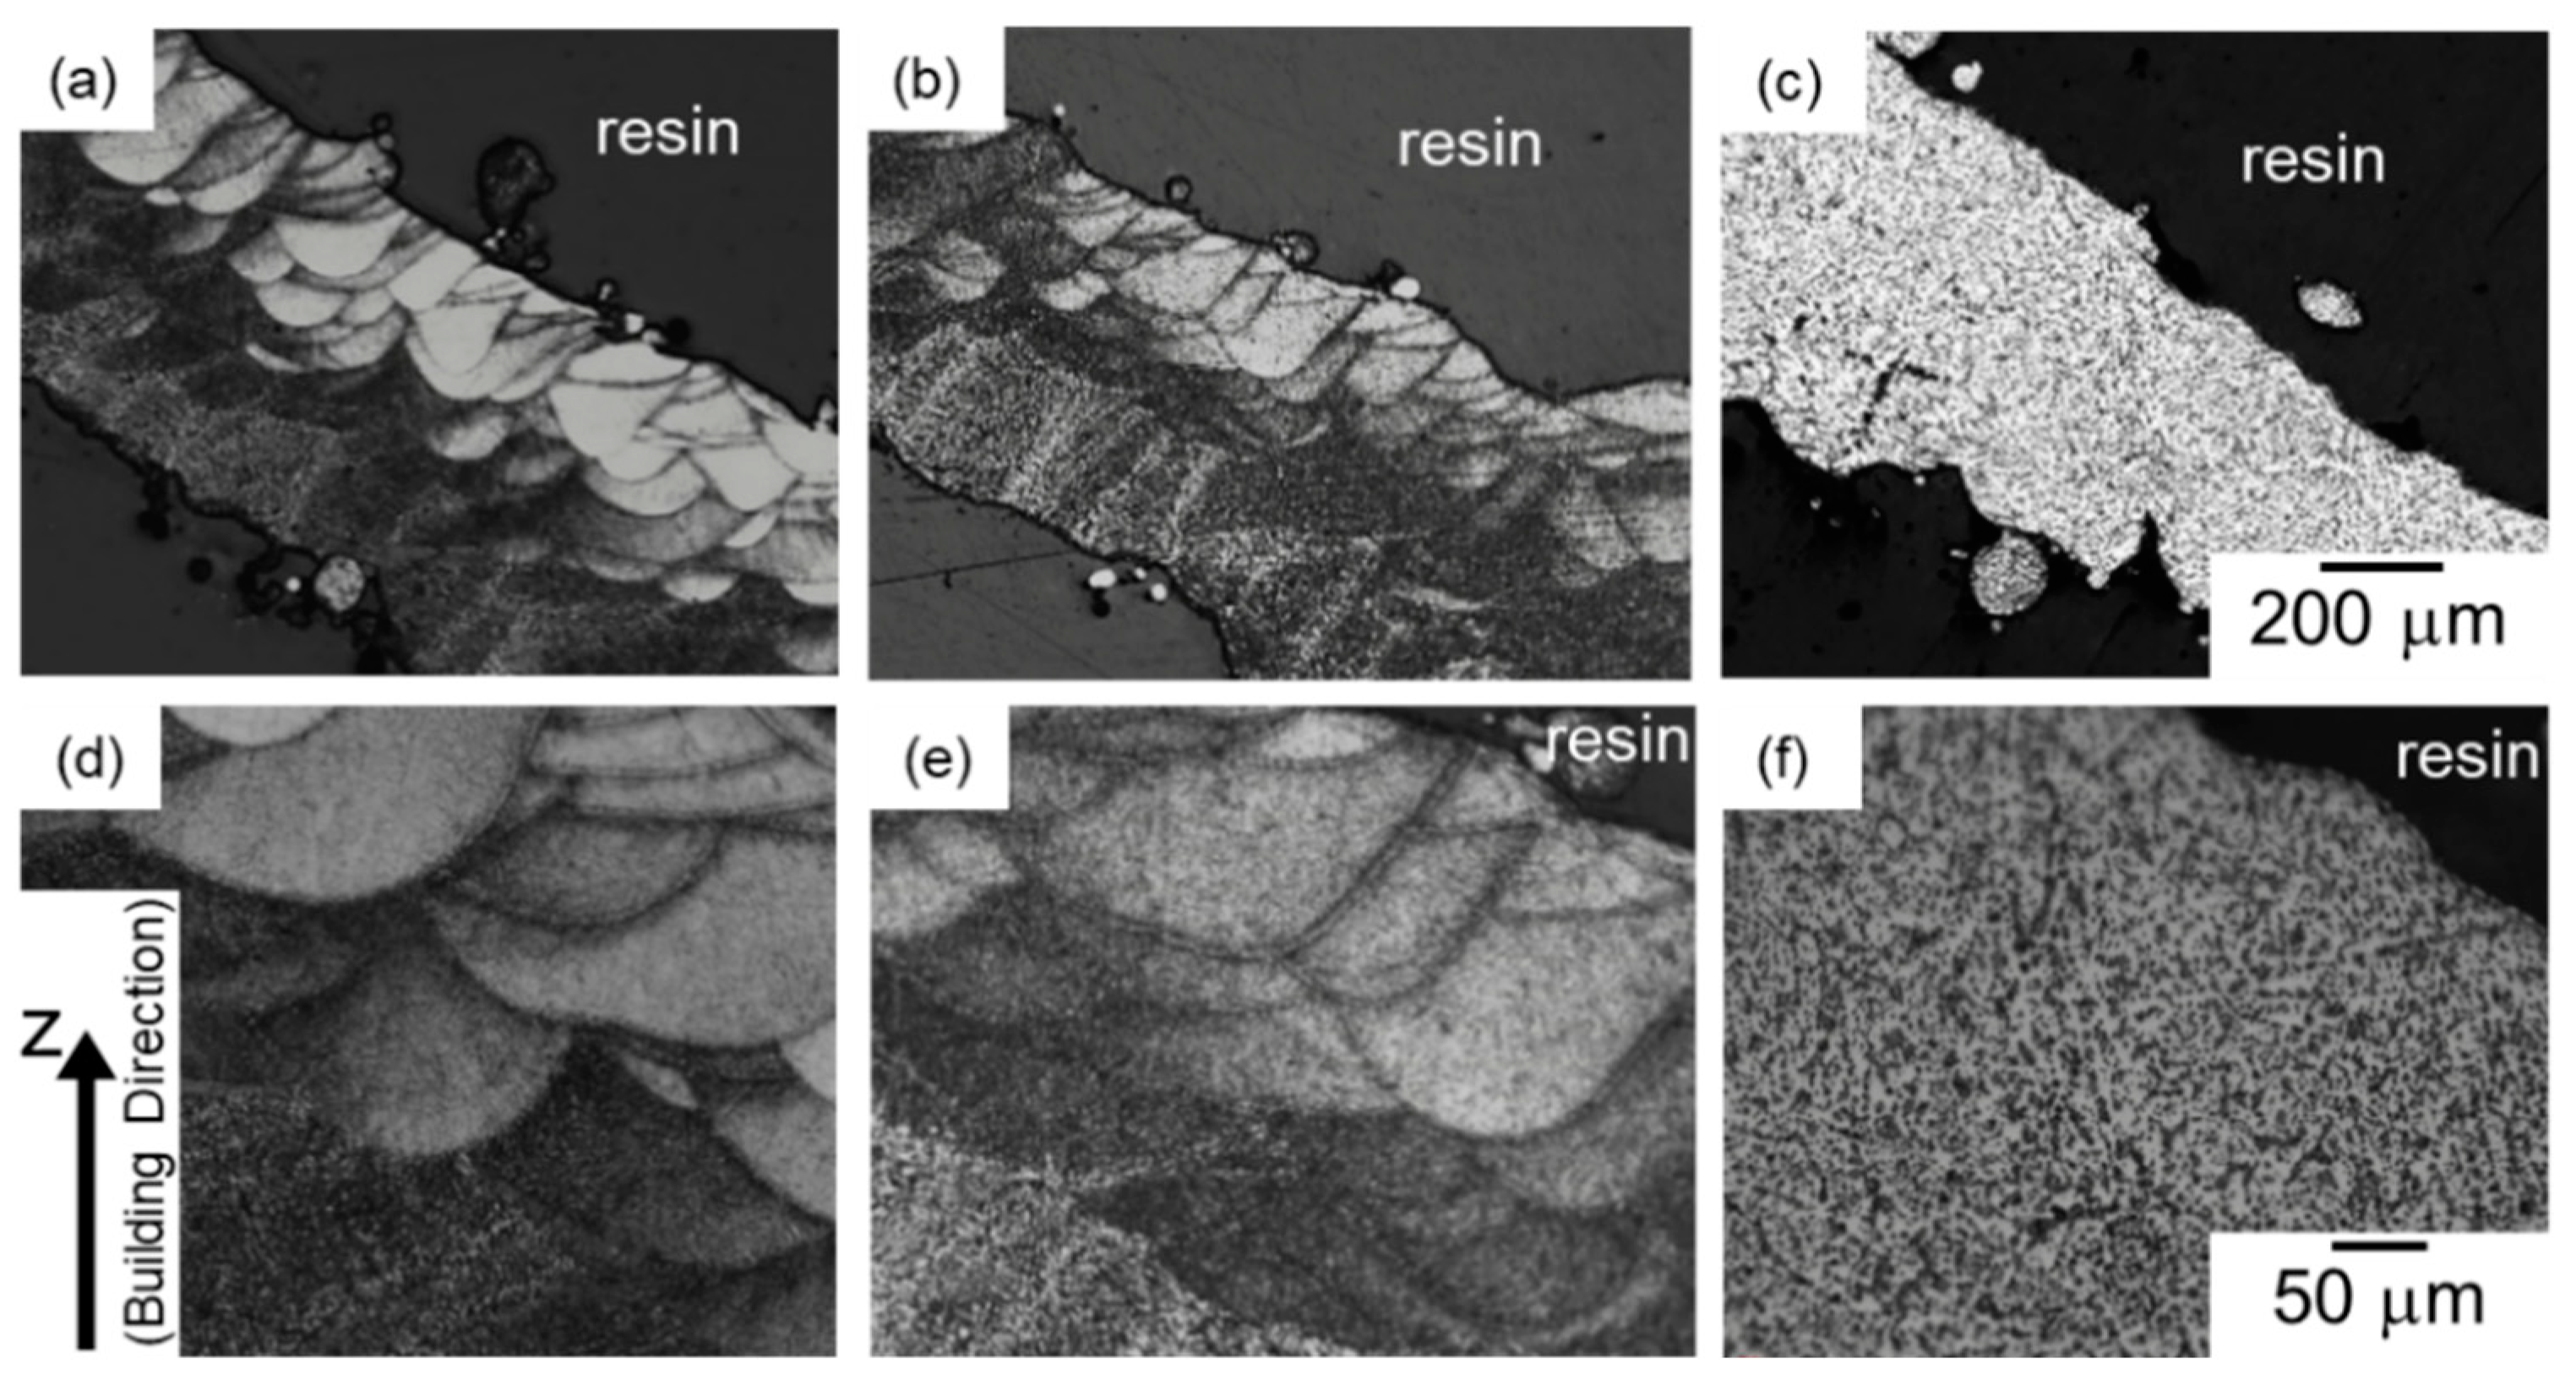
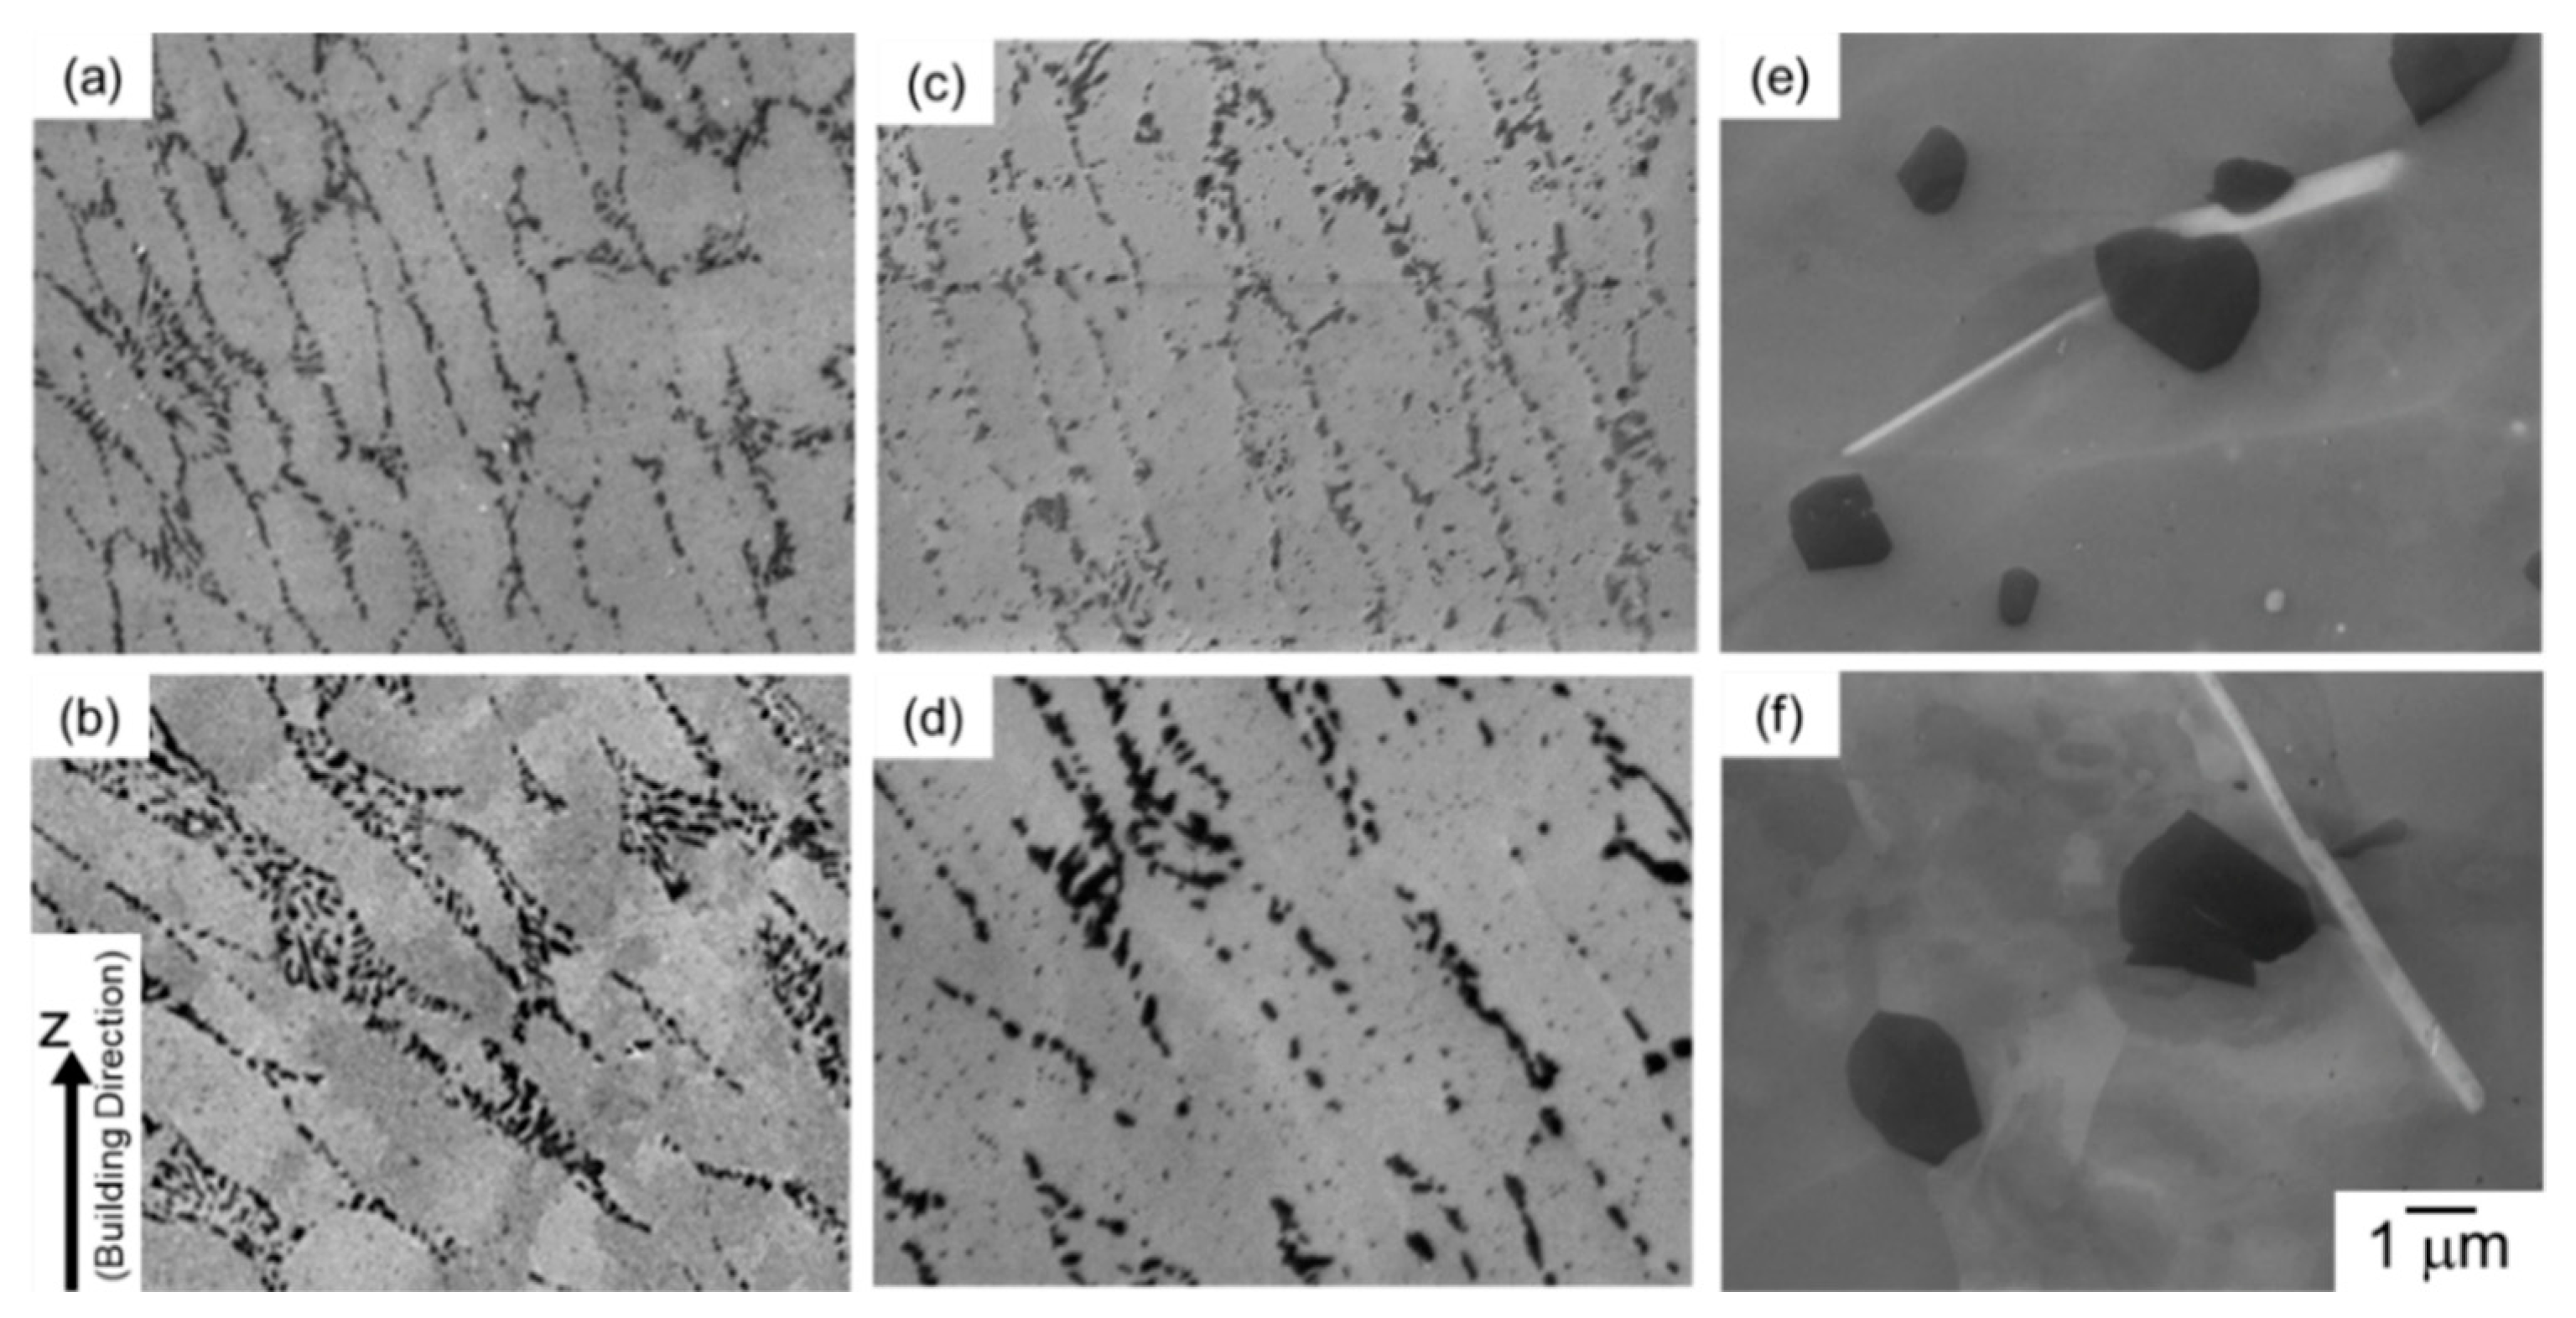
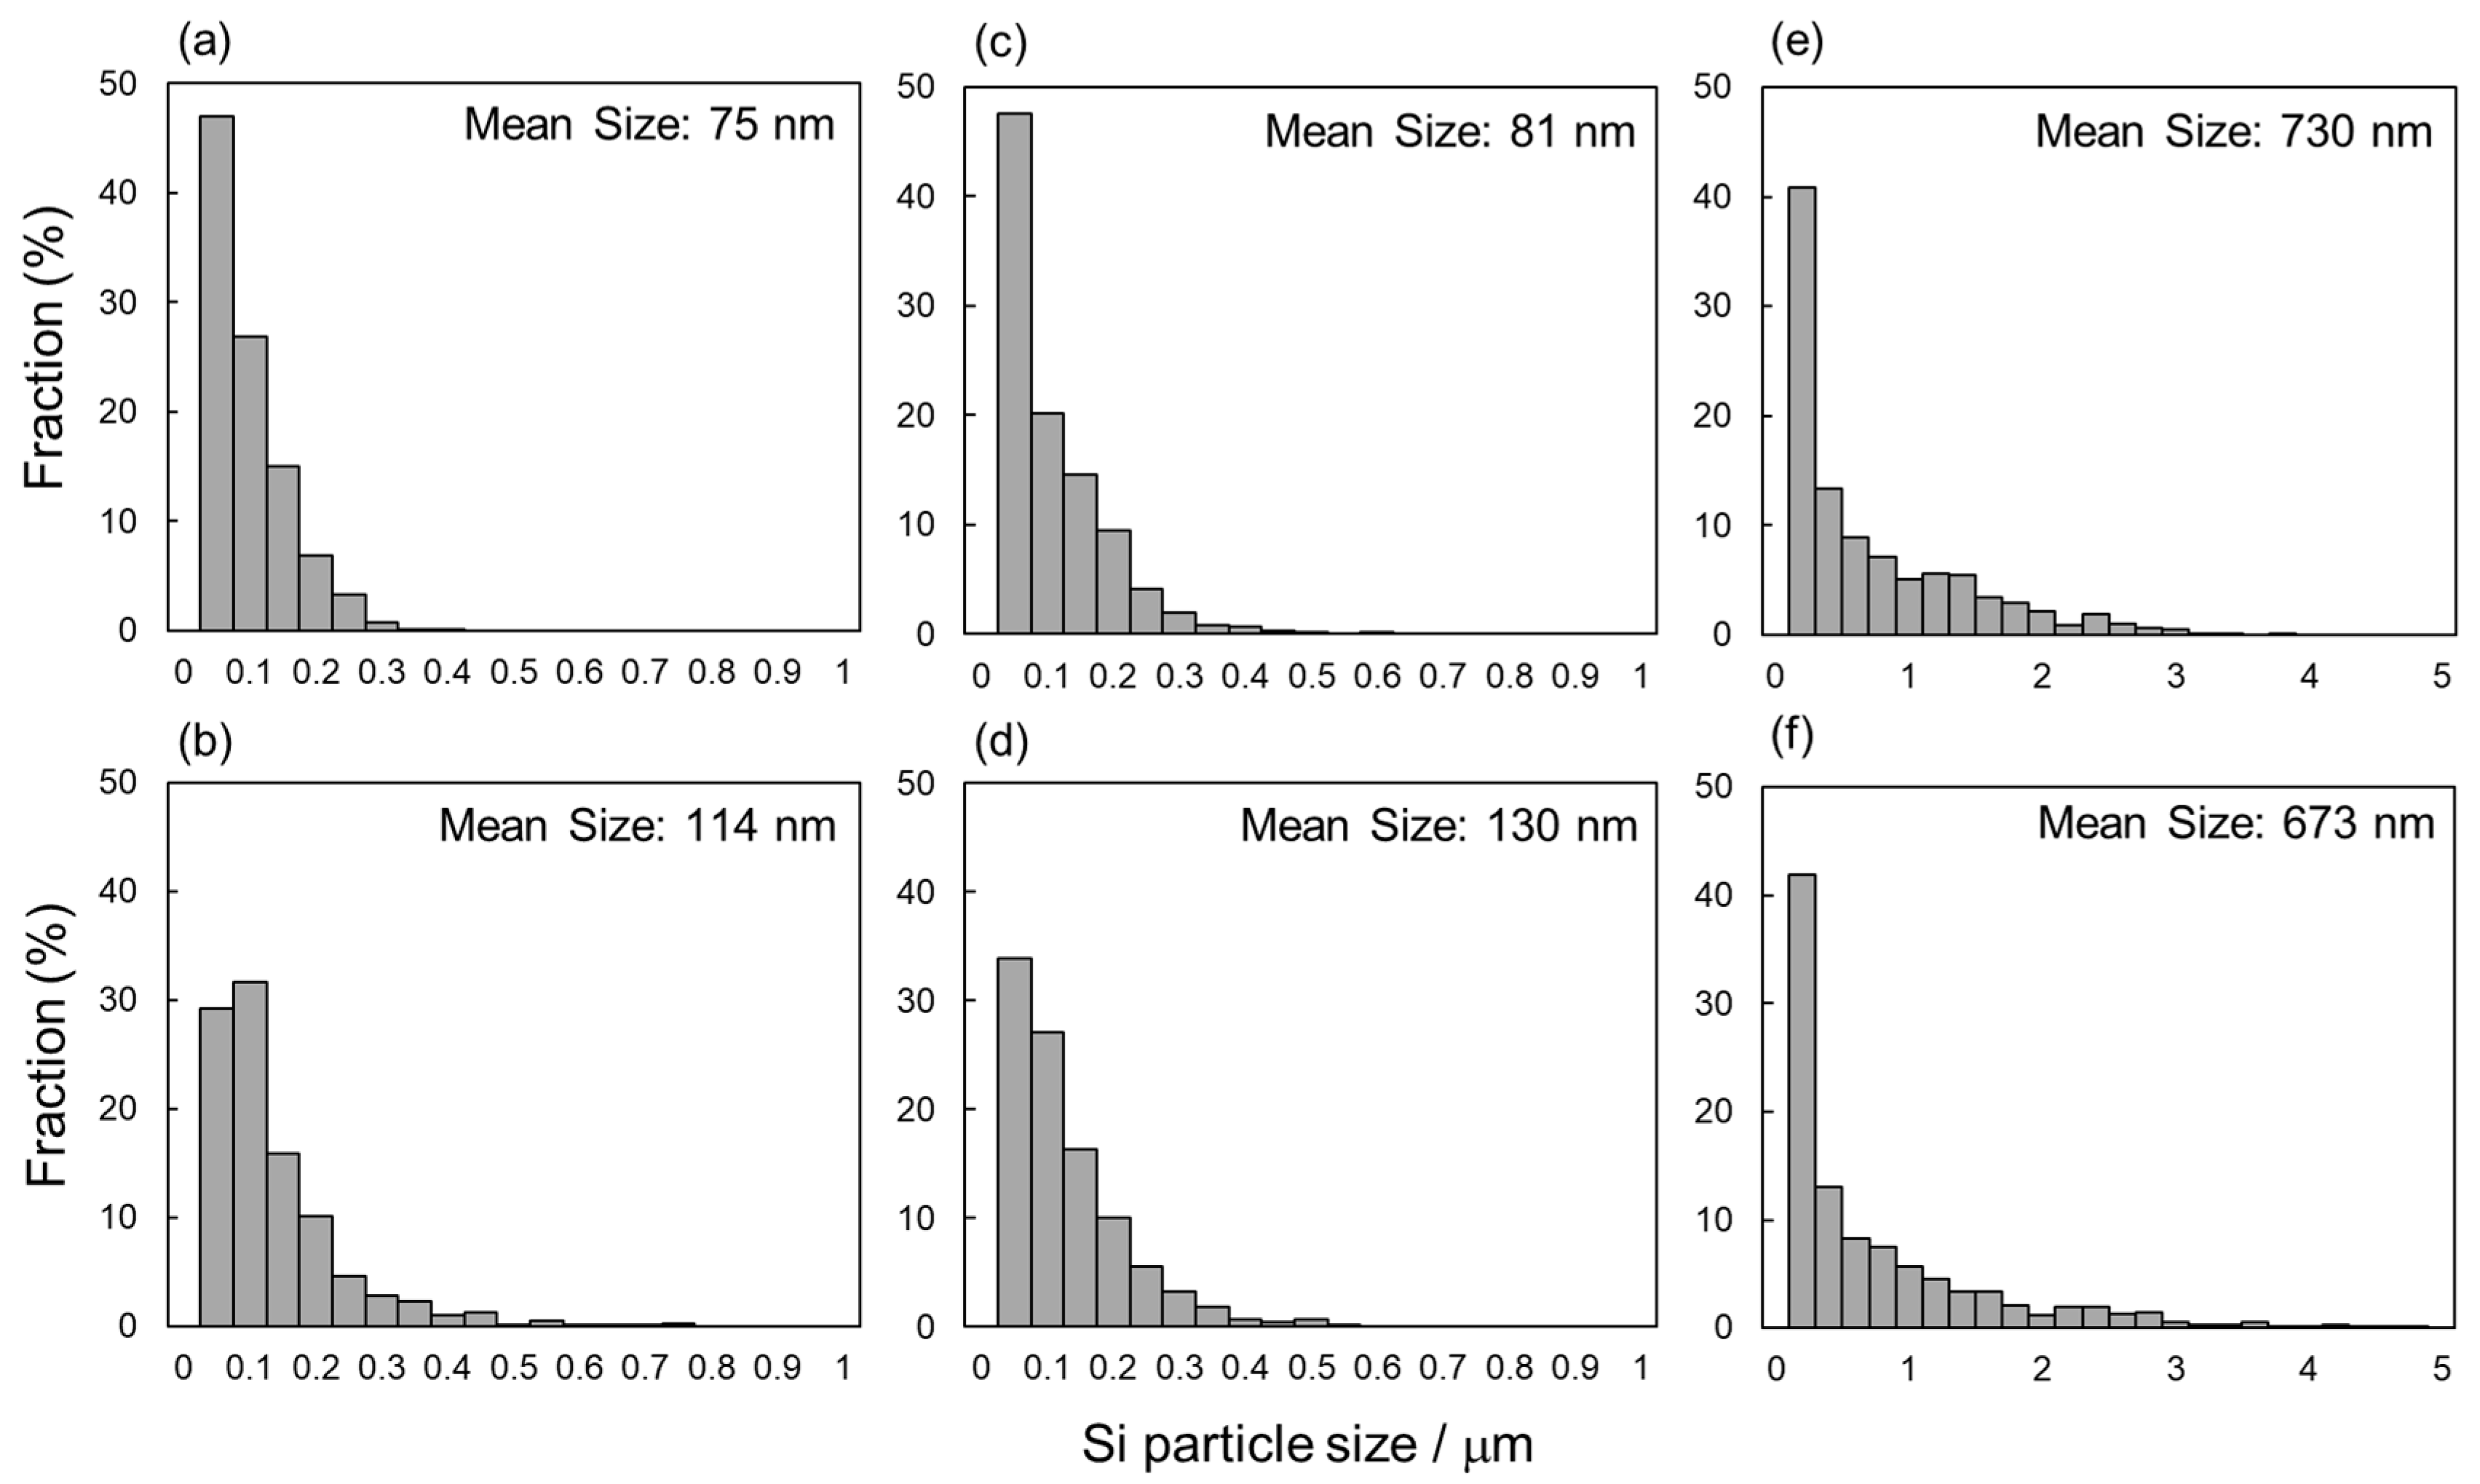
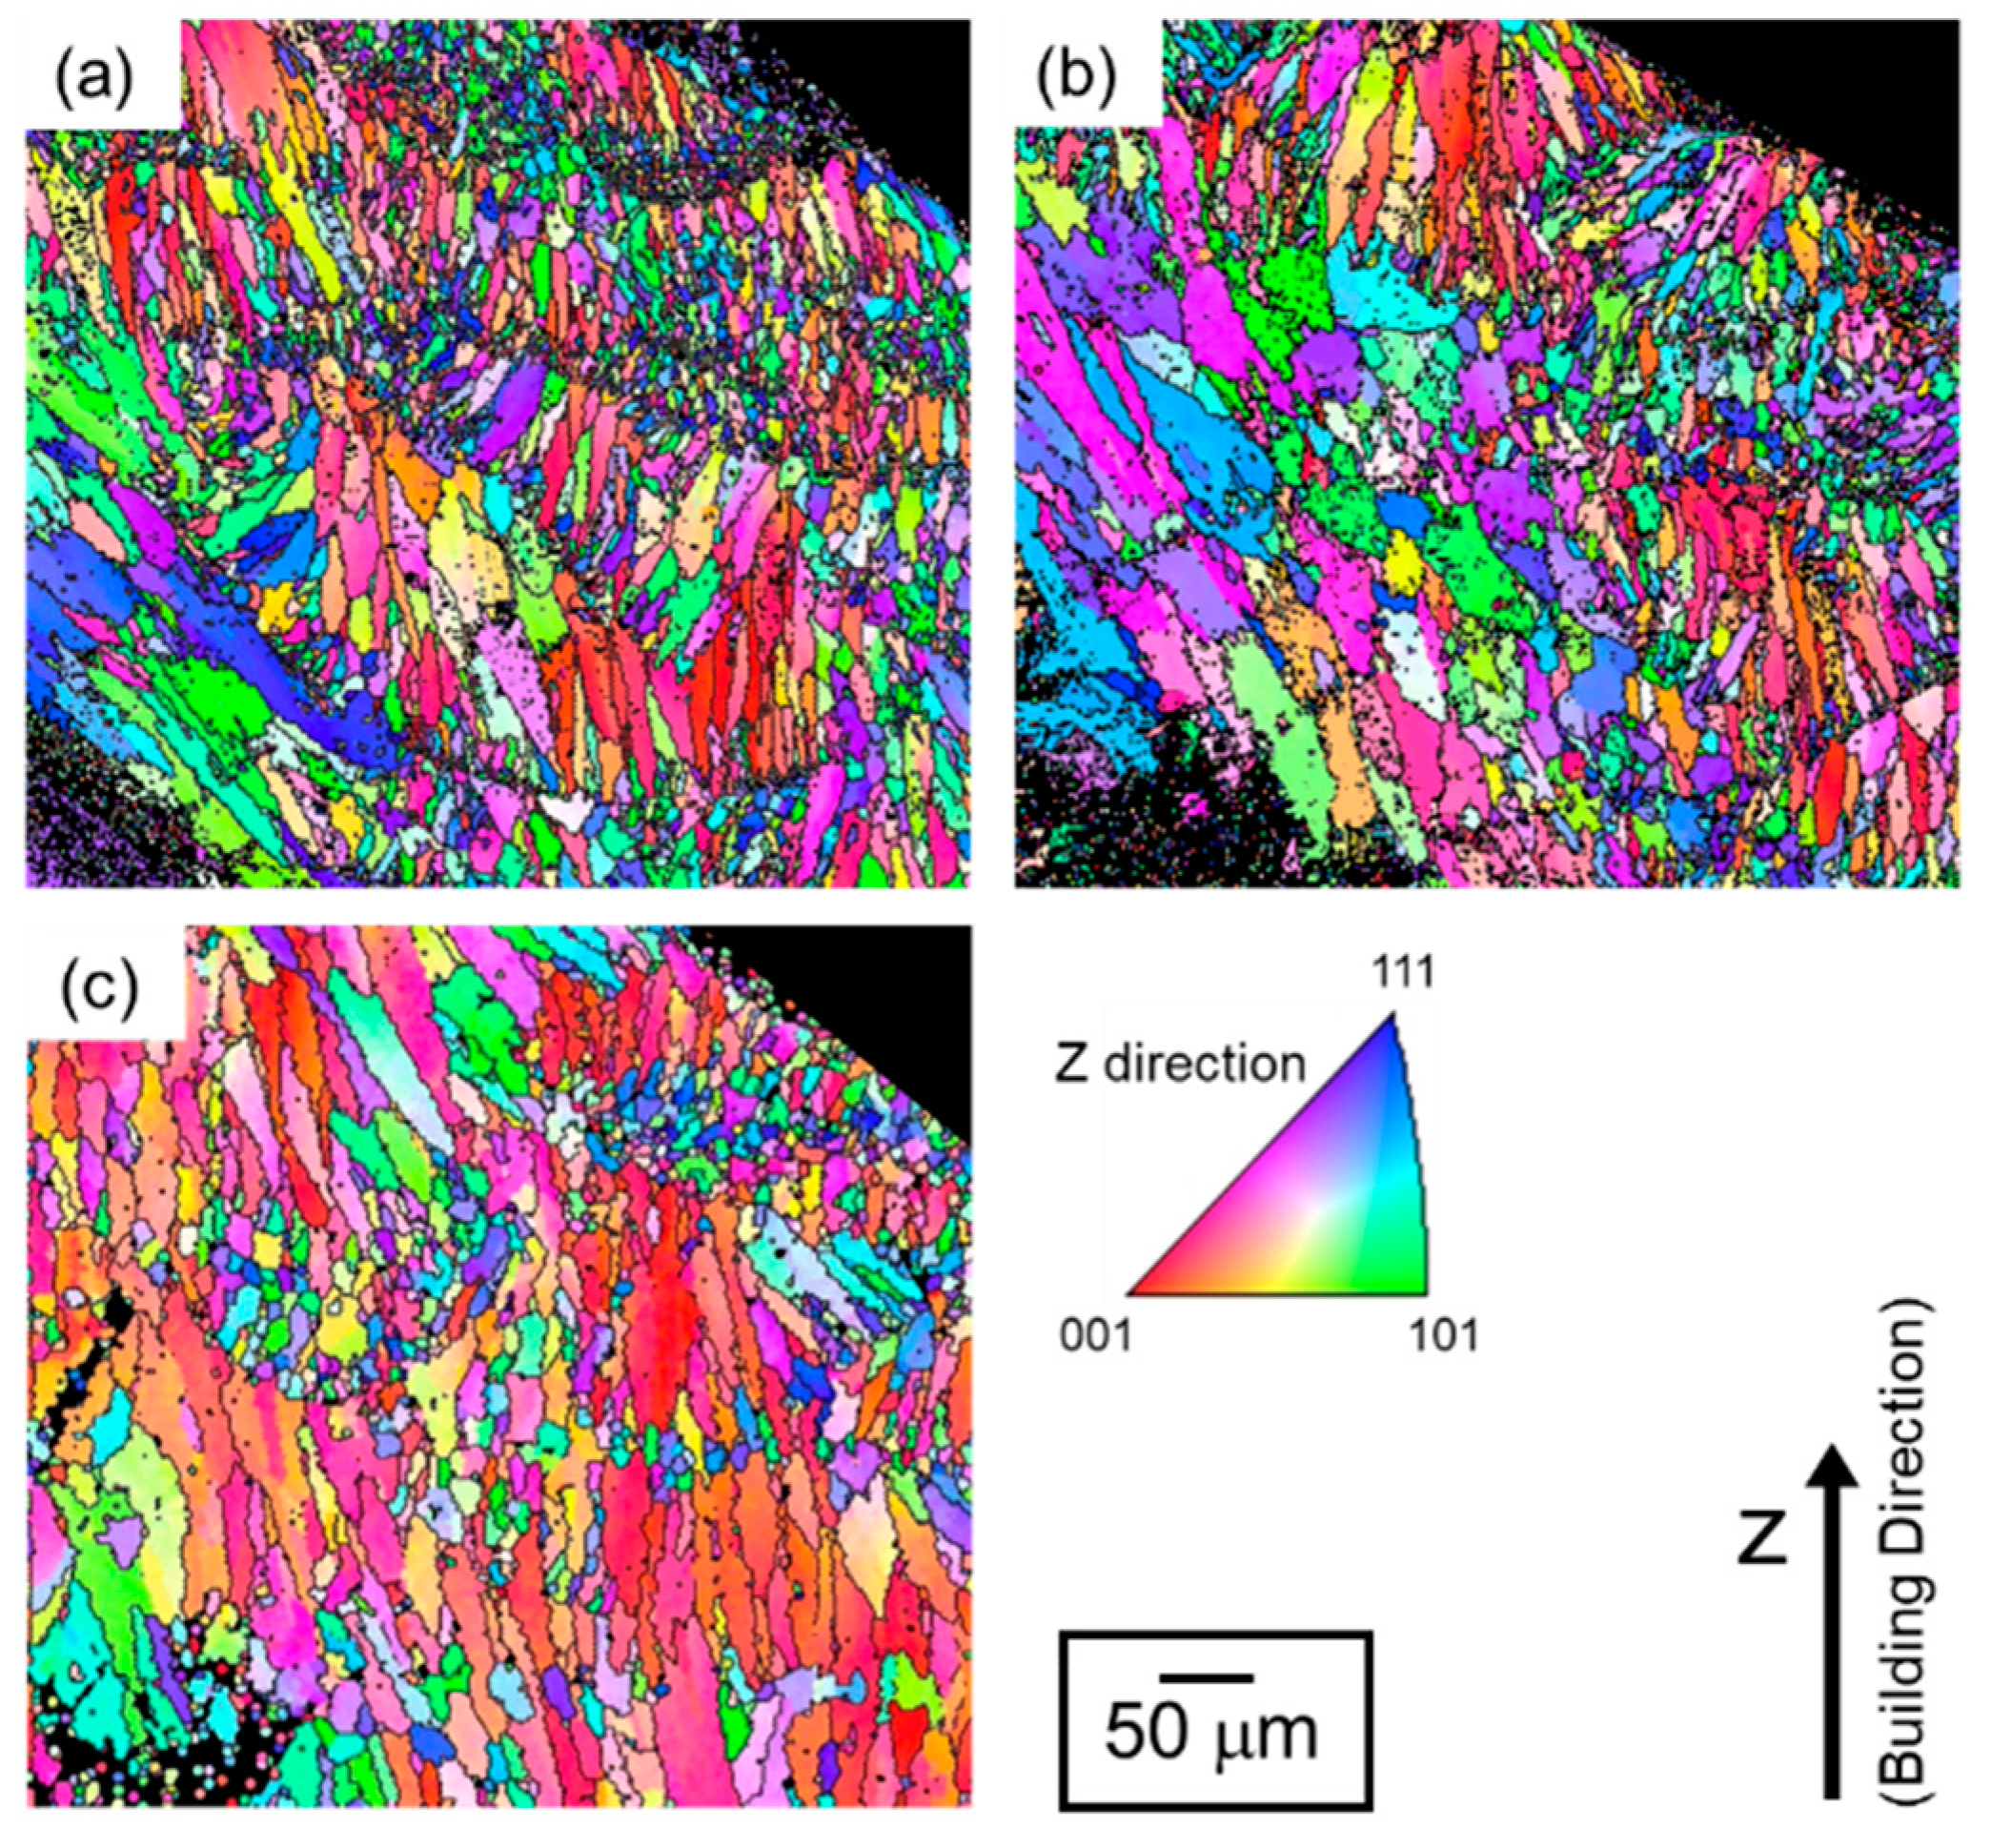
3.1. Node Portions in Lattice Structure
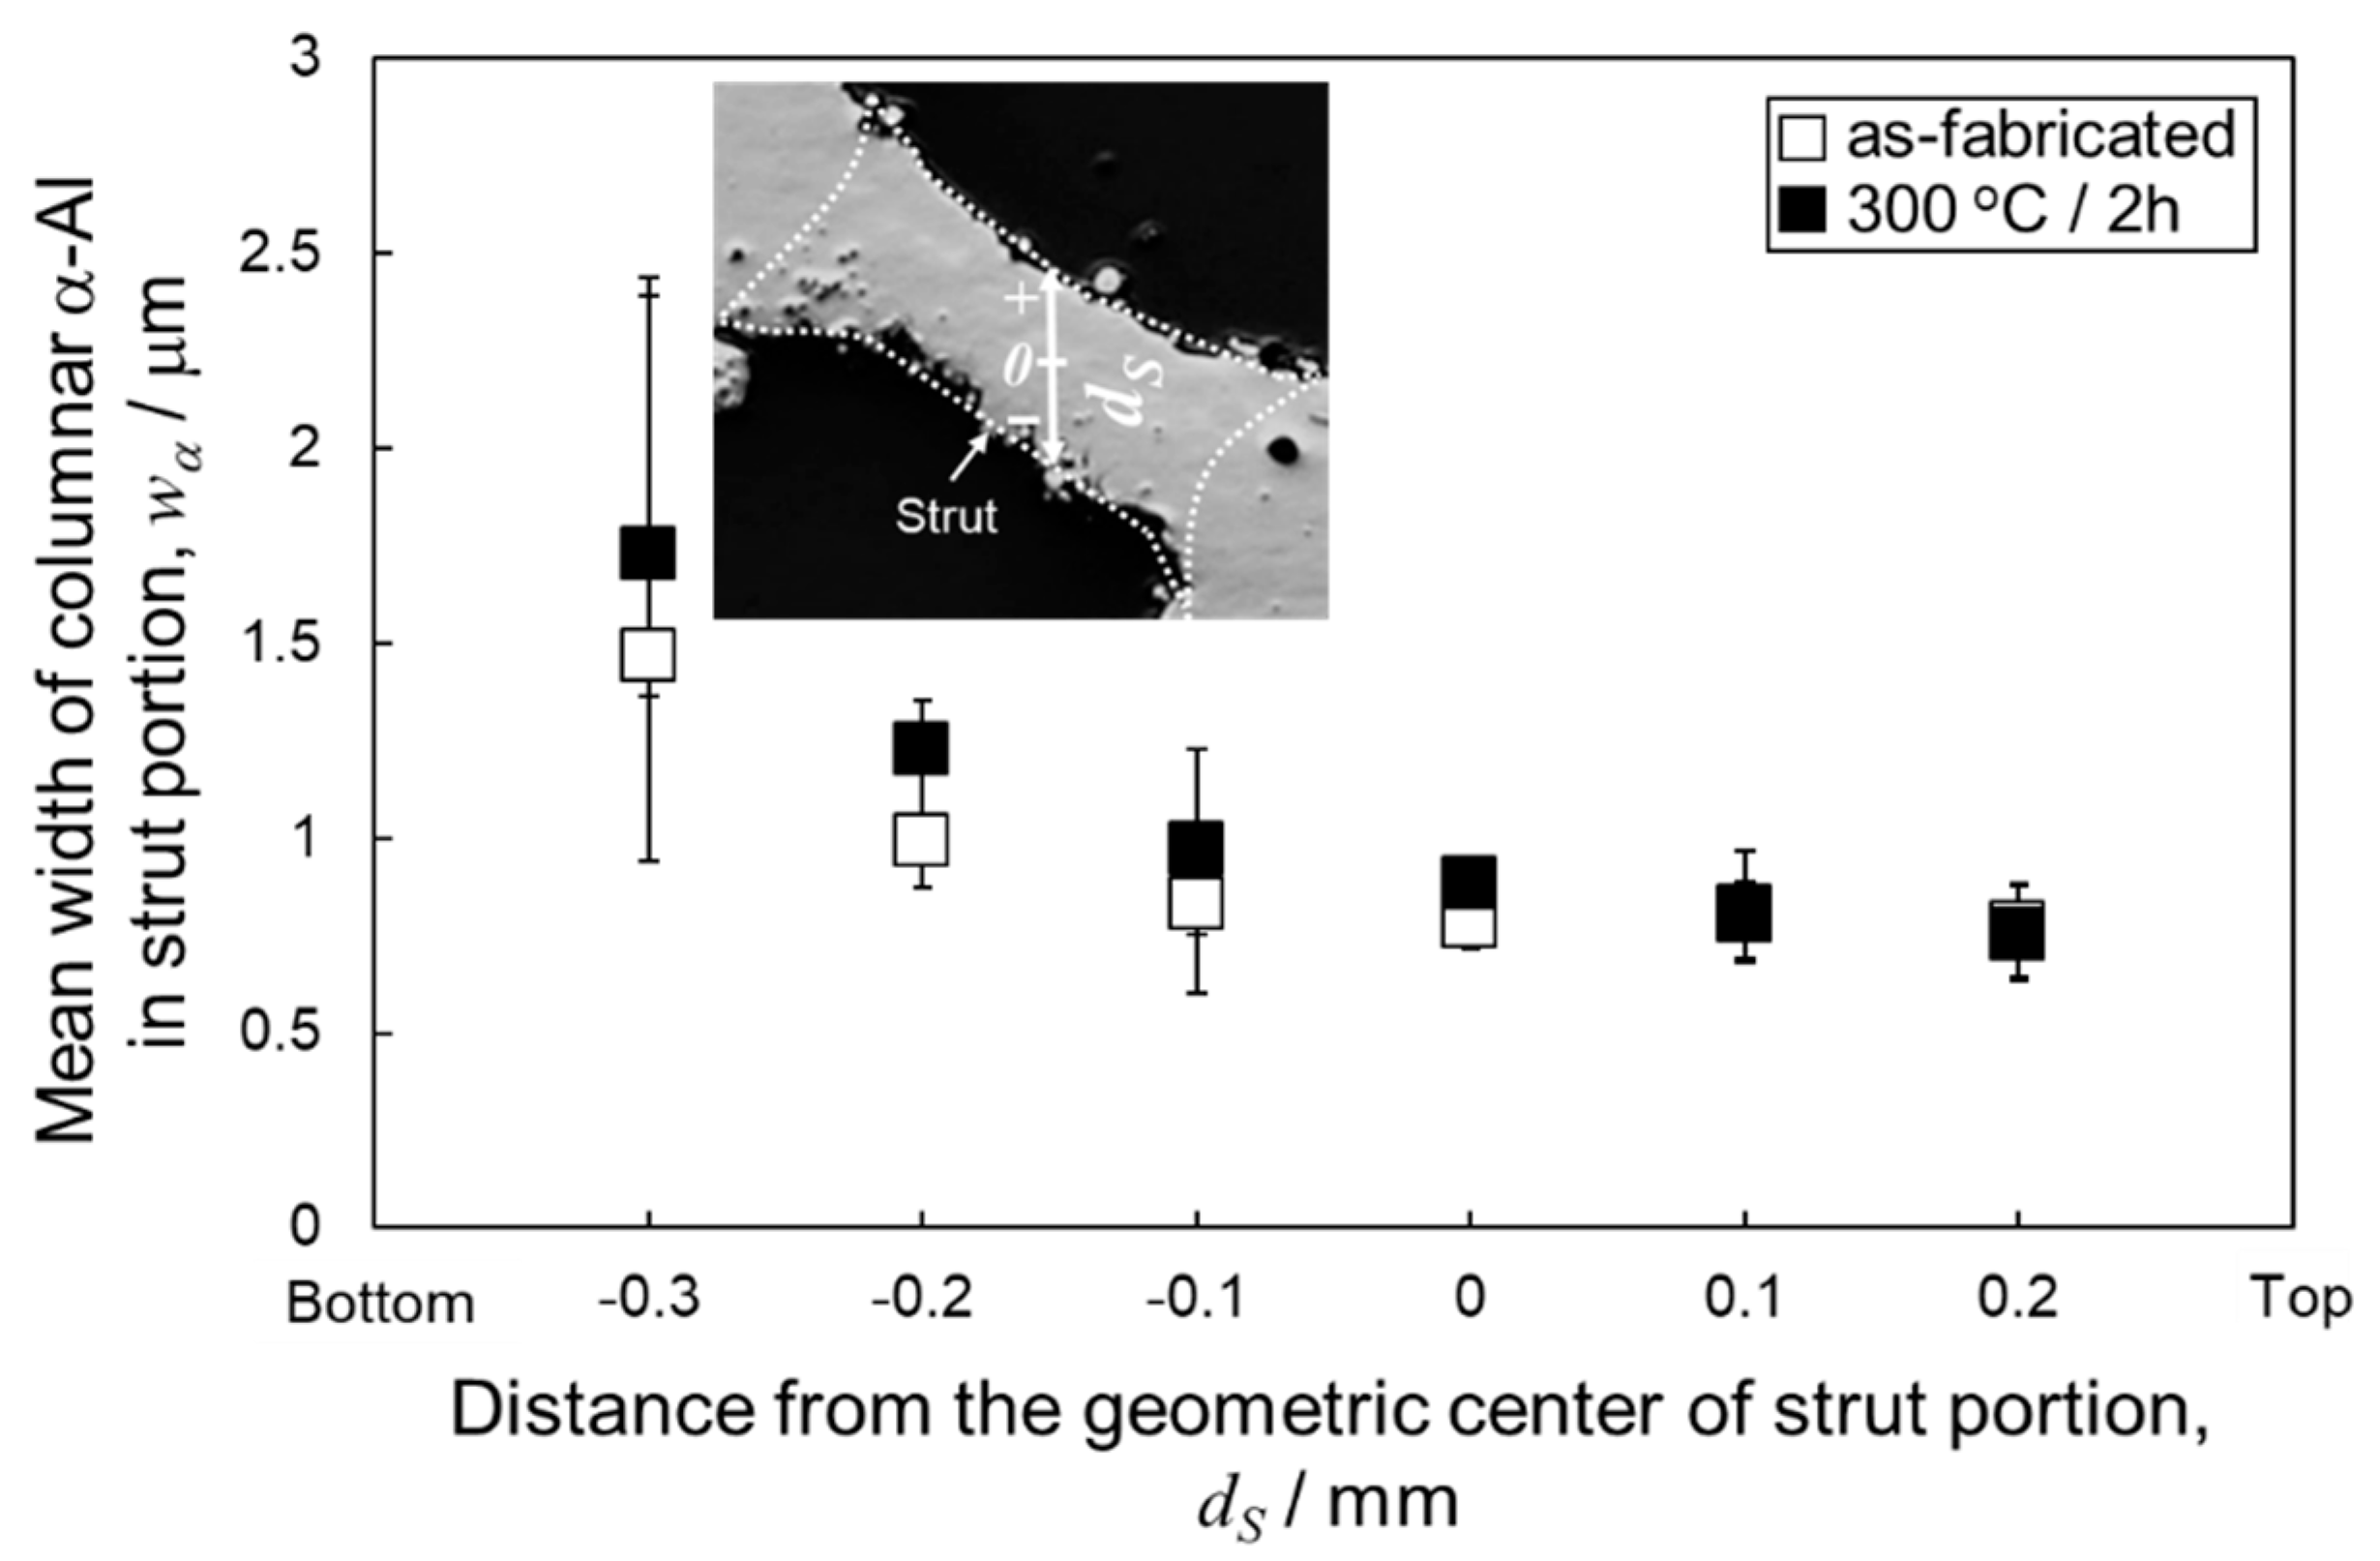
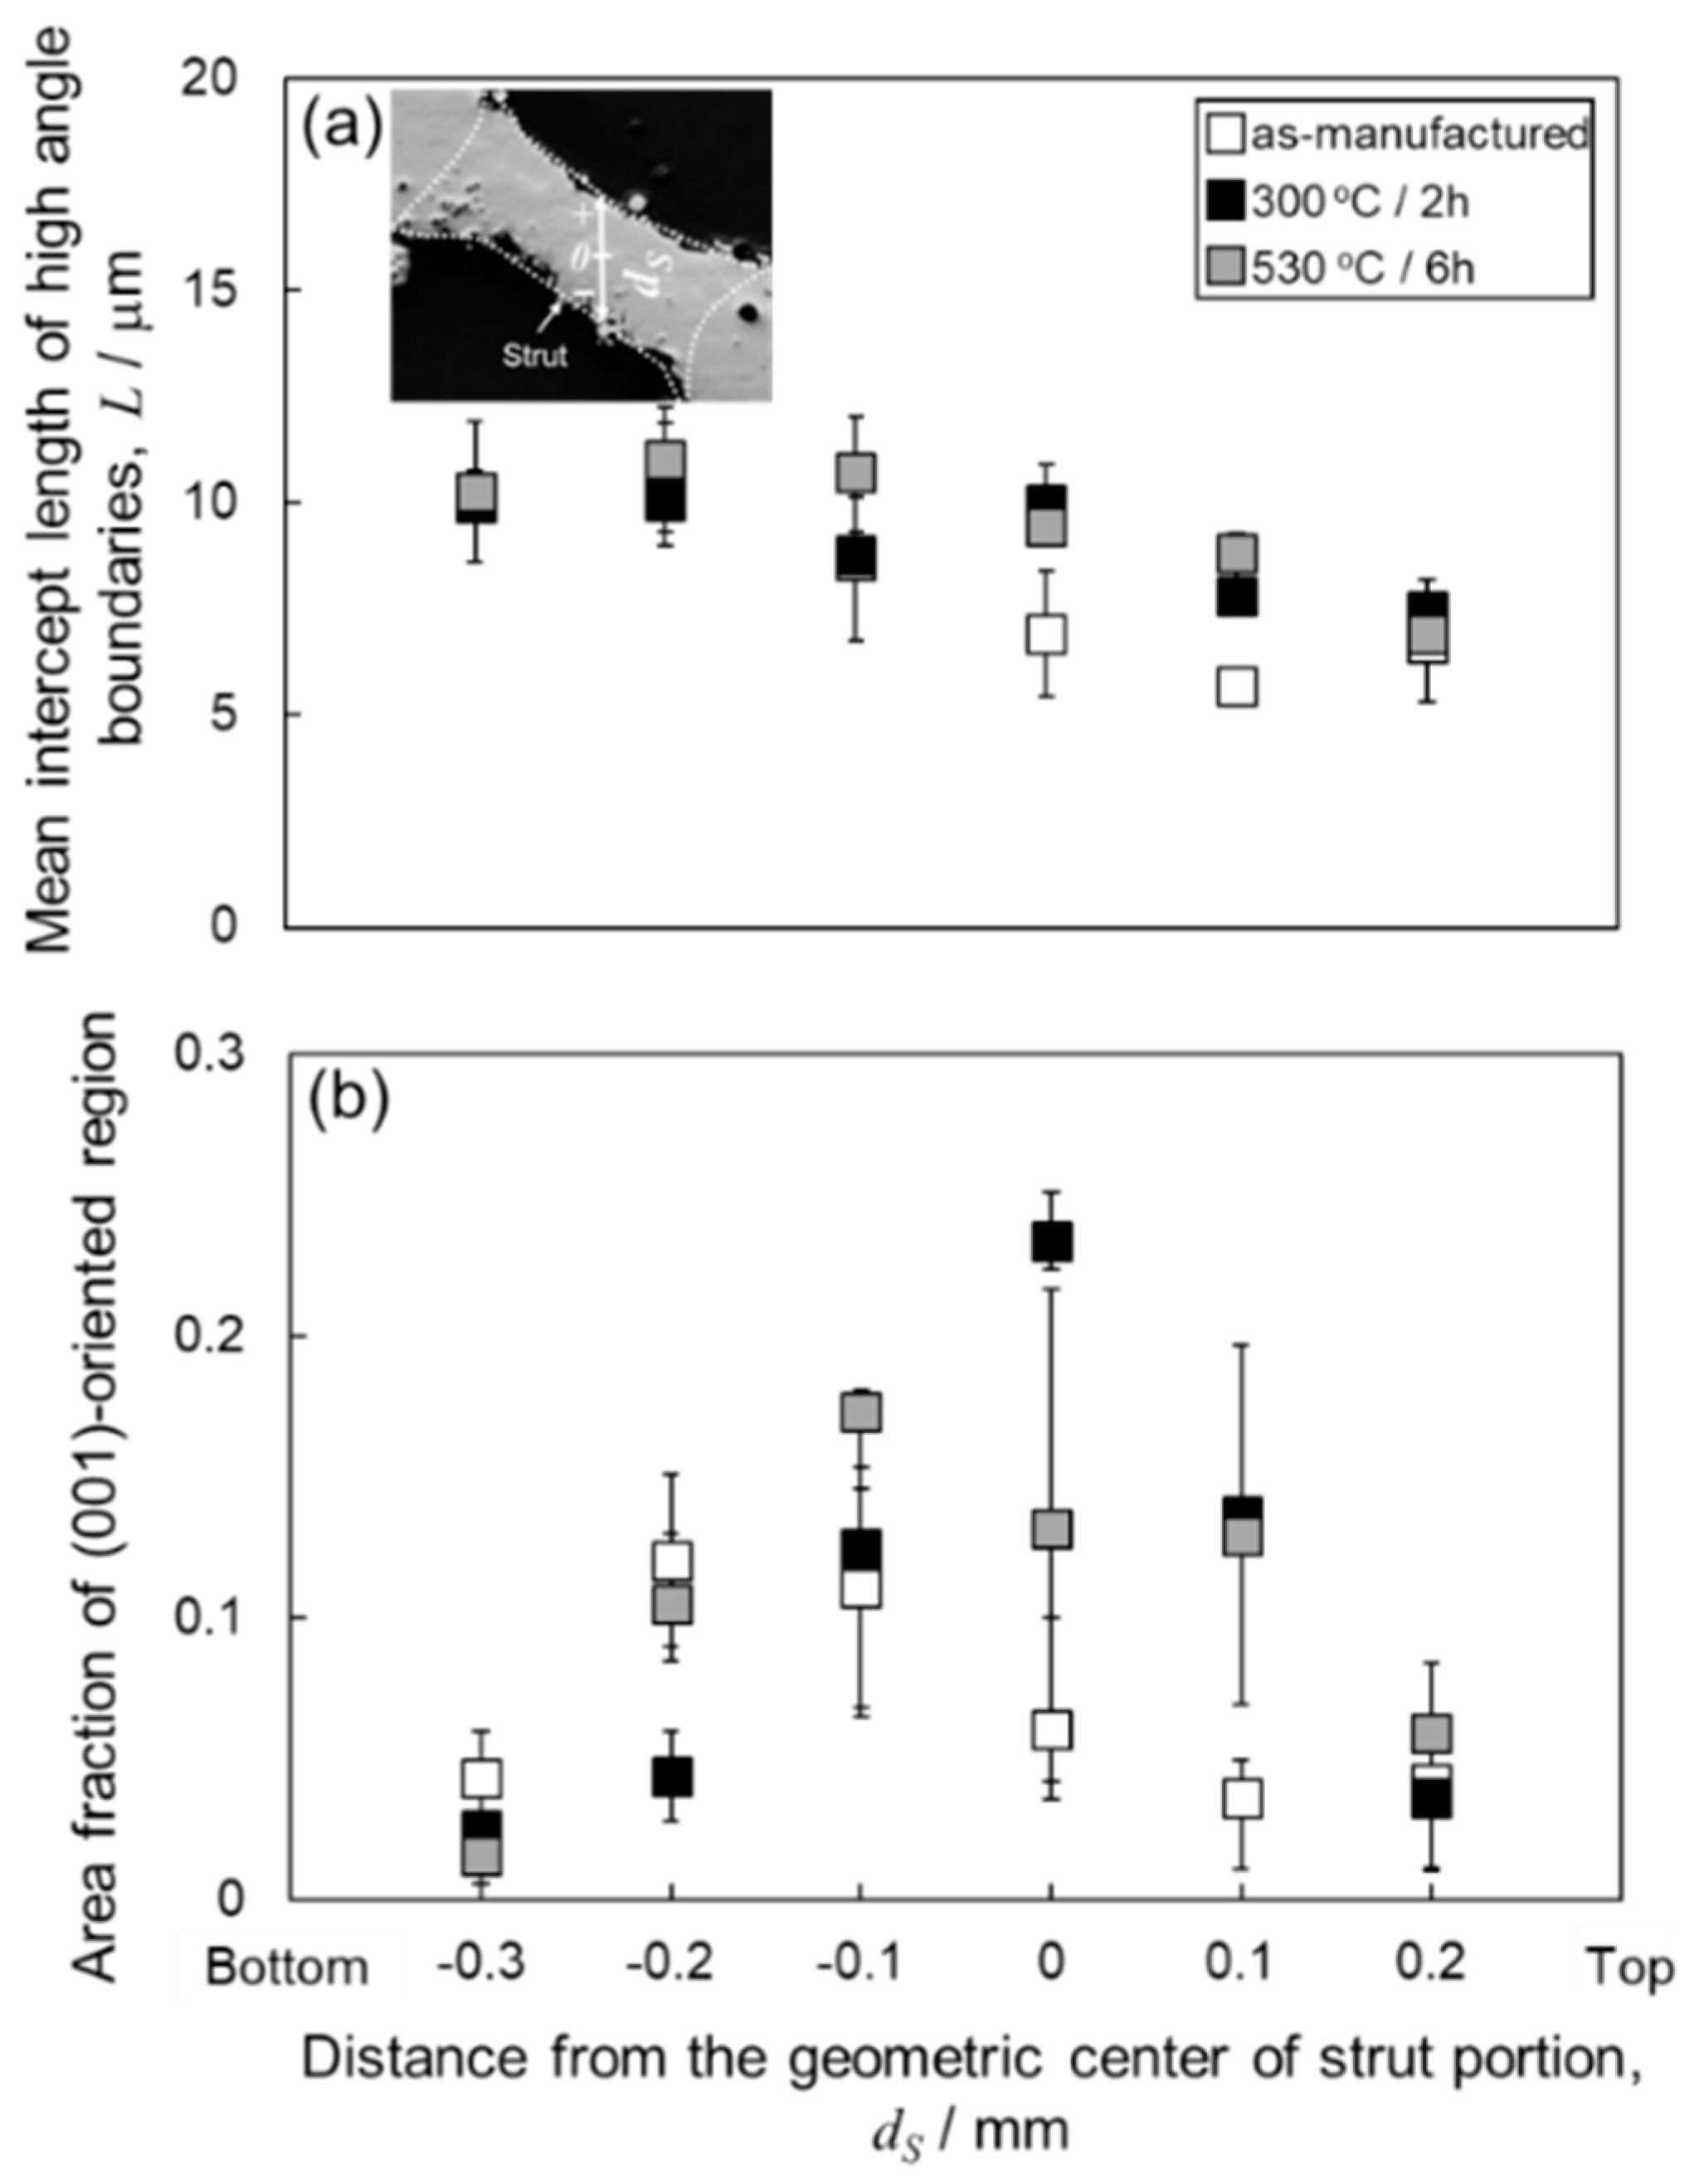
3.2. Strut Portions in Lattice Structure
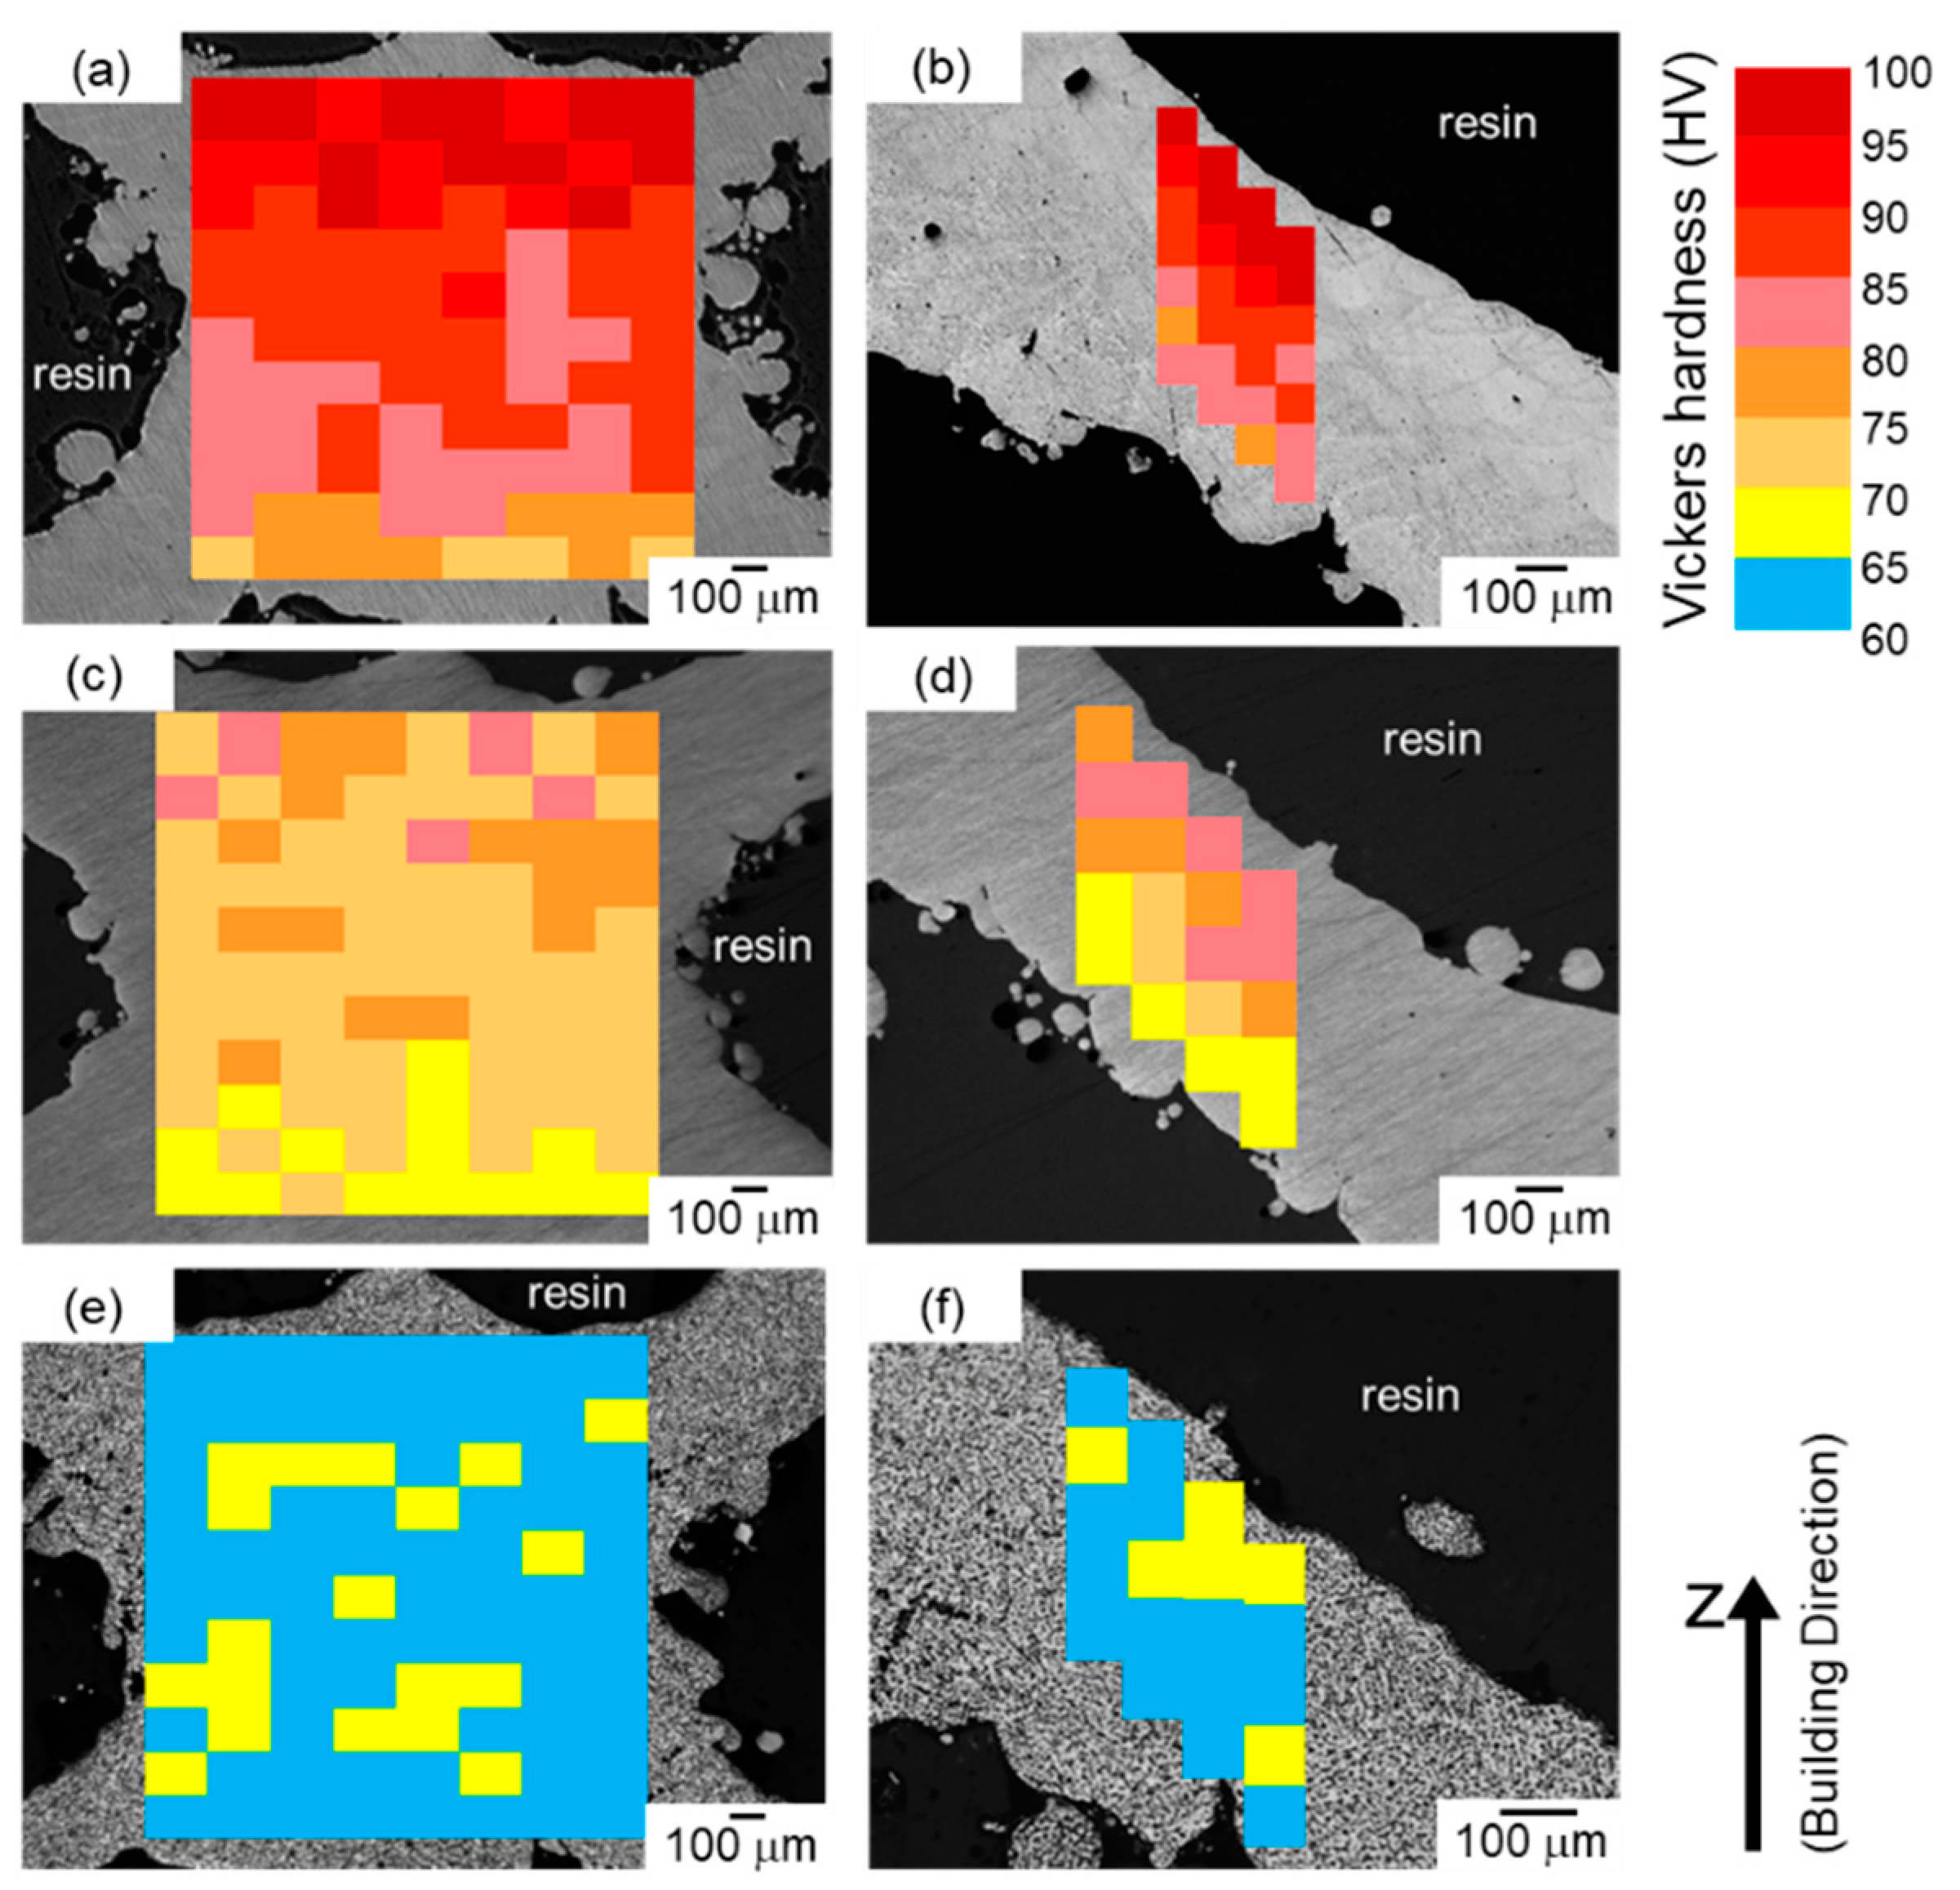
3.3. Microhardness
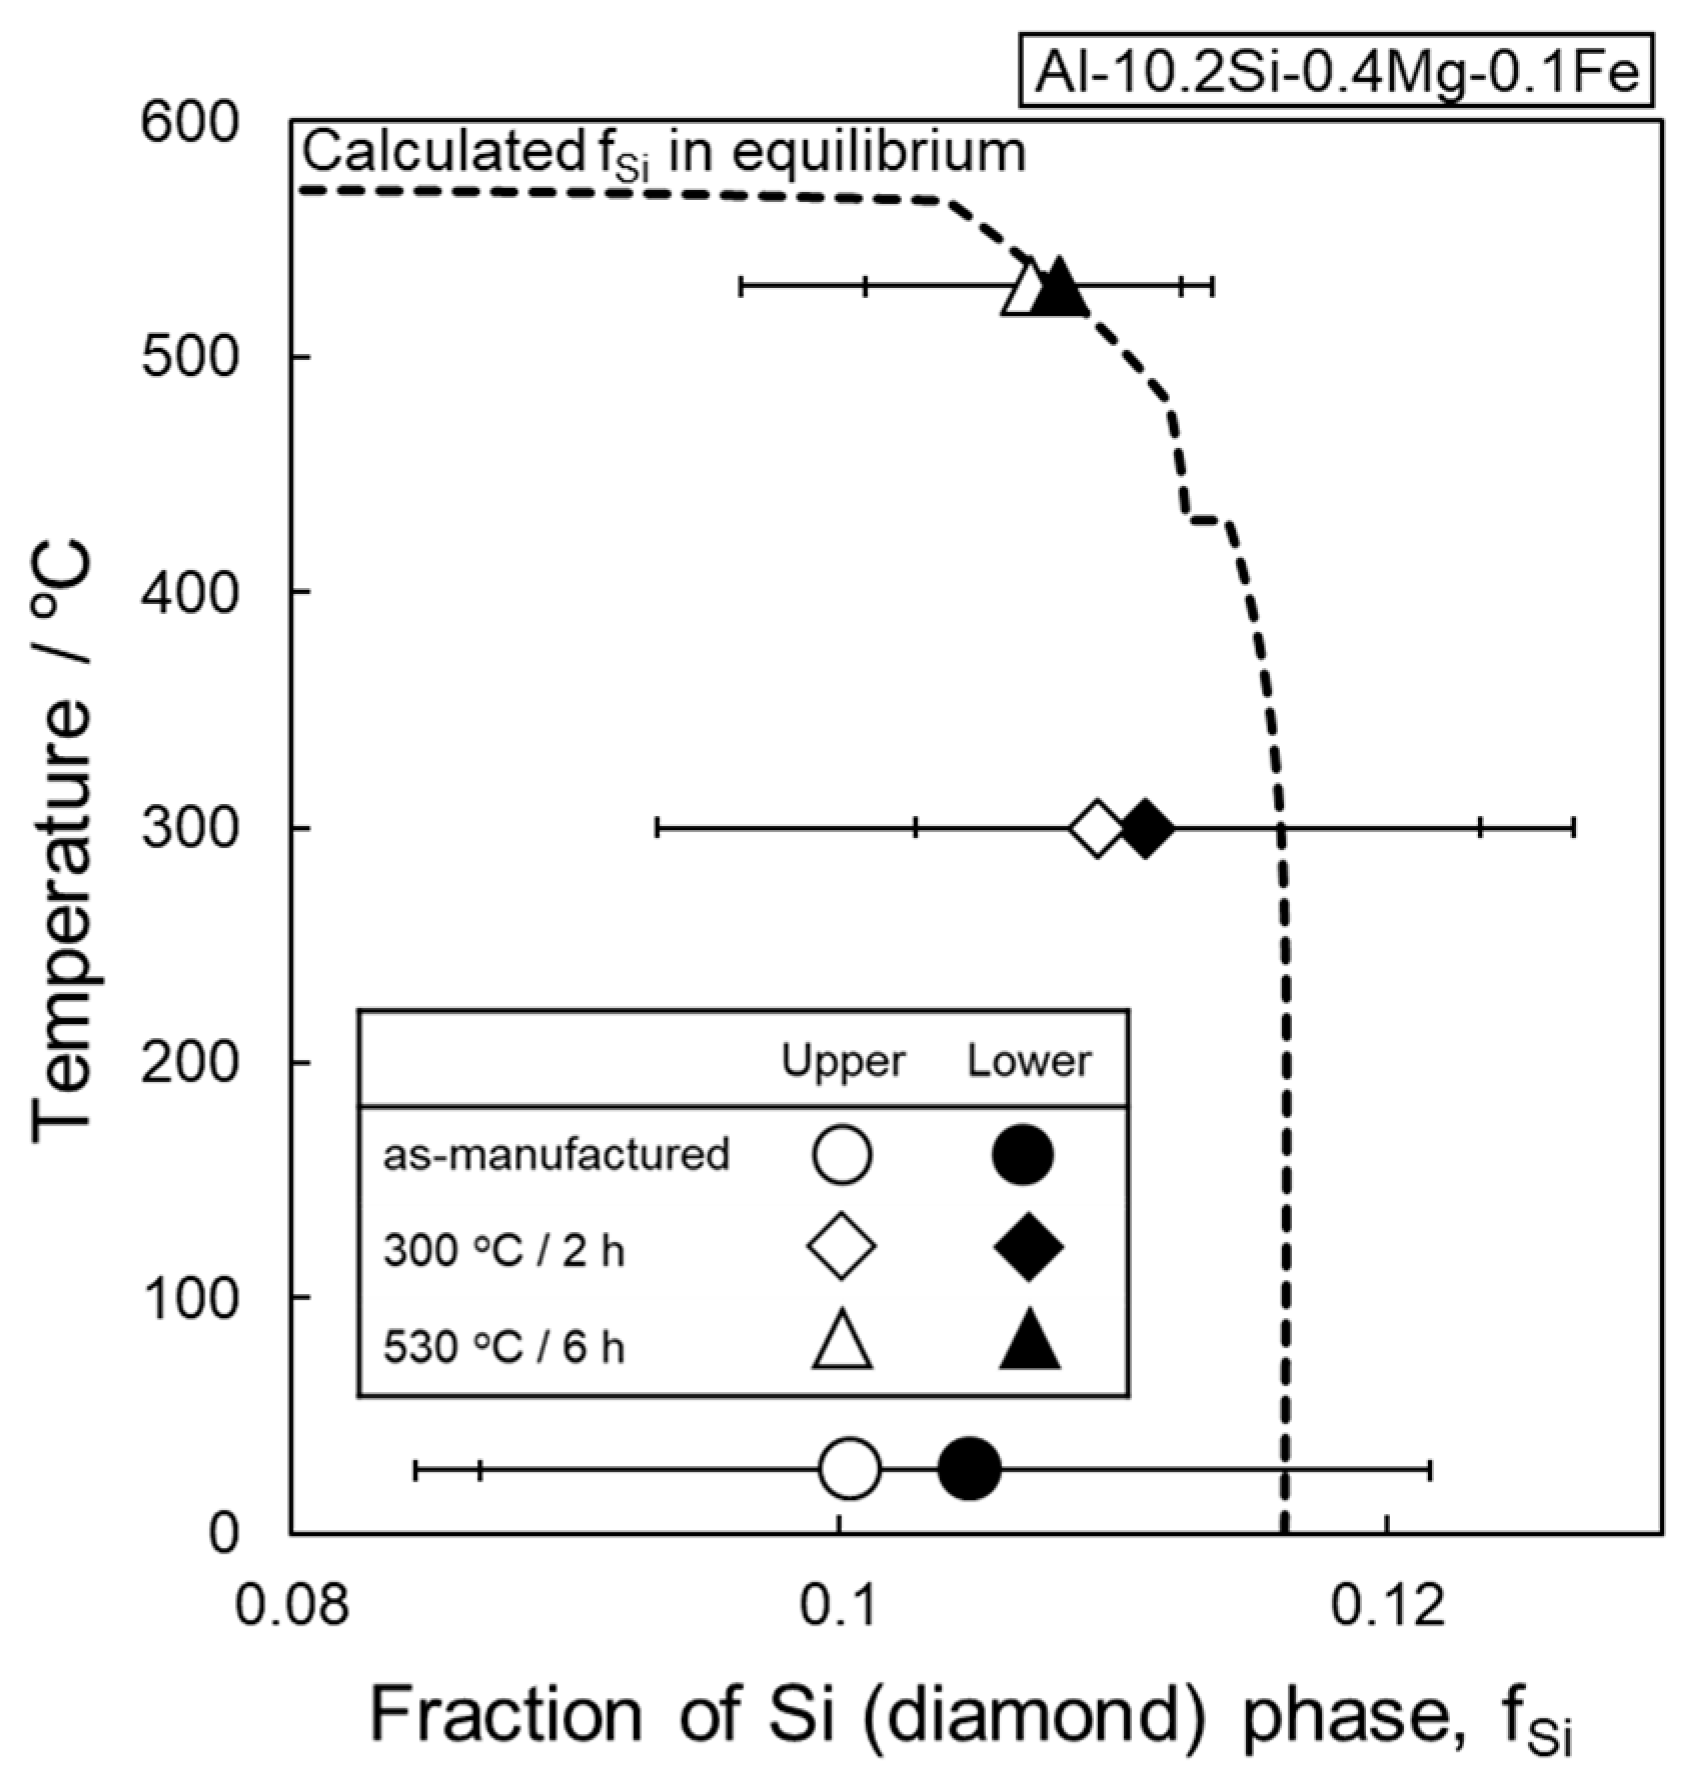
4. Discussion
5. Conclusions
Author Contributions
Funding
Acknowledgments
Conflicts of Interest
References
- Ashby, M.F.; Evans, A.; Fleck, N.A.; Hutchinson, J.W.; Wadley, H.N.G. Metals Foams: A Design Guide, 1st ed.; Elsevier Science: London, UK, 2000. [Google Scholar]
- Koza, E.; Leonowicz, M.; Wojciechowski, S.; Simancik, F. Compressive strength of aluminium foams. Mater. Lett. 2004, 58, 132–135. [Google Scholar] [CrossRef]
- Gibson, L. Mechanical behavior of metallic foams. Annu. Rev. Mater. Sci. 2000, 30, 191–227. [Google Scholar] [CrossRef]
- Tofail, S.A.M.; Koumoulos, E.P.; Bandyopadhyay, A.; Bose, S.; O’Donoghue, L.; Charitidis, C. Additive manufacturing: Scientific and technological challenges, market uptake and opportunities. Mater. Today 2018, 21, 22–37. [Google Scholar] [CrossRef]
- DebRoy, T.; Wei, H.L.; Zuback, J.S.; Mukherjee, T.; Elmer, J.W.; Milewski, J.O.; Beese, A.M.; Wilson-Heid, A.; De, A.; Zhang, W. Additive manufacturing of metallic components—Process, structure and properties. Prog. Mater. Sci. 2018, 92, 112–224. [Google Scholar] [CrossRef]
- Herzog, D.; Seyda, V.; Wycisk, E.; Emmelmann, C. Additive manufacturing of metals. Acta Mater. 2016, 117, 371–392. [Google Scholar] [CrossRef]
- Brandt, M. Laser Additive Manufacturing: Materials, Design, Technologies, and Applications, 1st ed.; Woodhead Publishing: Sawston, UK, 2016. [Google Scholar]
- Aboulkhair, N.T.; Simonelli, M.; Parry, L.; Ashcroft, I.; Tuck, C.; Hague, R. 3D printing of Aluminium alloys: Additive Manufacturing of Aluminium alloys using selective laser melting. Prog. Mater. Sci. 2019, 106, 100578. [Google Scholar] [CrossRef]
- Olakanmi, E.O.; Cochrane, R.F.; Dalgarno, K.W. A review on selective laser sintering/melting (SLS/SLM) of aluminium alloy powders: Processing, microstructure, and properties. Prog. Mater. Sci. 2015, 74, 401–477. [Google Scholar] [CrossRef]
- Maskery, I.; Aboulkhair, N.T.; Aremu, A.O.; Tuck, C.J.; Ashcroft, I.A.; Wildman, R.D.; Hague, R.J.M. A mechanical property evaluation of graded density Al-Si10-Mg lattice structures manufactured by selective laser melting. Mater. Sci. Eng. A 2016, 670, 264–274. [Google Scholar] [CrossRef]
- Qiu, C.; Yue, S.; Adkins, N.J.E.; Ward, M.; Hassanin, H.; Lee, P.D.; Withers, P.J.; Attallah, M.M. Influence of processing conditions on strut structure and compressive properties of cellular lattice structures fabricated by selective laser melting. Mater. Sci. Eng. A 2015, 628, 188–197. [Google Scholar] [CrossRef]
- Delahaye, J.; Tchuindajang, J.T.; Lecomte-Beckers, J.; Rigo, O.; Habraken, A.M.; Mertens, A. Influence of Si precipitates on fracture mechanisms of AlSi10Mg parts processed by Selective Laser Melting. Acta Mater. 2019, 175, 160–170. [Google Scholar] [CrossRef]
- Maamoun, A.H.; Xue, Y.F.; Elbestawi, M.A.; Veldhuis, S.C. The effect of selective laser melting process parameters on the microstructure and mechanical properties of Al6061 and AlSi10Mg alloys. Materials 2018, 12, 12. [Google Scholar] [CrossRef] [PubMed]
- Amani, Y.; Dancette, S.; Delsoisse, P.; Simar, A.; Maire, E. Compression behavior of lattice structures produced by selective laser melting: X-ray tomography based experimental and finite element approaches. Acta Mater. 2018, 159, 395–407. [Google Scholar]
- Leary, M.; Mazur, M.; Elambasseril, J.; McMillan, M.; Chirent, T.; Sun, Y.; Qian, M.; Easton, M.; Brandt, M. Selective laser melting (SLM) of AlSi12Mg lattice structures. Mater. Des. 2016, 98, 344–357. [Google Scholar] [CrossRef]
- Yan, C.; Hao, L.; Hussein, A.; Bubb, S.L.; Young, P.; Raymont, D. Evaluation of light-weight AlSi10Mg periodic cellular lattice structures fabricated via direct metal laser sintering. J. Mater. Process. Technol. 2014, 214, 856–864. [Google Scholar] [CrossRef]
- Yu, T.; Hyer, H.; Sohn, Y.; Bai, Y.; Wu, D. Structure-property relationship in high strength and lightweight AlSi10Mg microlattices fabricated by selective laser melting. Mater. Des. 2019, 182, 108062. [Google Scholar] [CrossRef]
- Al-Saedi, D.S.J.; Masood, S.H.; Faizan-Ur-Rb, M.; Alomarah, A.; Ponnusamy, P. Mechanical properties and energy absorption capability of functionally graded F2BCC lattice fabricated by SLM. Mater. Des. 2018, 144, 32–44. [Google Scholar] [CrossRef]
- Han, X.; Zhu, H.; Nie, X.; Wang, G.; Zeng, X. Investigation on selective laser melting AlSi10Mg cellular lattice strut: Molten pool morphology, surface roughness and dimensional accuracy. Materials 2018, 11, 392. [Google Scholar] [CrossRef]
- Chang, S.; Liu, A.; Ong, C.Y.A.; Zhang, L.; Huang, X.; Tan, Y.H.; Zhao, L.; Li, L.; Ding, J. Highly effective smoothening of 3D-printed metal structures via overpotential electrochemical polishing. Mater. Res. Lett. 2019, 7, 282–289. [Google Scholar]
- Delroisse, P.; Jacques, P.; Maire, E.; Rigo, O.; Simar, A. Effect of strut orientation on the microstructure heterogeneities in AlSi10Mg lattices processed by selective laser melting. Scr. Mater. 2017, 141, 32–35. [Google Scholar] [CrossRef]
- Liu, M.; Takata, N.; Suzuki, A.; Kobashi, M. Development of gradient microstructure in the lattice structure of AlSi10Mg alloy fabricated by selective laser melting. J. Mater. Sci. Technol. 2020, 36, 106–107. [Google Scholar]
- Suzuki, A.; Sekizawa, K.; Liu, M.; Takata, N.; Kobashi, M. Effect of heat treatments on compressive deformation behaviors of lattice-structured AlSi10Mg alloy fabricated by selective laser melting. Adv. Eng. Mater. 2019, 21, 1900571. [Google Scholar]
- Li, W.; Li, S.; Liu, J.; Zhang, A.; Zhou, Y.; Wei, Q.; Yan, C.; Shi, Y. Effect of heat treatment on AlSi10Mg alloy fabricated by selective laser melting: Microstructure evolution, mechanical properties and fracture mechanism. Mater. Sci. Eng. A 2016, 633, 116–125. [Google Scholar] [CrossRef]
- Takata, N.; Kodaira, H.; Sekizawa, K.; Suzuki, A.; Kobashi, M. Change in microstructure of selectively laser melted AlSi10Mg alloy with heat treatments. Mater. Sci. Eng. A 2017, 704, 218–228. [Google Scholar]
- Zhou, L.; Mehta, A.; Schulz, E.; McWilliams, B.; Cho, K.; Sohn, Y. Microstructure, precipitates and hardness of selectively laser melted AlSi10Mg alloy before and after heat treatment. Mater. Charact. 2018, 143, 5–17. [Google Scholar]
- Maamoun, A.H.; Elbestawi, M.; Dosbaeva, G.K.; Veldhuis, S.C. Thermal post-processing of AlSi10Mg parts produced by Selective Laser Melting using recycled powder. Addit. Manuf. 2018, 21, 234–247. [Google Scholar]
- Liu, M.; Takata, N.; Suzuki, A.; Kobashi, M. Microstructural characterization of cellular AlSi10Mg alloy fabricated by selective laser melting. Mater. Des. 2018, 157, 478–491. [Google Scholar]
- Takata, N.; Kodaira, H.; Suzuki, A.; Kobashi, M. Size dependence of microstructure of AlSi10Mg alloy fabricated by selective lase melting. Mater. Charact. 2018, 143, 18–26. [Google Scholar] [CrossRef]
- Romming, C.; Hansen, V.; Gjonnes, J. Crystal structure of -Al4.5FeSi. Acta Cystallogr. B 1994, 40, 307–312. [Google Scholar]
- Marker, M.C.J.; Skolyszewska-Kuhberger, B.; Effenberger, H.S.; Schmetterer, C.; Richter, K.W. Phase equilibria and structural investigations in the system Al-Fe-Si. Intermetallics 2011, 19, 1919–1929. [Google Scholar]
- CompuTherm LLC, PanAluminum. Thermodynamic Database for Multi-Component Aluminum-Rich Casting and Wrought Alloys. 2020. Available online: https://computherm.com/?docs=pandat-database-manual/database-overview (accessed on 1 May 2020).
- DeHoff, R.T.; Rhines, F.N. Quantitative Microscopy; McGraw-Hill: New York, NY, USA, 1968. [Google Scholar]
- Tan, Z.; Zhang, X.; Zhou, Z.; Zhou, Z.; Yang, Y.; Guo, X.; Wang, Z.; Wu, X.; Wang, G.; He, D. Thermal effect on the microstructure of the lattice structure Cu-10Sn alloy fabricated through selective laser melting. J. Alloys Compd. 2019, 787, 903–908. [Google Scholar] [CrossRef]
- Niendorf, T.; Brenne, F.; Schaper, M. Lattice structures manufactured by SLM: On the effect of geometrical dimensions on microstructure evolution during processing. Metall. Mater. Trans. B 2014, 45, 1181–1185. [Google Scholar] [CrossRef]
- Koizumi, Y.; Okazaki, A.; Chiba, A.; Kato, T.; Takezawa, A. Cellular lattices of biomedical Co-Cr-Mo-alloy fabricated by electron beam melting with the aid of shape optimization. Addit. Manuf. 2016, 12, 305–313. [Google Scholar]
- Guo, M.; Ye, Y.; Jiang, X.; Wang, L. Microstructure, mechanical properties and residual stress of selective laser melted AlSi10Mg. J. Mater. Eng. Perform. 2019, 28, 6753–6760. [Google Scholar] [CrossRef]
- Chen, B.; Moon, S.K.; Yao, X.; Bi, G.; Shen, J.; Umeda, J.; Kondoh, K. Strength and strain hardening of a selective laser melted AlSi10Mg alloy. Scr. Mater. 2017, 141, 45–49. [Google Scholar]
- Zhuo, L.; Wang, Z.; Zhang, H.; Yin, E.; Wang, Y.; Xu, T.; Li, C. Effect of post-process heat treatment on microstructure and properties of selective laser melted AlSi10Mg alloy. Mater. Lett. 2019, 234, 196–200. [Google Scholar]


| Process Parameters | Values |
|---|---|
| Laser power (W) | 370 |
| Scanning speed (mm/s) | 1300 |
| Spot size (µm) | 100 |
| Hatch distance (µm) | 70 |
| Layer thickness (µm) | 30 |
| Volumetric energy density (J∙mm−3) | 136 |
© 2020 by the authors. Licensee MDPI, Basel, Switzerland. This article is an open access article distributed under the terms and conditions of the Creative Commons Attribution (CC BY) license (http://creativecommons.org/licenses/by/4.0/).
Share and Cite
Liu, M.; Takata, N.; Suzuki, A.; Kobashi, M. Effect of Heat Treatment on Gradient Microstructure of AlSi10Mg Lattice Structure Manufactured by Laser Powder Bed Fusion. Materials 2020, 13, 2487. https://doi.org/10.3390/ma13112487
Liu M, Takata N, Suzuki A, Kobashi M. Effect of Heat Treatment on Gradient Microstructure of AlSi10Mg Lattice Structure Manufactured by Laser Powder Bed Fusion. Materials. 2020; 13(11):2487. https://doi.org/10.3390/ma13112487
Chicago/Turabian StyleLiu, Mulin, Naoki Takata, Asuka Suzuki, and Makoto Kobashi. 2020. "Effect of Heat Treatment on Gradient Microstructure of AlSi10Mg Lattice Structure Manufactured by Laser Powder Bed Fusion" Materials 13, no. 11: 2487. https://doi.org/10.3390/ma13112487
APA StyleLiu, M., Takata, N., Suzuki, A., & Kobashi, M. (2020). Effect of Heat Treatment on Gradient Microstructure of AlSi10Mg Lattice Structure Manufactured by Laser Powder Bed Fusion. Materials, 13(11), 2487. https://doi.org/10.3390/ma13112487