Study on the Elastic–Plastic Correlation of Low-Cycle Fatigue for Variable Asymmetric Loadings


Abstract
1. Introduction
2. Elastic–plastic Correlation of LCF
3. LCF Models for Asymmetric Cyclic Loading
3.1. Model Description
3.2. Model Comparison
4. Model Modification
4.1. Modification
4.2. Verification
5. Discussions
6. Conclusions
- (1)
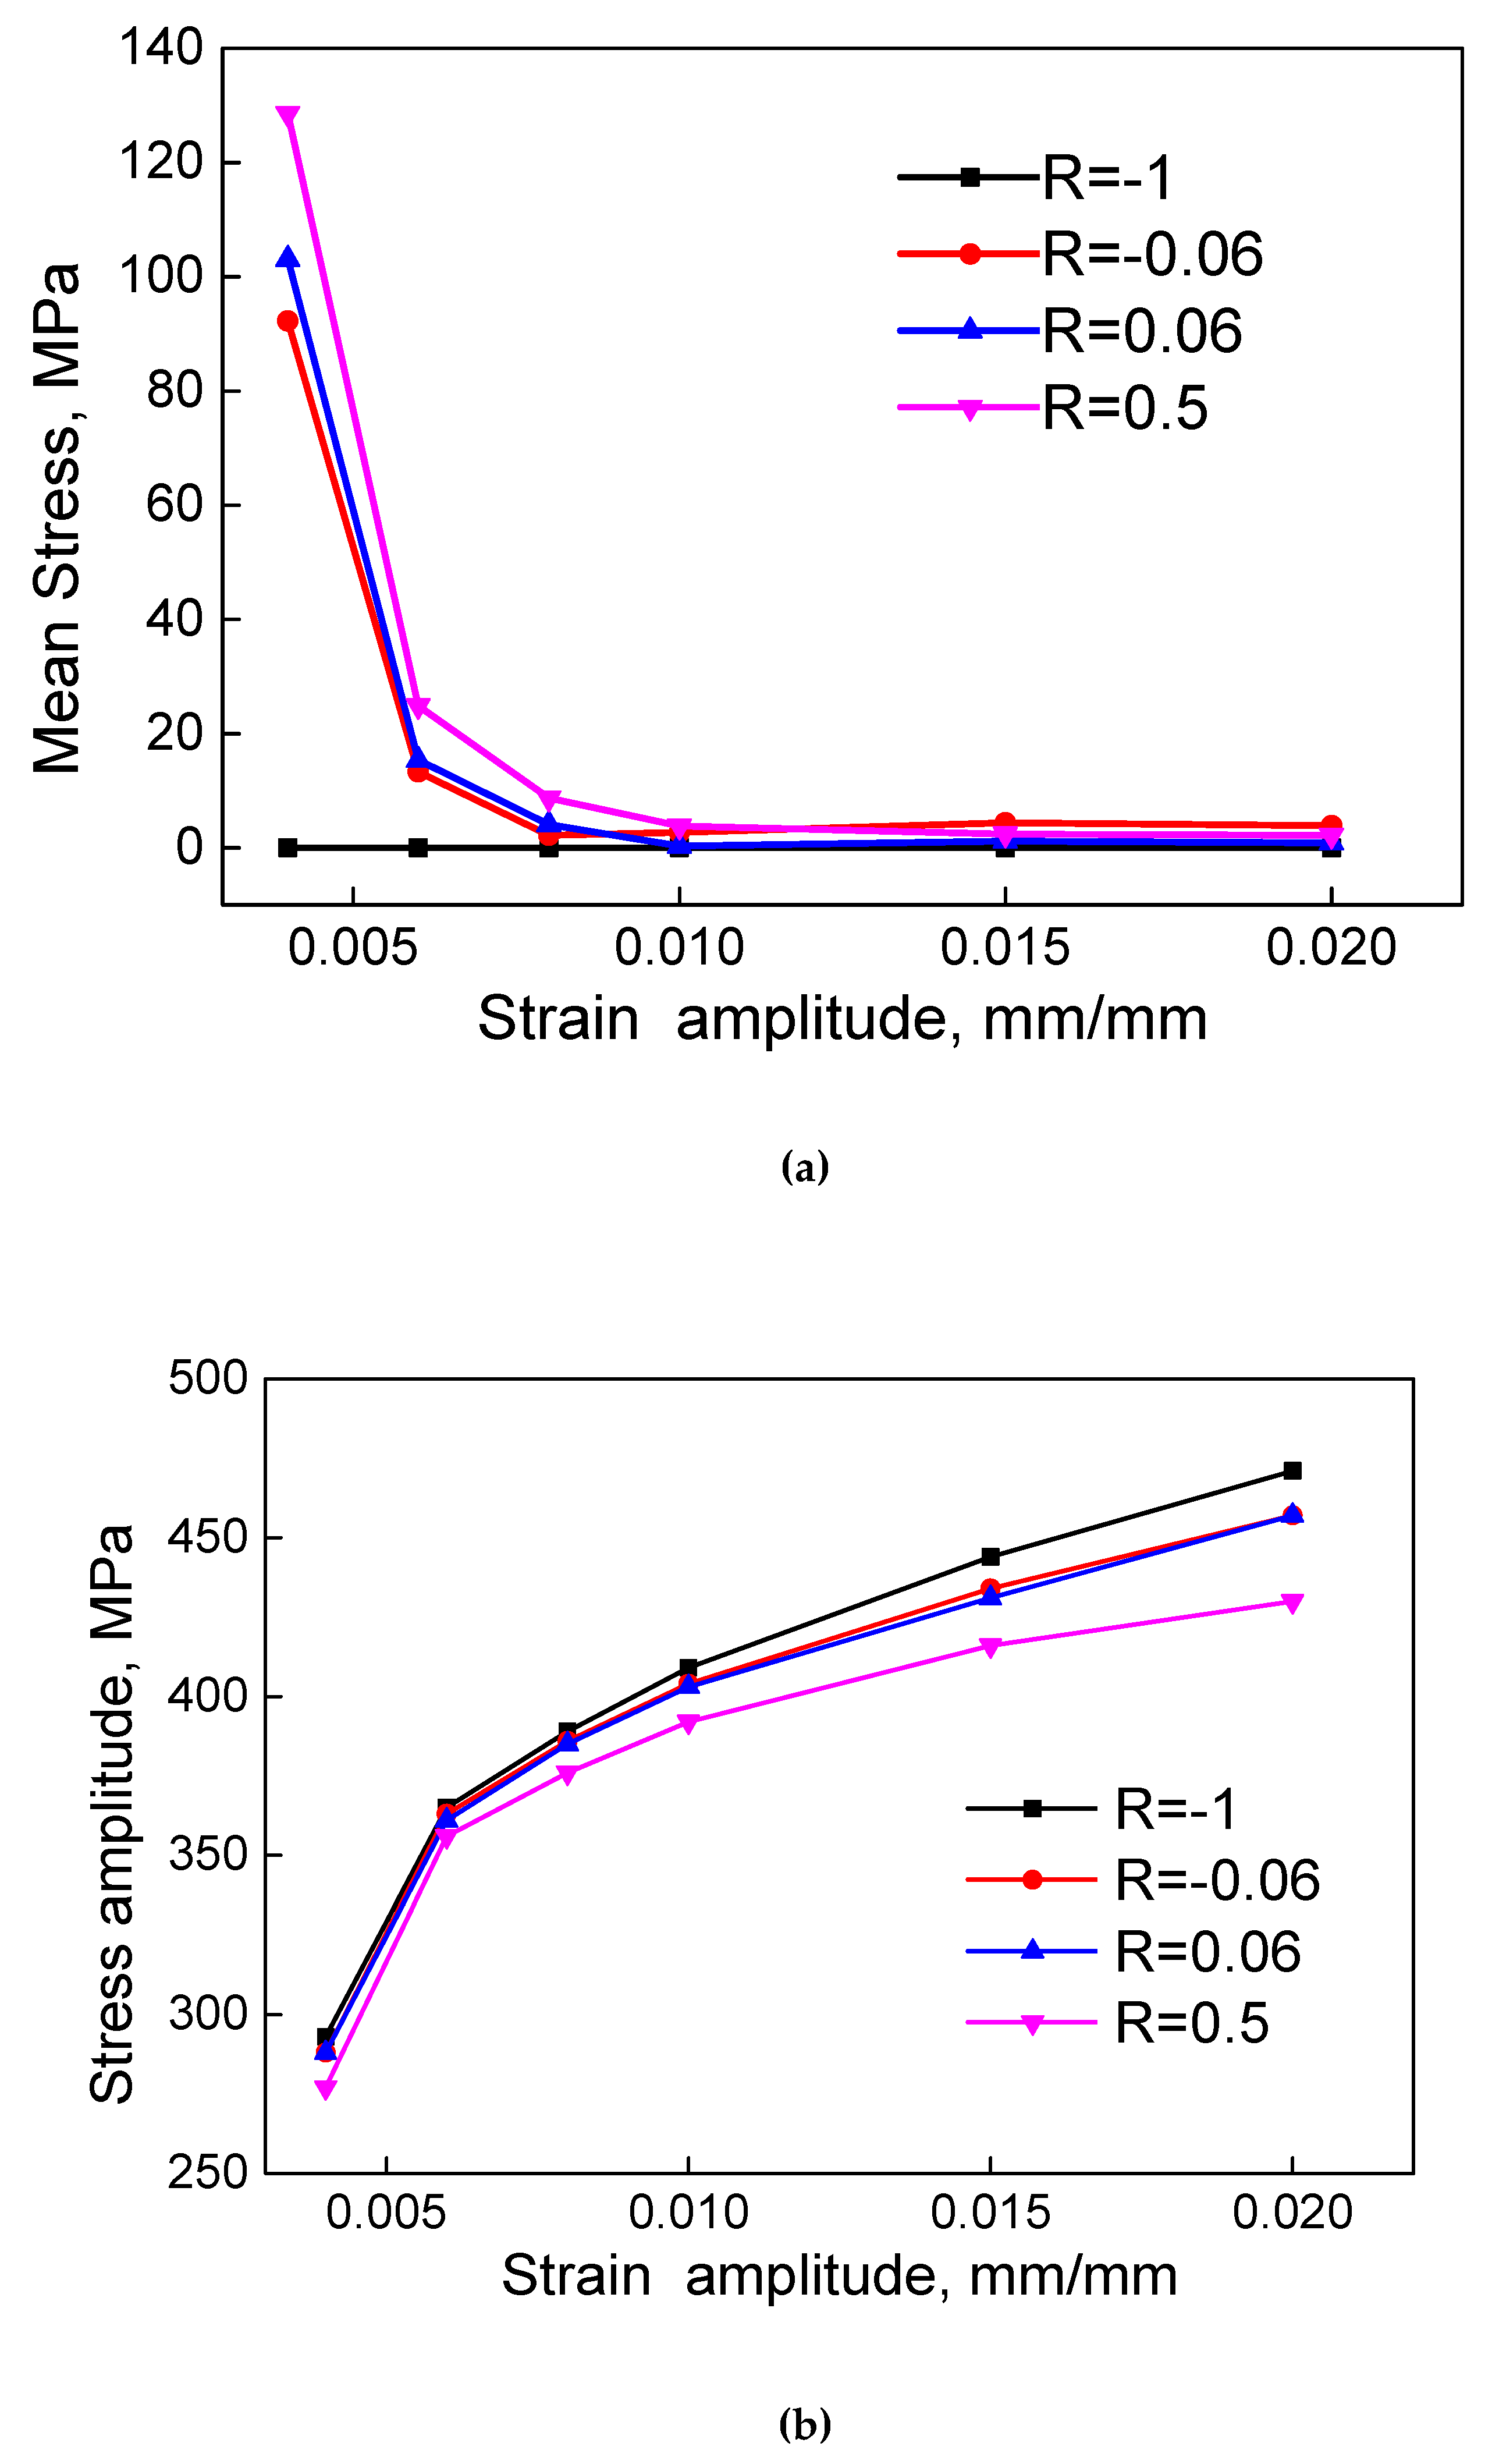
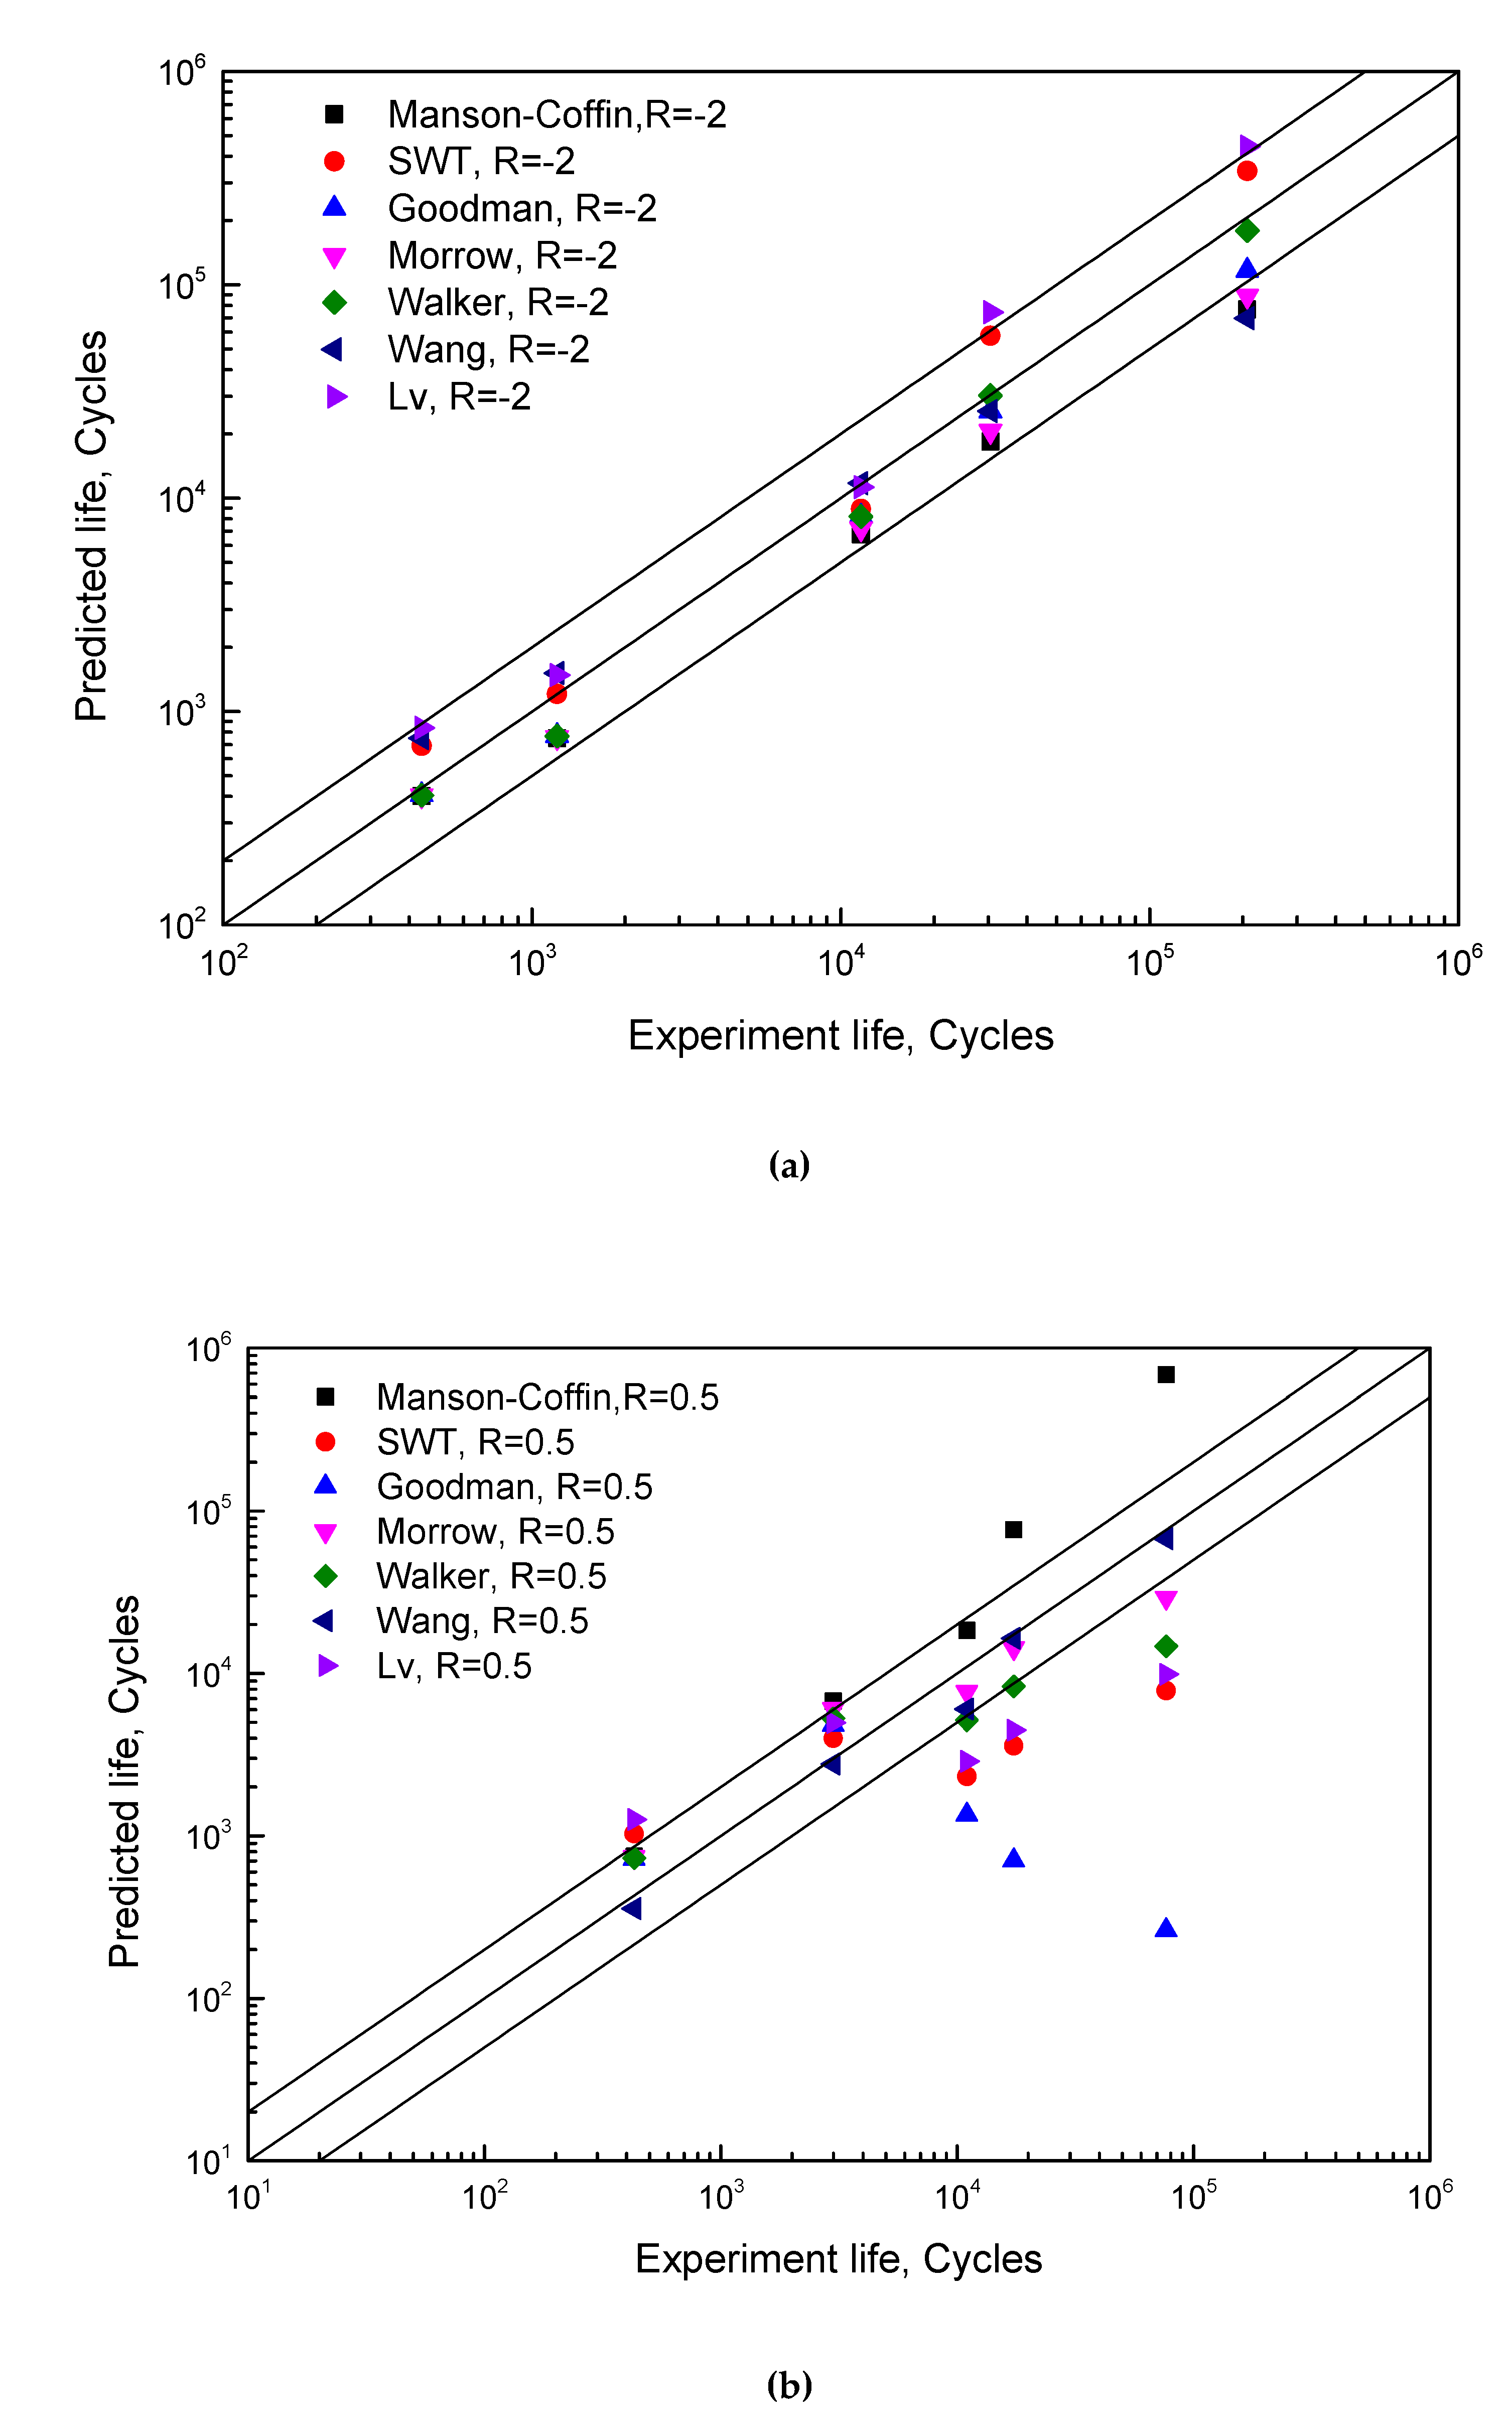
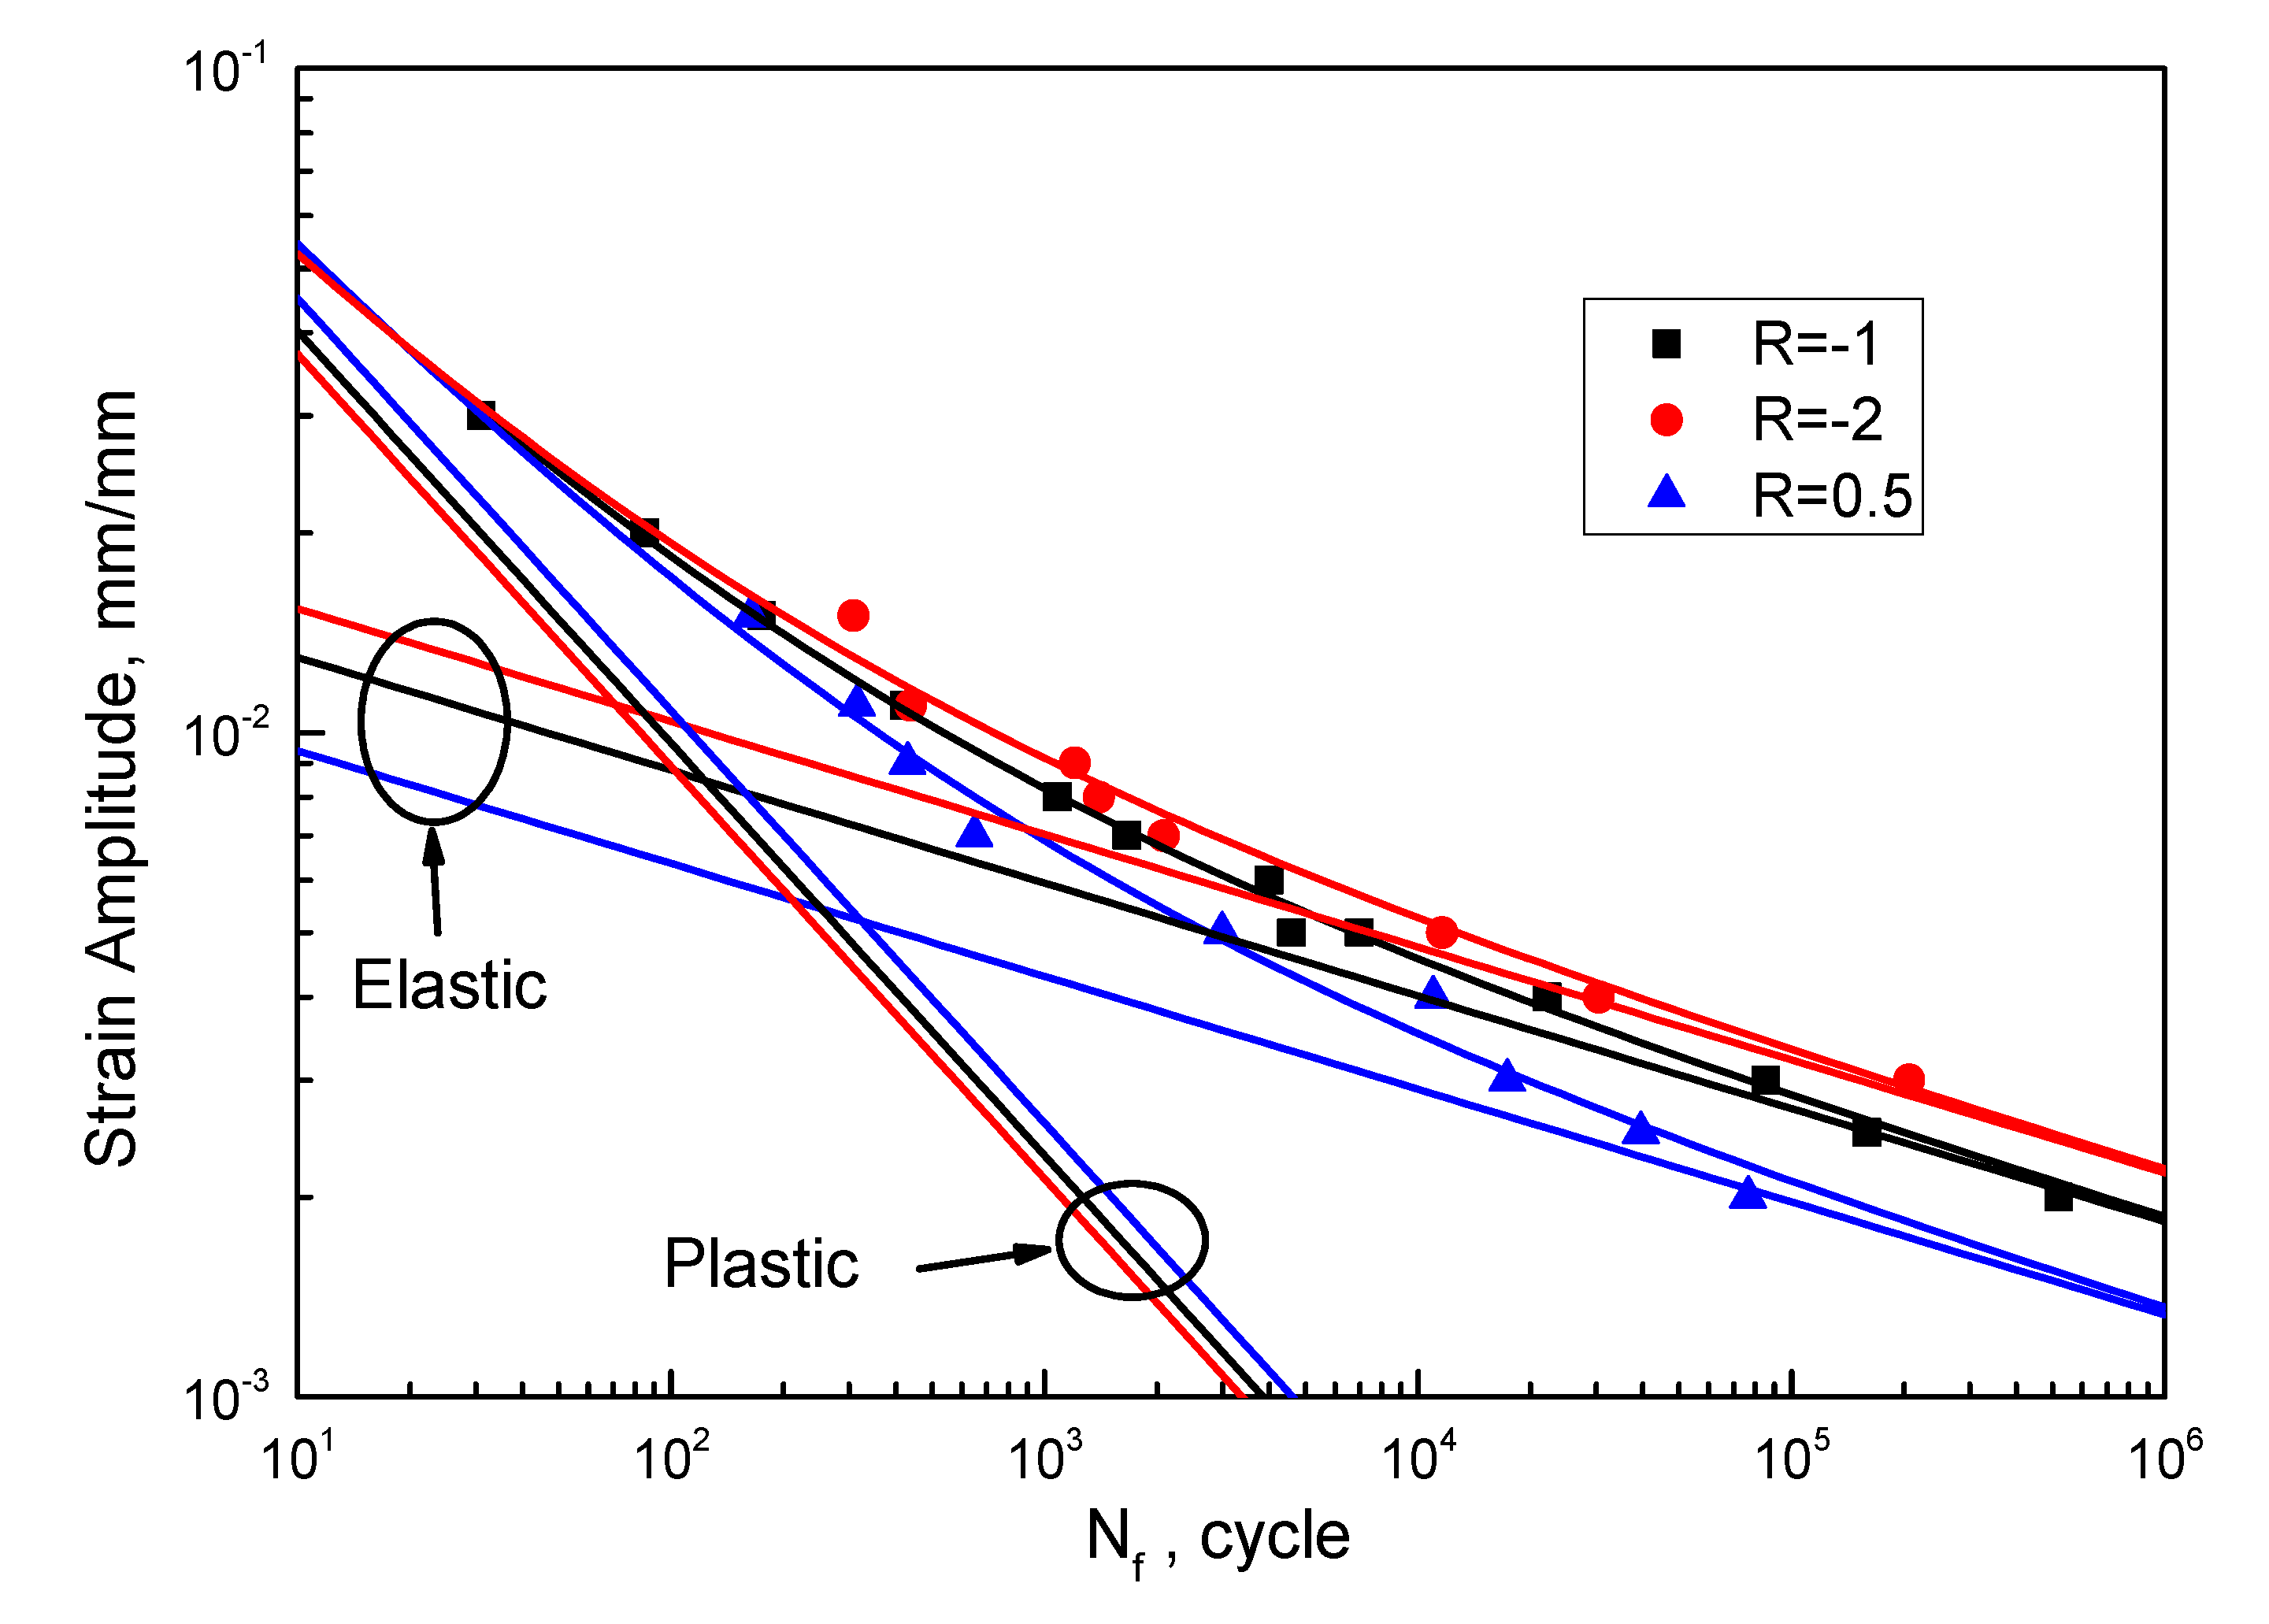
- Two ways that strain ratio affects the LCF process are found, depending on the strain condition. For low strain cases, the effect of strain ratio on fatigue life relies on the mean stress; for high strain cases, the plastic strain energy controlled by the strain ratio dominates the fatigue life and the mean stress plays a small role. This is why the mean stress-based models struggle in small-amplitude loading cases but show acceptable accuracy in large-amplitude loading conditions;
- (2)
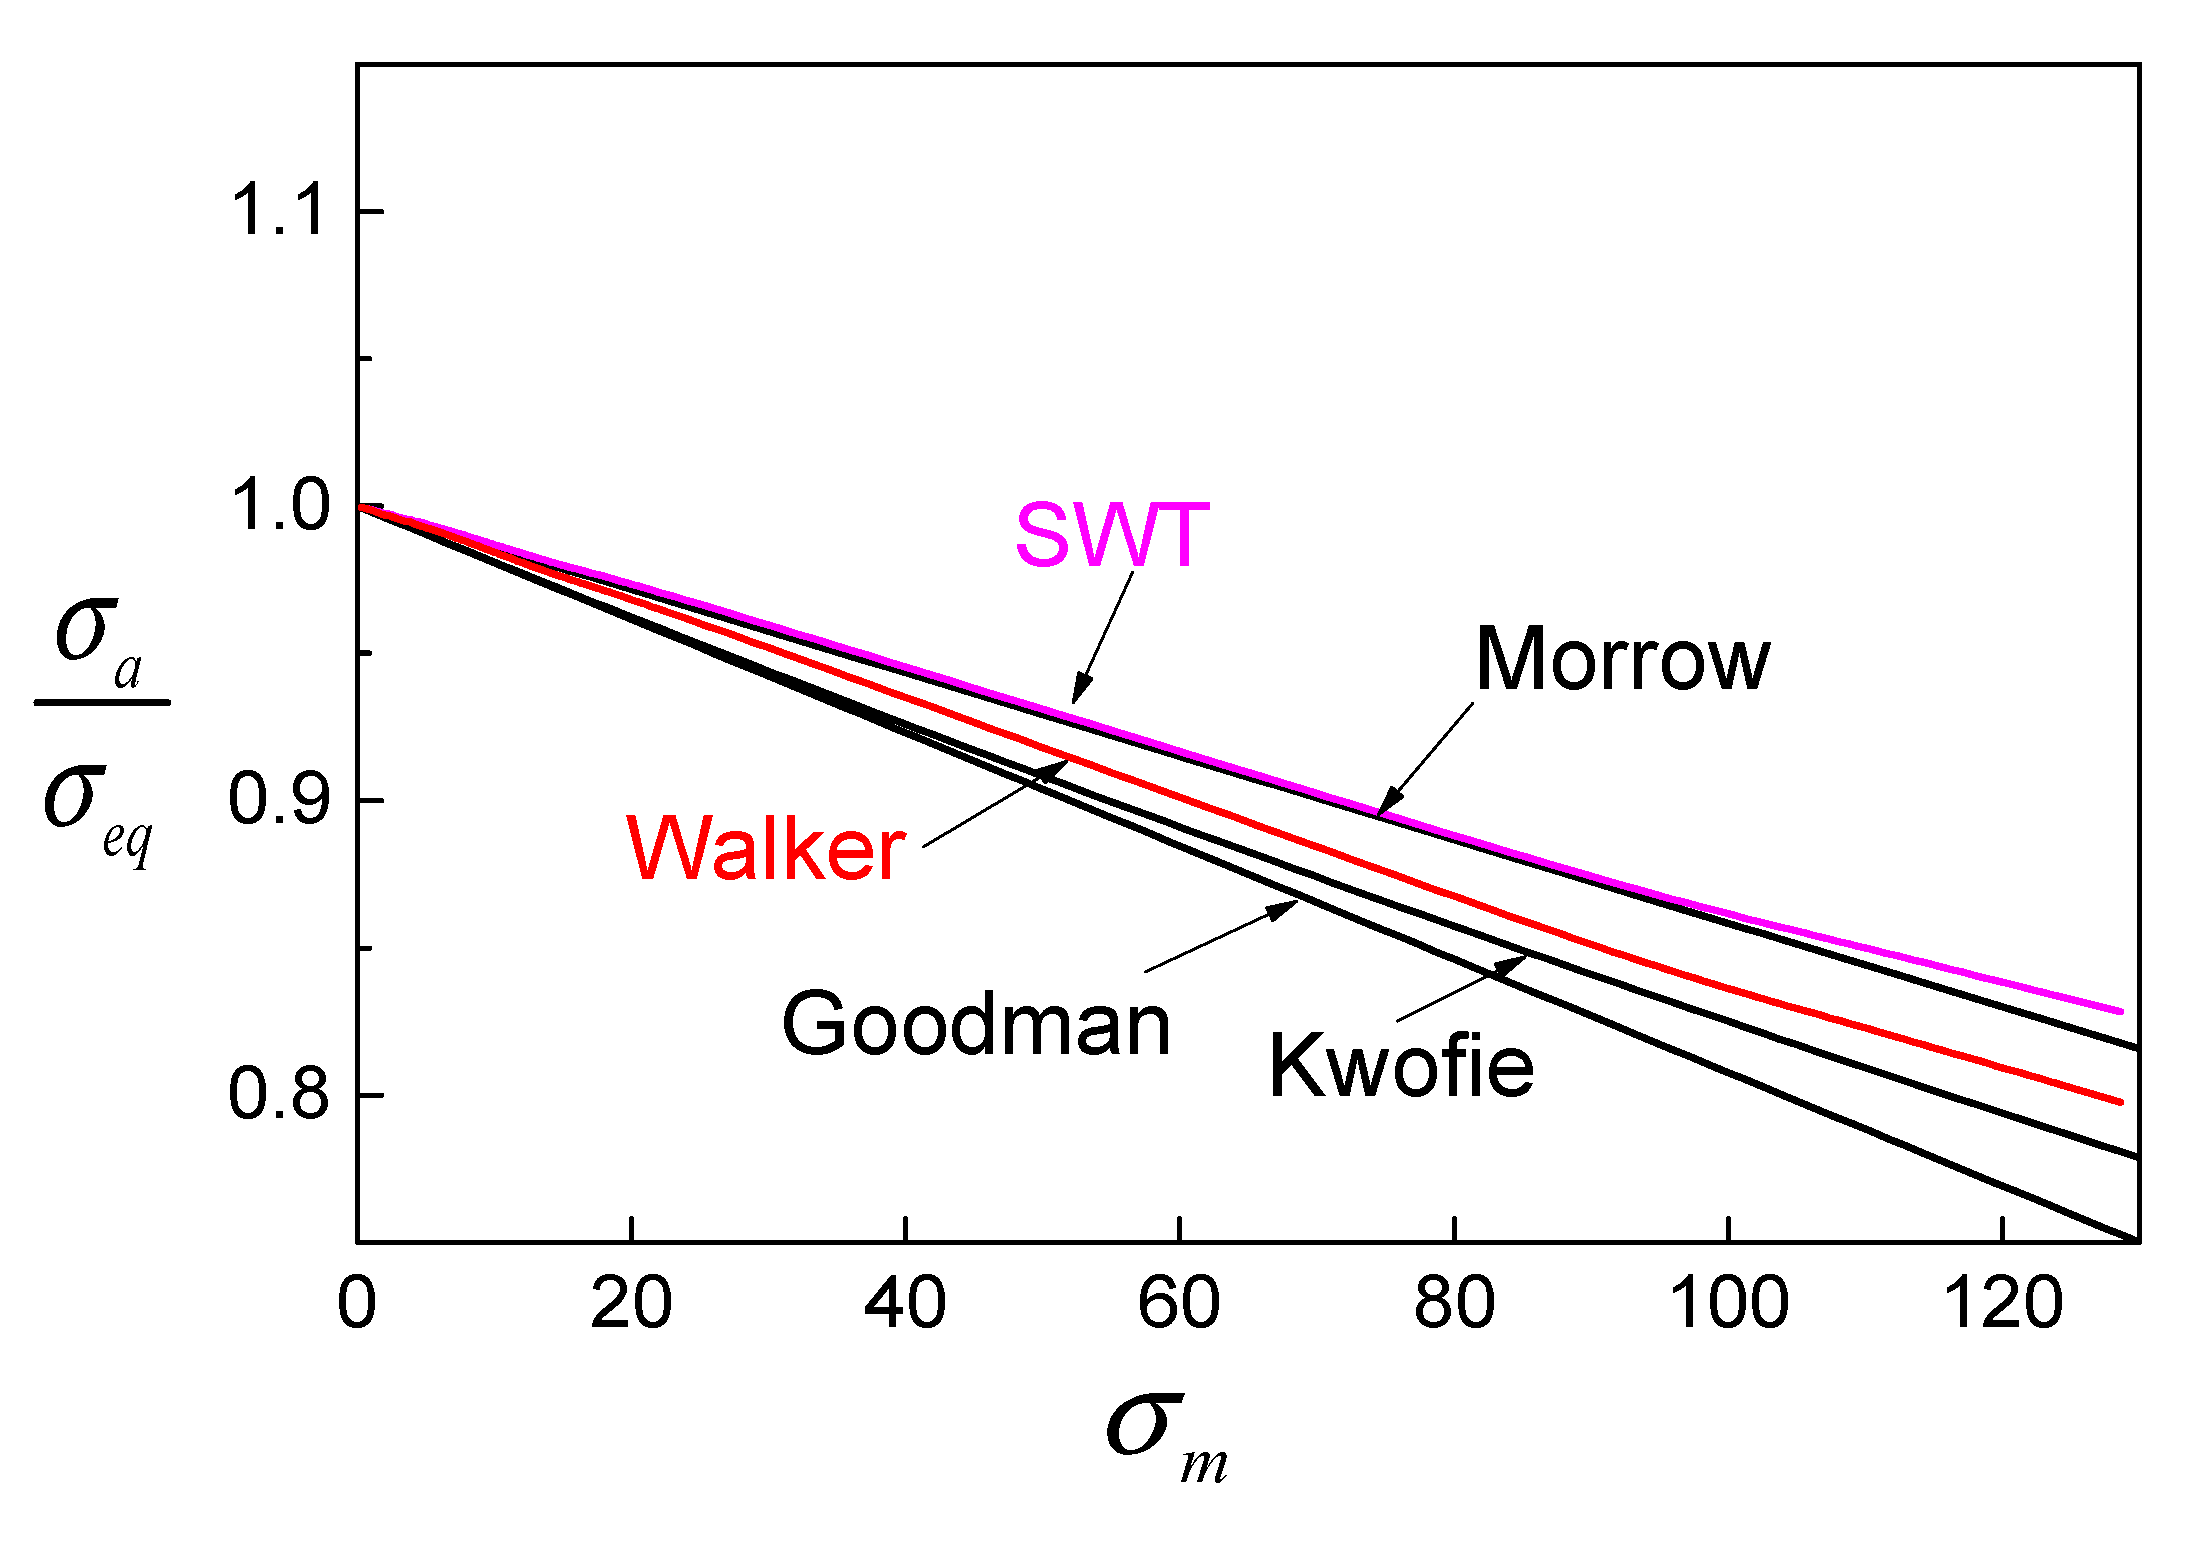
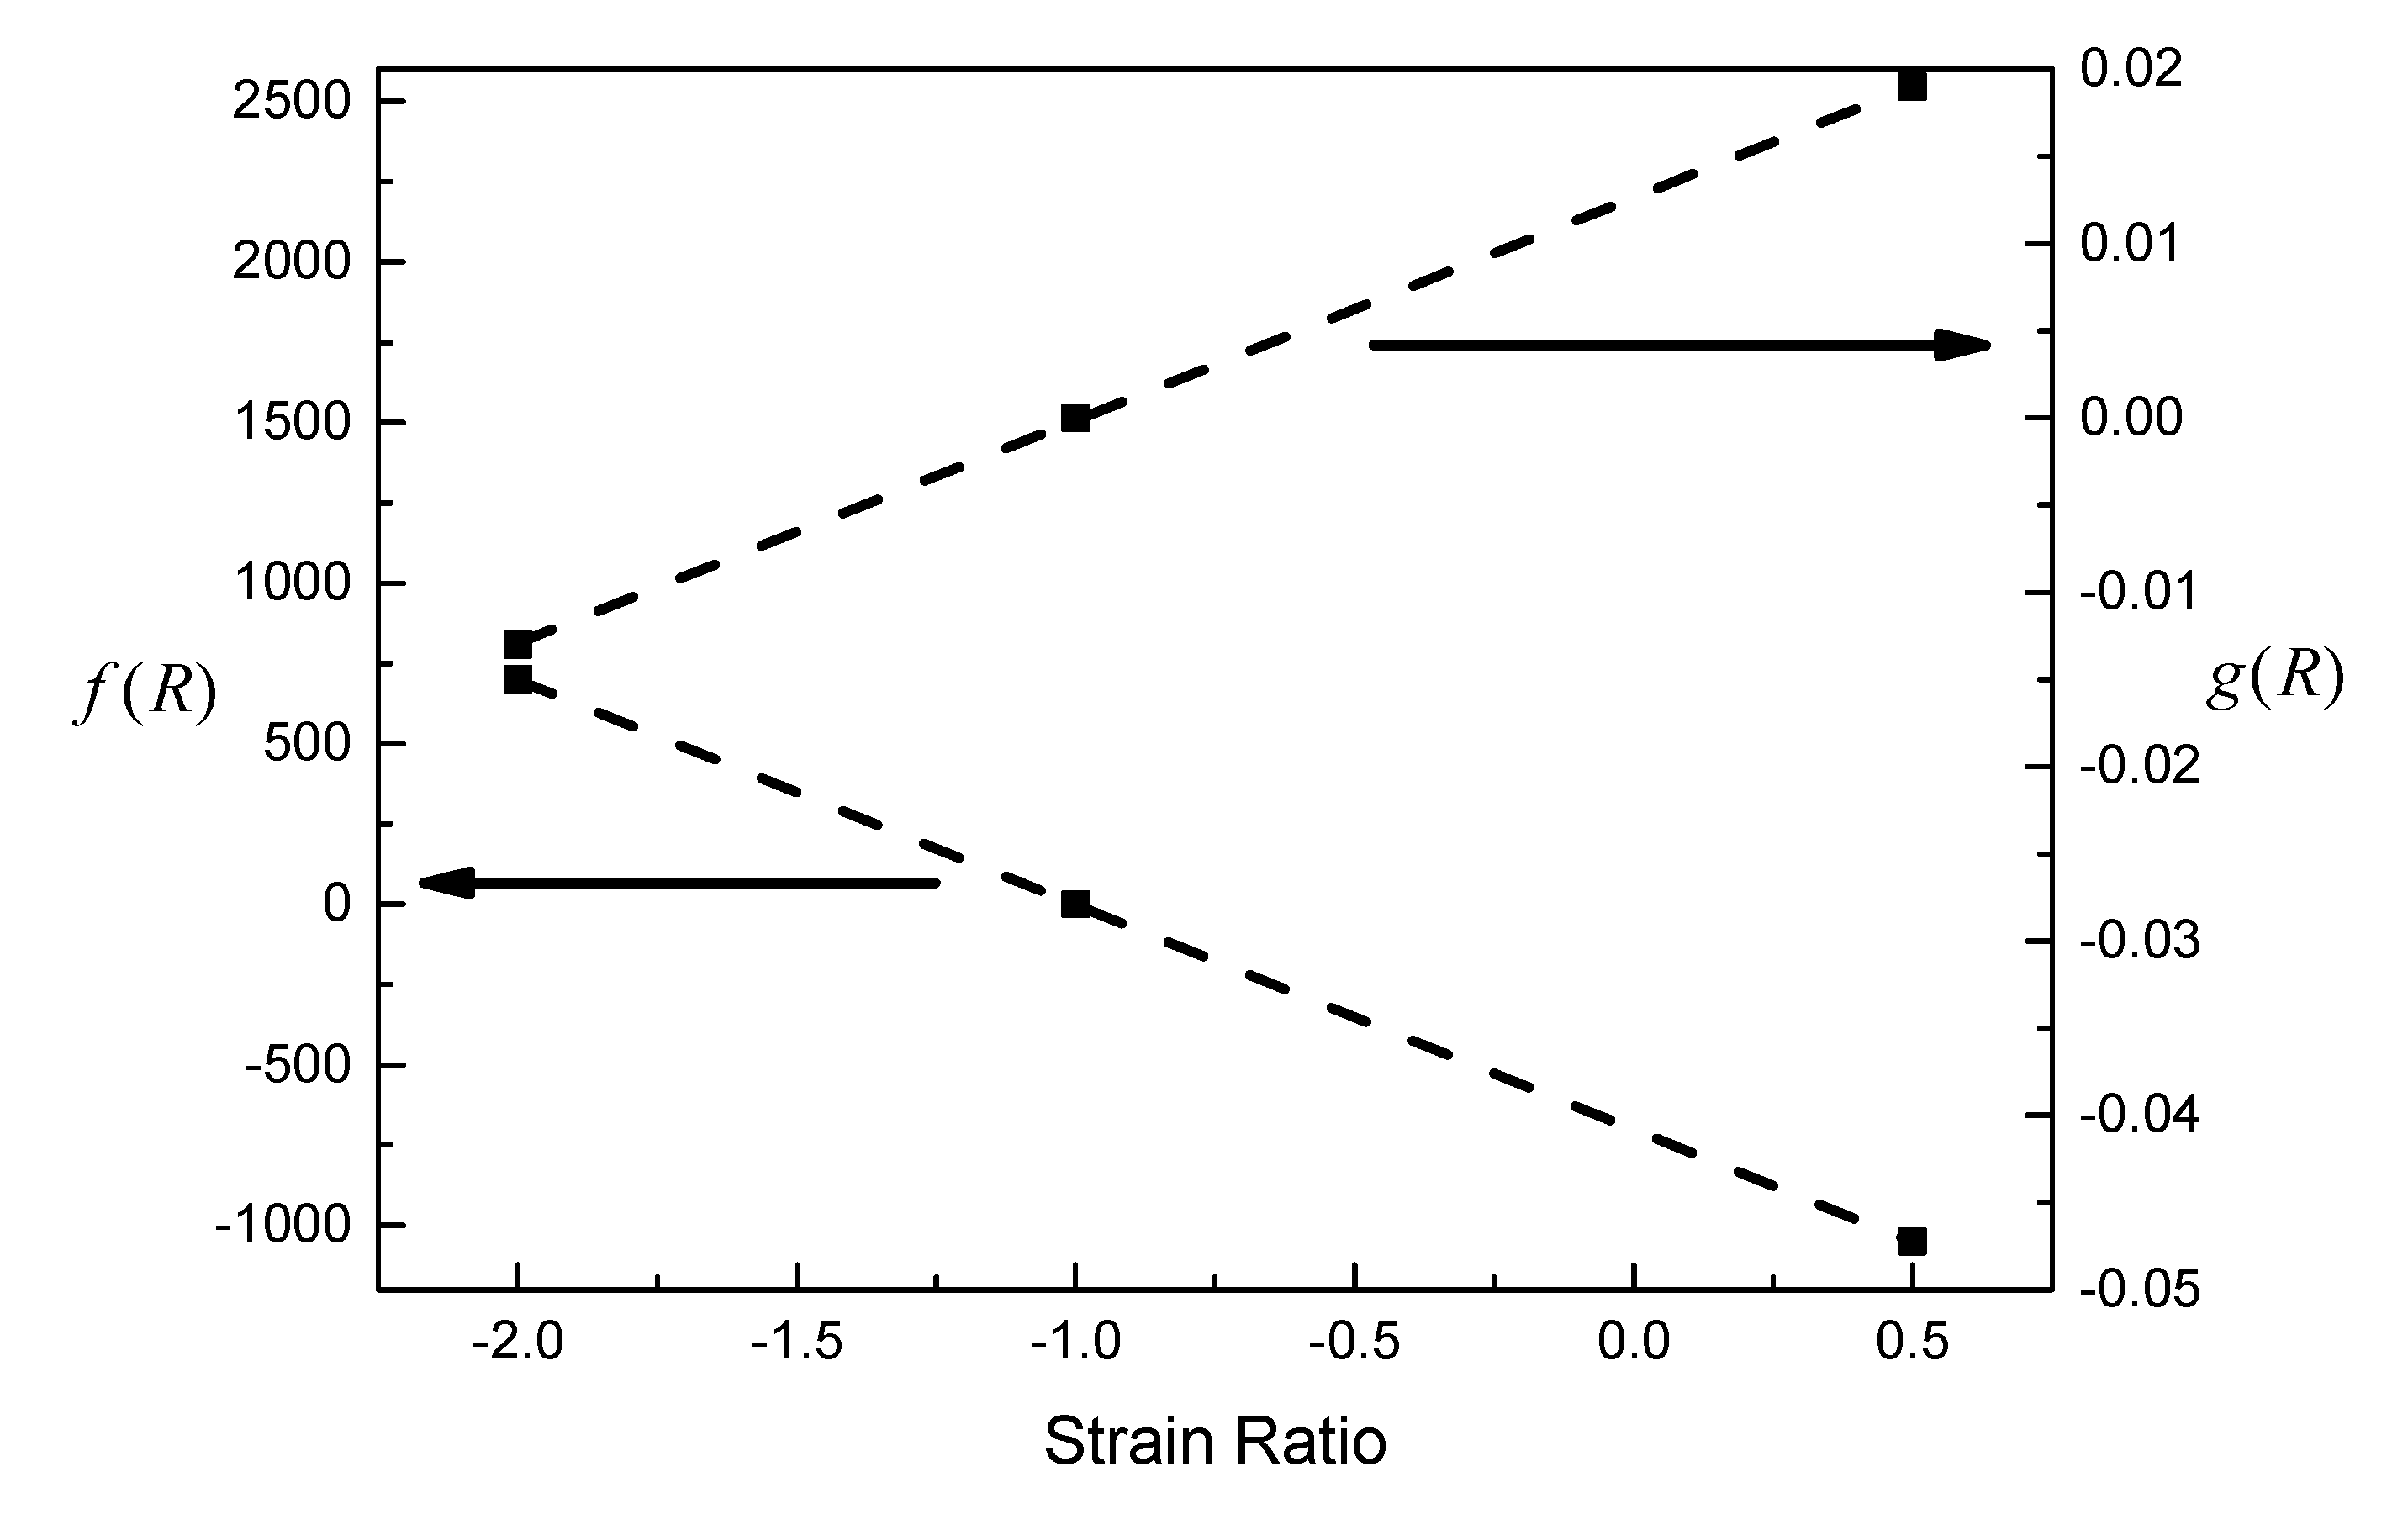
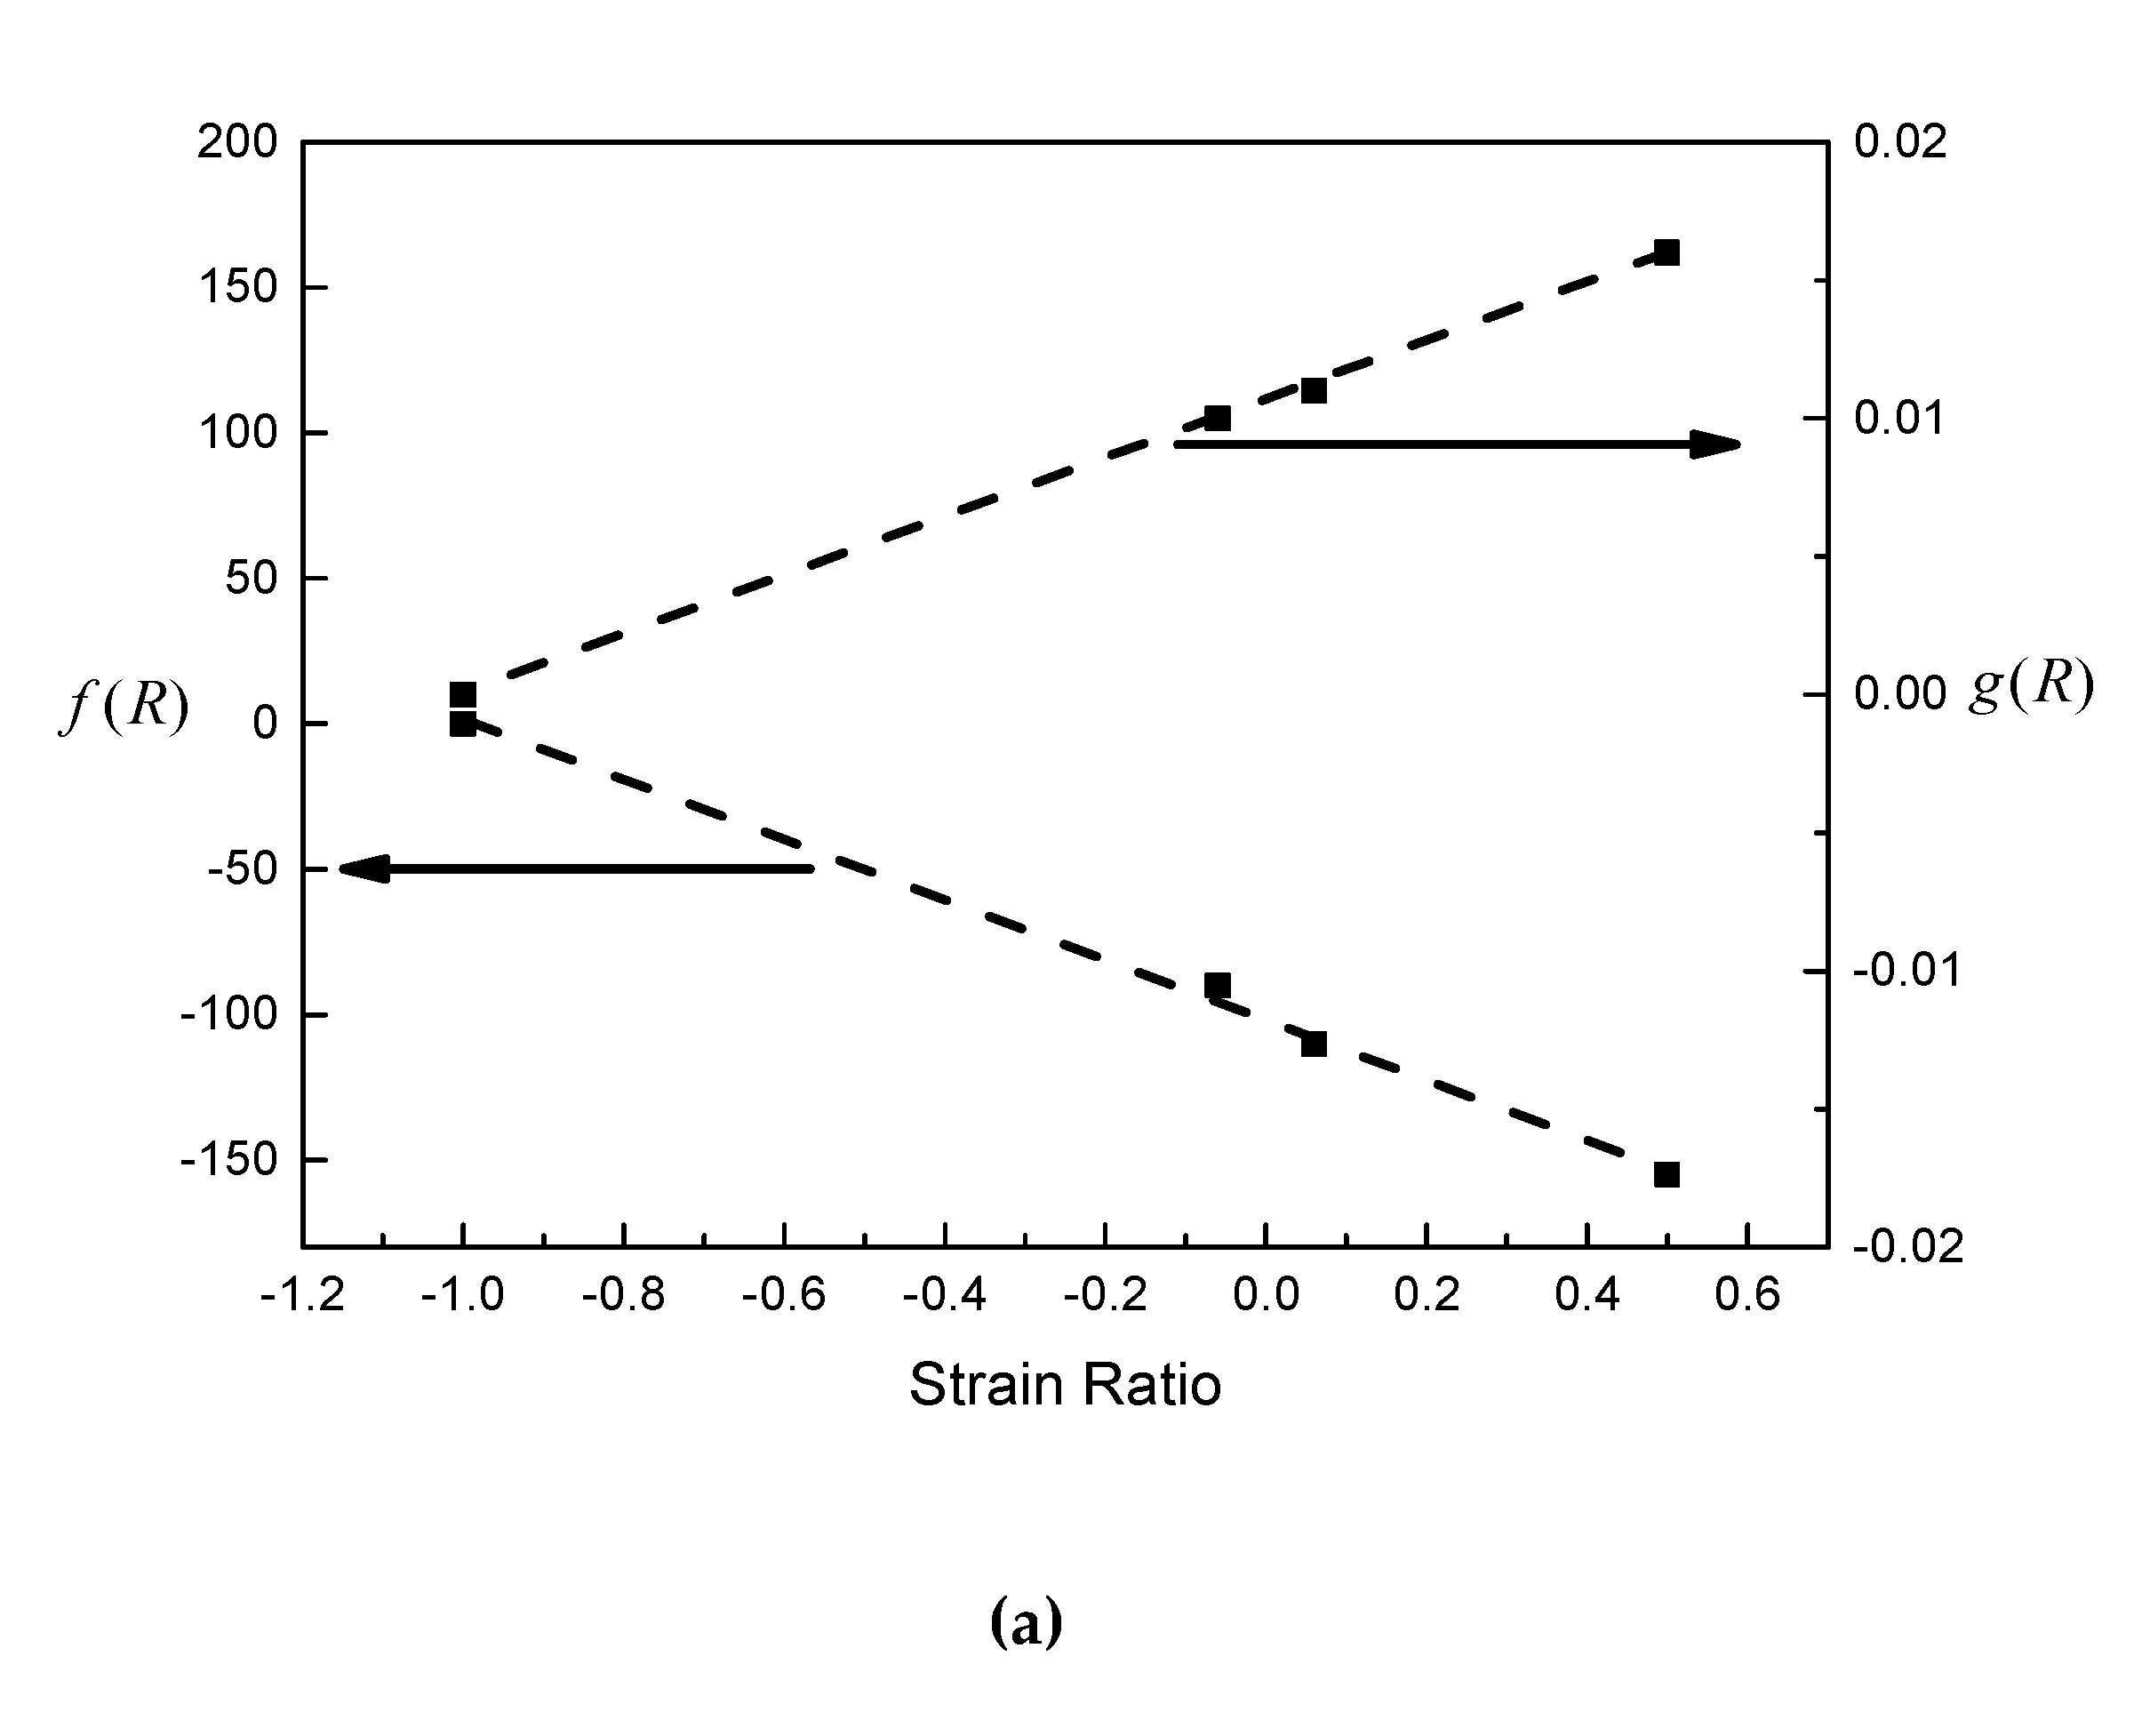
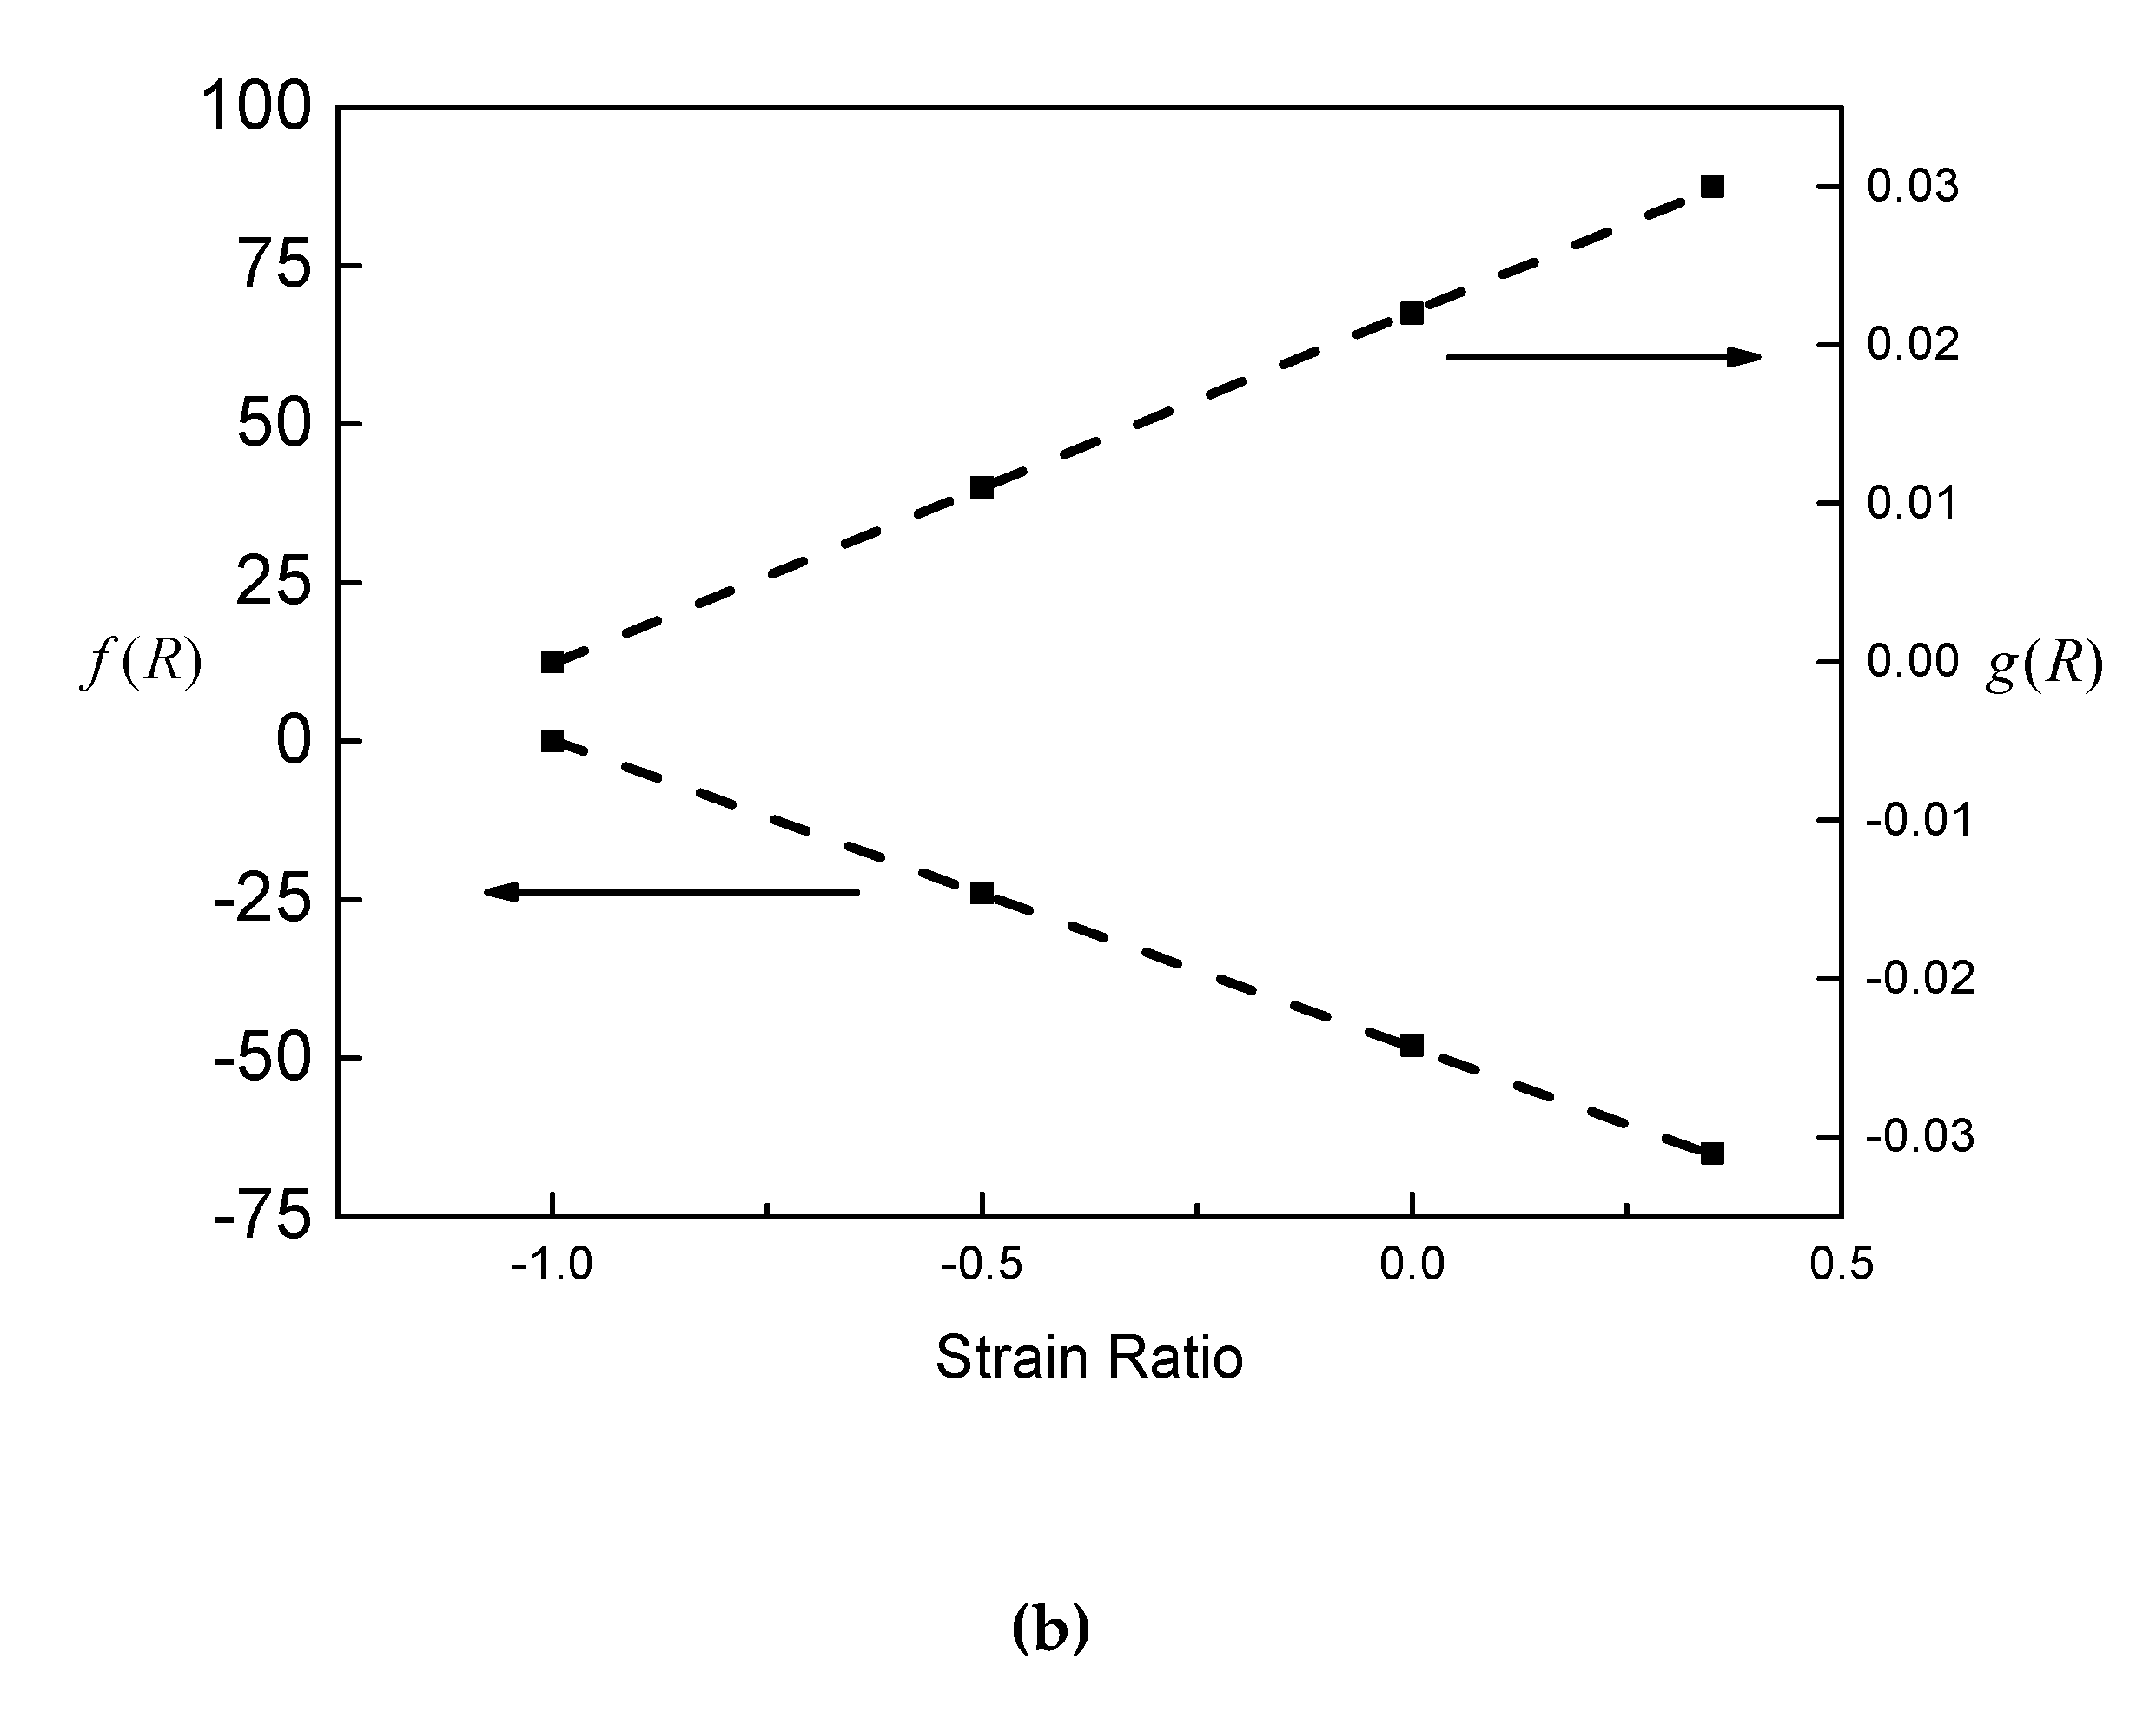
- The corrected fatigue strength coefficient f(R) and fatigue ductility coefficient g(R) show linear correlations with the strain ratio R, which can effectively represent the complex behavior of the material, including the mean stress relaxation and ratcheting;
- (3)
- Temperature is not considered in the present study, which may play a considerable part in the LCF of metallic and nonmetallic materials. Further work could be done in such directions to further understand the LCF mechanism.
Author Contributions
Funding
Conflicts of Interest
Nomenclature
| R | strain ratio |
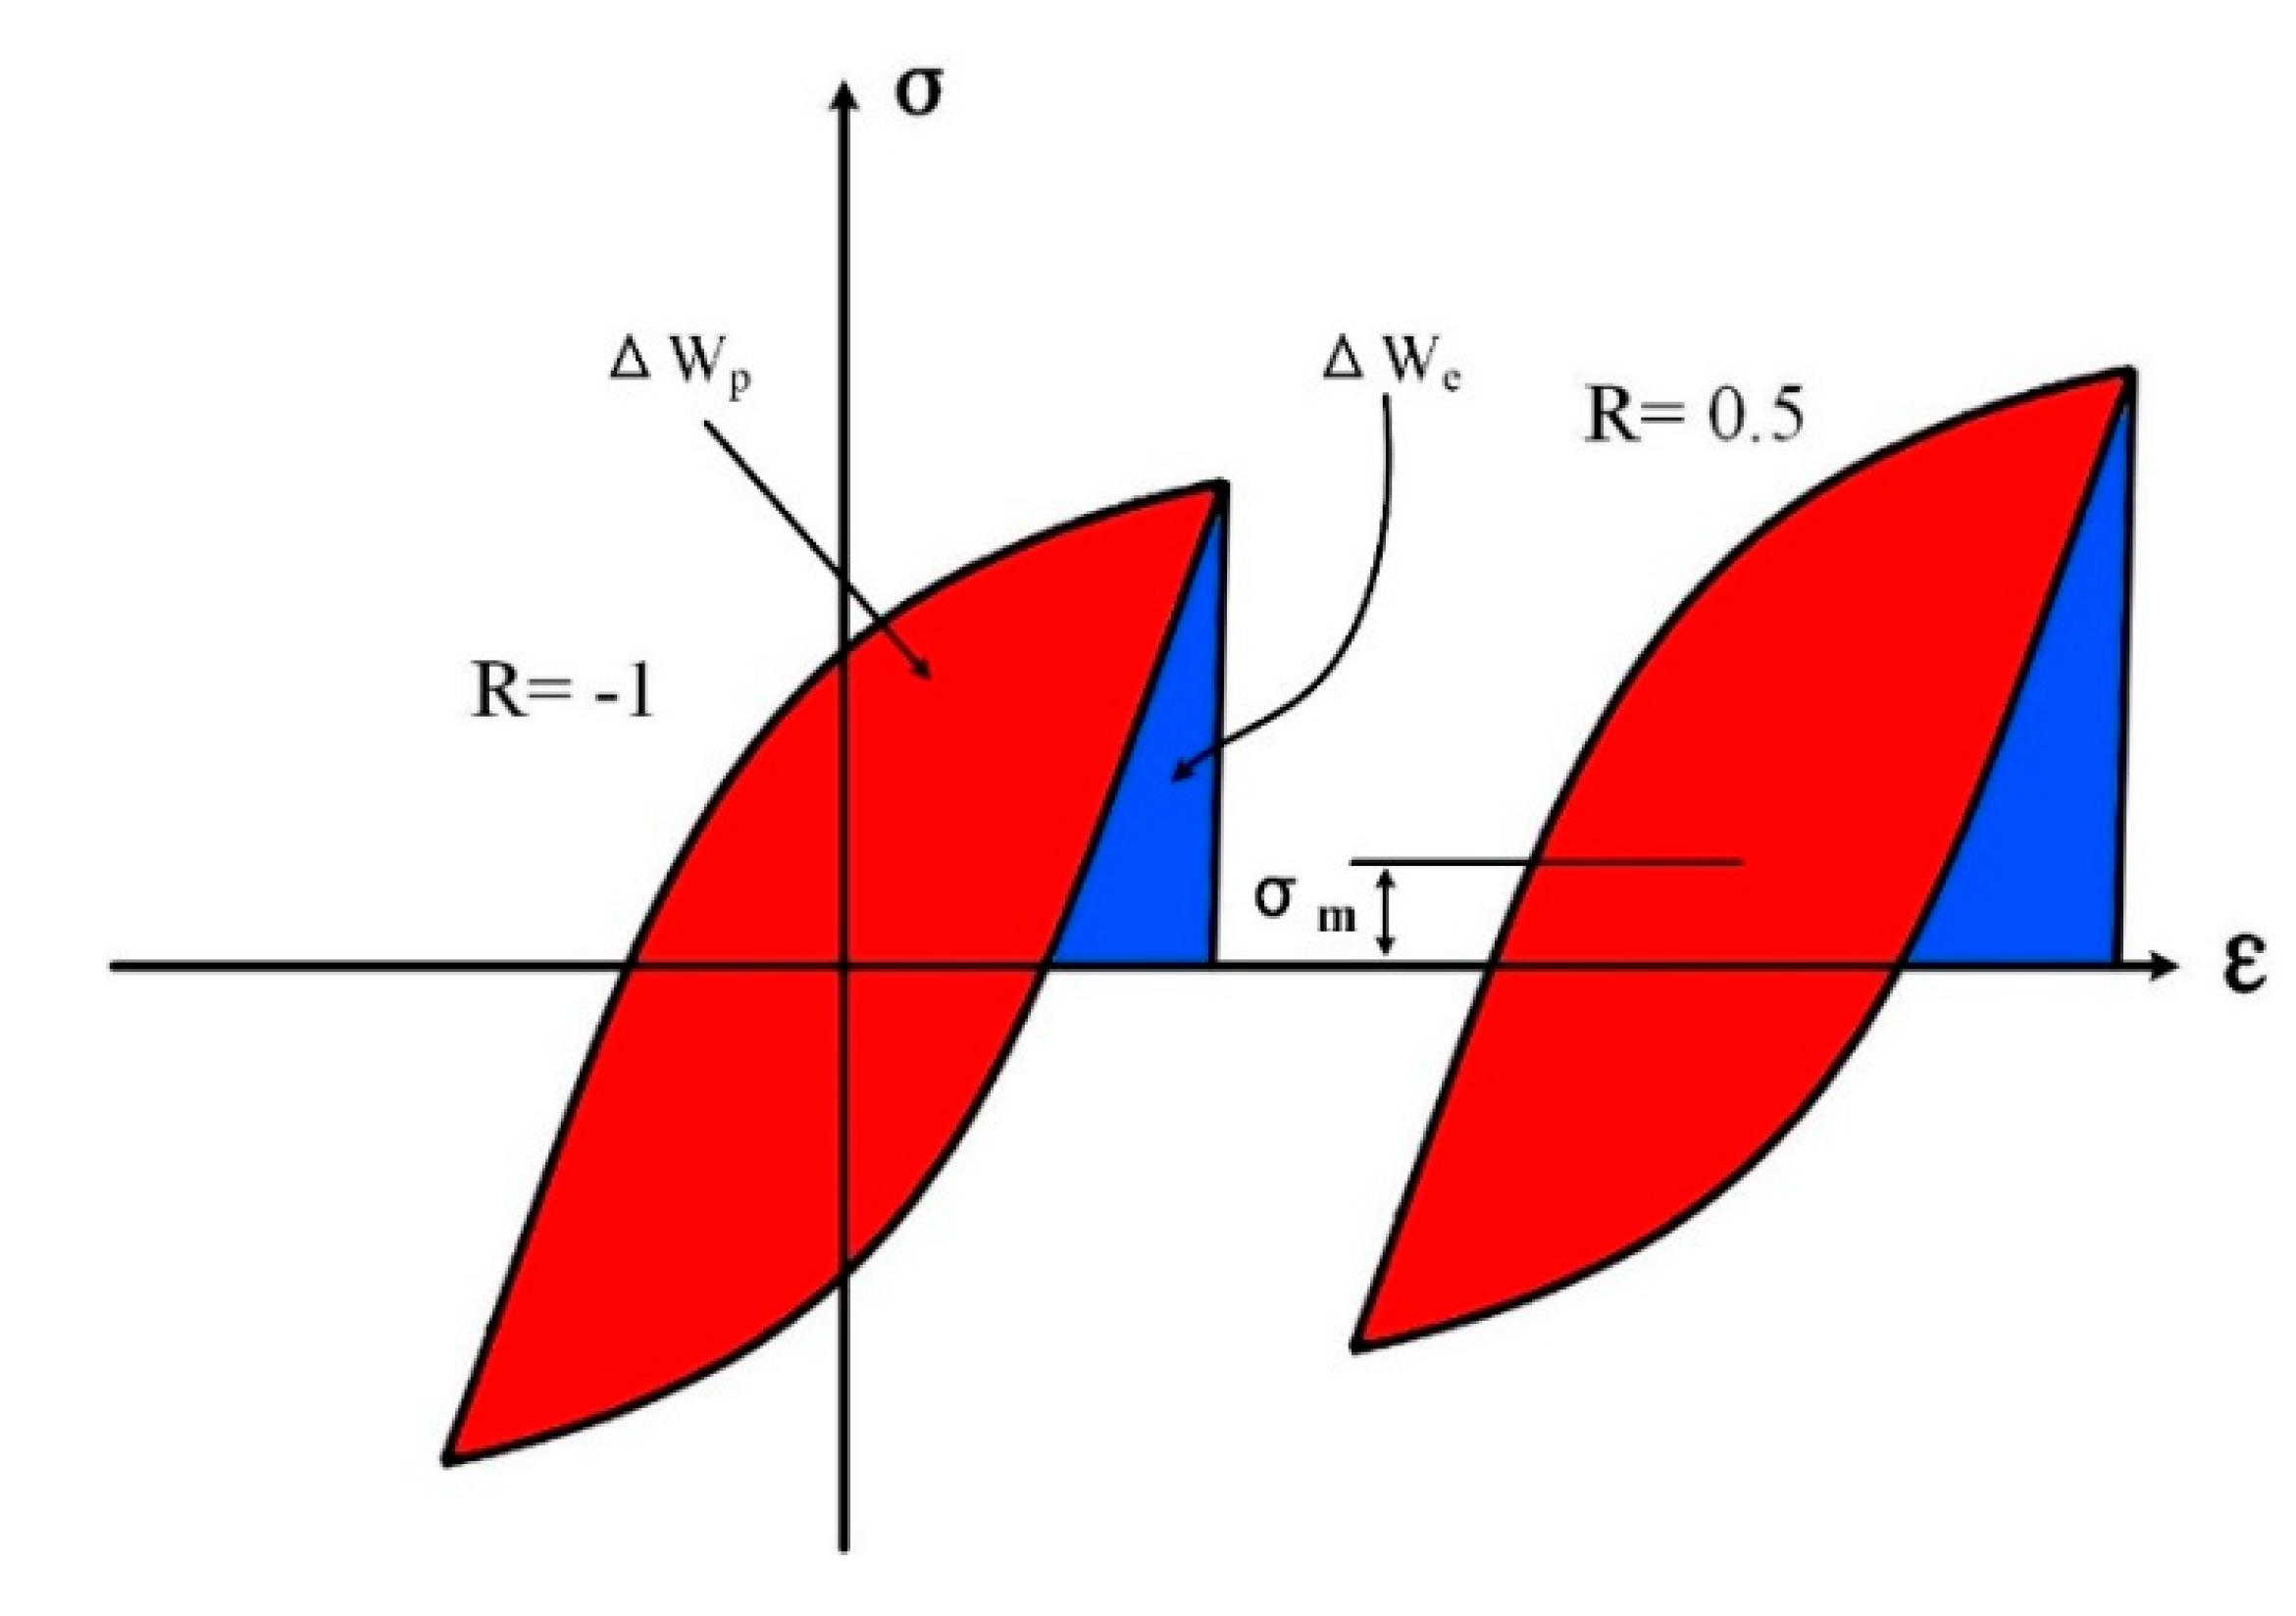
| ΔWp | plastic strain energy |
| ΔWe | elastic strain energy |
| σm | mean stress |
| fatigue strength coefficient | |
| b | fatigue strength exponent |
| fatigue ductility coefficient | |
| c | fatigue ductility exponent |
| E | Young’s modulus |
| σa | stress amplitude |
| σu | tensile limit of material |
| σeq | equivalent stress amplitude |
| γ | material constant of Walker model |
| α | material constant of Kwofie model |
| β, n | material constant of Wang’s model |
| , | material constants of proposed model |
| Nf | experimental life |
| Np | predicted life |
| z | discrepancy of predicted life and experiment life |
| Sz | discrepancy level of predictions |
References
- Ince, A. A generalized mean stress correction model based on distortional strain energy. Int. J. Fatigue 2017, 104, 273–282. [Google Scholar] [CrossRef]
- Delprete, C.; Sesana, R. Proposal of a new low-cycle fatigue life model for cast iron with room temperature calibration involving mean stress and high-temperature effects. Proc. Inst. Mech. Eng. Part C J. Mech. Eng. Sci. 2019, 233, 5056–5073. [Google Scholar] [CrossRef]
- Koh, S.K.; Stephens, R.I. Mean stress effects on low cycle fatigue for a high strength steel. Fatigue Fract. Eng. Mater. Struct. 2007, 14, 413–428. [Google Scholar] [CrossRef]
- Goodman, J. Mechanics Applied to Engineering; Longmans Green and Co.: London, UK, 1930; Volume 1. [Google Scholar]
- Soderberg, C.R. Factor of Safety and Working Stress. ASME Trans. 1930, APM-52–2, 13–28. [Google Scholar]
- Morrow, J.; Sinclair, G. Cycle-dependent stress relaxation. In Proceedings of the Symposium on Basic Mechanisms of Fatigue, ASTM (American Society for Testing Materials) STP (Special Technical Publication), West Conshohocken, PA, USA, 23 June 1959. [Google Scholar]
- Smith, K.; Watson, P.; Topper, T. A stress-strain function for the fatigue of metals. J. Mater. 1970, 5, 767–778. [Google Scholar]
- Zhiqiang, L.V. Research on Low Cycle Fatigue Prediction Methodology of Aero-Engine Disc. Ph.D. Thesis, University of Electronic Science and Technology of China, Chengdu, China, 2016. [Google Scholar]
- Xiaozhong, Z.; Gongyi, W.; Kai, C. LCF Life prediction method of turbine blade roots considering mean stress relaxation effect. J. Mater. Sci. Eng. 2019, 37, 709–713. [Google Scholar]
- Wang, X.L.; Shangguan, W.B.; Rakheja, S. A method to develop a unified fatigue life prediction model for filled natural rubbers under uniaxial loads. Fatigue Fract. Eng. Mater. Struct. 2014, 37, 50–61. [Google Scholar] [CrossRef]
- Zhu, S.; Lei, Q.; Huang, H.Z. Mean stress effects in strain energy-based criterion for fatigue life prediction. In Proceedings of the AIAA/ASCE/AHS/ASC Structures, Structural Dynamics, & Materials Conference, San Diego, CA, USA, 4–8 January 2016. [Google Scholar]
- Ince, A.; Glinka, G. A modification of Morrow and Smith–Watson–Topper mean stress correction models. Fatigue Fract. Eng. Mater. Struct. 2011, 34, 854–867. [Google Scholar] [CrossRef]
- Zhu, S.P.; Huang, H.Z.; He, L.P. A generalized energy-based fatigue-creep damage parameter for life prediction of turbine disk alloys. Eng. Fract. Mech. 2012, 90, 89–100. [Google Scholar] [CrossRef]
- Branco, R.; Costa, J.D.; Borrego, L.P.; Wu, S.C.; Long, X.Y.; Zhang, F.C. Effect of strain ratio on cyclic deformation behaviour of 7050-T6 aluminium alloy. Int. J. Fatigue 2019, 129, 105234. [Google Scholar] [CrossRef]
- Chang, L.; Zhou, B.B.; Ma, T.H.; Li, J.; He, X.H.; Zhou, C.Y. Comparisons of low cycle fatigue behavior of CP-Ti under stress and strain-controlled modes in transverse direction. Mater. Sci. Eng. A 2019, 746, 27–40. [Google Scholar] [CrossRef]
- Hao, H.; Ye, D.; Chen, C. Strain ratio effects on low-cycle fatigue behavior and deformation microstructure of 2124-T851 aluminum alloy. Mater. Sci. Eng. A 2014, 605, 151–159. [Google Scholar] [CrossRef]
- Kwofie, S. An exponential stress function for predicting fatigue strength and life due to mean stresses. Int. J. Fatigue 2001, 23, 829–836. [Google Scholar] [CrossRef]
- Walker, K. The effect of stress ratio during crack propagation and fatigue for 2024-T3 and 7075-T6 aluminum. Am. Soc. Test. Mater. ASTM STP 1970, 462, 1–14. [Google Scholar]
- Koh, S.K. Fatigue damage evaluation of a high pressure tube steel using cyclic strain energy density. Int. J. Press. Vessel. Pip. 2002, 79, 791–798. [Google Scholar] [CrossRef]
- Ong, J.H. An improved technique for the prediction of axial fatigue life from tensile data. Int. J. Fatigue 1993, 15, 213–219. [Google Scholar] [CrossRef]
- Mahtabi, M.J.; Shamsaei, N. A modified energy-based approach for fatigue life prediction of superelastic NiTi in presence of tensile mean strain and stress. Int. J. Mech. Sci. 2016, 117, 321–333. [Google Scholar] [CrossRef]
- Tao, G.; Xia, Z. Mean stress/strain effect on fatigue behavior of an epoxy resin. Int. J. Fatigue 2007, 29, 2180–2190. [Google Scholar] [CrossRef]
- Yu, Q.; Zhang, J.; Jiang, Y. Effect of strain ratio on cyclic deformation and fatigue of extruded AZ61A magnesium alloy. Int. J. Fatigue 2012, 44, 225–233. [Google Scholar] [CrossRef]
- Sun, N.N.; Chiang, Y.J.; Li, G.X. A comparative study of fatigue criteria for engineering application. Appl. Mech. Mater. 2014, 538, 356–359. [Google Scholar] [CrossRef]


| Sz | Manson–Coffin | SWT | Goodman | Morrow | Walker | Lv | Wang | Proposed |
|---|---|---|---|---|---|---|---|---|
| HPTS [19] | 1.848 | 0.706 | 0.439 | 0.377 | 0.362 | 0.834 | 0.378 | 0.247 |
| T851 [16] | 0.924 | 0.163 | 0.193 | 0.183 | 0.184 | 0.156 | 0.265 | 0.152 |
| Resin [22] | 198.732 | 5.225 | 93.33 | 14.949 | 2.519 | 1.2 | 0.47 | 0.467 |
| AZ61A [23] | 4.35 | 1.385 | 0.775 | 1.318 | 0.544 | 0.239 | 0.321 | 0.242 |
© 2020 by the authors. Licensee MDPI, Basel, Switzerland. This article is an open access article distributed under the terms and conditions of the Creative Commons Attribution (CC BY) license (http://creativecommons.org/licenses/by/4.0/).
Share and Cite
Zhang, J.; Li, W.; Dai, H.; Liu, N.; Lin, J. Study on the Elastic–Plastic Correlation of Low-Cycle Fatigue for Variable Asymmetric Loadings. Materials 2020, 13, 2451. https://doi.org/10.3390/ma13112451
Zhang J, Li W, Dai H, Liu N, Lin J. Study on the Elastic–Plastic Correlation of Low-Cycle Fatigue for Variable Asymmetric Loadings. Materials. 2020; 13(11):2451. https://doi.org/10.3390/ma13112451
Chicago/Turabian StyleZhang, Junhong, Weidong Li, Huwei Dai, Nuohao Liu, and Jiewei Lin. 2020. "Study on the Elastic–Plastic Correlation of Low-Cycle Fatigue for Variable Asymmetric Loadings" Materials 13, no. 11: 2451. https://doi.org/10.3390/ma13112451
APA StyleZhang, J., Li, W., Dai, H., Liu, N., & Lin, J. (2020). Study on the Elastic–Plastic Correlation of Low-Cycle Fatigue for Variable Asymmetric Loadings. Materials, 13(11), 2451. https://doi.org/10.3390/ma13112451