Abstract
In situ dilatometry experiments using high energy synchrotron X-ray diffraction in transmission mode were carried out at the high energy material science beamline P07@PETRAIII at DESY (Deutsches Elektronen Synchrotron) for the tempering steel AISI 4140 at defined mechanical loading. The focus of this study was on the initial tempering state () and the hardened state (). Lattice strains were calculated from the 2D diffraction data for different planes and from those temperature-dependent lattice plane specific diffraction elastic constants () were determined. The resulting coupling terms allow for precise stress analysis for typical hypoeutectoid steels using diffraction data during heat treatment processes, that is, for in situ diffraction studies during thermal exposure. In addition, by averaging specific and macroscopic temperature-dependent elastic constants were determined. In conclusion a novel approach for the determination of phase-specific temperature-dependent DECs was suggested using diffraction based dilatometry that provides more reliable data in comparison to conventional experimental procedures. Moreover, the averaging of lattice plane specific results from in situ diffraction analysis supply robust temperature-dependent macroscopic elastic constants for martensite and ferrite as input data for heat treatment process simulations.
1. Introduction
Manufacturing of technical components is always accompanied by the generation of characteristic residual stress distributions. Oftentimes compressive residual stresses, particularly in the near surface regions, are desired, since in most applications the integrity of the parts can be effectively enhanced as, for example, fatigue strength and wear resistance [1,2]. These residual stress states are specifically induced through the manufacturing process or by means of post (heat) treatments. Knowledge of the residual stress states of components and hence their exact determination is of great importance for mechanical engineering, especially for components design and dimensioning. In the course of steady improvement of analysis methods an increasing amount of studies focuses on in situ determination of the development of mechanical or thermal stresses during different kinds of processing. Hence, there is an increasing demand for the provision of data evaluation procedures for proper handling of large data volumes and of qualified evaluation parameters, for example, temperature-dependent elastic constants. Since in many cases, thermal processes are accompanied by phase transformations, X-ray or neutron diffraction analysis is the method of choice for the determination of phase specific diffraction data that allows for monitoring both, phase transformations and the development of local phase specific residual stresses. In polycrystalline materials stress analysis by means of X-ray diffraction always requires coupling constants [3] to convert lattice strains into mechanical stresses. For the assumption of quasi-isotropic specimens specific diffraction elastic constants () [4] can be calculated from single crystal elastic constants from the stiffness tensor or the corresponding compliance tensor . For this different model approaches are used. These approaches, for example, Eshelby-Kröner model [5,6], describe the coupling of crystallites in the polycrystalline compound. For room temperature applications the single crystal elastic constants are tabulated for most elements, many intermetallics and ceramic compounds in databases like Landolt-Börnstein [7]. For individual cases values for at elevated temperatures T are given or a so called temperature factor allows for the calculation of , assuming a linear dependency on T [7]. Apart from this, it is well-known that the (macroscopic) elastic behaviour of materials changes with increasing temperature. In literature it is shown that this trend is not entirely linear [8,9]. These deviations from linearity in the elastic behaviour may cause significant errors in the determination of stresses at elevated temperatures using based on room temperature single crystal constants. To improve the reliability and validity of high temperature stress analysis, as for example, in our own work about in situ laser surface hardening [10,11] there is the necessity of determining high temperature for proper data evaluation. Since the temperature dependency of diffraction elastic constants for specific lattice planes does not necessarily have to correspond with that one of the macroscopic elastic constants, a specific consideration is essential. In case where no reliable are accessible, a possible workaround is the elaborate experimental determination e.g., according to ASTM1426-14 [12] in which X-ray stress analysis on the basis of the well-known -method [13] is carried out during mechanical loading. Here, we report about a more elegant approach for the proper and reliable determination of polycrystal diffraction elastic constants at elevated temperatures for quasi-isotropic materials by using in situ X-ray diffraction load dilatometry experiments in combination with high energy synchrotron X-rays. The motivation of this work is based on the necessity of reliable for the accurate determination of stresses using our well-established measurement setup for in situ stress analysis during laser surface hardening [10,11]. In this regard the determined using the herein proposed dilatometry approach will be used to improve current experimental data on laser surface hardening. Furthermore, averaged macroscopic elastic parameters can directly be used to improve finite element (FE) heat treatment process simulations [14].
2. Materials and Methods
2.1. Experimental Procedure
The investigated material is the common tempering steel AISI 4140 in a quenched and tempered state. Cylindrical samples (full cylinders) with the dimension were mechanically prepared and additionally tempered at for in inert gas atmosphere (Ar) to relieve residual stresses and provide a nearly stress free sample state. The chemical composition is shown in Table 1.

Table 1.
Chemical composition of AISI 4140.
At the high energy material science beamline P07@PETRA III at DESY (Deutsches Elektronen Synchrotron) in Hamburg, Germany, operated by the Helmholtz-Zentzrum Geesthacht (HZG), multiple in situ X-ray load dilatometry experiments were performed. A double crystal monochromator (DCM) equipped with two Si Laue crystals provide a high flux X-ray beam with an energy of (. A cross slit aperture was used to shape the beam cross section to a square of . Debye-Scherrer rings were recorded with a XRD flat area detector Perkin Elmer XRD1621 ( pixels). The chosen sample-detector distance was about and the frame rate was about . A quenching dilatometer of type DIL 805A/D with a load unit from the company TA Instruments equipped with Kapton® windows that allow the primary X-ray beam to enter and the diffracted beam to exit the dilatometer chamber was used. A scheme of the experimental setup is given in Figure 1a and a technical drawing of the sample geometry in Figure 1b.
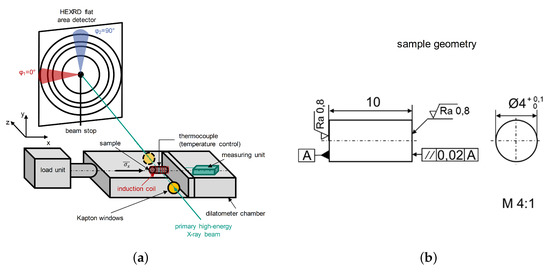
Figure 1.
(a) Scheme of the experimental setup and (b) technical drawing of the sample geometry.
The performed experiments are divided by phase into , describing the initial high tempered sample state of AISI 4140 and for which the samples were heated up to , tempered for and quenched by a He gas stream in the dilatometer with a cooling rate of . To illustrate the link to Table 2 the phase assignments are written italic. In Figure 2 the temperature course of the described heat treatment is given. The kink observed during quenching can clearly be assigned to martensitic transformation.
Table 2.
Experimental plan of investigated phases, test temperatures and maximum stress values (tempered after quenching to ).
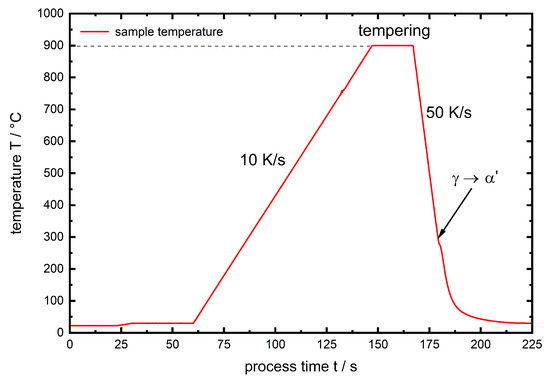
Figure 2.
Temperature course of the pre-heat treatment for the experiments.
The samples were heated up with a heating rate of to the specified test temperature by thermocouple control. Then force-controlled axial load experiments were carried out at different temperatures (isothermal experiment control) for both body centered phases (). Each single load step was held for at least 15 s. For each temperature 4 lattice planes were investigated and the plane specific temperature-dependent elastic constants and hence the corresponding were determined. The analyzed lattice planes of the body centered -iron solid solutions were , , and . The complete experimental plan is given in Table 2 together with the applied maximum stress that was considered for evaluation.
Furthermore, the datasets obtained for the different lattice planes were used to average values to also provide values for the macroscopic temperature-dependent elastic constants and .
2.2. Data Evaluation
The Debye Scherrer rings that were recorded time resolved were evaluated according to Reference [15] in the two principal directions and , see also Figure 1. For this purpose pie slices with an azimuthal range of were defined to increase statistics. Thus, for each time step one dimensional plots of intensity against 2 were obtained and further analyzed using MATLABTM. For the determination of peak positions the different diffraction lines were fitted using a Pseudo-Voigt function. At the investigated temperatures the plane specific lattice spacings and based on those the strains were calculated according to Bragg’s law in both directions. According to Hooke’s law for isotropic materials the stress under uniaxial compression in load direction is given by Equation (1):
where is the macroscopic and is the principal strain in load direction x. Subsequently, we assume the macroscopic stress is equal to the plane specific stress . For the cylindrical samples the strain components perpendicular to the x direction are axisymmetric. Hence, the principle strain directions x, y and z can be substituted in agreement with Figure 1 according to Equations (2) and (3):
This leads to a simple expression for the lattice plane-specific axial strain (Equation (4)):
and the -specific lateral contraction strain is given by (Equation (5))
Here is the -specific . Both Equations (4) and (5) express linear terms with slopes of and respectively. Summarizing the single lattice plane specific data allows for the calculation of macroscopic elastic constants. Daymond [16] presented different approaches for averaging strain data evaluated from multiple diffraction peaks to determine a continuum mechanics equivalent strain (). The macroscopic mean strain is herein averaged from specific data as in Equation (6)
where is the texture index [17] which was set equal to 1 in first approximation for all , under the assumption of a texture free polycrystal, is the peak multiplicity and are the plane specific . The macroscopic can now be calculated on the basis of specific elastic constants by insertion of Equation (6) into Equation (1). In this paper we set up a similar equation to calculate the macroscopic lateral contraction strain using the lattice plane specific , Equation (7).
The results of Equations (6) and (7) are used to calculate the macroscopic according to Equation (8).
The relationships between specific elastic constants and the and are given, according to Reference [4], in Equation (9):
Errorbars for and , respectively and , are based on the quality of linear regression (standard deviation) and propagated in the calculation of .
3. Results and Discussion
3.1. hkl Specific Elastic Constants
The different experiments were numbered from no. 1 to 7 according to the applied temperatures between and (see Table 2). In Figure 3 a diffractogram for and is given for experiment no. 1 () exemplarily.
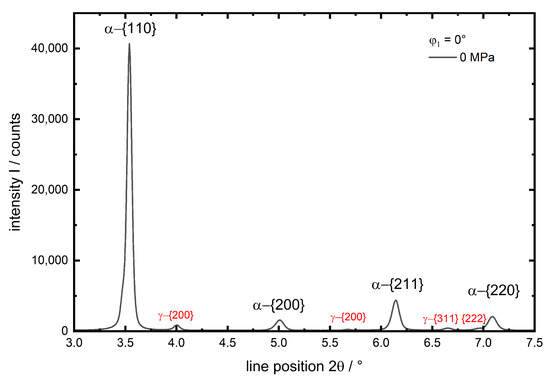
Figure 3.
Diffractogram from experiment no. 1 () before loading in direction. Observed lattice planes are indexed.
The four investigated diffraction planes of the -iron phase are indexed. The much smaller peaks are indexed red. These are only observed for experiment no. 1 and 2. They belong to retained austenite after quenching and are neither existent for the initial () state nor the investigations of at elevated temperatures, since the intensity of the peaks and hence the amount of retained austenite, decreases at elevated temperatures (experiments 4 and 6). Consequently the amount of retained austenite is very small (below %, experiment no. 1), which is no amount for significant load partitioning in comparison to the martensite, this phase is not taken into account during data evaluation. A more detailed, representative view on the behaviour of the peak with increasing load for experiment no. 1 in both evaluated directions x and y is given in Figure 4. In load direction x the peak shows a clear shift to higher values with increasing compressive load (Figure 4a), whereas in the transverse direction y the less pronounced opposite is observed (Figure 4b) due to the much lower transverse strain compared to the strain caused by axial compression.
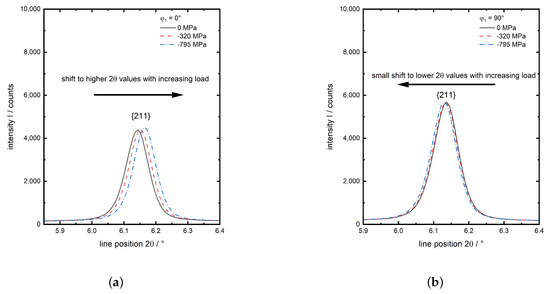
Figure 4.
Detailed graphs of the -Fe from experiment no. 1 ( for three load steps, (a) in load direction and (b) in transverse direction .
In Figure 5a the specific determined strain in load direction is exemplarily plotted against the applied compressive stress for experiment no. 1. Whereas in Figure 5b the corresponding course of transverse strain is shown. The lattice plane specific strains are calculated from the peak positions according to Equation (10):
where is the line position determined after reaching the test temperature before mechanical loading.
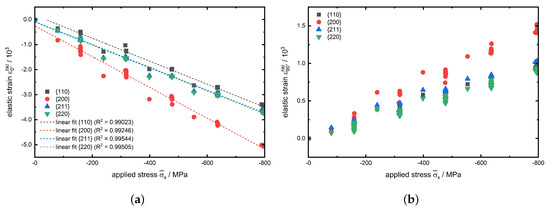
Figure 5.
(a) Axial strain in load direction against the applied stress plus the linear fit interpolation as dashed lines and (b) lateral strain against the applied stress for the investigated lattice planes of experiment no. 1.
Furthermore in Figure 5a, the associated linear fits are shown as dashed lines for the investigated lattice planes . According to Equation (4) the slopes of these distributions correspond to the inverse for the specific lattice plane of type . As expected, the slopes of the linear fits for the and reflections are nearly identical, since they represent the same lattice plane family. Obviously, the determined for the lattice planes nearly coincides with the value for the and planes with a value of approx. . It is observed that the linear fit for has a much lower slope resulting in a significant lower value for with about . These results are in good agreement with literature and are explained by the elastic anisotropy of the -iron unit cell, cf. Figure 6, which can mathematically be expressed by the elastic anisotropy factor . In case of cubic crystals, is given as:
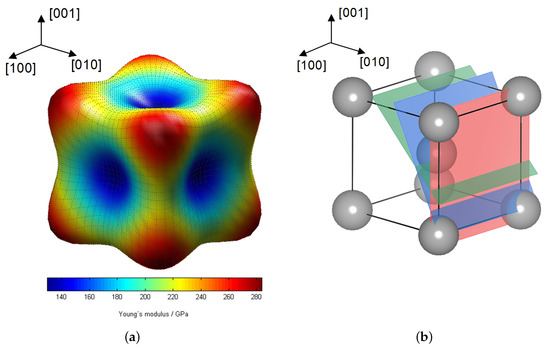
Figure 6.
(a) Elastic anisotropy of the -Fe unit cell at (calculated with DECcalc [18]) and (b) scheme of the -iron unit cell with illustration of the investigated lattice planes.
In Figure 6b the locations of the herein investigated lattice planes in a body-centered cubic () unit cell is shown. Since here is valid here the lattice plane has to be the least stiff plane with the lowest . This fact is confirmed by Figure 5a where the linear fit has the smallest slope. This correlation is illustrated in Figure 6a, showing the elastic anisotropy of the of the -Fe unit cell.
For the determination of the lattice plane specific a plot of the transverse strain against the axial strain is shown for experiment no. 1 in Figure 7. The determined slopes from the linear fits correspond (according to Equation (5)) to . Here again, the absolute values of the slopes for and are nearly identical at about . The lattice plane has a slightly higher of about . An even higher value of about is determined for the low-indexed lattice plane, which again can also be attributed to the elastic anisotropy of the unit cell and the much higher transverse strain (at equal maximum load) in Figure 7 also gives a first indication for the higher values for .
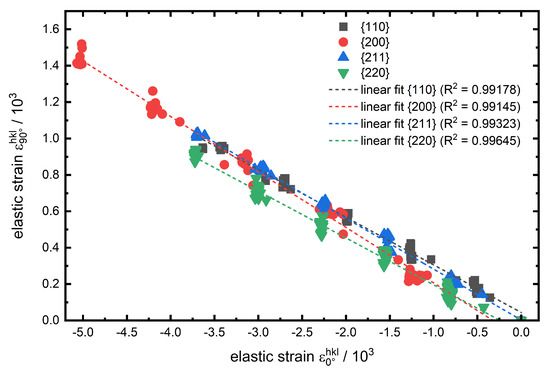
Figure 7.
Transverse elastic strain against axial elastic strain and the linear fit interpolation for the investigated lattice planes of experiment no. 1.
In Figure 8 the specific for all experiments are plotted against the temperature.
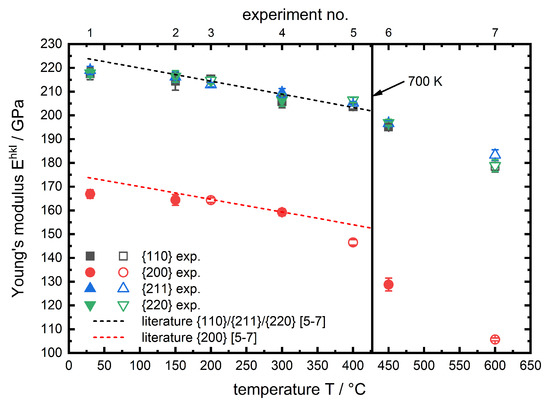
Figure 8.
Temperature-dependent specific for the investigated phases of AISI 4140. Literature data shown as a 1st order polynomial fit based on single crystal constants from Reference [7] and calculated according to Kröner [6]. Filled symbols for and blank symbols for phase.
The corresponding plot for the is shown in Figure 9.
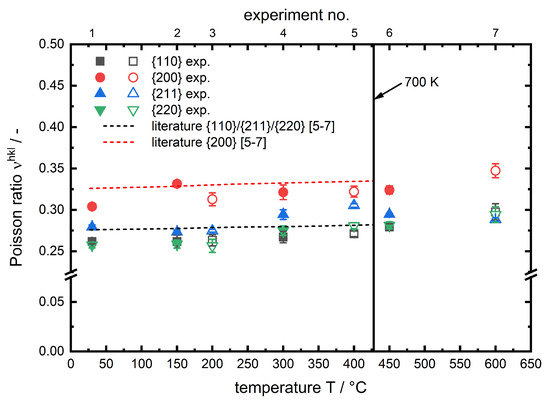
Figure 9.
Temperature-dependent specific for the investigated phases of AISI 4140. Literature data shown as a 1st order polynomial fit based on single crystal constants from Reference [7] and calculated according to Kröner [6]. Filled symbols for and blank symbols for phase.
In both figures the results are plotted alongside data based on single crystal elastic constants from References [6,7] for -iron in the range of 27 to . Following the temperature course of specific and one can observe that there is no distinct difference between the two investigated phases (). Therefore the reason can be seen in the structure of the two phases. Ferrite has a body centered cubic () lattice structure, while the lattice structure of martensite is tetragonal body centered (). Due to the low carbon content the tetragonal distortion of martensite is rather low (≈0.2%) [19] and therefore the lattice structure is close to cubic, which explains that the micromechanical behaviour of ferrite and martensite for the hypoeutectoid steel in the investigated temperature range is almost identical to one another, hence for both phases a similar trend can be observed. The specific decrease with increasing temperature in all cases. This behaviour is well known in literature for macroscopic [8]. It can be explained using the binding potential. With increasing temperature the atoms start vibrating more, which results in an increase of the average interatomic equilibrium distance (thermal strain). Since the can be described as the 2nd derivative of the binding potential at it has to decrease with increasing temperature. The interatomic equilibrium distance is much higher for the lattice planes compared to other investigated lattice planes. In both figures the dashed lines show the corresponding lattice plane specific results, based on single crystal constants from Reference [7], which are calculated according to Kröner [6] up to a temperature of . In this temperature range the results of the in situ X-ray load dilatometry studies are in very good agreement with the literature data for pure -iron. A further temperature rise leads to a steeper decrease of , in particular for the lattice plane. This behaviour for steels is neither observed nor discussed (specifically for steel) in literature. But for macroscopic of oxide ceramics, Watchman et al. [8] described the non-linear decrease of the elastic constant approach, for a wide temperature range, using a exponential function. Li et al. [9] observed a comparable temperature course for the macroscopic of hafnium carbide HfC at very high temperatures and expanded the exponential approach analytically. Regarding the presented results for ferritic steels we expect similar correlations causing this effect. However, in lists of tables i. a. Landolt-Börnstein [7] for pure iron there is unfortunately no temperature factor given for for temperatures higher than (). This does not allow for a reliable calculation of plane specific elastic constants in this region. Certainly, it must be mentioned that the course of with temperature for -iron, given in Reference [7], is also further decreasing for temperatures higher than . This might contribute to the steeper degression of the lattice plane specific and also to a steeper increase of the lattice plane specific , observed during our in situ X-ray load dilatometry studies as can be seen in Figure 8. A similar behaviour was previously observed for the same diffraction planes in an in situ tensile test experiment of the structural steel S690QL1 by Dutta et al. [20]. In summary it can be stated that up to nearly for all investigated lattice planes there is no significant difference between the experimentally determined values and the linear course of literature based data. For higher temperatures a deviation from this linear trend can be observed, which is most pronounced for the lattice planes and must be taken into account for stress calculation for in situ diffraction studies on ferritic steels at elevated temperatures.
3.2. Macroscopic Elastic Constants
The results from averaging the lattice plane specific data according to Daymond [16] is given in Figure 10.
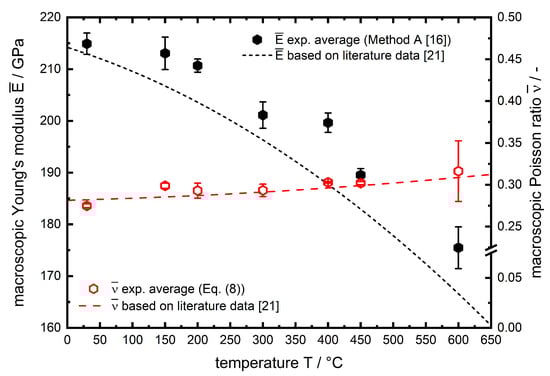
Figure 10.
Macroscopic temperature-dependent and of AISI 4140 averaged according to Daymond [16]. Literature data is shown as a 3rd order (), respectively 2nd order () polynomial fit based on data from Miokovic [21].
Additionally, the temperature course of and is shown as dashed lines based on macroscopic data [21] determined by high temperature tensile tests. For both elastic parameters, there is a very good agreement of and with the temperature course of conventionally determined (high temperature tensile tests) elastic constants. For all data points the is slightly higher compared to literature. These deviations may occur due to chemical fluctuations of the material or simply due to the approach of calculating macroscopic values from lattice specific results versus macroscopic high temperature tensile tests. In this regard it must be mentioned that the approach to use diffraction data to determine temperature dependent elastic constants has a crucial advantage over most macroscopic test methods. The diffraction approach is insensitive to temperature gradients since the data is collected in a localized materials volume. Regarding the current experiment using dilatometry, the induction heating results in temperature gradients along the length of the cylindrical sample. However, this has no impact on the diffraction data presented here. A weak point seems to be the texture of the material, included as in Equations (6) and (7). In this work, the assumption of of is well justified, since the intensity ratio over a single diffraction ring varies between –2 for all experiments, which allows the conclusion that there is no pronounced crystallographic texture. However, the temperature dependency of the is less pronounced than for the . The high error bars for can be explained by the lower measurement statistics due to the necessity of applying small compressive loads to ensure purely elastic deformation since the high temperature strength became rather small. All data for the values for and determined using of the in situ X-ray load dilatometry approach are tabulated with their corresponding deviations in Table 3.
Table 3.
Macroscopic temperature-dependent and determined from lattice plane specific data based on the approach of Daymond [16] and Equation (8).
4. Conclusions
Multiple in situ X-ray diffraction dilatometric load experiments were performed for different temperatures and the lattice plane specific temperature-dependent elastic constants for four different of the -iron phase () and for the phase of the hypoeutectoid tempering steel AISI 4140 were determined. The experiments were performed for a temperature range between and . From the recorded diffraction data the were determined and the macroscopic elastic constants were averaged using the approach of Daymond [16] from the lattice plane specific results. The complete set of lattice plane specific results for the investigated temperatures is given in Table A1 in the Appendix A. The following conclusions can be drawn:
- In situ X-ray diffraction load dilatometry experiments provide a suitable tool to determine lattice plane specific elastic constants and hence .
- The experiments are much faster in comparison to conventional laboratory X-ray diffraction experiments for determination of ; annealing effects for steel samples can be safely neglected.
- Macroscopic and Poisson ratios can reliably be derived from averaging multiple specific elastic constants and can further be used as input data to improve FE heat treatment simulations, for example, laser hardening process simulation.
- Only for high-indexed planes with , for example, , in the first instance, it can be assumed that the temperature-dependent micro-mechanical behavior can accurately be approximated through the temperature dependency of the macroscopic elastic constants.
- For lower indexed planes like especially above large errors occur through the approximation based on macroscopic elastic constants.
- In summary, for temperatures higher than deviations occur from the thus far observed linear trend of the lattice plane specific and against temperature. These deviations have to be taken into account for precise stress calculations, especially at in situ diffraction studies on ferritic steels at elevated temperatures.
The shown results are useful in two regards. First, high temperature X-ray diffraction stress analysis of AISI 4140 becomes more reliable using the determined temperature-dependent . Secondly, averaging the results delivers a solid data basis of macroscopic elastic parameters which can be used in heat treatment simulations, due to the fail-safe neglect of tempering effects during the fast experimentation.
Author Contributions
Conceptualization, D.K. and J.G.; methodology, D.K.; formal analysis, D.K.; investigation, D.K., J.G. and A.S.; data curation, D.K.; writing—original draft preparation, D.K.; writing—review and editing, J.G. and A.S.; visualization, D.K.; supervision, J.G.; project administration, J.G.; funding acquisition, J.G. All authors have read and agreed to the published version of the manuscript.
Funding
This research was funded by German Research Foundation (DFG) through the project GI376/10-2 | BE5341/1-2.
Acknowledgments
The authors would like to thank DESY beamtime comittee for granting beamtime at P07@PETRA III, DESY. We acknowledge support by the KIT-Publication Fund of the Karlsruhe Institute of Technology.
Conflicts of Interest
The authors declare no conflict of interest.
Abbreviations
The following abbreviations are used in this manuscript:
| DESY | Deutsches Elektronen Synchrotron |
| DEC(s) | Diffraction Elastic Constant(s) |
| HZG | Helmholtz-Zentrum Geesthacht |
| DCM | Double Crystal Monochromator |
Appendix A
Table A1.
Lattice plane specific temperature-dependent , and .
Table A1.
Lattice plane specific temperature-dependent , and .
| Experiment | Phase | Temperature | |||||
|---|---|---|---|---|---|---|---|
| No. | MPa | - | |||||
| 1 | 30 | ||||||
| 2 | 150 | ||||||
| 3 | 200 | ||||||
| 4 | 300 | ||||||
| 5 | 400 | ||||||
| 6 | 450 | ||||||
| 7 | 600 | ||||||
| 1 | 30 | ||||||
| 2 | 150 | ||||||
| 3 | 200 | ||||||
| 4 | 300 | ||||||
| 5 | 400 | ||||||
| 6 | 450 | ||||||
| 7 | 600 | ||||||
| 1 | 30 | ||||||
| 2 | 150 | ||||||
| 3 | 200 | ||||||
| 4 | 300 | ||||||
| 5 | 400 | ||||||
| 6 | 450 | ||||||
| 7 | 600 | ||||||
| 1 | 30 | ||||||
| 2 | 150 | ||||||
| 3 | 200 | ||||||
| 4 | 300 | ||||||
| 5 | 400 | ||||||
| 6 | 450 | ||||||
| 7 | 600 |
References
- Scholtes, B. Eigenspannungen in Mechanisch Randschichtverformten Werkstoffzuständen: Ursachen, Ermittlung und Bewertung; DGM Informationsgesellschaft: Oberursel, Germany, 1991. [Google Scholar]
- Schijve, J. Fatigue of Structures and Materials; Springer: Dordrecht, The Netherlands, 2008. [Google Scholar]
- Hauk, V. 2.13—X-ray elastic constants (XEC). In Structural and Residual Stress Analysis by Nondestructive Methods; Hauk, V., Ed.; Elsevier Science B.V.: Amsterdam, The Netherlands, 1997; pp. 279–336. [Google Scholar]
- Hauk, V.; Wolfstieg, U. Röntgenographische Elastizitätskonstanten, REK. HTM Haerterei-Techn. Mitt. 1976, 31, 38–47. [Google Scholar]
- Eshelby, J.D. The Determination of the Elastic Field of an Ellipsoidal Inclusion, and Related Problems. Proc. R. Soc. Lond. Ser. A Math. Phys. Sci. 1957, 241, 376–396. [Google Scholar]
- Kröner, E. Berechnung der elastischen Konstanten des Vielkristalls aus den Konstanten des Einkristalls. Z. Phys. 1958, 151, 504–518. [Google Scholar] [CrossRef]
- Every, A.G.; McCurdy, A.K. Landolt-Börnstein—Group III Condensed Matter—Low Frqeuency Properties of Dielectric Crystals-Second and Higher Oder Elastic Constants; Springer: Berlin, Germany, 1992; Volume 29a. [Google Scholar]
- Wachtman, J.B.; Tefft, W.E.; Lam, D.G.; Apstein, C.S. Exponential Temperature Dependence of Young’s Modulus for Several Oxides. Phys. Rev. 1961, 122, 1754–1759. [Google Scholar] [CrossRef]
- Li, W.; Wang, R.; Li, D.; Fang, D. A Model of Temperature-Dependent Young’s Modulus for Ultrahigh Temperature Ceramics. Phys. Res. Int. 2011. [Google Scholar] [CrossRef]
- Kostov, V. Untersuchungen zur zeitaufgelösten Spannungsentwicklung und Eigenspannungsentstehung beim Laserstrahlstandhärten am Beispiel des Stahls 42CrMo4. Ph.D. Thesis, Karlsruhe Institute of Technology, Karlsruhe, Germany, 2014. [Google Scholar]
- Kiefer, D.; Gibmeier, J.; Beckmann, F.; Wilde, F. Fast Temporal and Spatial Resolved Stress Analysis at Laser Surface Line Hardening of Steel AISI 4140. In Proceedings of the International Conference on Mechanical Stress Evaluation by Neutron and Synchrotron Radiation, Skukuza, South Africa, 19–21 September 2017; Marais, D., Holden, T.M., Venter, A.M., Eds.; Materials Reserach Forum LLC: Millersville, PA, USA, 2017; Volume 4, pp. 91–96. [Google Scholar]
- ASTM E1426-14:2014. Standard Test Method for Determining the X-Ray Elastic Constants for Use in the Measurement of Residual Stress Using X-Ray Diffraction Techniques; ASTM International: West Conshohocken, PA, USA, 2014. [Google Scholar]
- Macherauch, E.; Müller, P. Das sin2ψ-Verfahren der röntgenographischen Spannungsmessung. Z. Angew. Phys. 1961, 13, 305–312. [Google Scholar]
- Kiefer, D.; Schüssler, P.; Mühl, F.; Gibmeier, J. Experimental and Simulative Studies on Residual Stress Formation for Laser-Beam Surface Hardening. HTM J. Heat Treat. Mater. 2019, 74, 23–35. [Google Scholar] [CrossRef]
- Hammersley, A.P. FIT2D: An Introduction and Overview; ESRF Internal Report, ESRF97HA02T; ESRF: Grenoble, France, 1997. [Google Scholar]
- Daymond, M.R. The determination of a continuum mechanics equivalent elastic strain from the analysis of multiple diffraction peaks. J. Appl. Phys. 2004, 96, 4263–4272. [Google Scholar] [CrossRef]
- Kocks, F.; Tomé, C.; Wenk, H.R. Texture and Anisotropy. Preferred Orientations in Polycrystals and Their Effect on Material Properties; Cambridge University Press: Cambridge, UK, 2000. [Google Scholar]
- Manns, T.; Scholtes, B. DECcalc—A Program for the Calculation of Diffraction Elastic Constants from Single Crystal Coefficients. Mater. Sci. Forum 2011, 681, 417–419. [Google Scholar] [CrossRef]
- Roberts, C.S. Effect of Carbon on the Volume Fractions and Lattice Parameters Of Retained Austenite and Martensite. JOM 1953, 5, 203–204. [Google Scholar] [CrossRef]
- Dutta, R.; Huizenga, R.; Amirthalingam, M.; King, A.; Gao, H.; Hermans, M.; Richardson, I. In situ synchrotron diffraction studies on the temperature-dependent plane-specific elastic constants in a high-strength quenched and tempered structural steel. Scr. Mater. 2013, 69, 187–190. [Google Scholar] [CrossRef]
- Miokovic, T. Analyse des Umwandlungsverhaltens bei ein- und mehrfacher Kurzzeithärtung bzw. Laserstrahlhärtung des Stahls 42CrMo4. Ph.D. Thesis, TU Karlsruhe, Karlsruhe, Germany, 2005. [Google Scholar]
© 2020 by the authors. Licensee MDPI, Basel, Switzerland. This article is an open access article distributed under the terms and conditions of the Creative Commons Attribution (CC BY) license (http://creativecommons.org/licenses/by/4.0/).