Ti–Zr–Si–Nb Nanocrystalline Alloys and Metallic Glasses: Assessment on the Structure, Thermal Stability, Corrosion and Mechanical Properties

 ,
,  , ,
, , 
 , , ,
, , ,  ,
,  ,
,  ,
,  and
and 
Abstract
:1. Introduction
2. Materials and Methods
2.1. Materials Design
- MS1—ZrO2 crucibles, crucible outlet diameter 1 mm, positioned at 1 mm distance from the copper disk. The copper disk rotation speed was 2600 rpm (resulting in a peripheral speed of 28 m/s). The entire setup (induction coil, crucible, copper disk) was introduced in a steel rectangular enclosure, which was purged with argon (P = 1.5 bar), to avoid oxidation.
- MS2—BN crucibles, crucible outlet diameter 0.8 mm, positioned at 0.5 mm distance from the copper disk. The copper wheel had a peripheral speed of 36 m/s. The chamber was evacuated to 10−6 mbar, followed by argon purging.
2.2. Characterization of Ti-based Metallic Structures
3. Results and Discussions
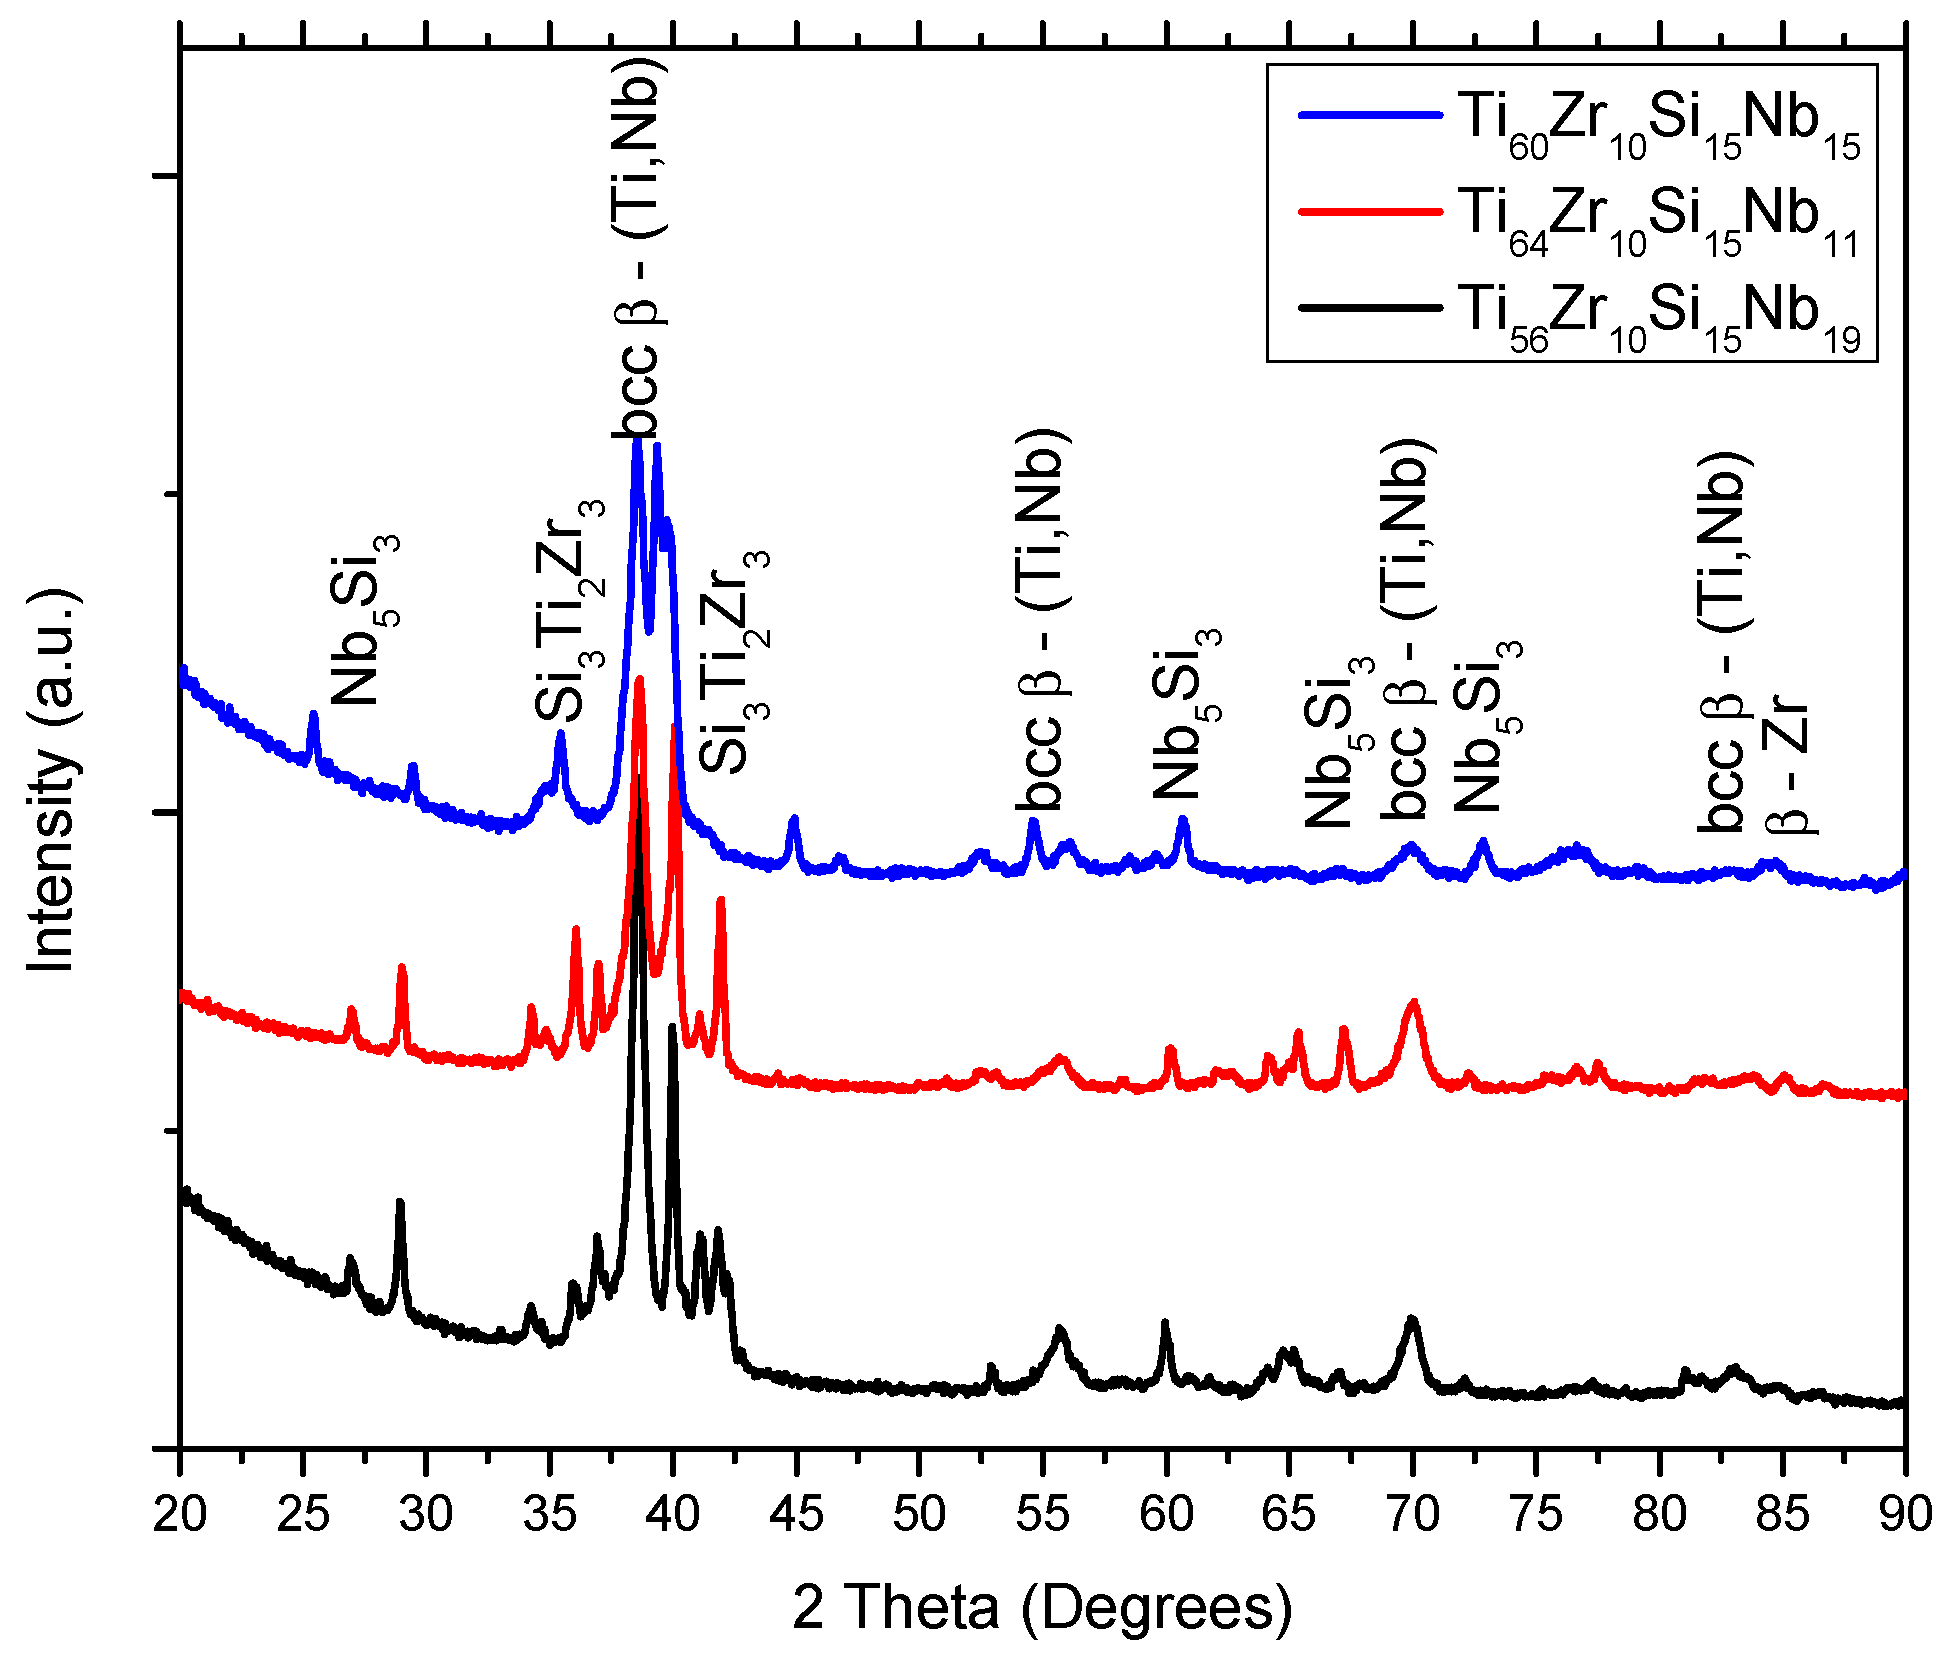
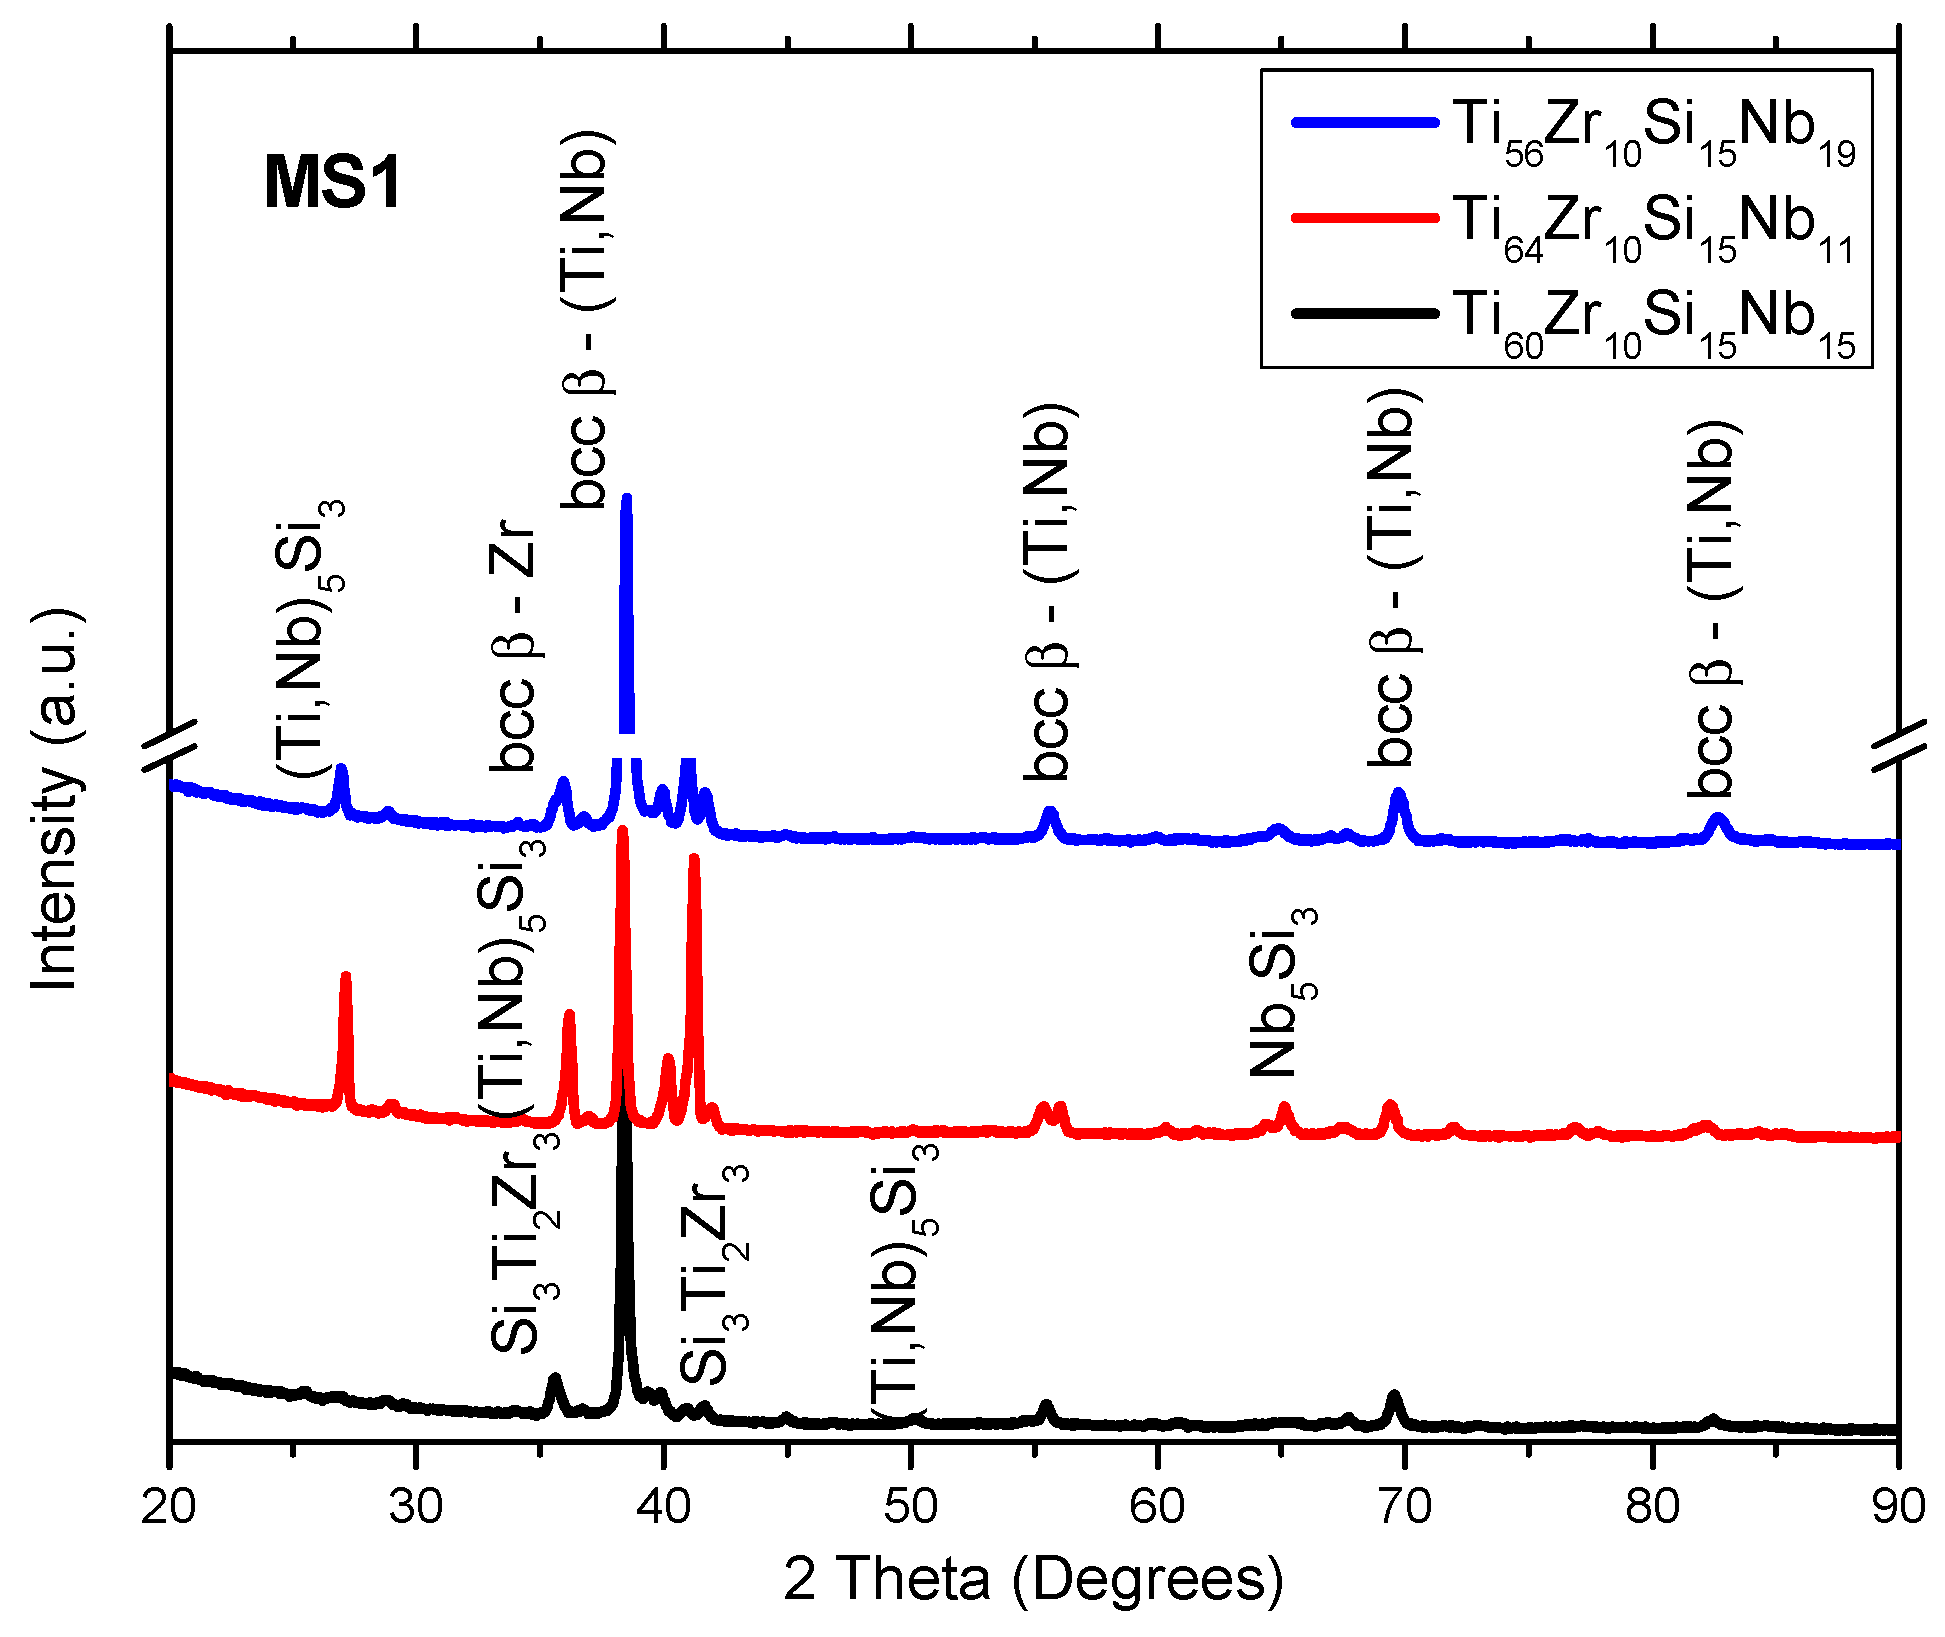
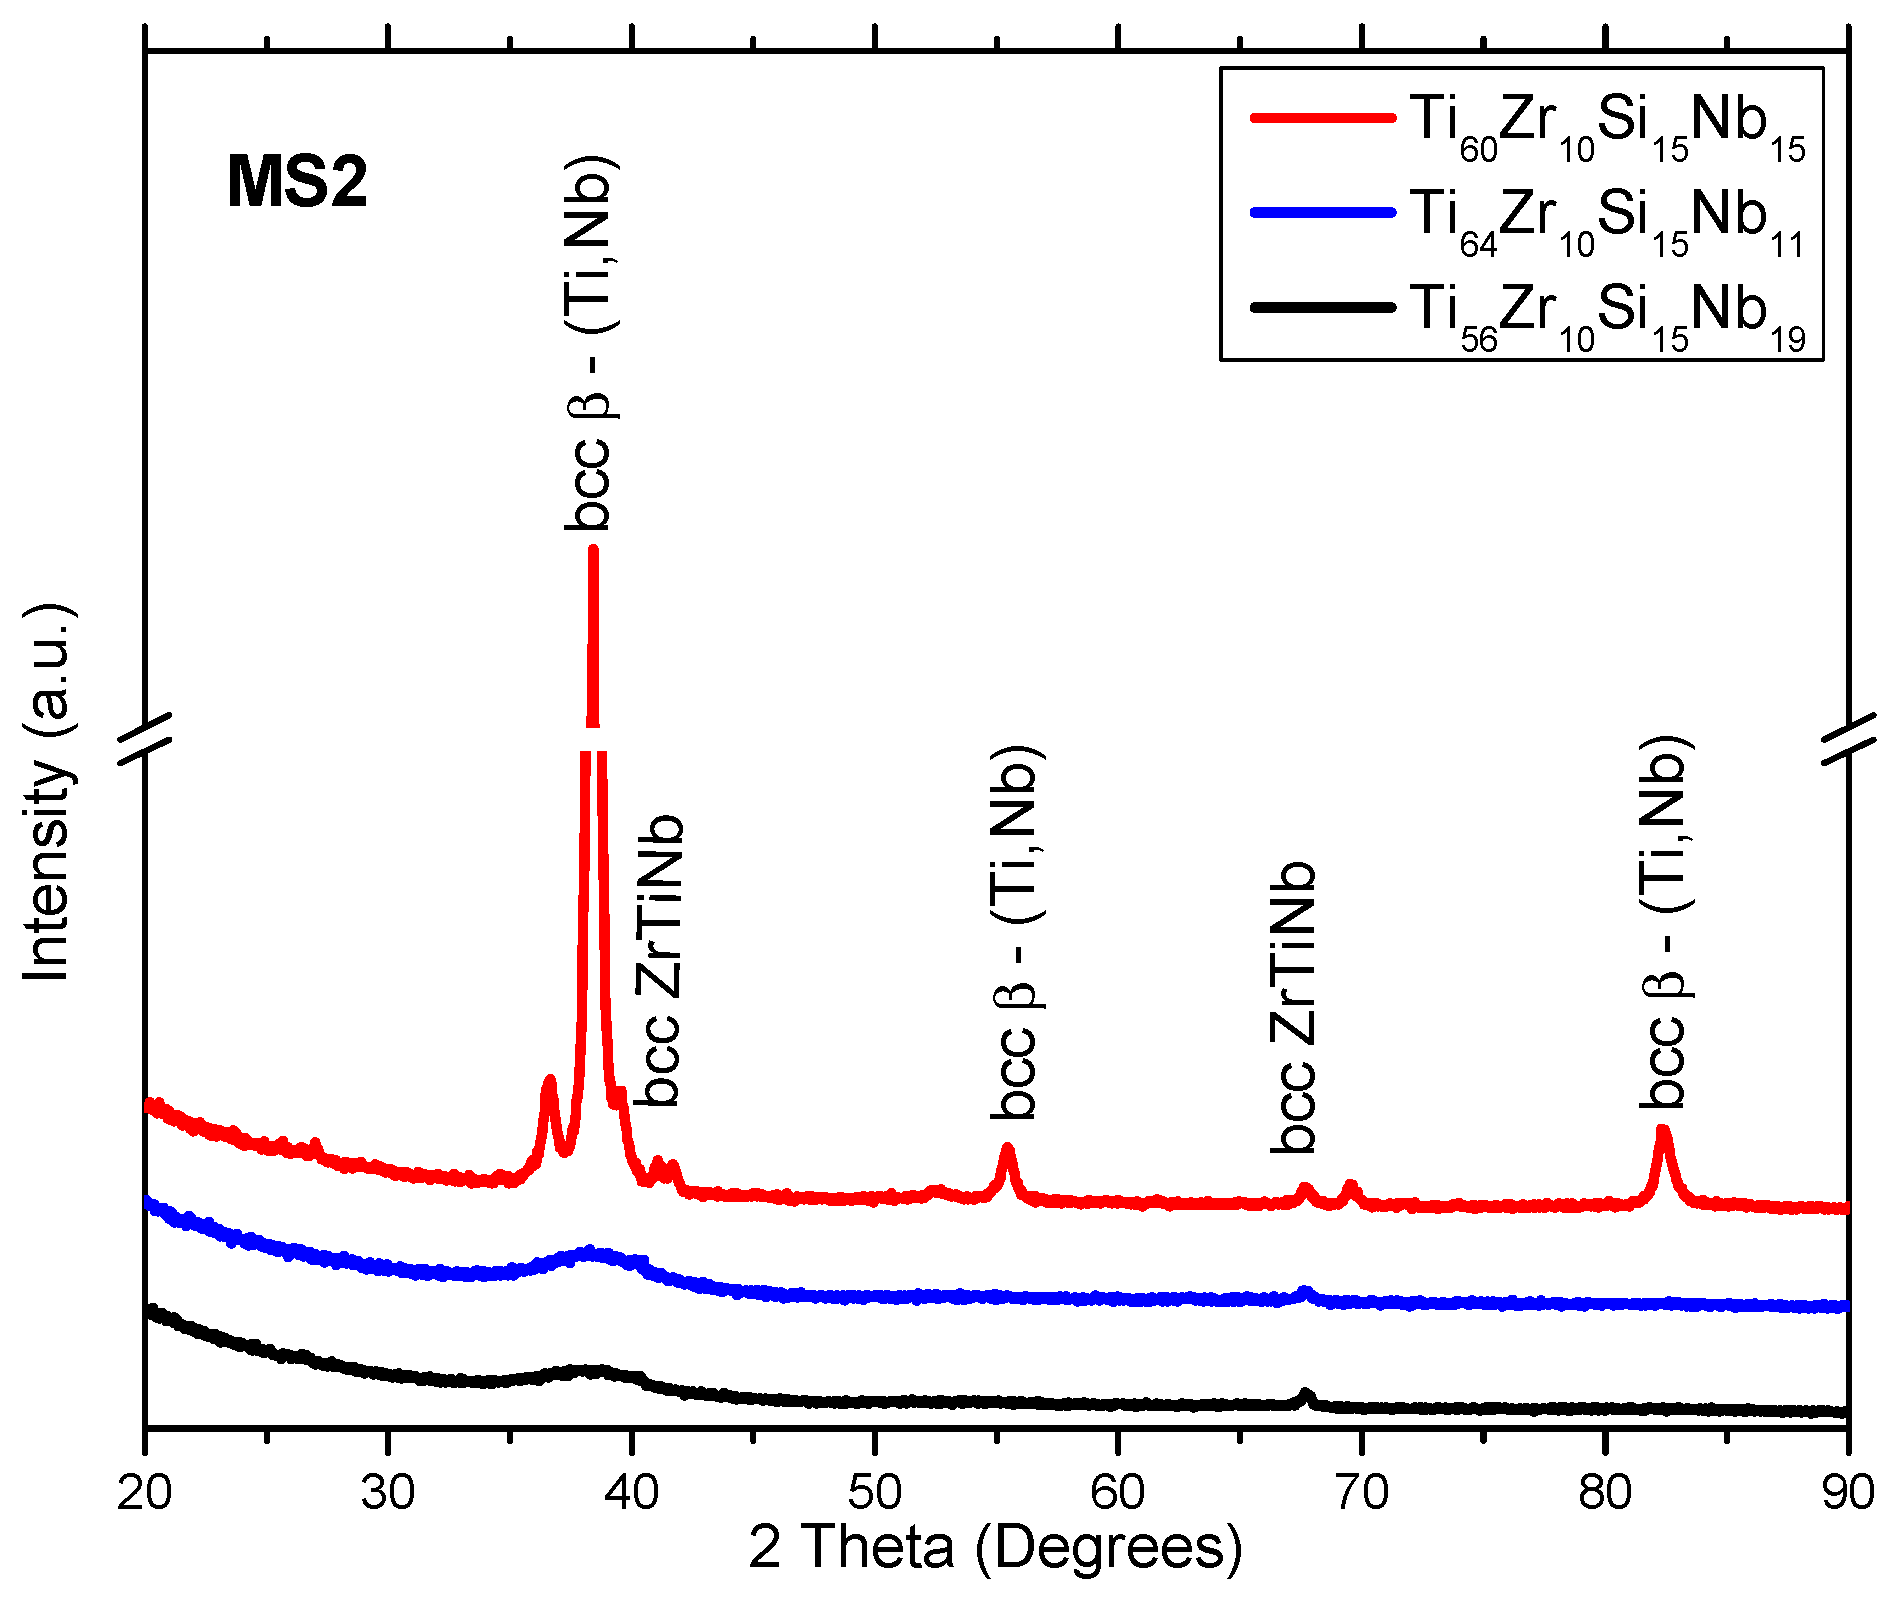
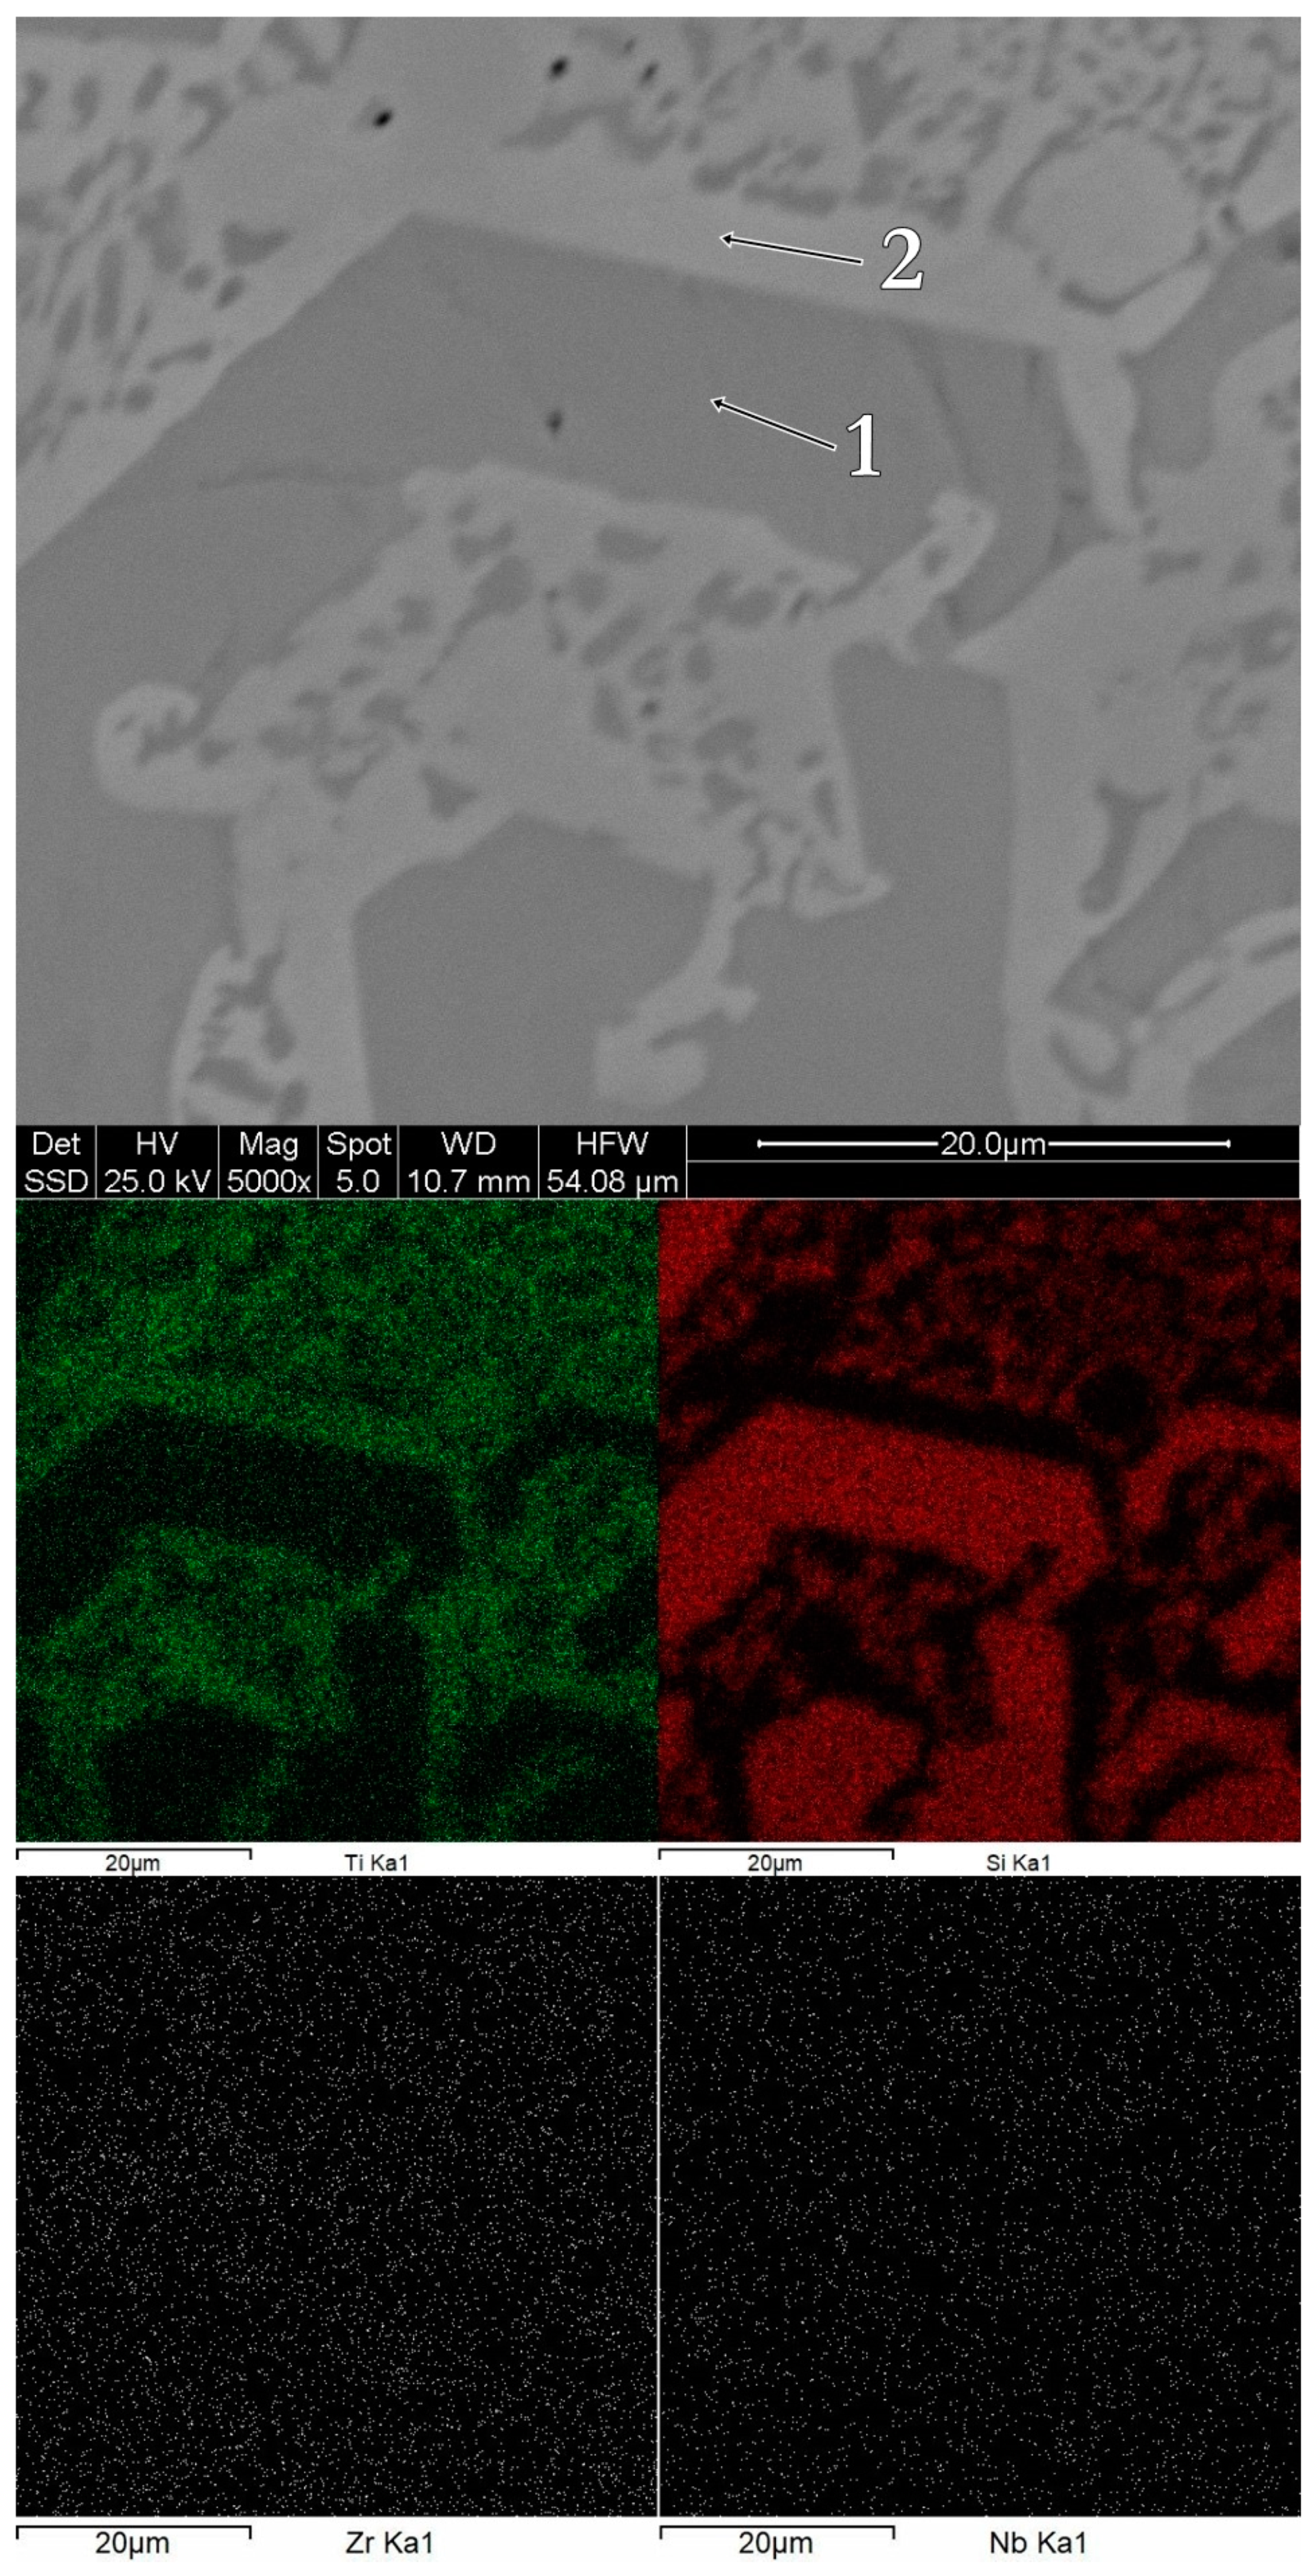
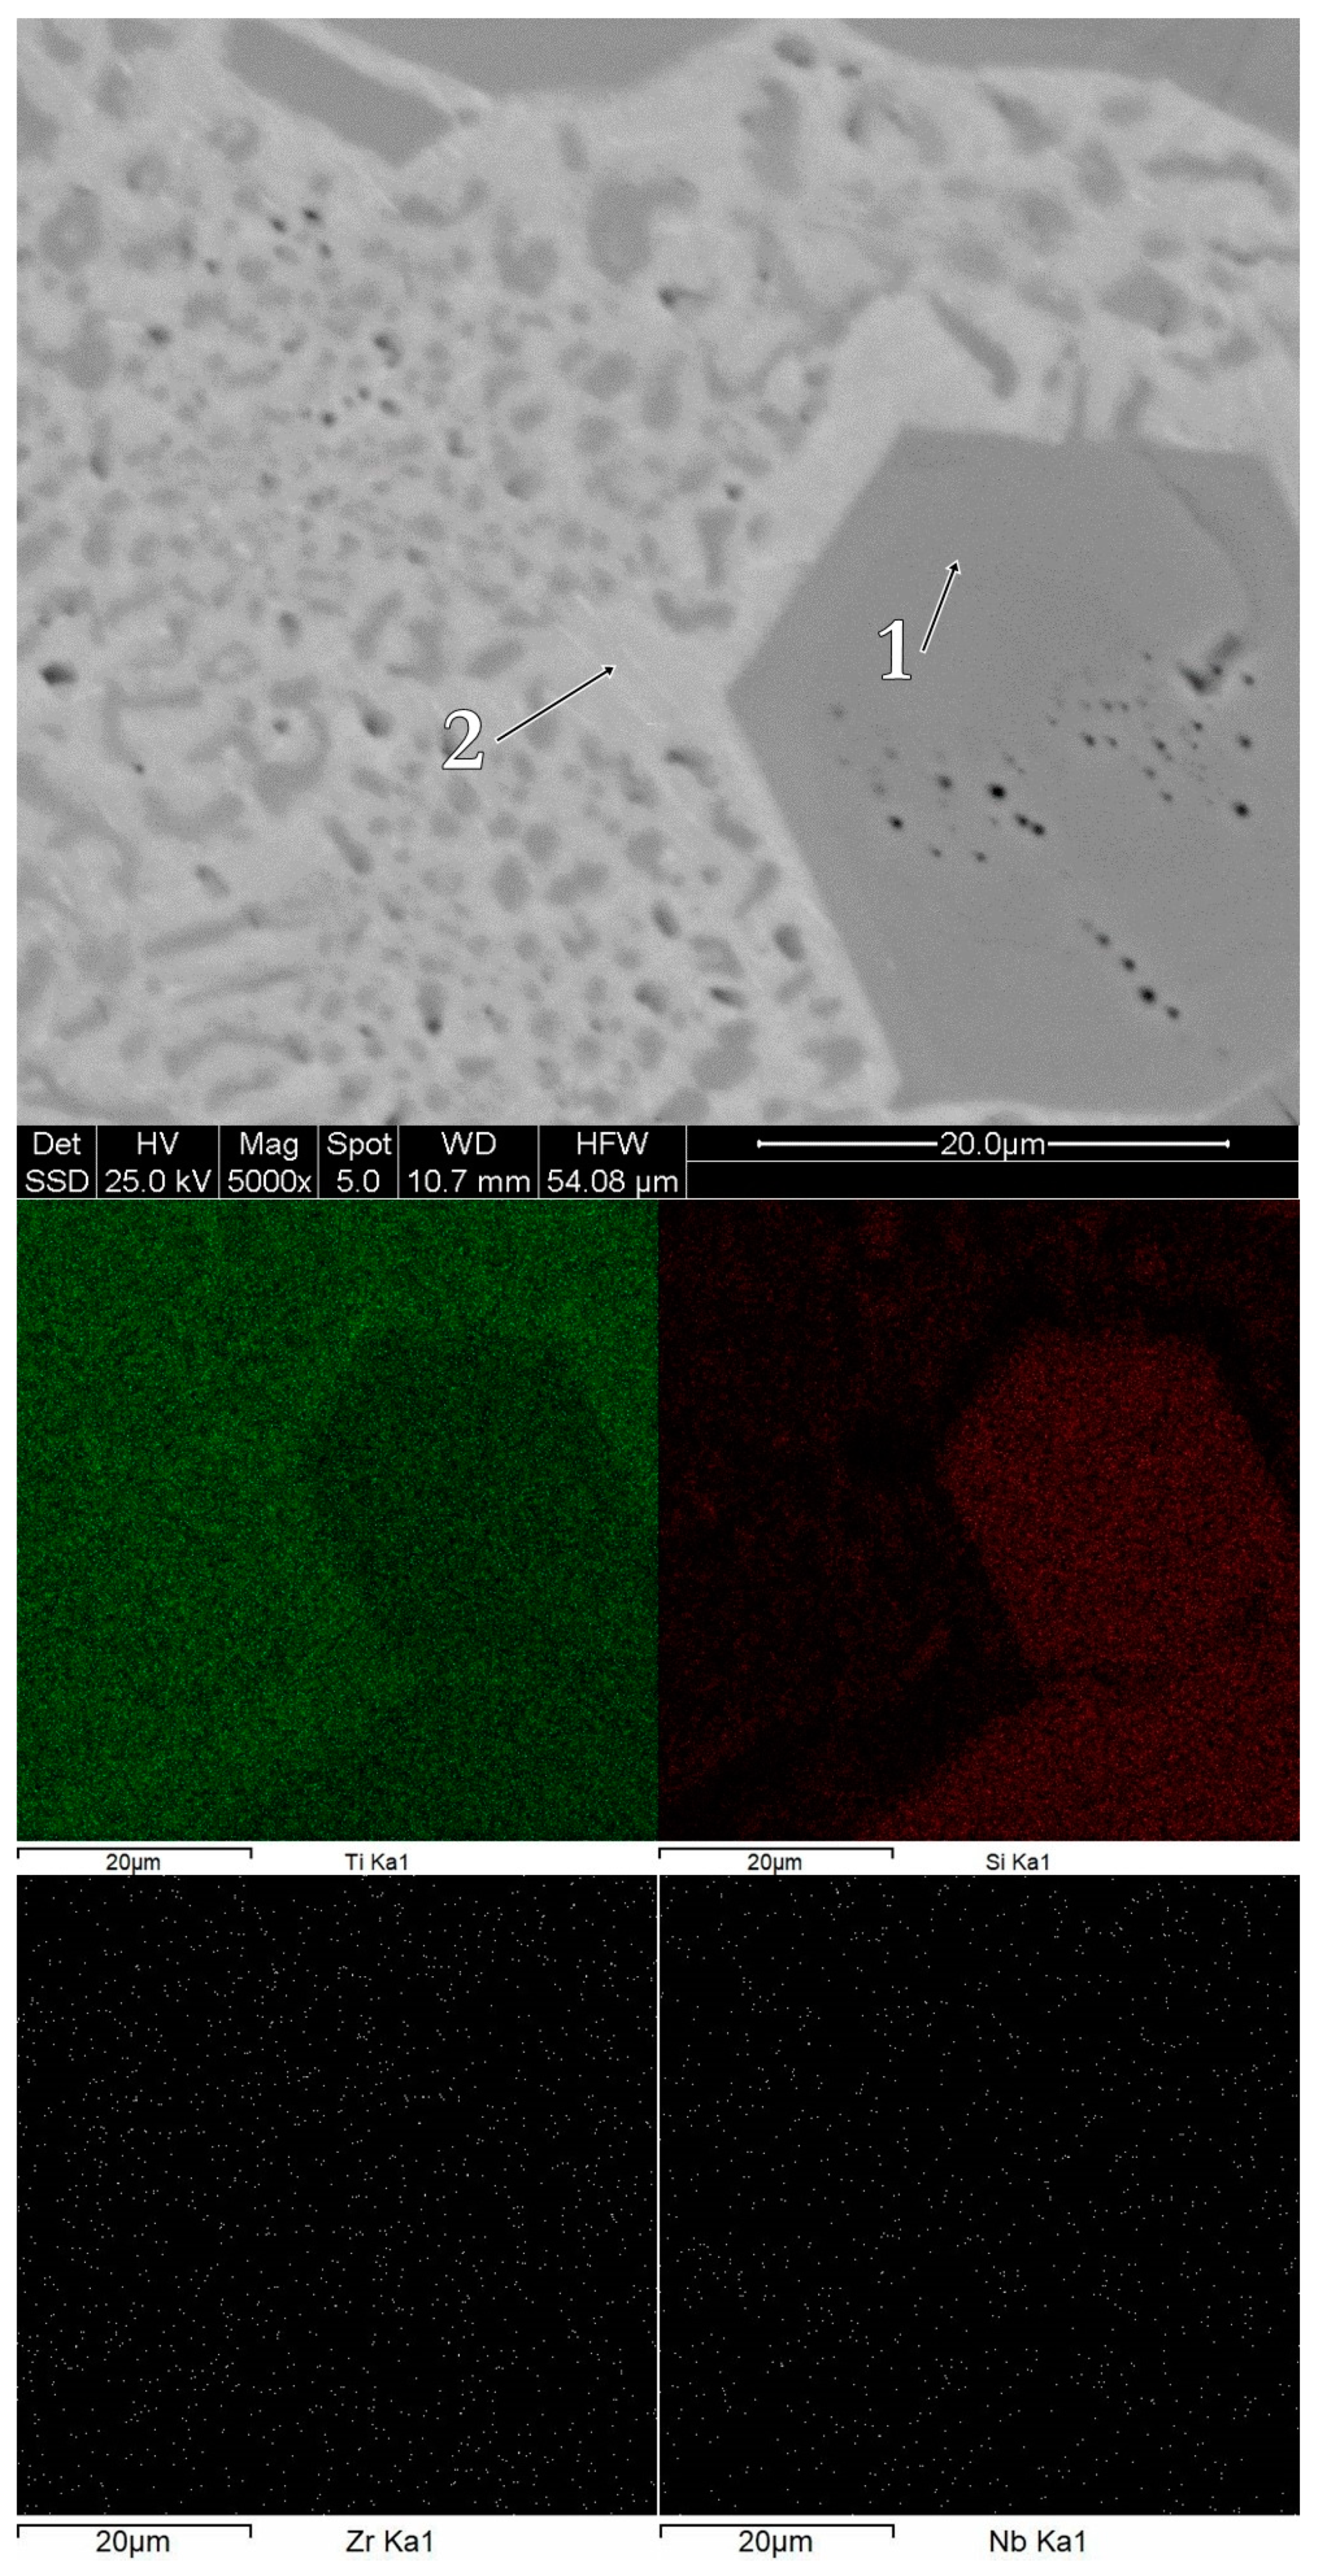
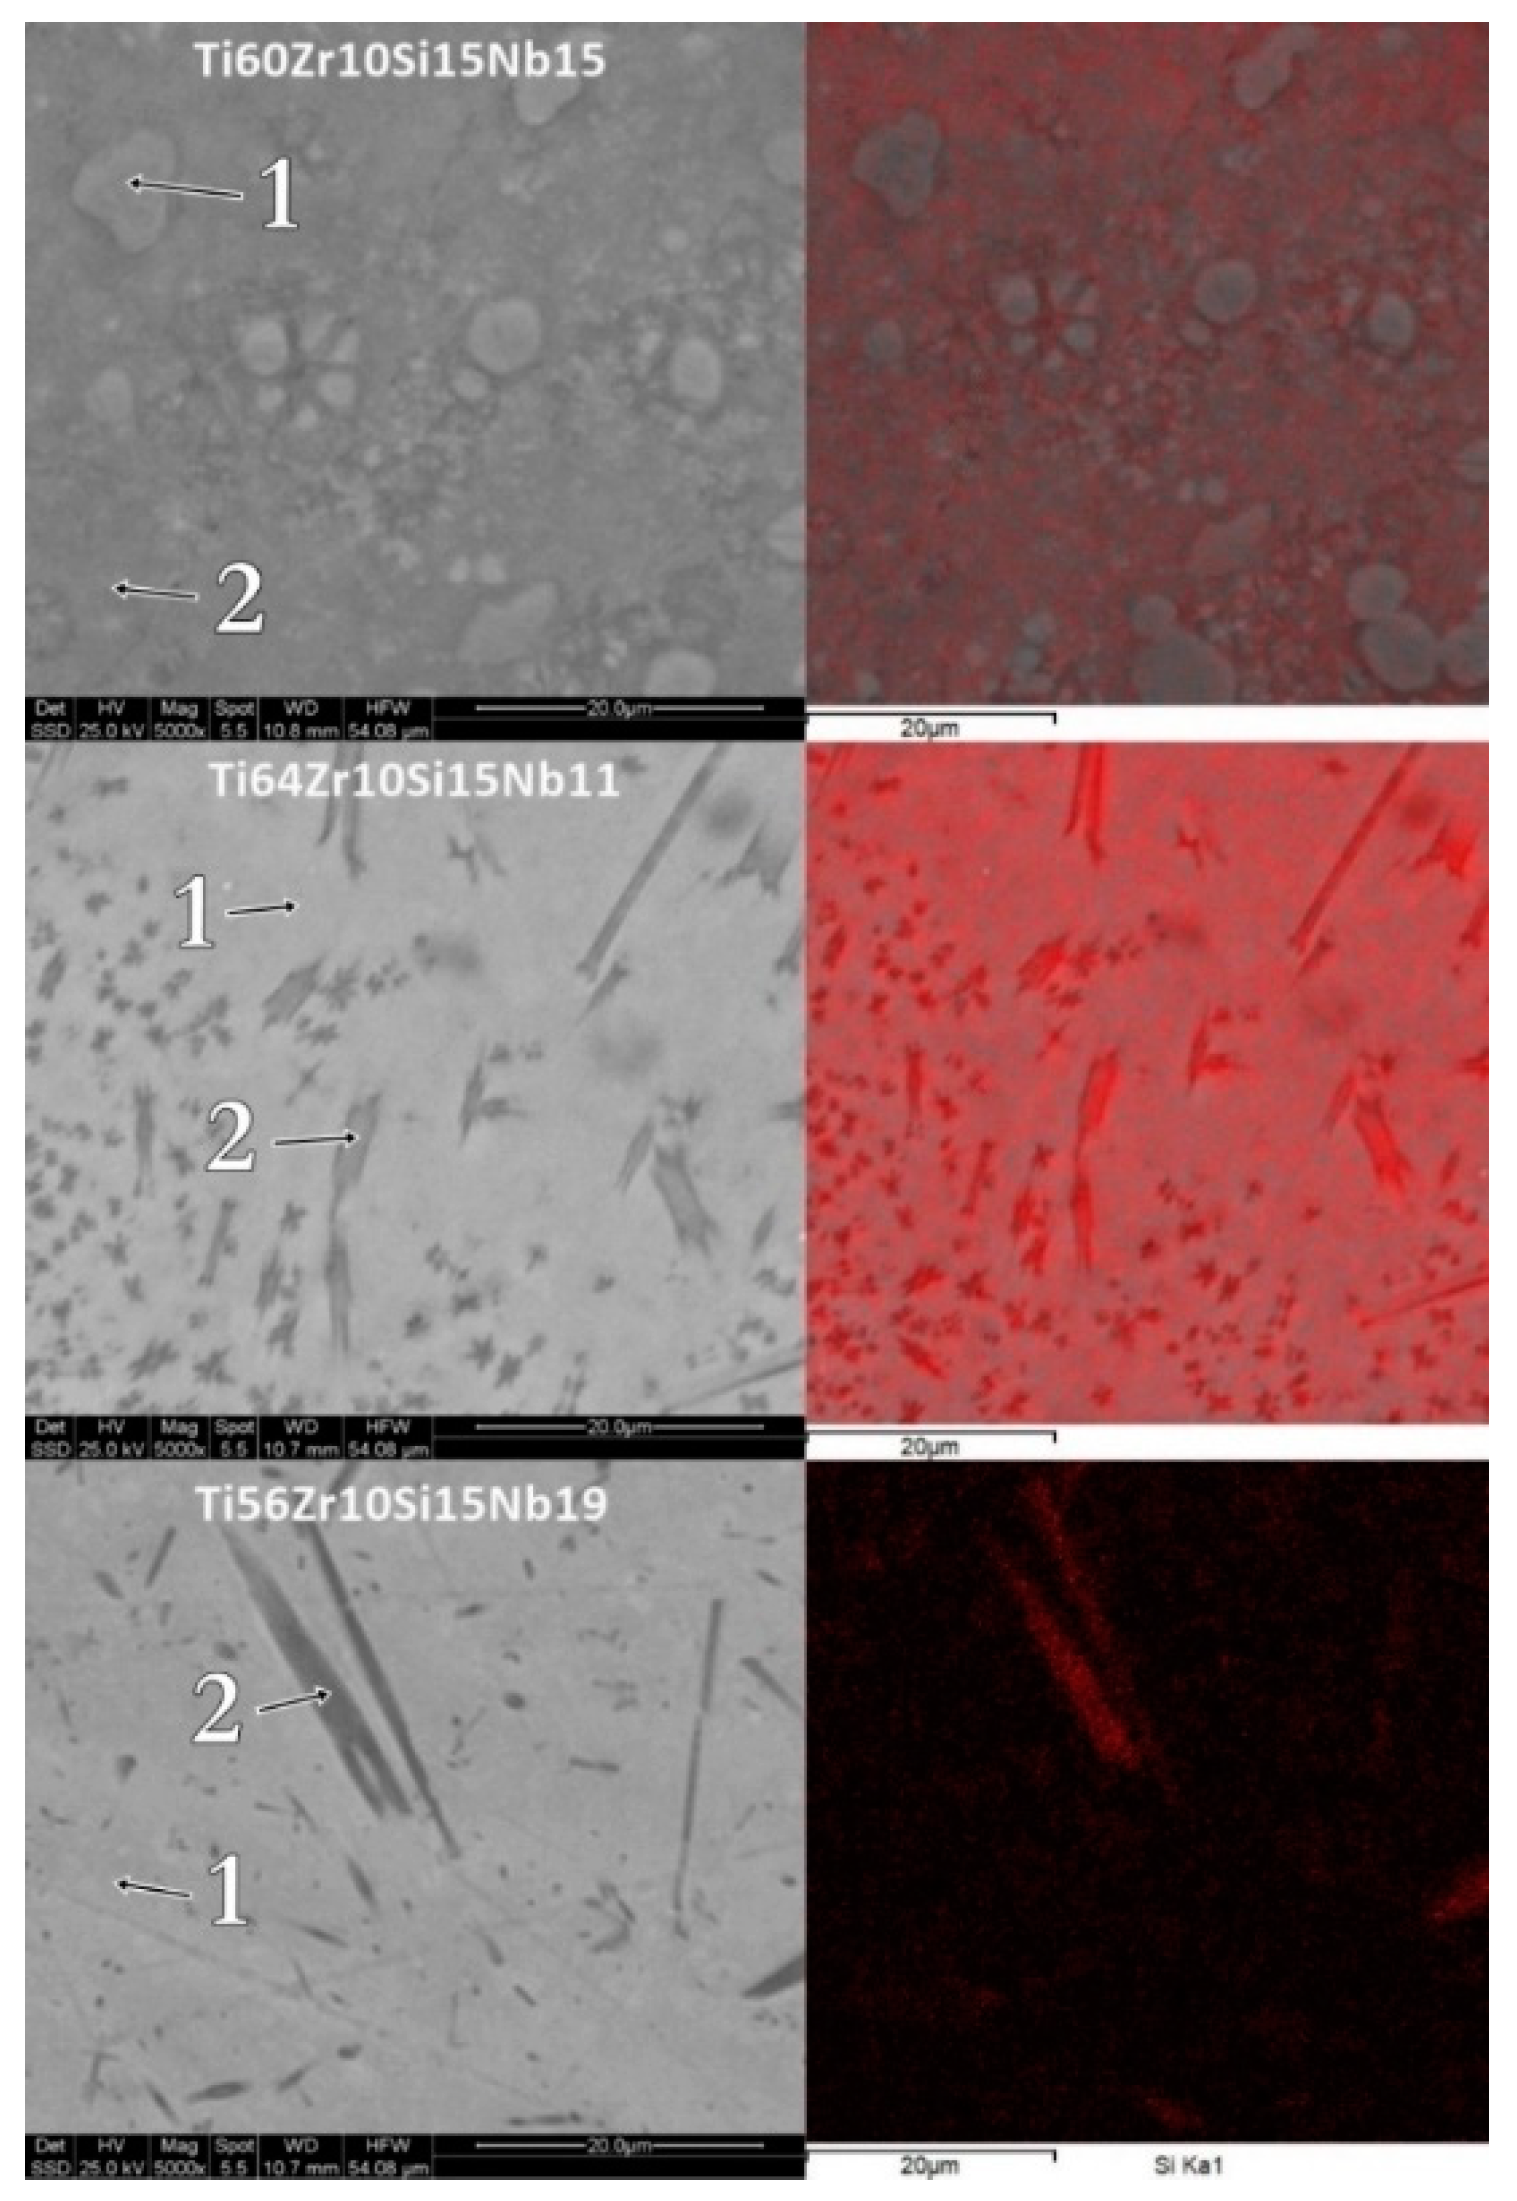
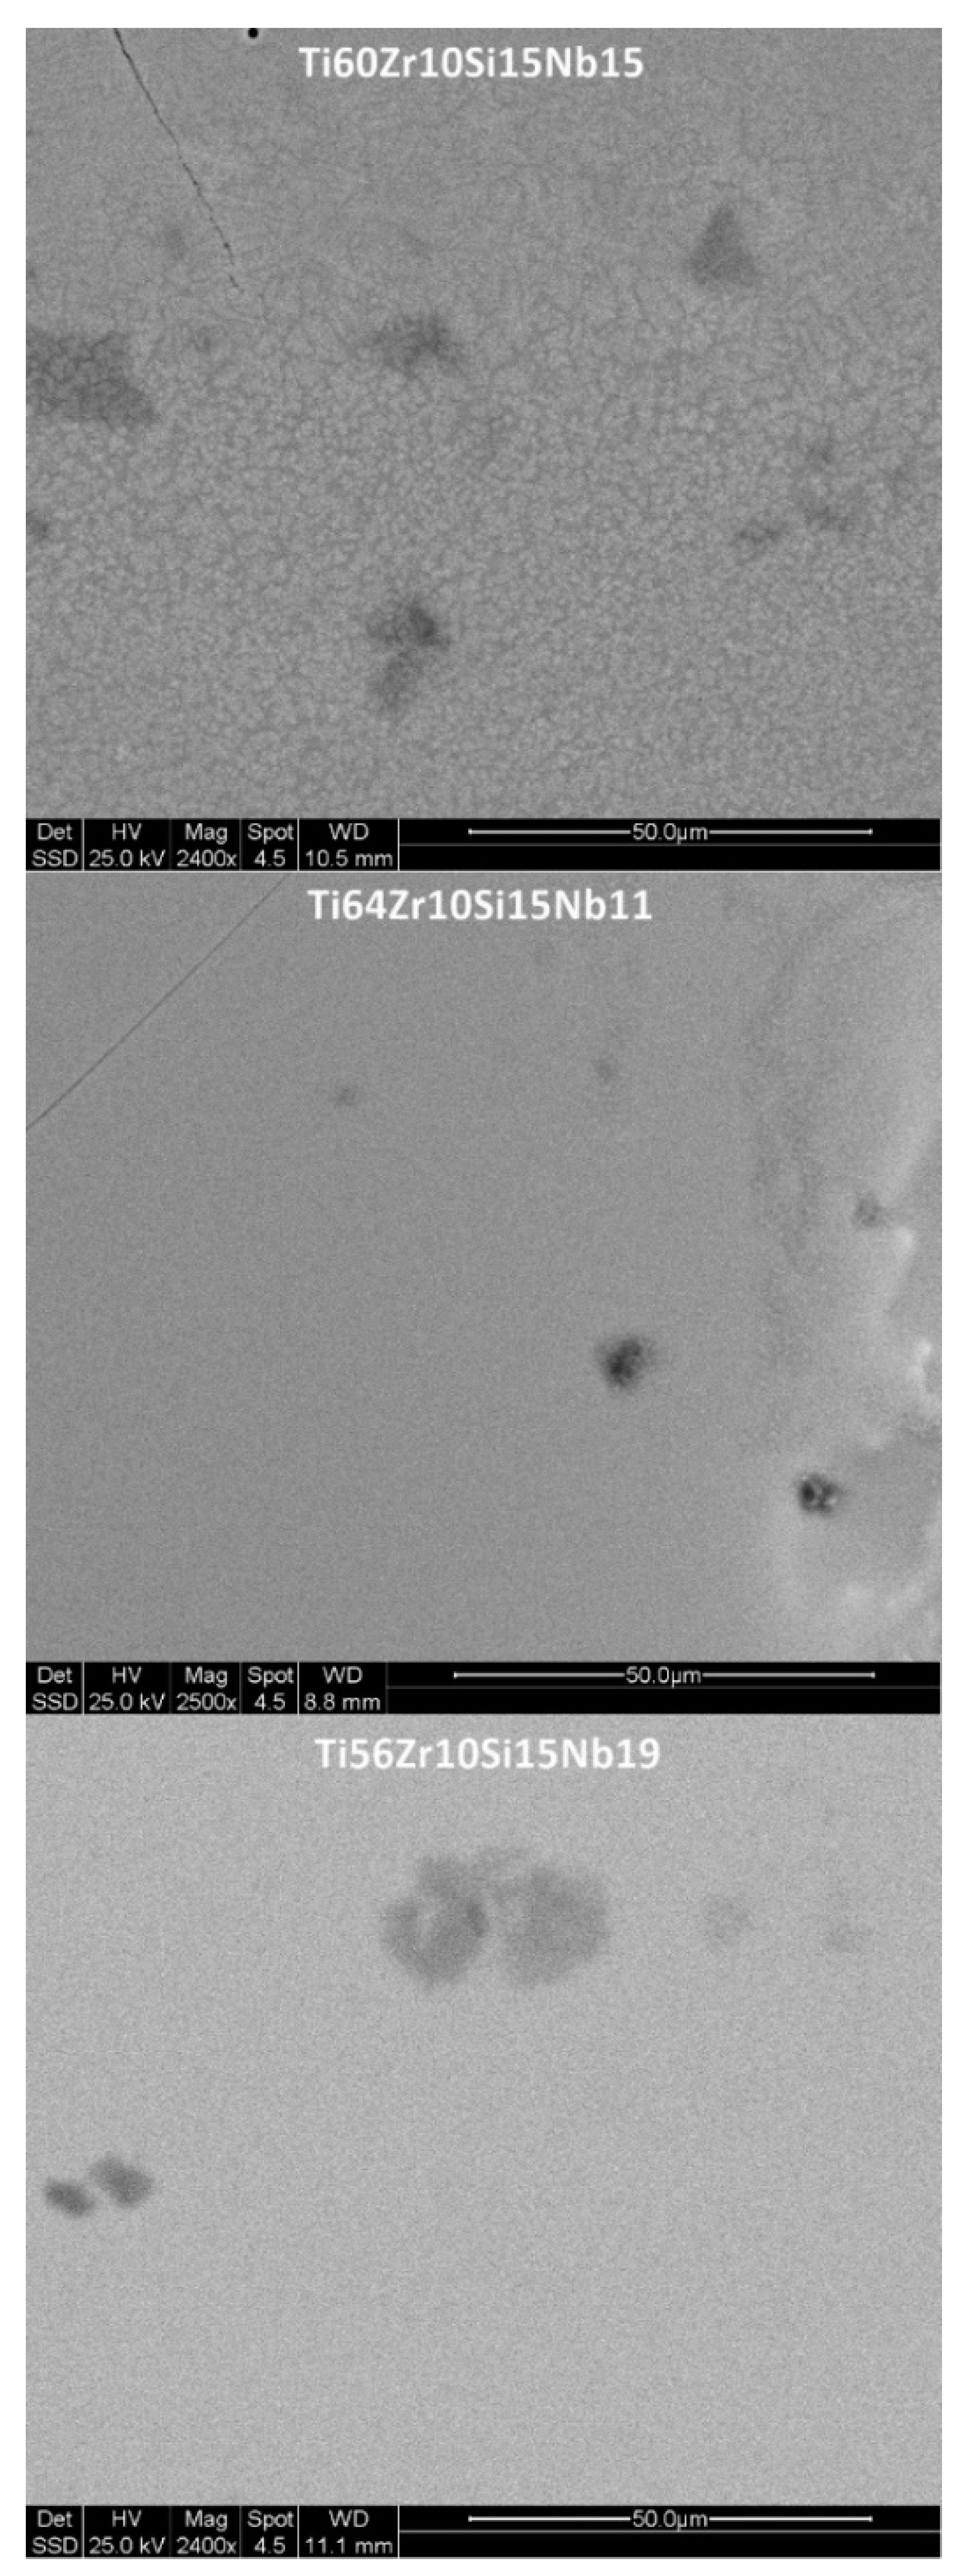
3.1. Structure, Morphology and Chemical Composition
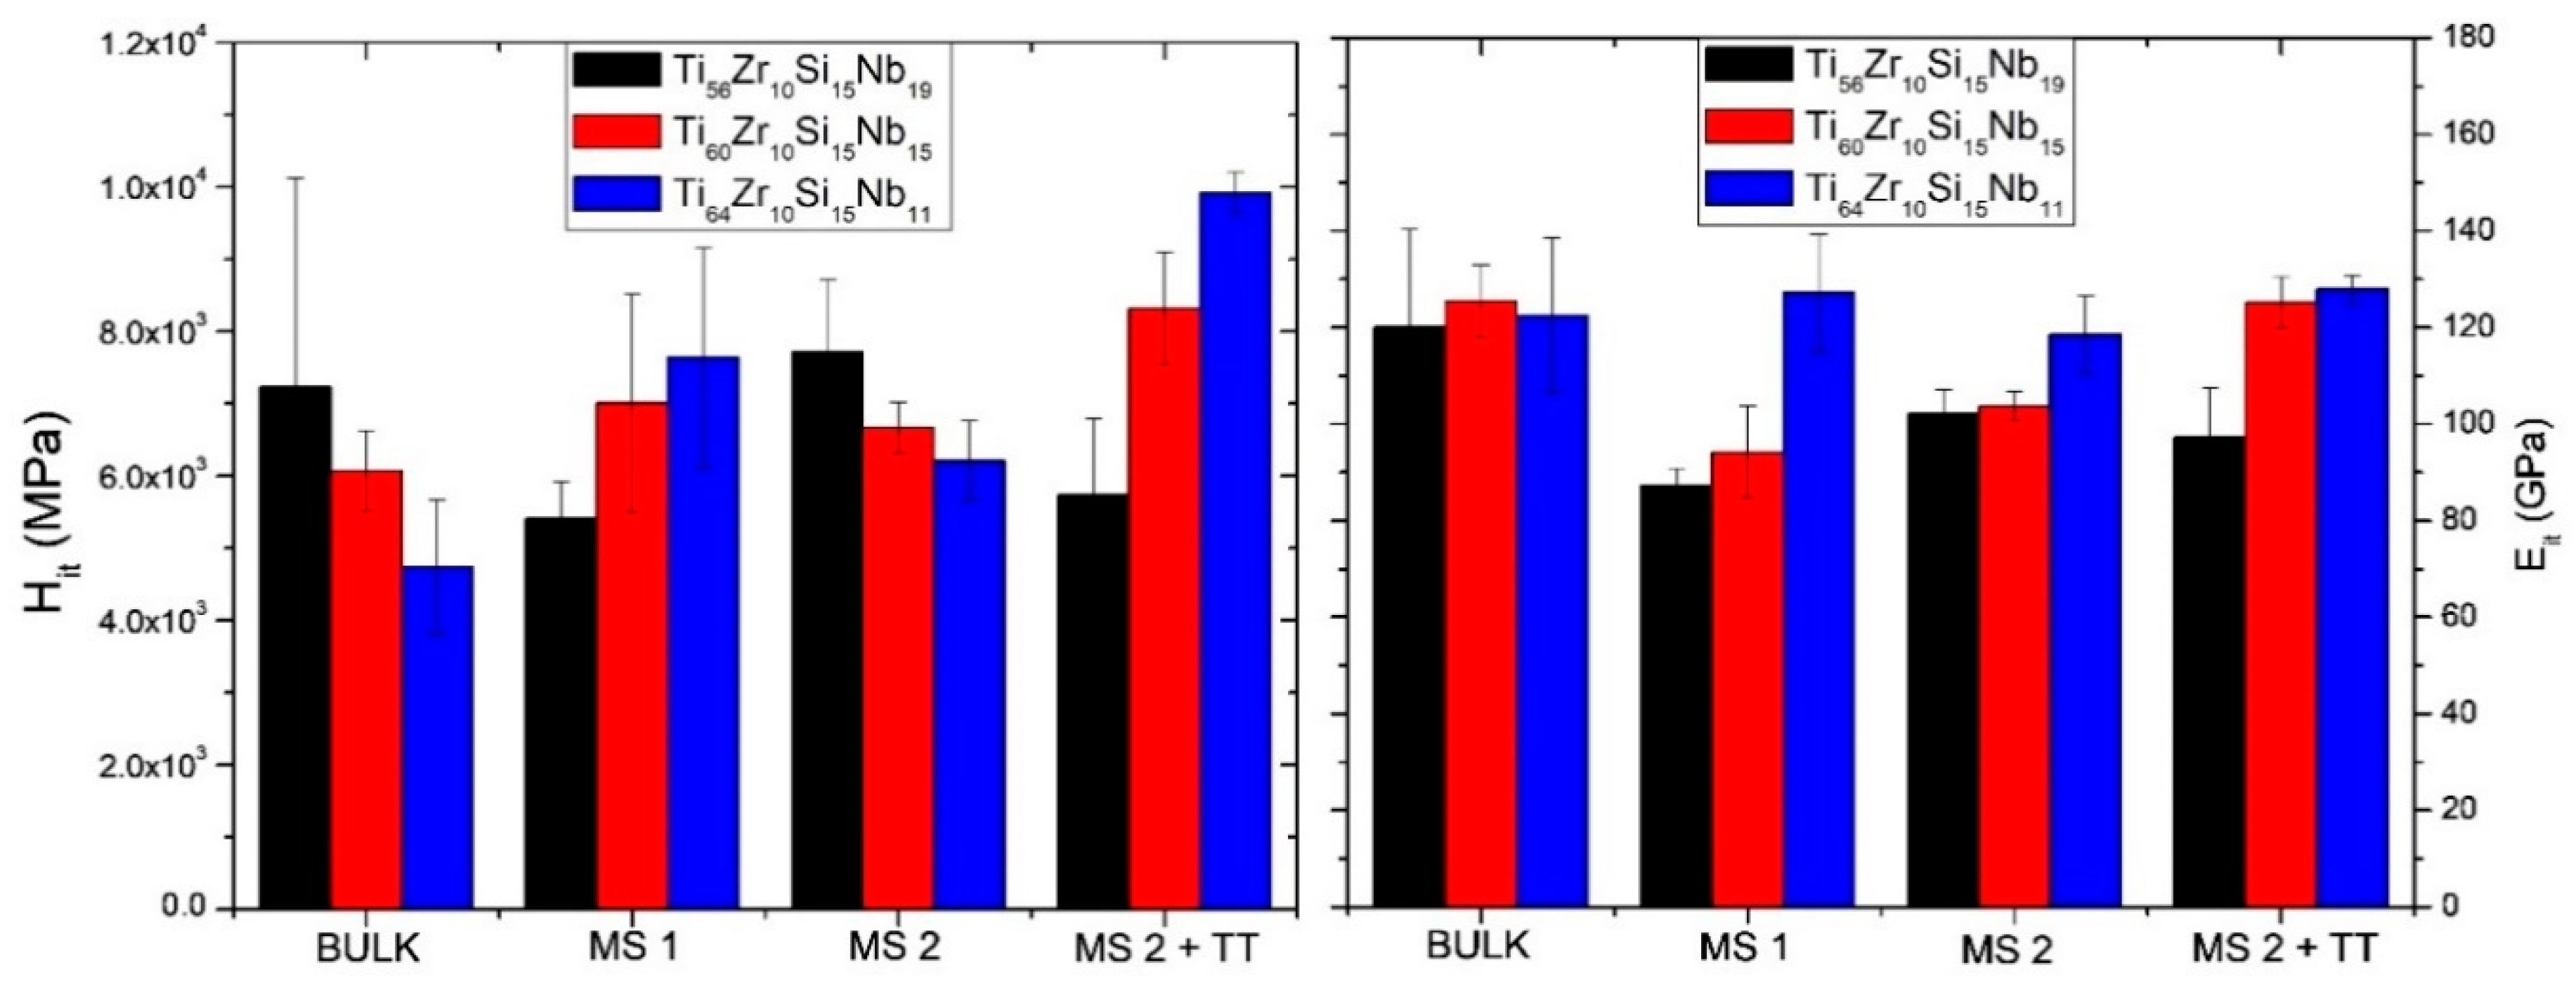
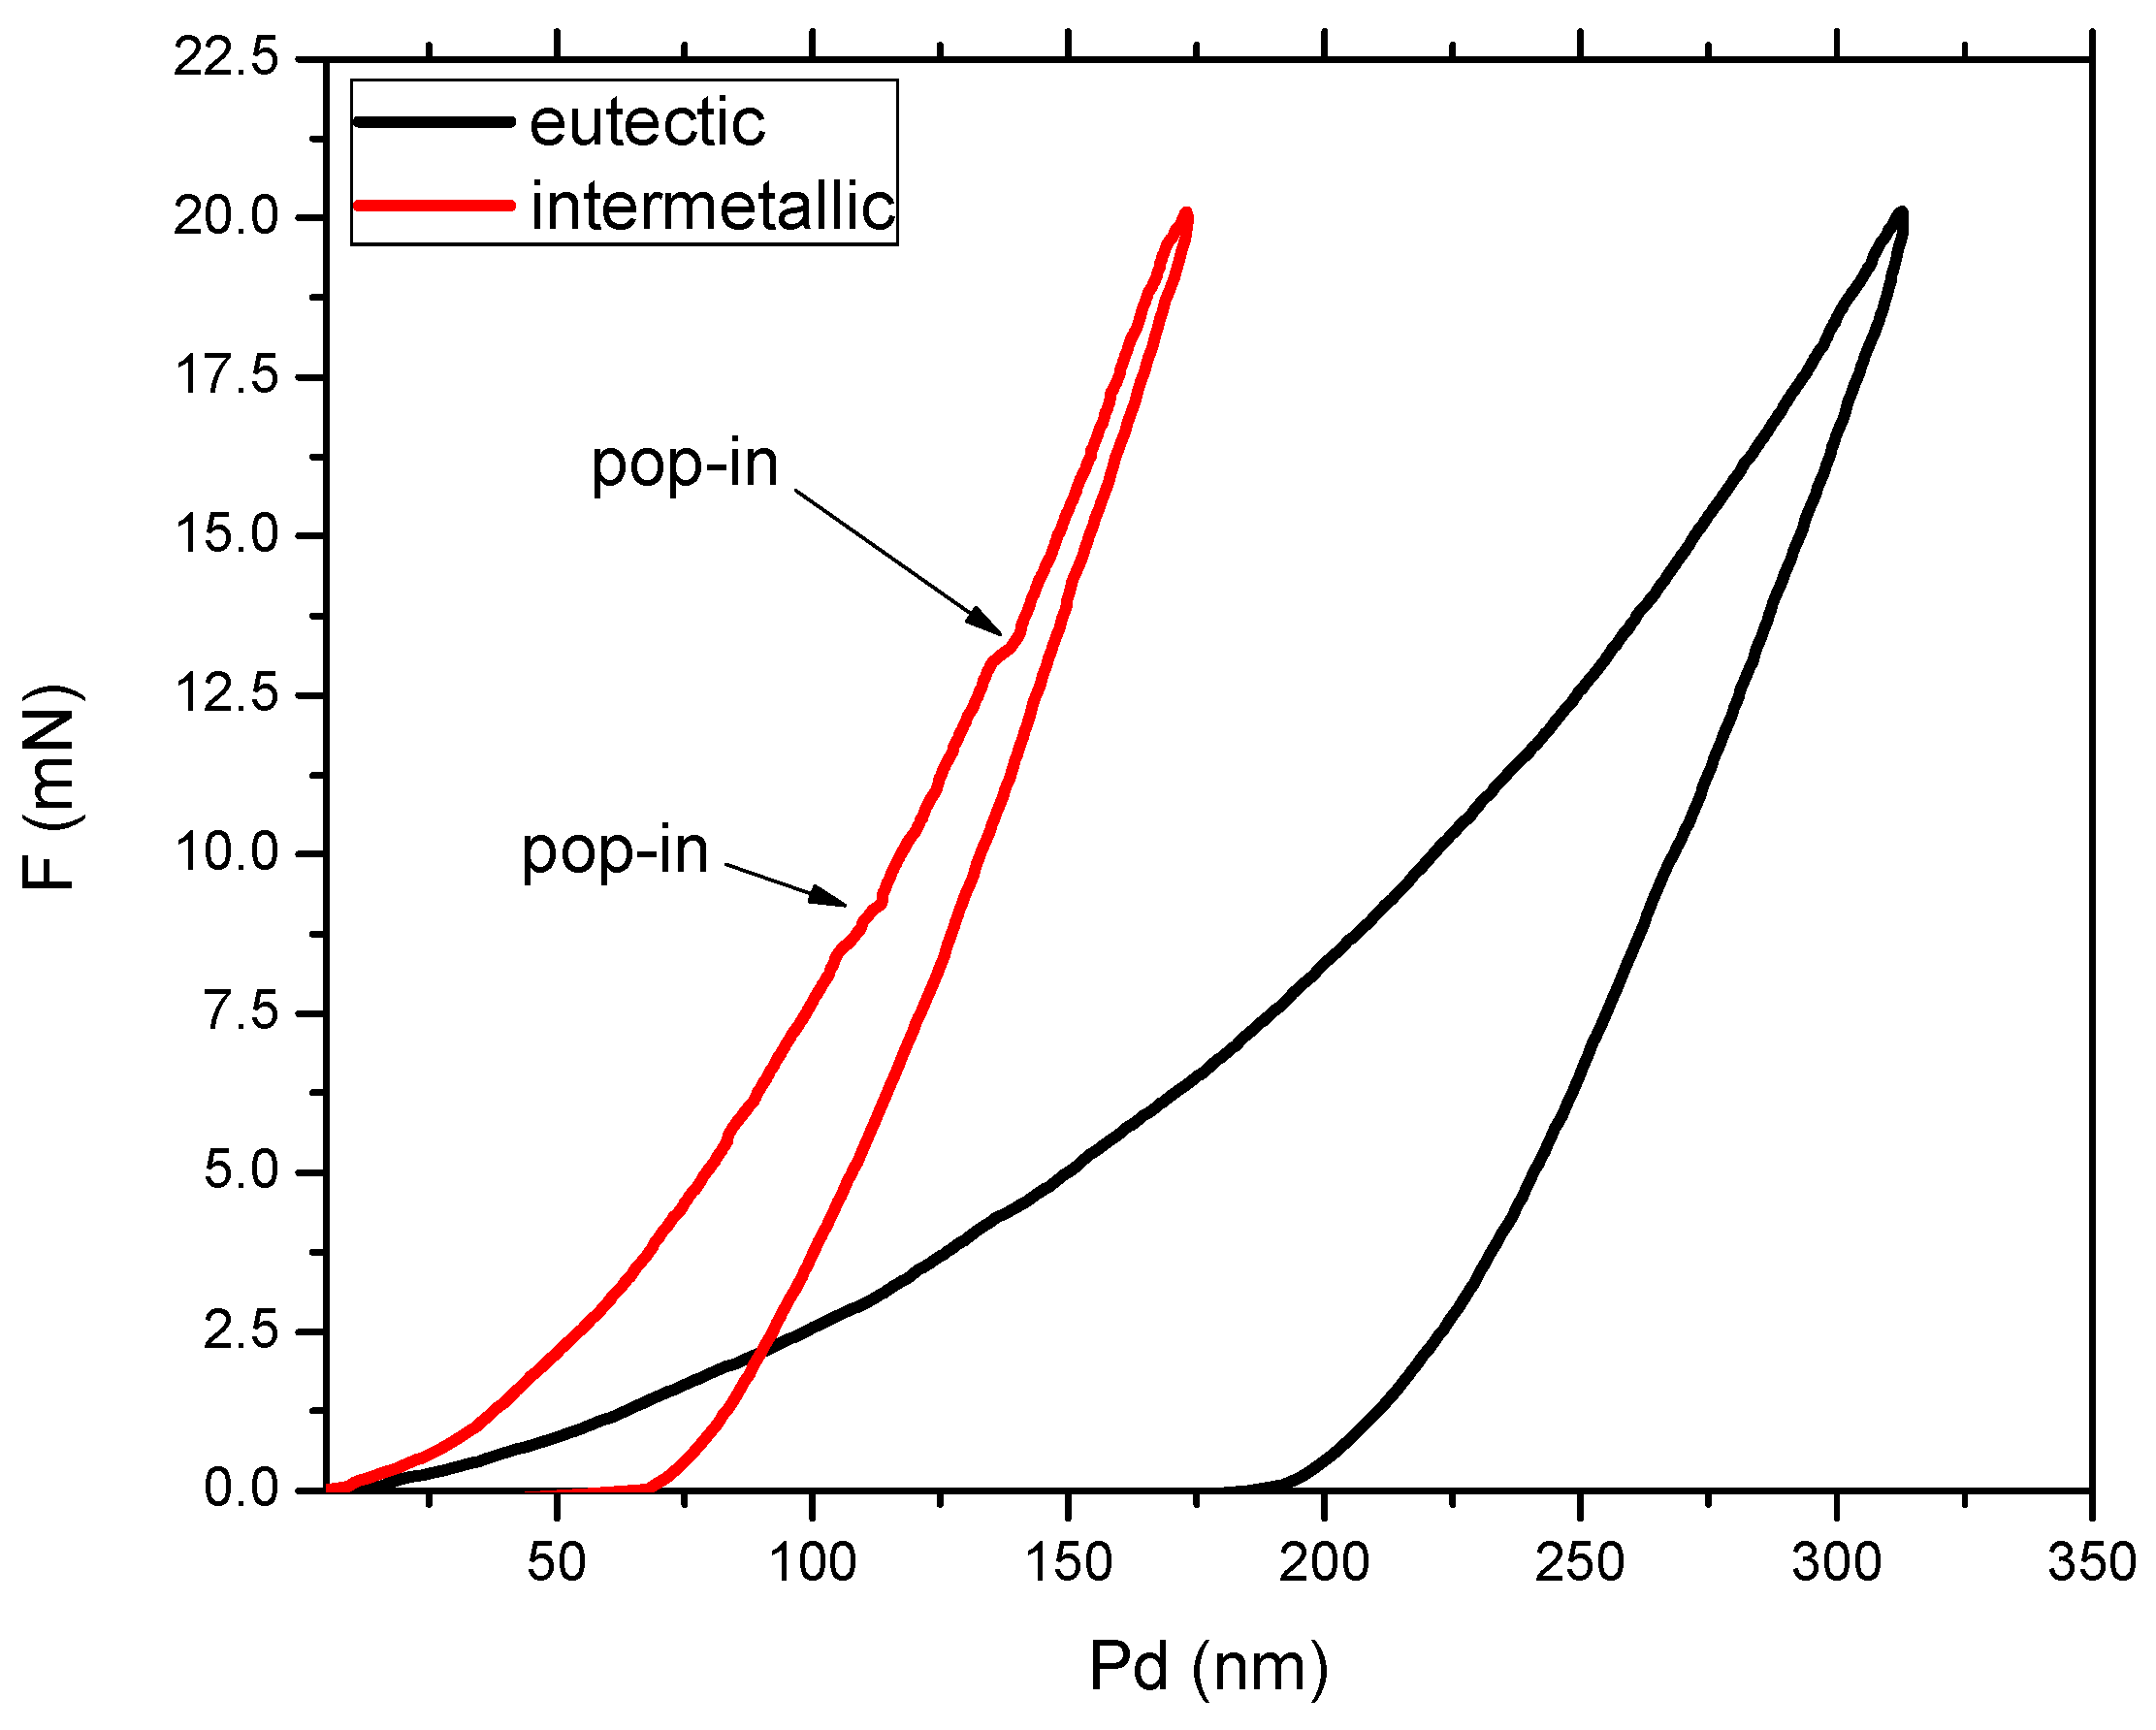
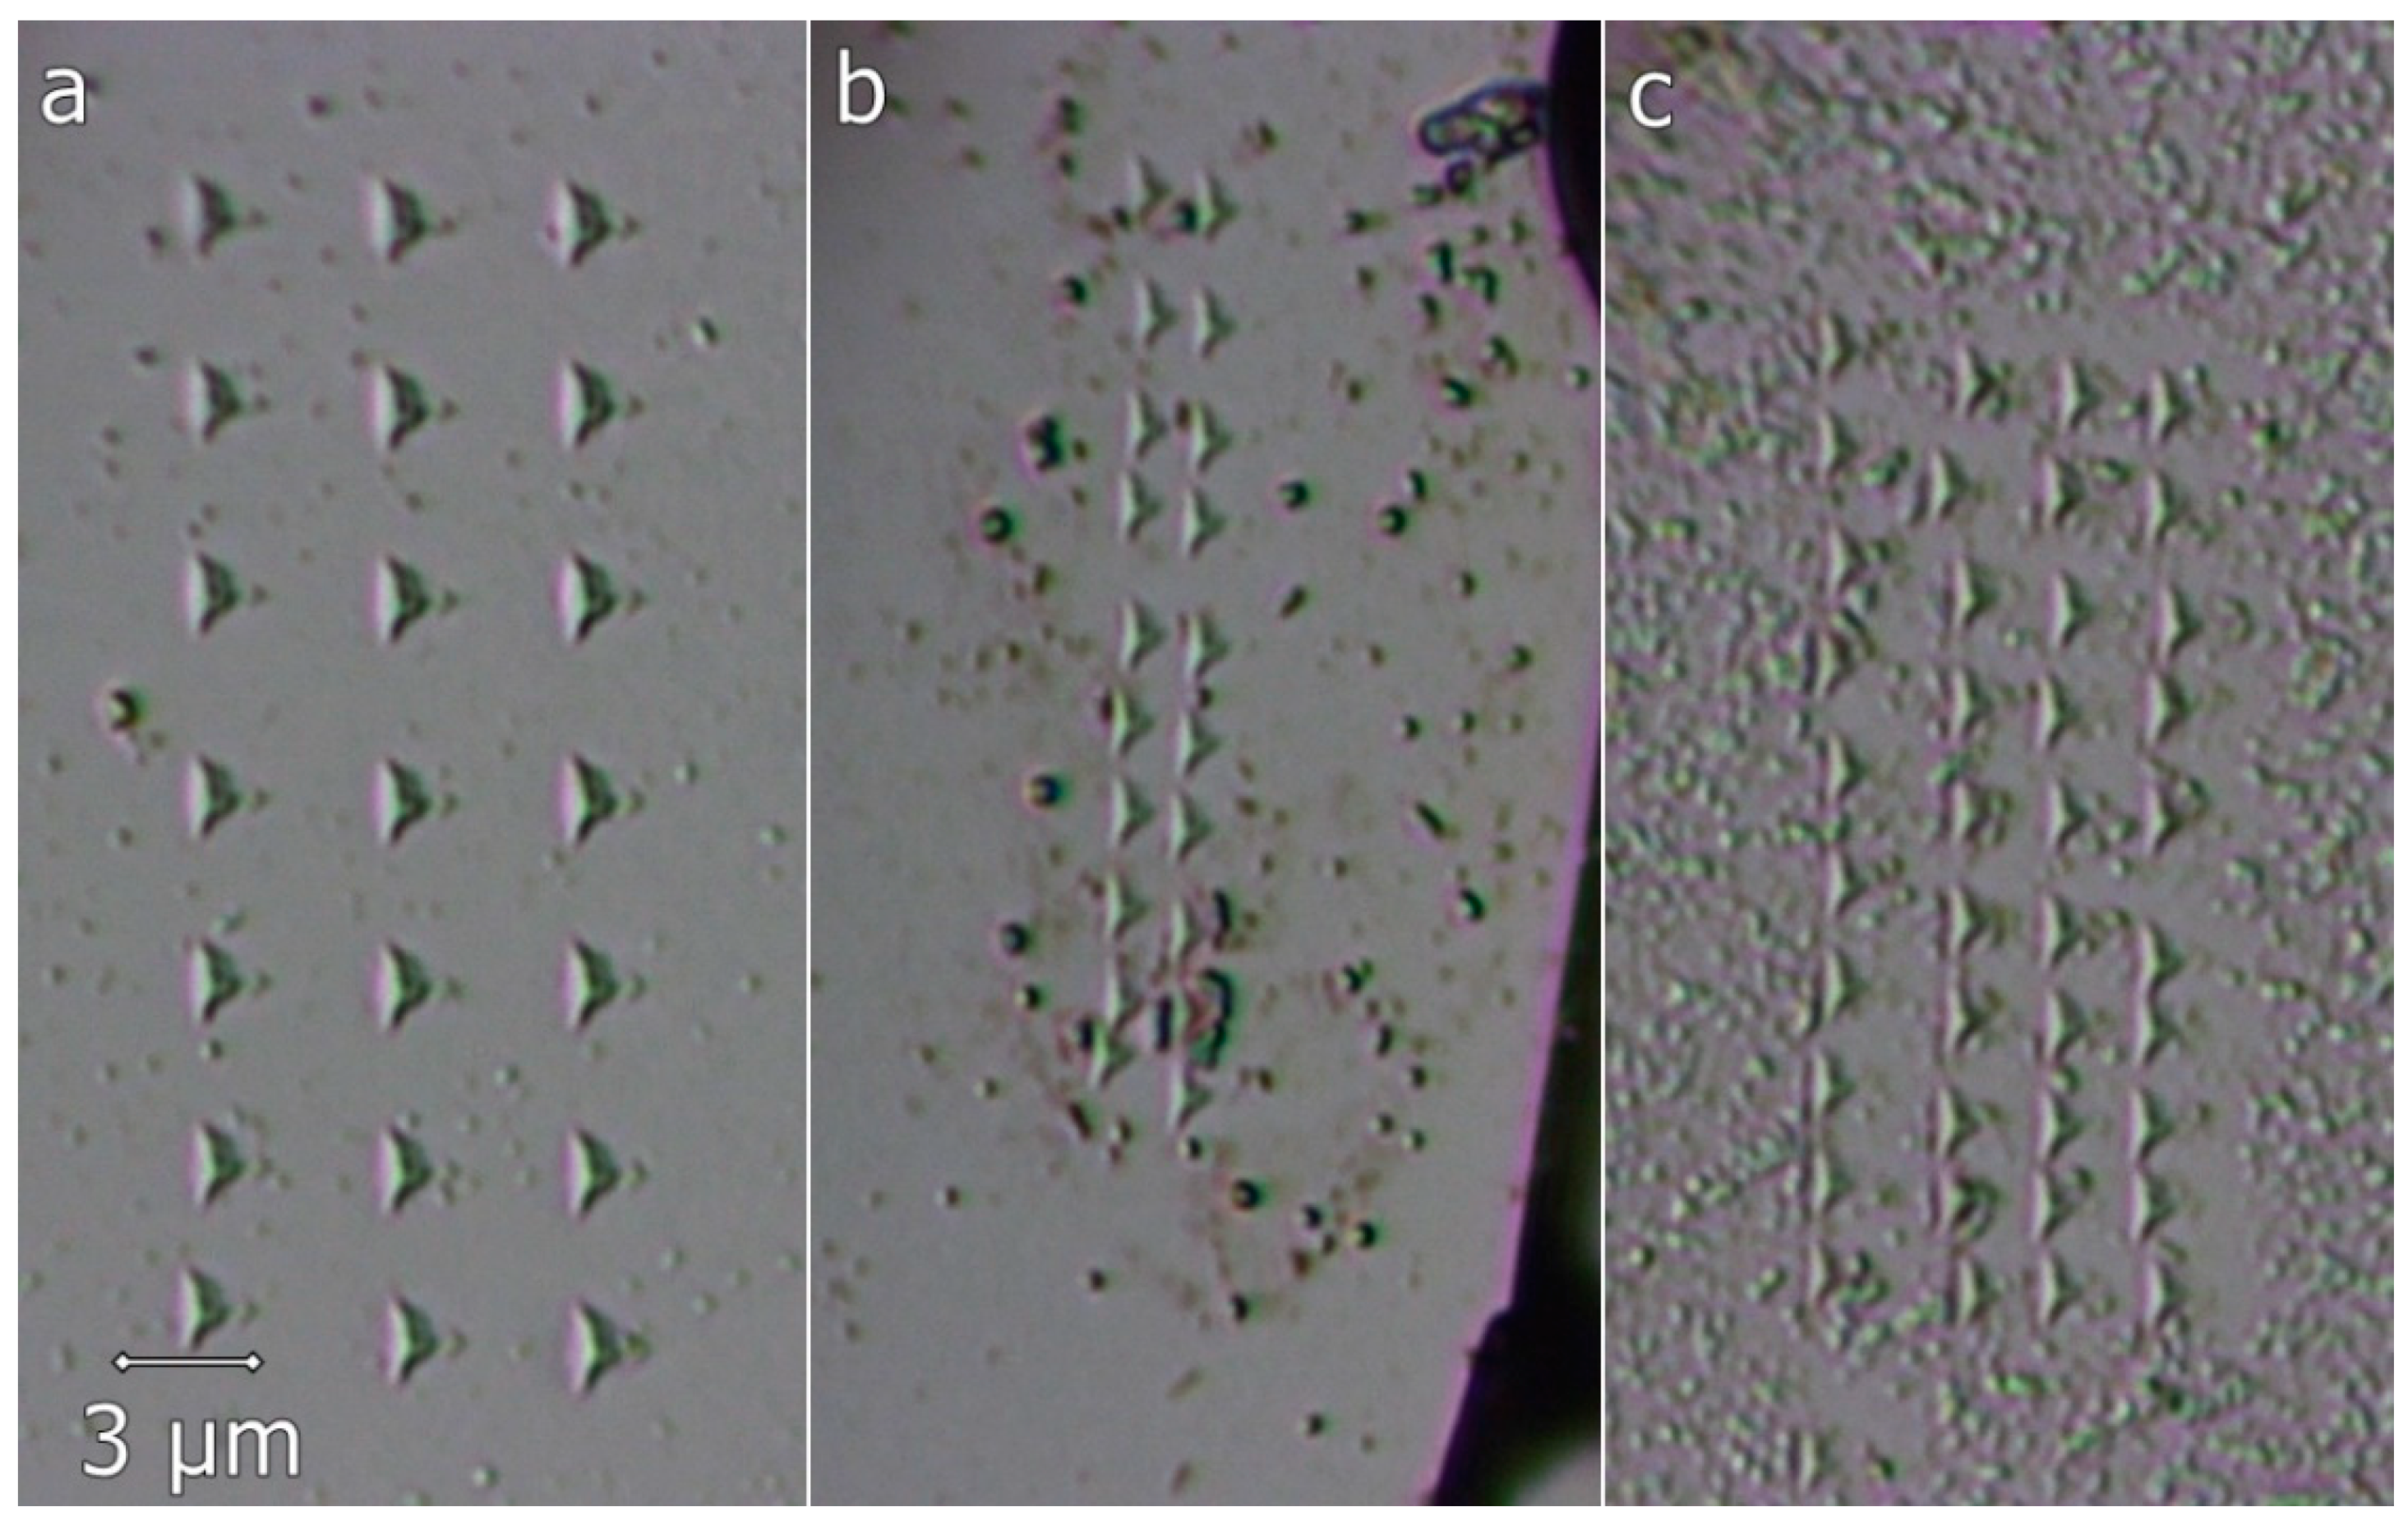
3.2. Mechanical Properties
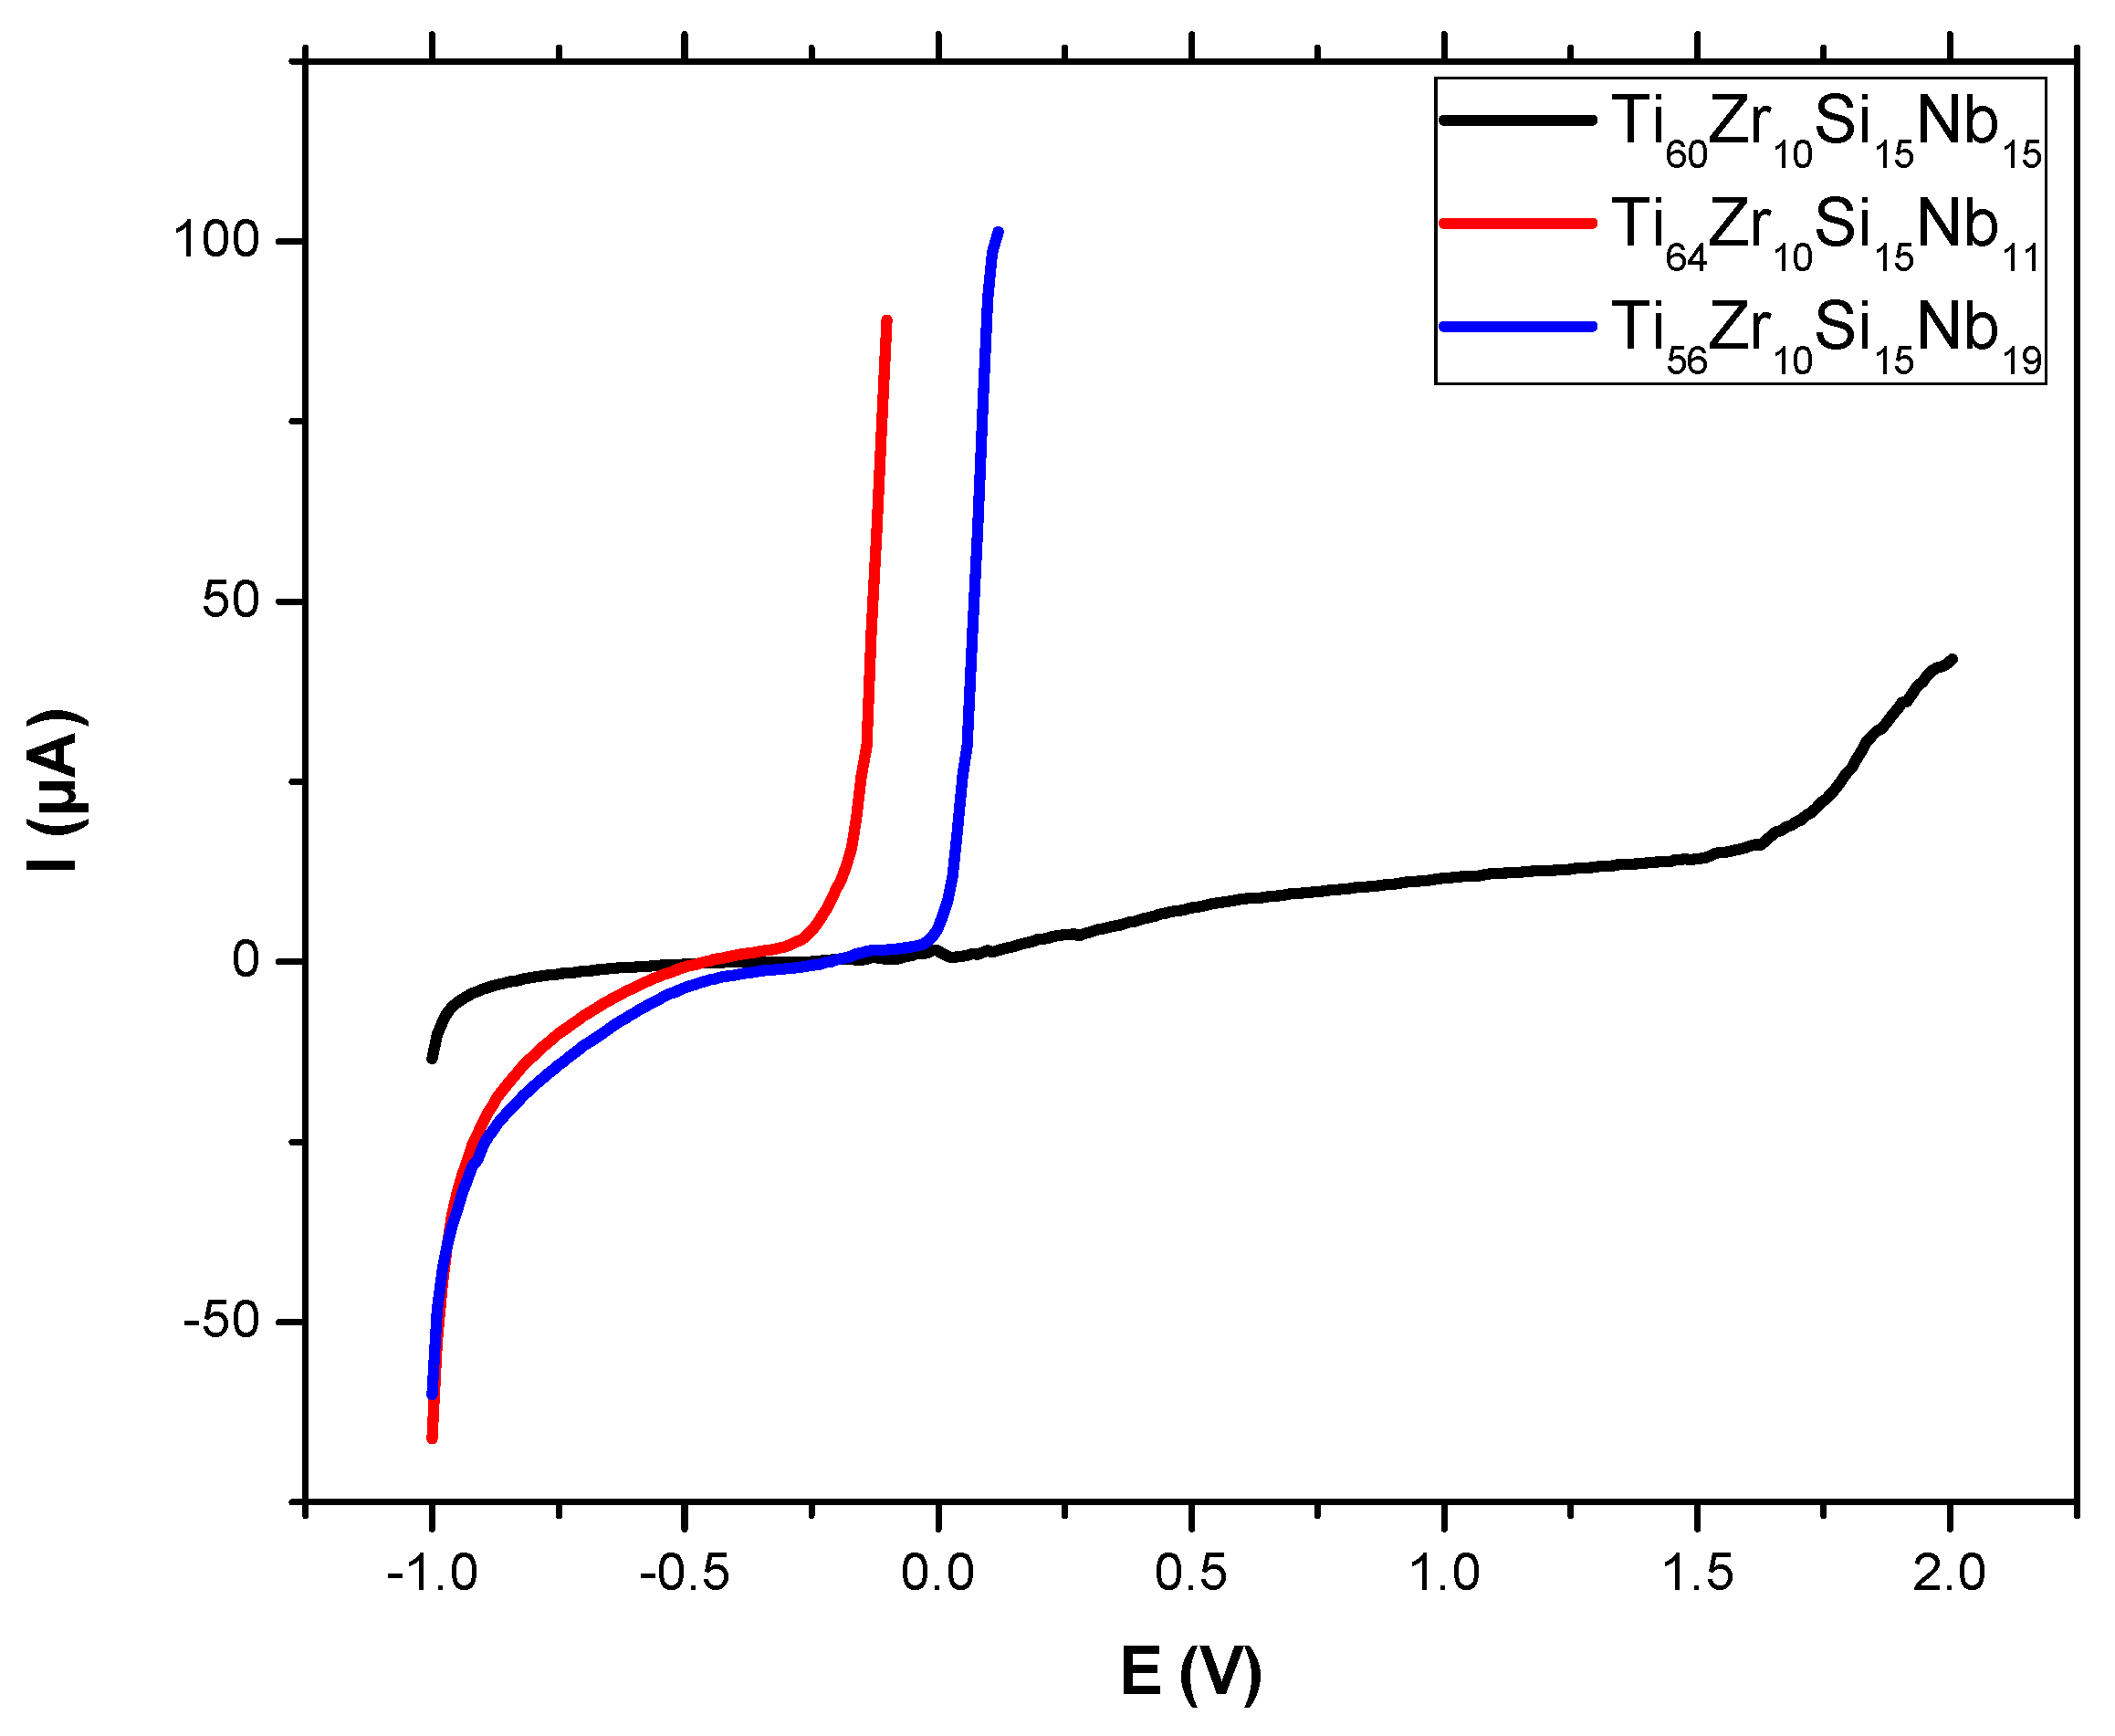
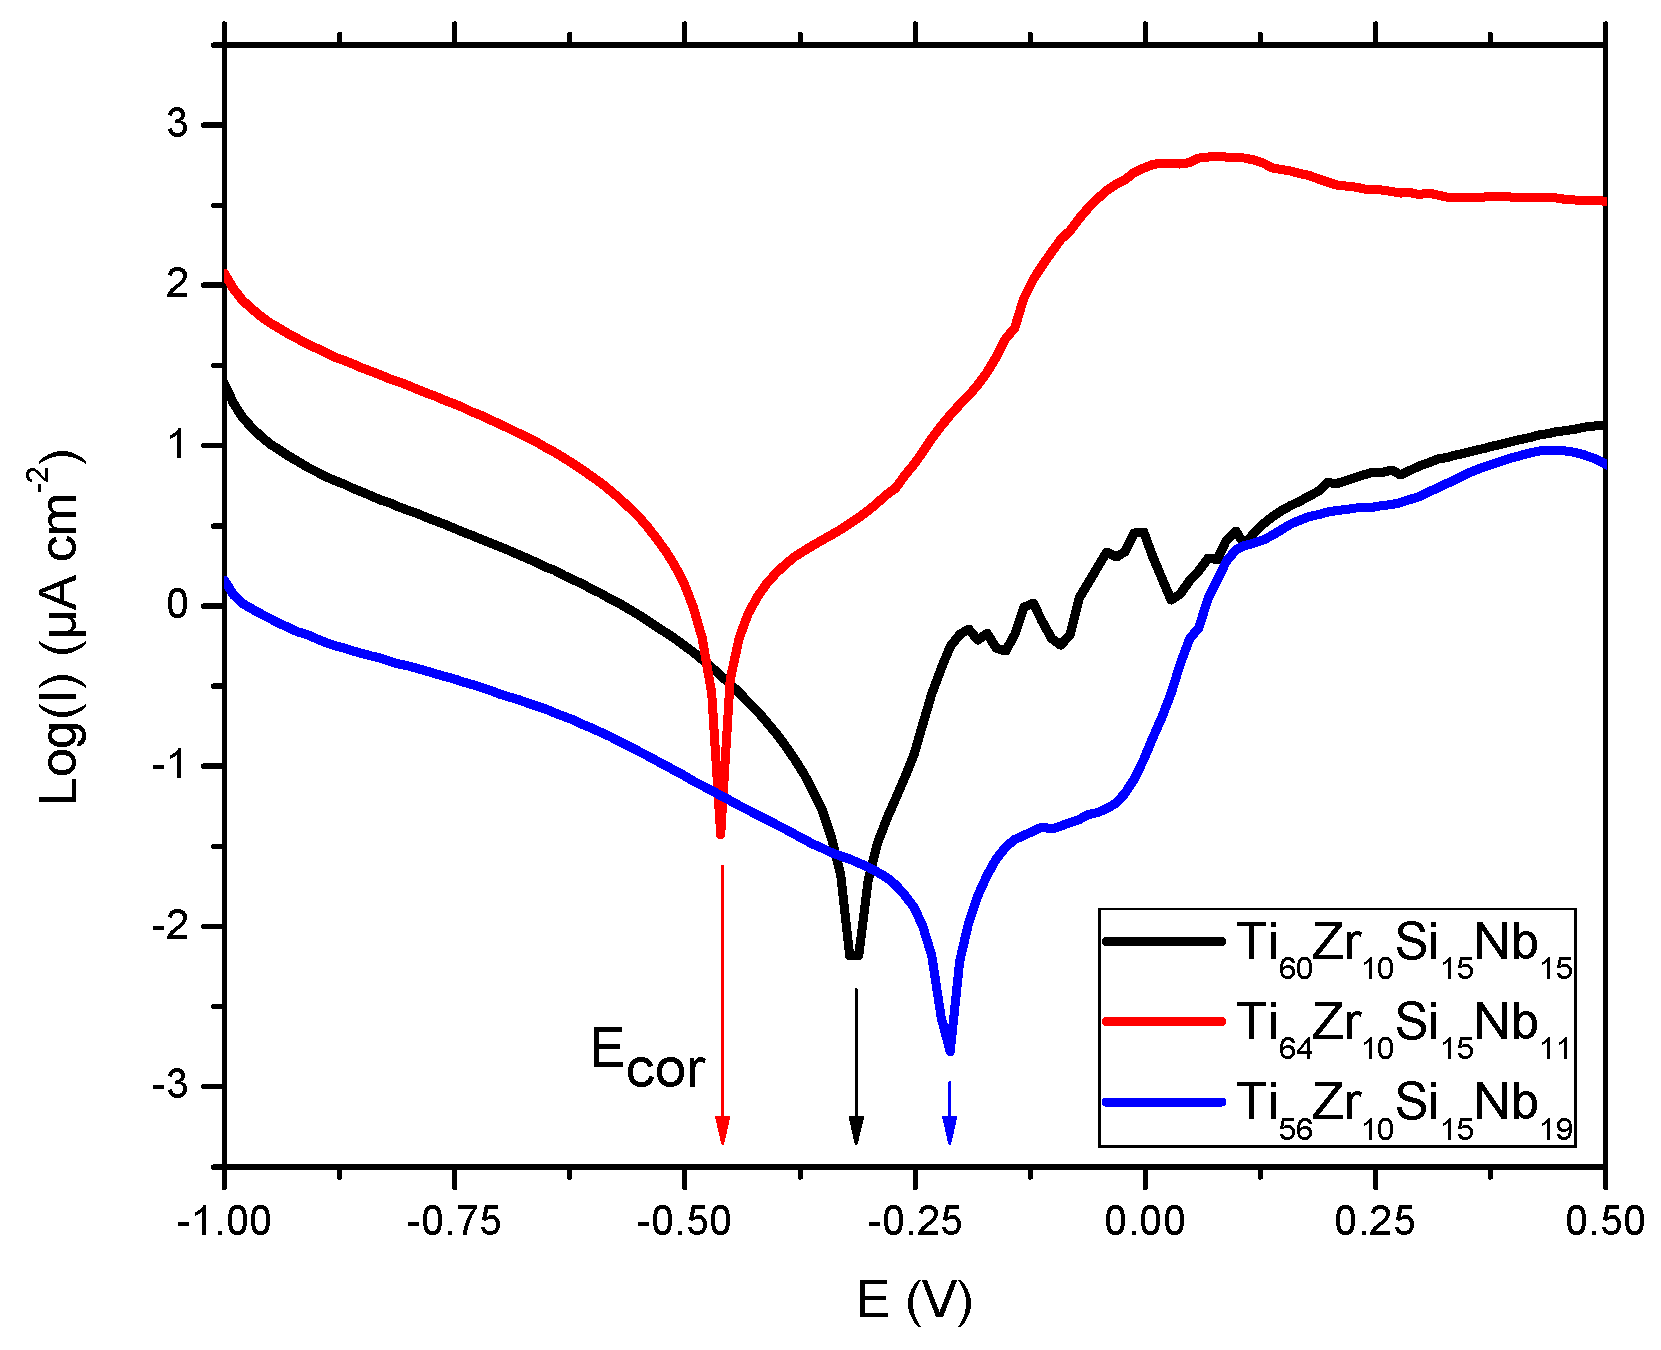
3.3. Corrosion
3.3.1. Potentiodynamic Studies
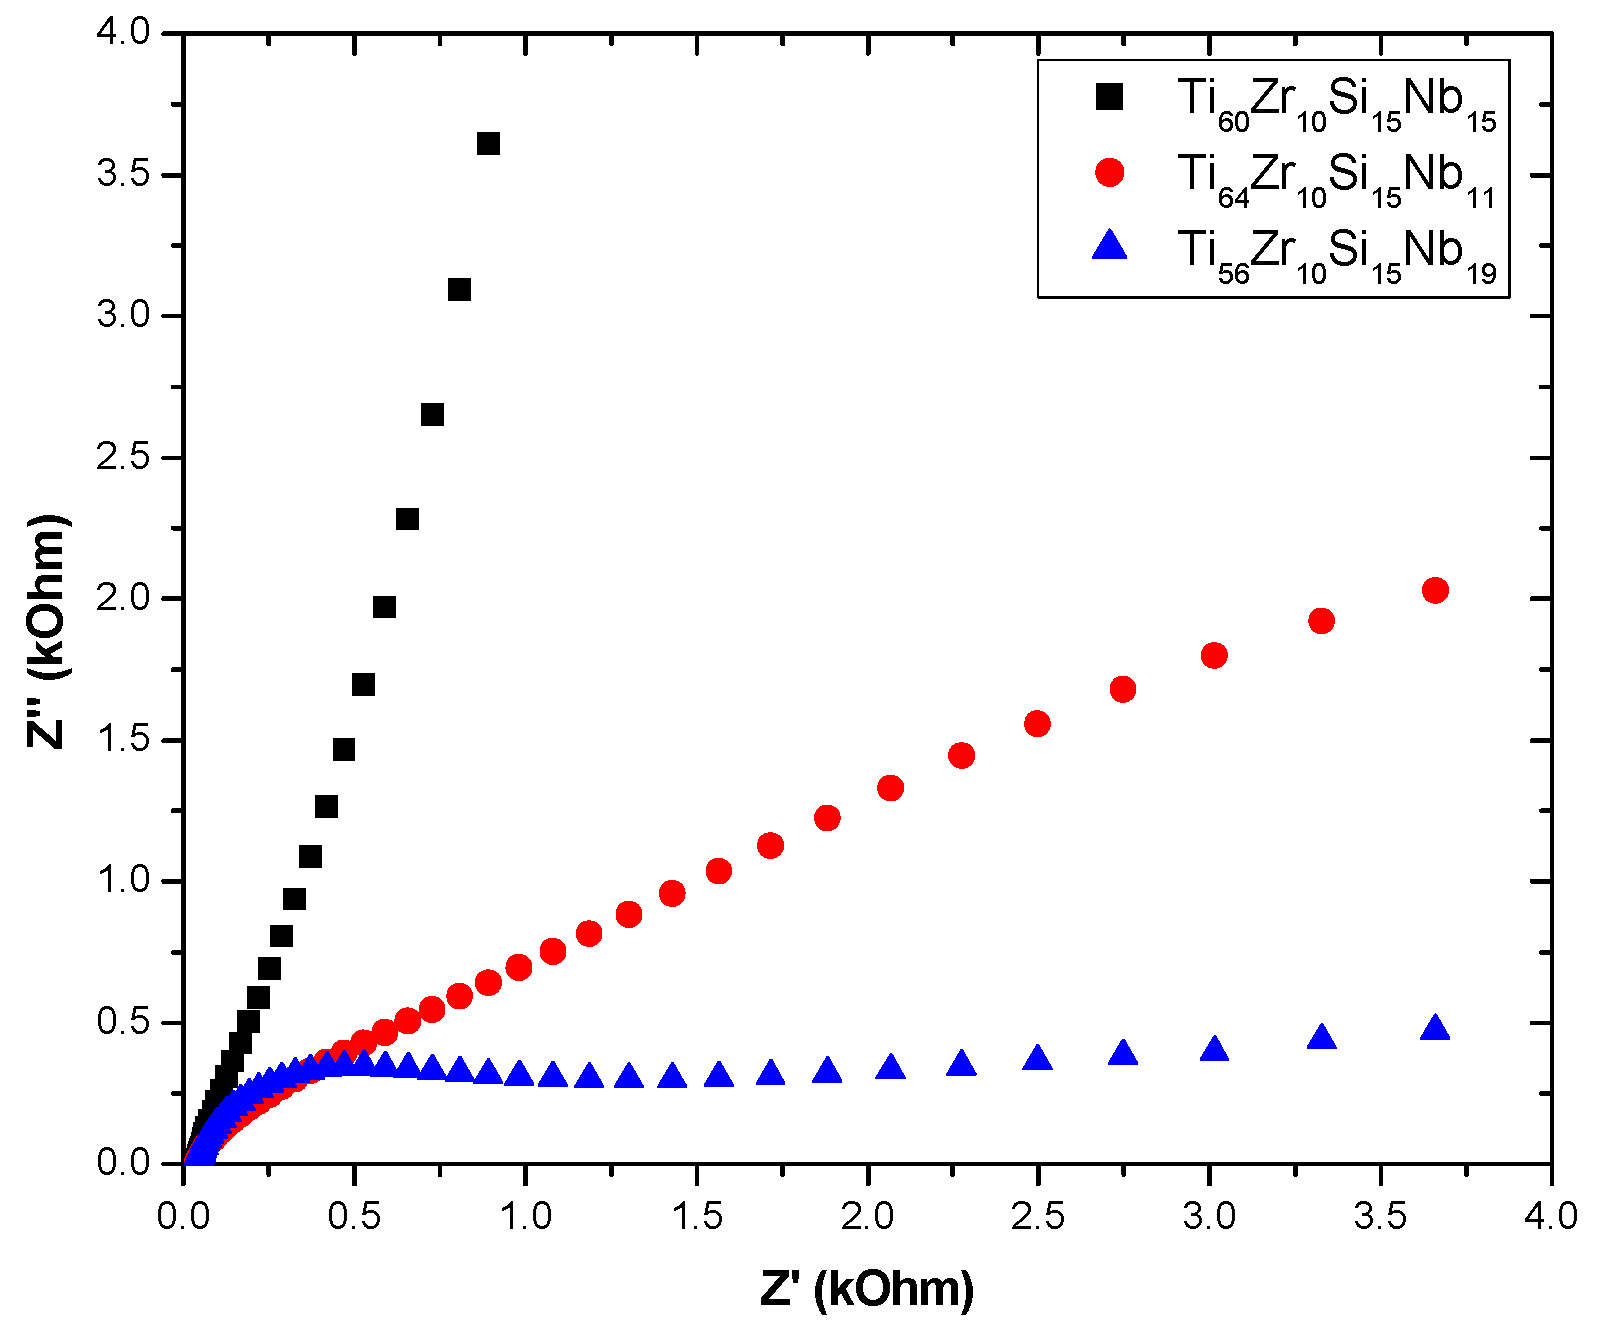
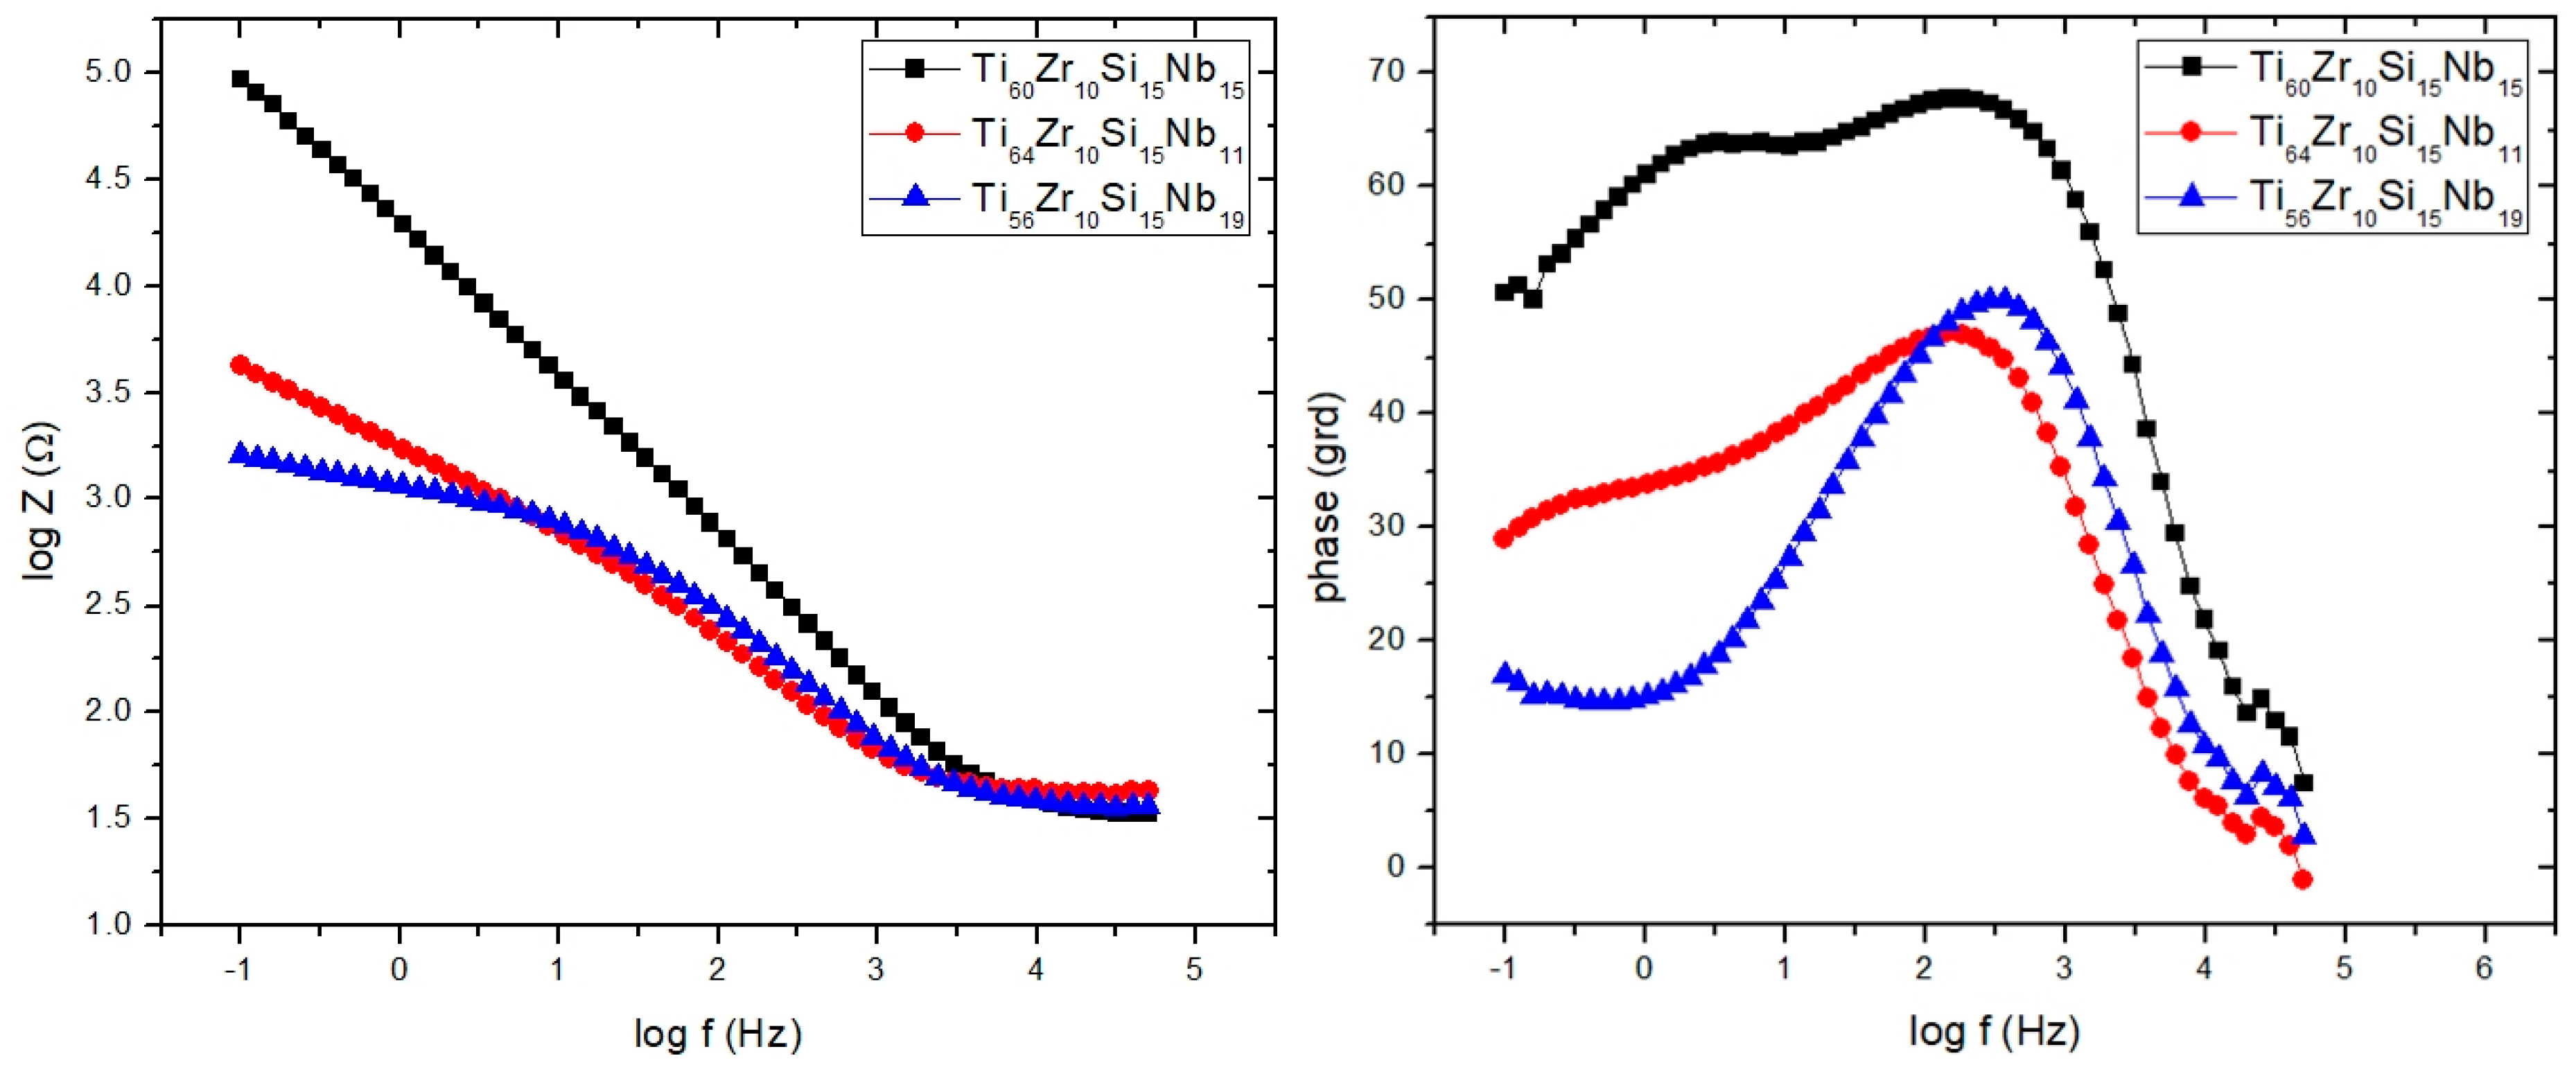
3.3.2. Electrochemical Impedance Spectroscopy (EIS)
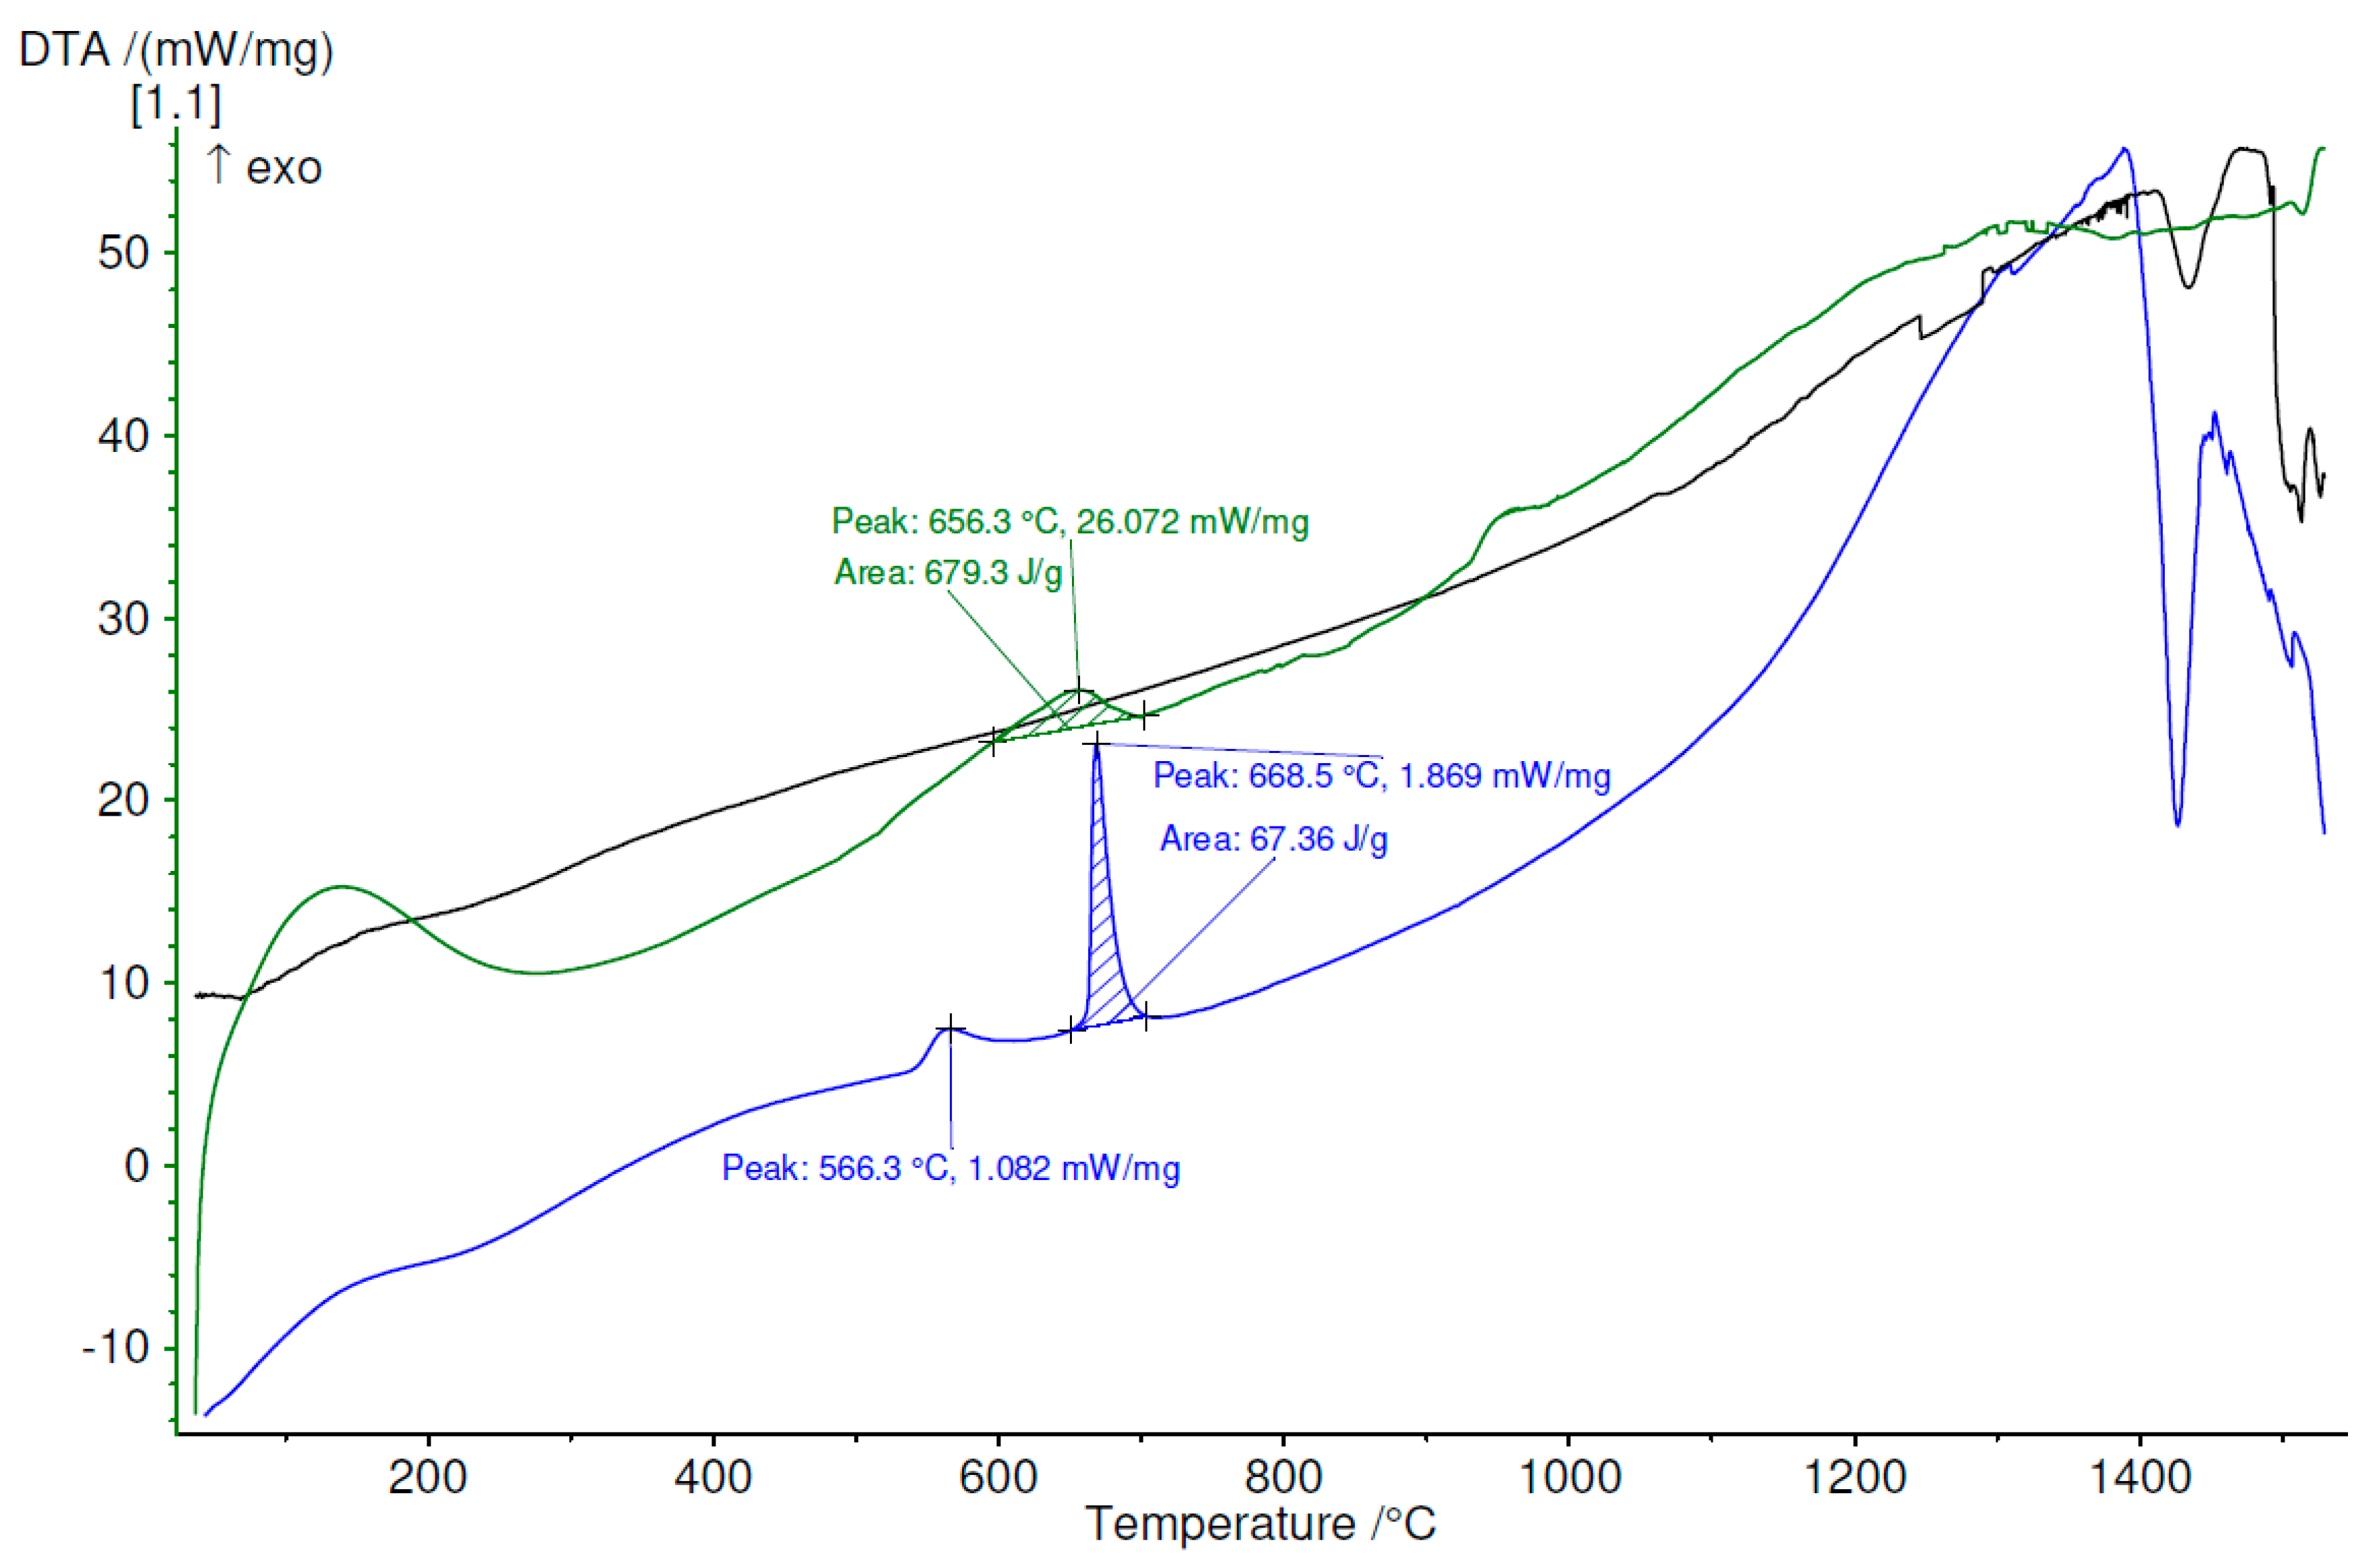
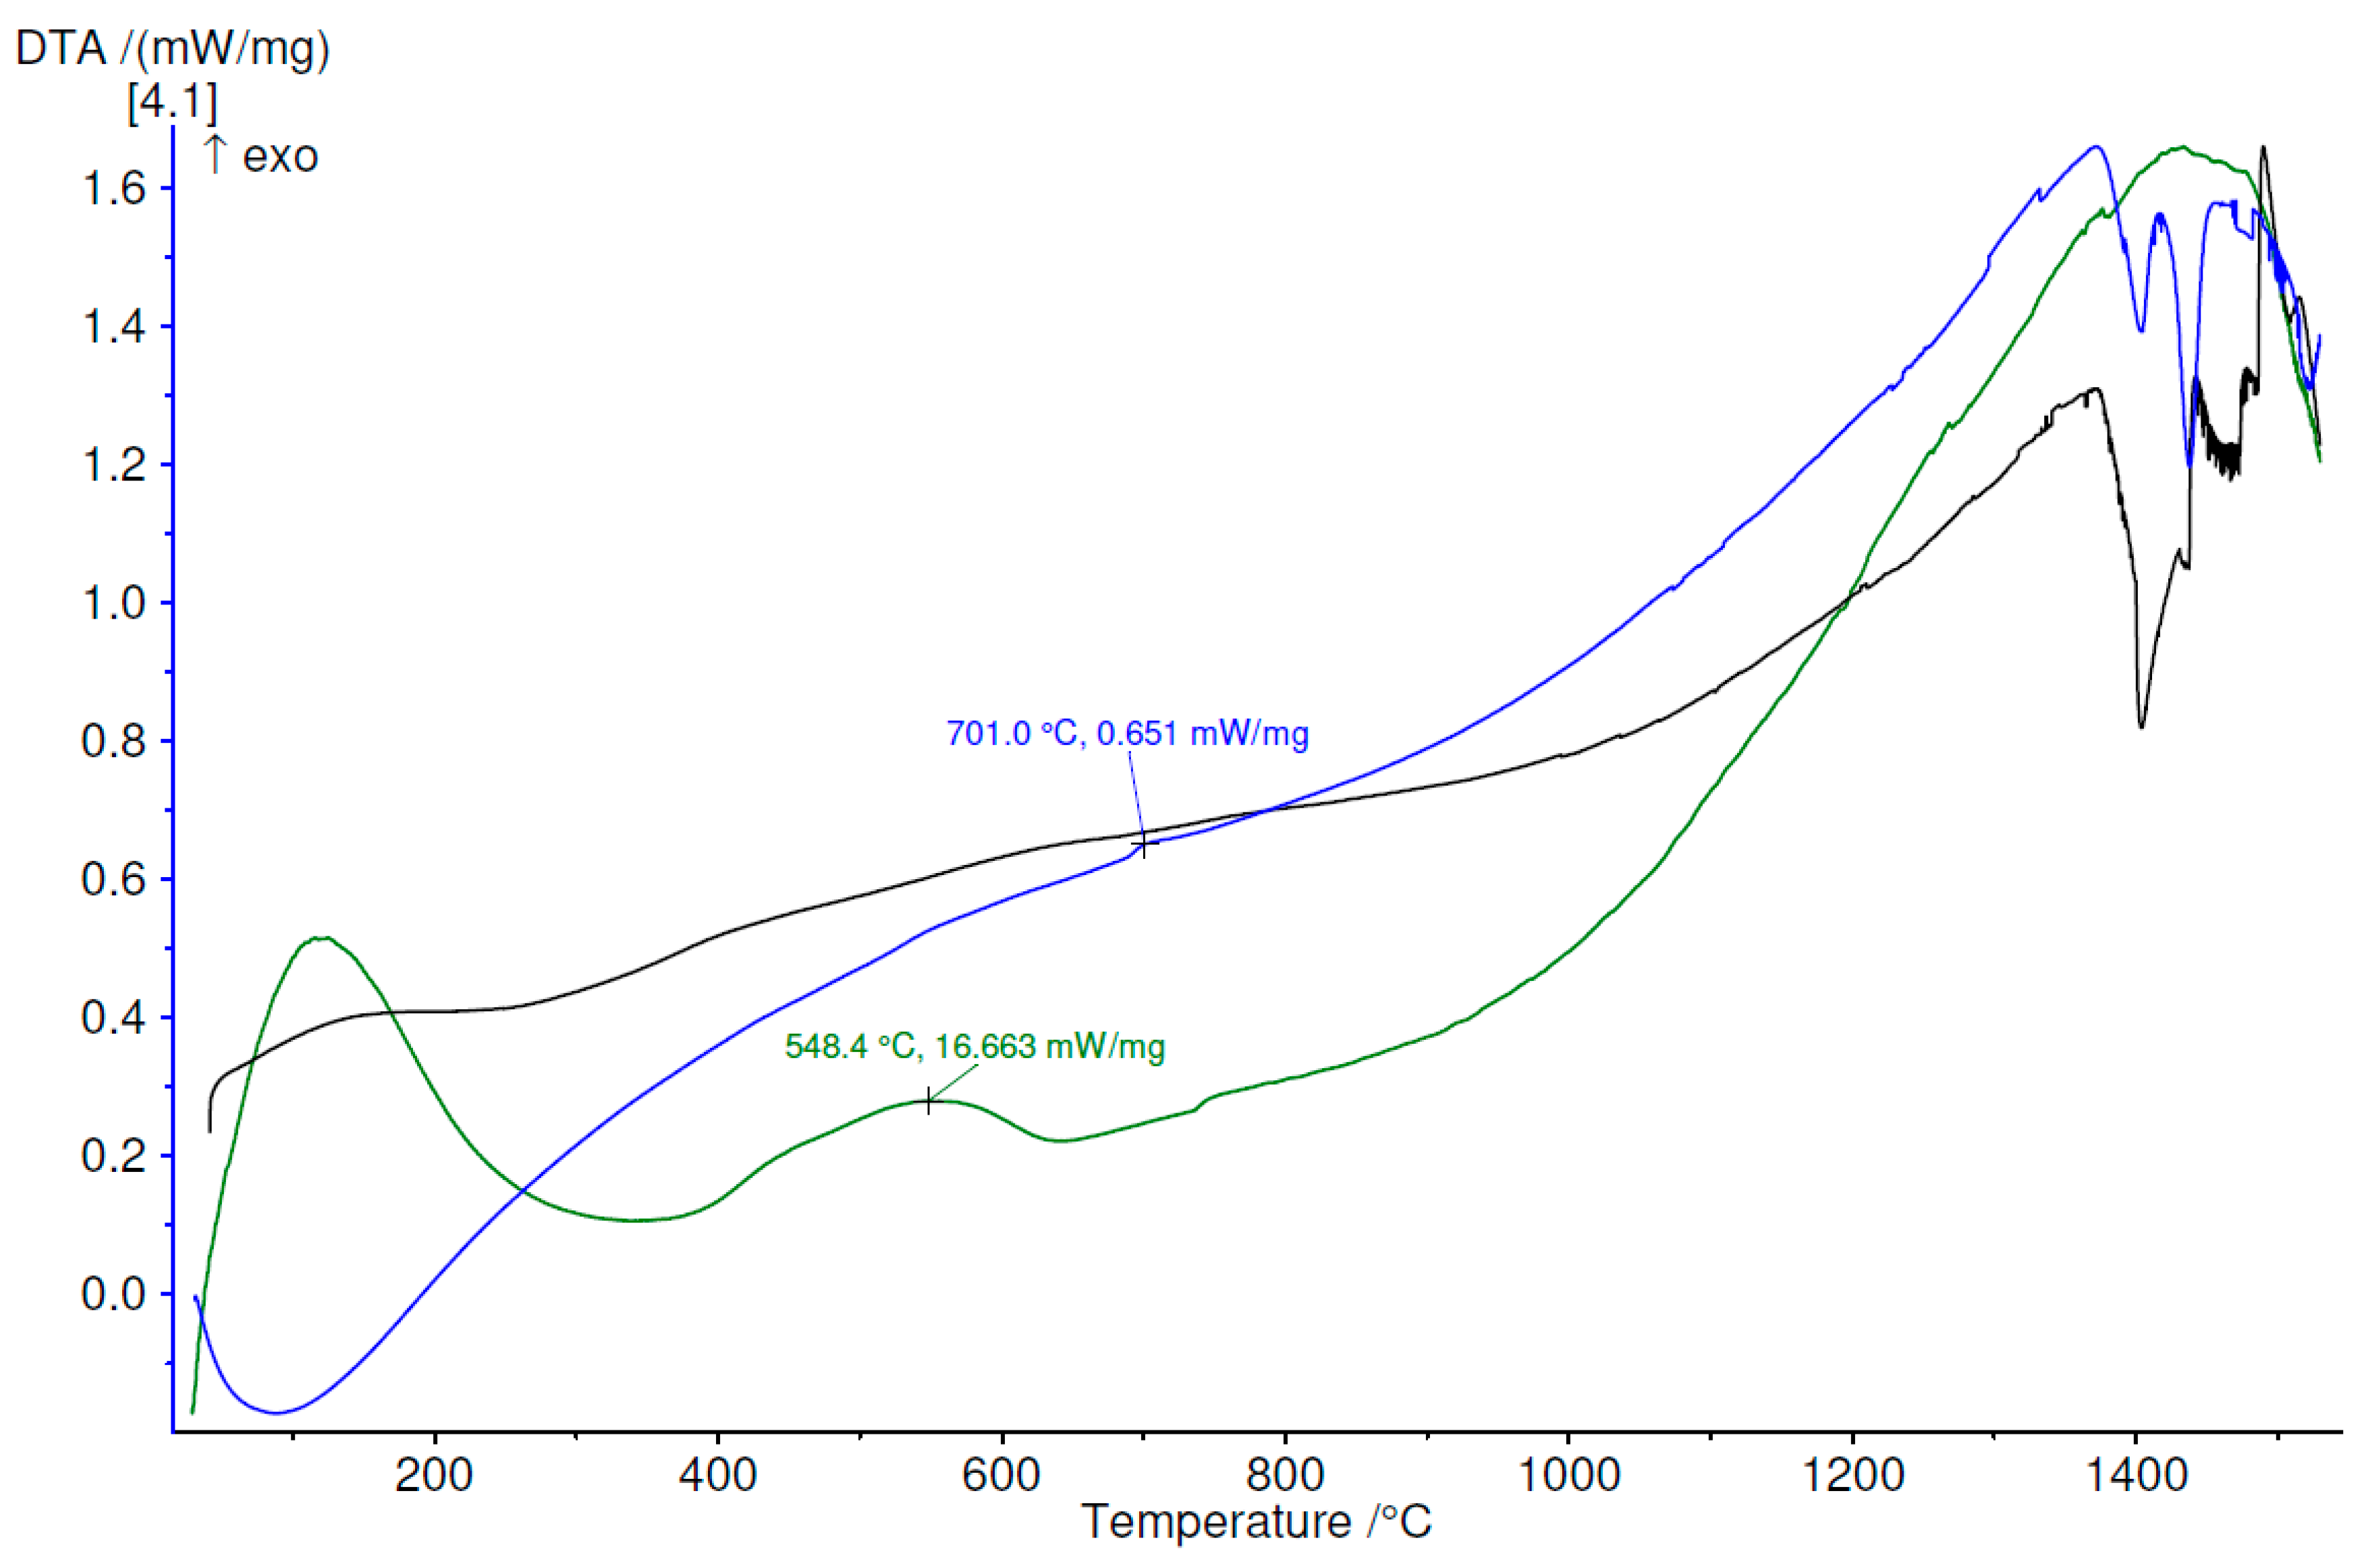
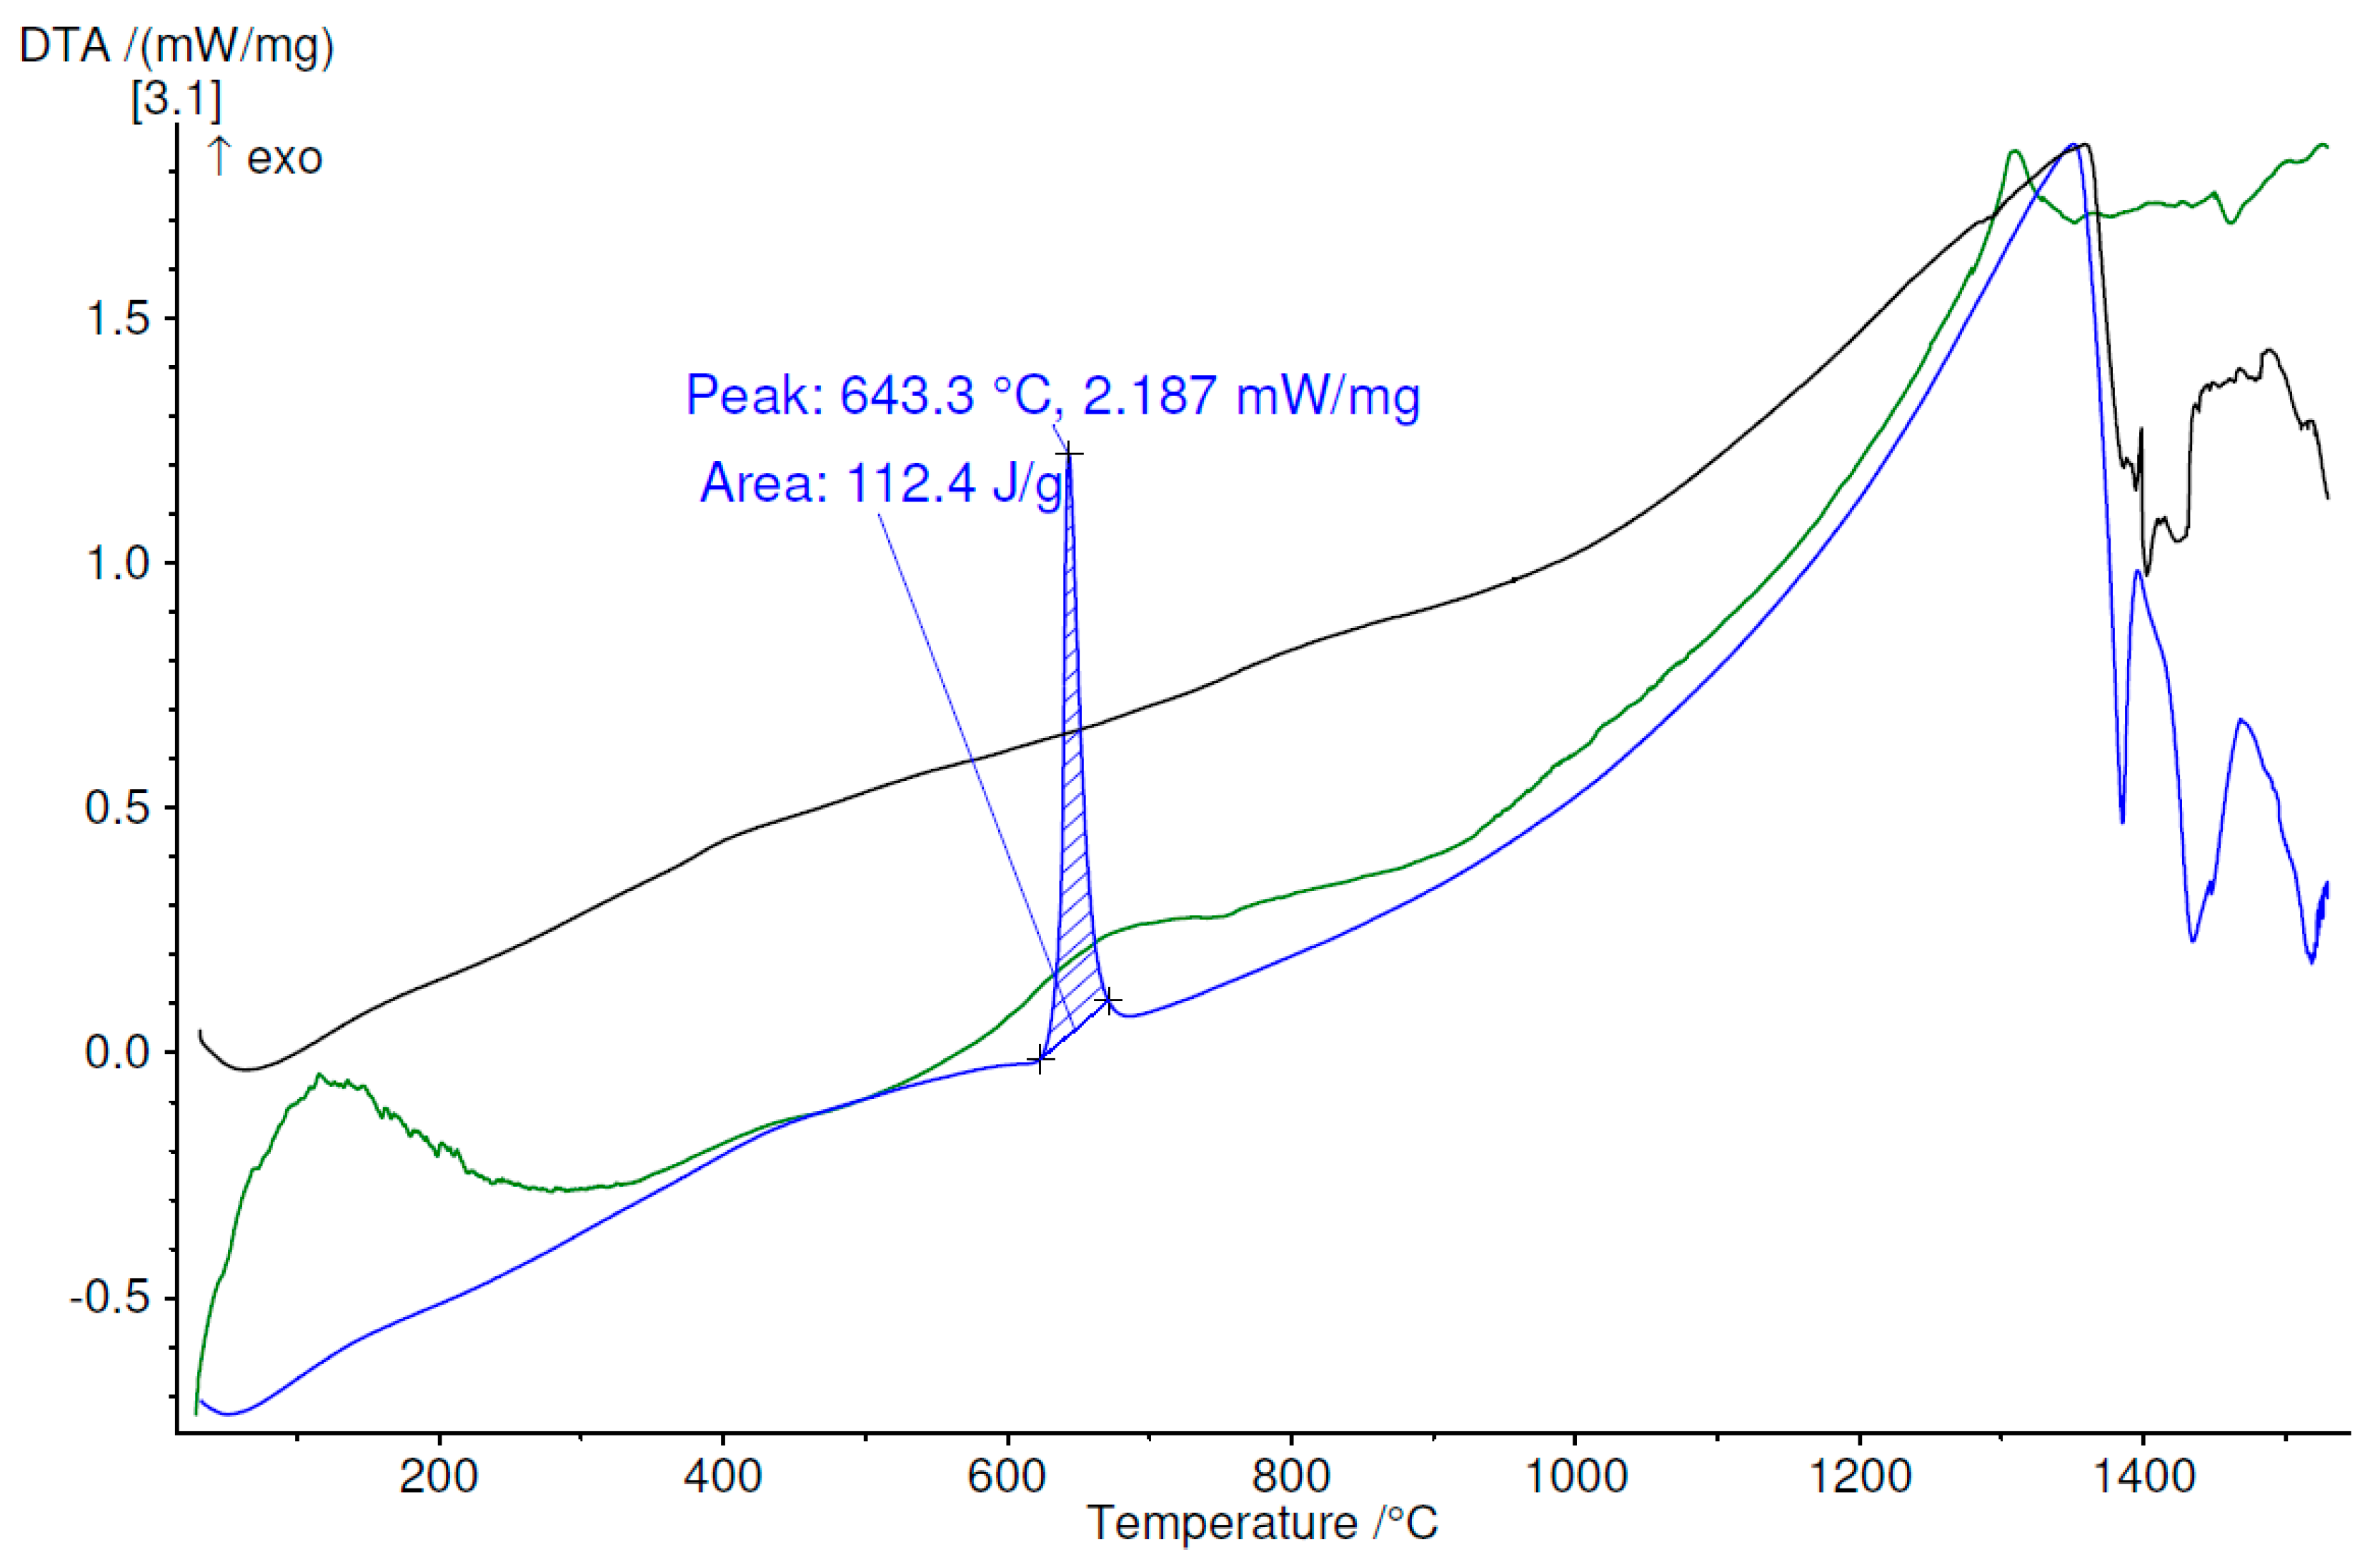
3.4. Thermal Analysis
4. Conclusions
Author Contributions
Funding
Conflicts of Interest
References
- Geetha, M.; Singh, A.K.; Asokamani, R.; Gogia, A.K. Ti based biomaterials, the ultimate choice for orthopaedic implants—A review. Prog. Mat. Sci. 2009, 54, 397–425. [Google Scholar] [CrossRef]
- Rony, L.; Lancigu, R.; Hubert, L. Intraosseous metal implants in orthopedics: A review. Morphologie 2018, 102, 231–242. [Google Scholar] [CrossRef]
- Wang, X.; Zhou, S.X.; Xu, W.; Leary, M.; Choong, P.; Qian, M.; Brandt, M.; Xie, Y.M. Topological design and additive manufacturing of porous metals for bone scaffolds and orthopaedic implants: A review. Biomaterials 2016, 83, 127–141. [Google Scholar] [CrossRef] [PubMed]
- Gepreel, M.A.-H.; Niinomi, M. Biocompatibility of Ti-alloys for long-term implantation. J. Mech. Behav. Biomed. Mater. 2013, 20, 407–415. [Google Scholar] [CrossRef]
- Eisenbarth, E.; Velten, D.; Müller, M.; Thull, R.; Breme, J. Biocompatibility of β-stabilizing elements of titanium alloys. Biomaterials 2004, 25, 5705–5713. [Google Scholar] [CrossRef] [PubMed]
- Sáenz de Viteri, V.; Fuentes, E. Titanium and Titanium Alloys as Biomaterials. In Tribology—Fundamentals and Advancements; Gegner, J., Ed.; IntechOpen: London, UK, 2013; pp. 155–181. [Google Scholar] [CrossRef]
- Costa, B.C.; Tokuharab, C.K.; Rocha, L.A.; Oliveira, R.C.; Lisboa-Filho, P.N.; Pessoa, J.C. Vanadium ionic species from degradation of Ti–6Al–4V metallic implants: In vitro cytotoxicity and speciation evaluation. Mat. Sci. Eng. C 2019, 96, 730–739. [Google Scholar] [CrossRef]
- Wang, Q.; Eltit, F.; Wang, R. Corrosion of Orthopedic Implants. In Encyclopedia of Biomedical Engineering; Narayan, R., Ed.; Elsevier: Amsterdam, The Netherlands, 2019; pp. 65–85. [Google Scholar] [CrossRef]
- Corne, P.; De March, P.; Cleymand, F.; Geringer, J. Fretting-corrosion behavior on dental implant connection in human saliva. J. Mech. Behav. Biomed. Mater. 2019, 94, 86–92. [Google Scholar] [CrossRef]
- Luo, Y.; Yang, L.; Tian, M. Application of biomedical-grade titanium alloys in trabecular bone and artificial joints. In Biomaterials and Medical Tribology; Davim, J.P., Ed.; Woodhead Publishing Limited: Cambridge, UK, 2013; pp. 181–216. [Google Scholar] [CrossRef]
- Hussein, A.; Gepreel, M.A.-H.; Gouda, M.K.; Hefnawy, A.M.; Kandil, S.H. Biocompatibility of new Ti–Nb–Ta base alloys. Mat. Sci. Eng. C 2016, 61, 574–578. [Google Scholar] [CrossRef]
- Semlitsch, M. Titanium alloys for hip joint replacements. Clinical Mat. 1987, 2, 1–13. [Google Scholar] [CrossRef]
- Metikos-Hukovic, M.; Kwokal, A.; Piljac, J. The influence of niobium and vanadium on passivity of titanium-based implants in physiological solution. Biomaterials 2003, 24, 3765–3775. [Google Scholar] [CrossRef]
- Nicoara, M.; Raduta, A.; Parthiban, R.; Locovei, C.; Eckert, J.; Stoica, M. Low Young’s modulus Ti-based porous bulk glassy alloy without cytotoxic elements. Acta Biomater. 2016, 36, 323–331. [Google Scholar] [CrossRef] [PubMed]
- Calin, M.; Gebert, A.; Ghinea, A.C.; Gostin, P.F.; Abdi, S.; Mickel, C.; Eckert, J. Designing biocompatible Ti-based metallic glasses for implant applications. Mat. Sci. Eng. C 2013, 33, 875–883. [Google Scholar] [CrossRef] [PubMed]
- Gonzalez, M.; Pena, J.; Manero, J.M.; Arciniegas, M.; Gil, F.J. Optimization of the Ti16.2Hf24.8Nb1Zr Alloy by Cold Working. J. Mat. Eng. Performance 2009, 18, 506–510. [Google Scholar] [CrossRef]
- Gonzalez, M.; Pena, J.; Manero, J.M.; Arciniegas, M.; Gil, F.J. Design and Characterization of New Ti–Nb–Hf Alloys. J. Mat. Eng. Performance 2009, 18, 490–495. [Google Scholar] [CrossRef]
- Huang, L.; Pu, C.; Fisher, R.K.; Mountain, D.J.H.; Gao, Y.; Liaw, P.K.; Zhang, W.; He, W. A Zr-based bulk metallic glass for future stent applications: Materials properties, finite element modeling, and in vitro human vascular cell response. Acta Biomater. 2015, 25, 356–368. [Google Scholar] [CrossRef] [PubMed]
- Morrison, M.L.; Buchanan, R.A.; Peker, A.; Liaw, P.K.; Horton, J.A. Electrochemical behavior of a Ti-based bulk metallic glass. J. Non-Cryst. Solids 2007, 353, 2115–2124. [Google Scholar] [CrossRef]
- Xie, G.Q.; Qin, F.X.; Zhu, S.L.; Inoue, A. Ni-free Ti-based bulk metallic glass with potential for biomedical applications produced by spark plasma sintering. Intermetallics 2012, 29, 99–103. [Google Scholar] [CrossRef]
- Abdi, S.; Oswald, S.; Gostin, P.F.; Helth, A.; Sort, J.; Barõ, M.D.; Calin, M.; Schultz, L.; Eckert, J.; Gebert, A. Designing new biocompatible glass-forming Ti75- xZr10NbxSi15 (x = 0, 15) alloys: Corrosion, passivity, and apatite formation. J. Biomed. Mater. Res. Part B Appl. Biomater. 2016, 104, 27–38. [Google Scholar] [CrossRef] [PubMed]
- Li, H.F.; Zheng, Y.F. Recent advances in bulk metallic glasses for biomedical applications. Acta Biomater. 2016, 36, 1–20. [Google Scholar] [CrossRef]
- Abdi, S.; Samadi Khoshkhoo, M.; Shuleshova, O.; Bönisch, M.; Calin, M.; Schultz, L.; Eckert, J.; Baró, M.D.; Sort, J.; Gebert, A. Effect of Nb addition on microstructure evolution and nanomechanical properties of a glass-forming Ti–Zr–Si alloy. Intermetallics 2014, 46, 156–163. [Google Scholar] [CrossRef]
- Thanka Rajan, S.; Bendavid, A.; Subramanian, B. Cytocompatibility assessment of Ti–Nb–Zr–Si thin film metallic glasses with enhanced osteoblast differentiation for biomedical applications. Colloid. Surf. B 2019, 173, 109–120. [Google Scholar] [CrossRef] [PubMed]
- Cui, S.; Ouyang, G.; Ma, T.; Macziewski, C.R.; Levitas, V.I.; Zhou, L.; Kramer, M.J.; Cui, J. Thermodynamic and kinetic analysis of the melt spinning process of Fe-6.5 wt.% Si alloy. J. Alloy. Compd. 2019, 771, 643–648. [Google Scholar] [CrossRef]
- Shirzadi, A.A.; Kozieł, T.; Cios, G.; Bała, P. Development of Auto Ejection Melt Spinning (AEMS) and its application in fabrication of cobalt-based ribbons. J. Mat. Proc. Tech. 2019, 264, 377–381. [Google Scholar] [CrossRef]
- Kim, J.; Choi, H.; Kim, M.; Miyazaki, S.; Kim, Y.; Chun, B.S.; Nam, T. Crystallization and martensitic transformation behavior of Ti–Ni–Sn alloy ribbons. Intermetallics 2012, 30, 51–56. [Google Scholar] [CrossRef]
- Oliver, W.C.; Pharr, G.M. An improved technique for determining hardness and elastic modulus using load and displacement sensing indentation experiments. J. Mater. Res. 1992, 47, 1564–1583. [Google Scholar] [CrossRef]
- Predel, B. Ti–Zr (Titanium–Zirconium). In Pu–Re—Zn–Zr; Landolt-Börnstein—Group IV Physical Chemistry (Numerical Data and Functional Relationships in Science and Technology); Madelung, O., Ed.; Springer: Berlin/Heidelberg, Germany, 1998; Volume 5J. [Google Scholar] [CrossRef]
- Predel, B. Nb–Ti (Niobium–Titanium). In Li–Mg—Nd–Zr; Landolt-Börnstein—Group IV Physical Chemistry (Numerical Data and Functional Relationships in Science and Technology); Madelung, O., Ed.; Springer: Berlin/Heidelberg, Germany, 1997; Volume 5H. [Google Scholar] [CrossRef]
- Abriata, J.P.; Bolcich, J.C. The Nb−Zr (Niobium−Zirconium) system. Bull. Alloy. Phase Diagr. 1982, 3, 34–44. [Google Scholar] [CrossRef]
- Franke, P.; Neuschütz, D. Scientific Group Thermodata Europe (SGTE) Si–Ti. In Binary Systems. Part 4: Binary Systems from Mn–Mo to Y–Zr; Landolt-Börnstein—Group IV Physical Chemistry (Numerical Data and Functional Relationships in Science and Technology); Franke, P., Neuschütz, D., Eds.; Springer: Berlin/Heidelberg, Germany, 2006; Volume 19B4. [Google Scholar] [CrossRef]
- Predel, B. Si–Zr (Silicon–Zirconium). In Pu–Re—Zn–Zr; Landolt-Börnstein—Group IV Physical Chemistry (Numerical Data and Functional Relationships in Science and Technology); Madelung, O., Ed.; Springer: Berlin/Heidelberg, Germany, 1998; Volume 5J. [Google Scholar] [CrossRef]
- Schlesinger, M.E.; Okamoto, H.; Gokhale, A.B.; Abbaschian, R. The Nb–Si (Niobium–Silicon) system. J. Phase Equilib. 1993, 14, 502–509. [Google Scholar] [CrossRef]
- Robins, D.A.; Jenkins, I. The heats of formation of some transition metal silicides. Acta Metall. 1955, 3, 598–604. [Google Scholar] [CrossRef]
- Fujiwara, H.; Ueda, Y.; Awasthi, A.; Krishnamurthy, N.; Garg, S.P. Determination of Standard Free Energy of Formation for Niobium Silicides by EMF Measurements. J. Electrochem. Soc. 2003, 150, J43–J48. [Google Scholar] [CrossRef]
- Bandyopadhyay, D. The Ti–Si–C System (Titanium–Silicon–Carbon). J. Phase Equilib. Diff. 2004, 25, 415–420. [Google Scholar] [CrossRef]
- Scientific Group Thermodata Europe (SGTE). Binary System Si–Ti. In Ternary Steel Systems: Phase Diagrams and Phase Transition Data; Landolt-Börnstein—Group IV Physical Chemistry (Numerical Data and Functional Relationships in Science and Technology); Franke, P., Seifert, H.J., Eds.; Springer: Berlin, Germany, 2012; Volume 19C1, pp. 54–59. [Google Scholar] [CrossRef]
- Brizuela, A.; Herrero-Climent, M.; Rios-Carrasco, E.; Rios-Santos, J.V.; Pérez, R.A.; Manero, J.M.; Gil Mur, J. Influence of the Elastic Modulus on the Osseointegration of Dental Implants. Materials 2019, 12, 980. [Google Scholar] [CrossRef] [PubMed]
- Ma, L.W.; Cheng, H.S.; Chung, C.Y. Effect of thermo-mechanical treatment on superelastic behavior of Ti–19Nb–14Zr (at.%) shape memory alloy. Intermetallics 2013, 32, 44–50. [Google Scholar] [CrossRef]


| Alloy | Ti | Zr | Si | Nb | |
|---|---|---|---|---|---|
| Ti60Zr10Si15Nb15 | [% at] | 60 | 10 | 15 | 15 |
| [% wt] | 51.29 | 16.29 | 7.52 | 24.89 | |
| Ti64Zr10Si15Nb11 | [% at] | 64 | 10 | 15 | 11 |
| [% wt] | 56.53 | 16.83 | 7.77 | 18.86 | |
| Ti56Zr10Si15Nb19 | [% at] | 56 | 10 | 15 | 19 |
| [% wt] | 46.38 | 15.78 | 7.29 | 30.54 | |
| Process | Alloy | Crystallite Size (nm) |
|---|---|---|
| MS1 | Ti60Zr10Si15Nb15 | 17 |
| Ti64Zr10Si15Nb11 | 18 | |
| Ti56Zr10Si15Nb19 | 21 | |
| MS2 | Ti60Zr10Si15Nb15 | 21 |
| Ti64Zr10Si15Nb11 | 0 (amorphous) | |
| Ti56Zr10Si15Nb19 | 0 (amorphous) |
| Alloy | Acquisition Site | Chemical Composition [% at] | |||
|---|---|---|---|---|---|
| Ti | Si | Zr | Nb | ||
| bulk Ti60Zr10Si15Nb15 | spectrum 1 | 85.61 | 0.42 | 5.39 | 8.57 |
| spectrum 2 | 61.56 | 16.21 | 16.64 | 5.59 | |
| bulk Ti64Zr10Si15Nb11 | spectrum 1 | 40.60 | 37.64 | 14.55 | 7.20 |
| spectrum 2 | 78.39 | 1.76 | 4.58 | 15.28 | |
| bulk Ti56Zr10Si15Nb19 | spectrum 1 | 57.84 | 39.70 | 2.29 | 0.181 |
| spectrum 2 | 86.71 | 11.28 | 1.74 | 0.27 | |
| Ti60Zr10Si15Nb15 ribbons MS1 | spectrum 1 | 76.53 | 2.69 | 8.14 | 12.65 |
| spectrum 2 | 65.30 | 12.73 | 12.31 | 9.66 | |
| Ti64Zr10Si15Nb11 ribbons MS1 | spectrum 1 | 59.42 | 17.60 | 10.51 | 12.46 |
| spectrum 2 | 44.83 | 31.68 | 13.00 | 10.49 | |
| Ti56Zr10Si15Nb19 ribbons MS1 | spectrum 1 | 59.99 | 13.38 | 10.03 | 16.61 |
| spectrum 2 | 42.48 | 31.45 | 14.23 | 11.84 | |
| Alloy | Variant | H (GPa) | E (GPa) | H/E | H2/E2 | H3/E2 |
|---|---|---|---|---|---|---|
| Ti56Zr10Si15Nb19 | bulk | 7.23 ± 2.89 | 120.04 ± 20.21 | 0.0602 | 0.0036 | 0.0262 |
| MS1 | 5.41 ± 0.51 | 87.35 ± 3.44 | 0.0620 | 0.0038 | 0.0208 | |
| MS2 | 7.71 ± 0.99 | 102.08 ± 5.05 | 0.0755 | 0.0057 | 0.0440 | |
| MS2 + TT | 5.73 ± 1.06 | 97.23 ± 10.11 | 0.0589 | 0.0035 | 0.0199 | |
| Ti60Zr10Si15Nb15 | bulk | 6.06 ± 0.56 | 125.52 ± 7.46 | 0.0484 | 0.0023 | 0.0142 |
| MS1 | 7.00 ± 1.51 | 94.16 ± 9.55 | 0.0744 | 0.0055 | 0.0388 | |
| MS2 | 6.66 ± 0.35 | 103.68 ± 2.99 | 0.0643 | 0.0041 | 0.0276 | |
| MS2 + TT | 8.31 ± 0.78 | 125.16 ± 5.30 | 0.0665 | 0.0044 | 0.0368 | |
| Ti64Zr10Si15Nb11 | bulk | 4.73 ± 0.92 | 122.54 ± 15.97 | 0.0387 | 0.0015 | 0.0071 |
| MS1 | 7.63 ± 1.52 | 127.19 ± 12.19 | 0.0600 | 0.0036 | 0.0275 | |
| MS2 | 6.21 ± 0.54 | 118.50 ± 7.90 | 0.0524 | 0.0027 | 0.0171 | |
| MS2 + TT | 9.92 ± 0.28 | 127.89 ± 3.02 | 0.0776 | 0.0060 | 0.0597 |
| Sample/Parameter | Ecorr [V] | I corr [μA] | Jcorr [μA/cm²] | Rp [kΩ] | βa [V/decade] | βc [V/decade] | vcorr [mm/year] | Epass [V] | Ebd [V] |
|---|---|---|---|---|---|---|---|---|---|
| Ti60Zr10Si15Nb15 | −0.327 | 0.143 | 0.260 | 616.70 | 0.411 | 0.399 | 0.012 | 2.10 | 1.60 |
| Ti64Zr10Si15Nb11 | −0.437 | 0.662 | 1.199 | 78.59 | 0.256 | 0.370 | 0.079 | 0.25 | −0.25 |
| Ti56Zr10Si15Nb19 | −0.208 | 0.537 | 1.302 | 90.57 | 0.160 | 0.373 | 0.804 | 0.40 | 0.00 |
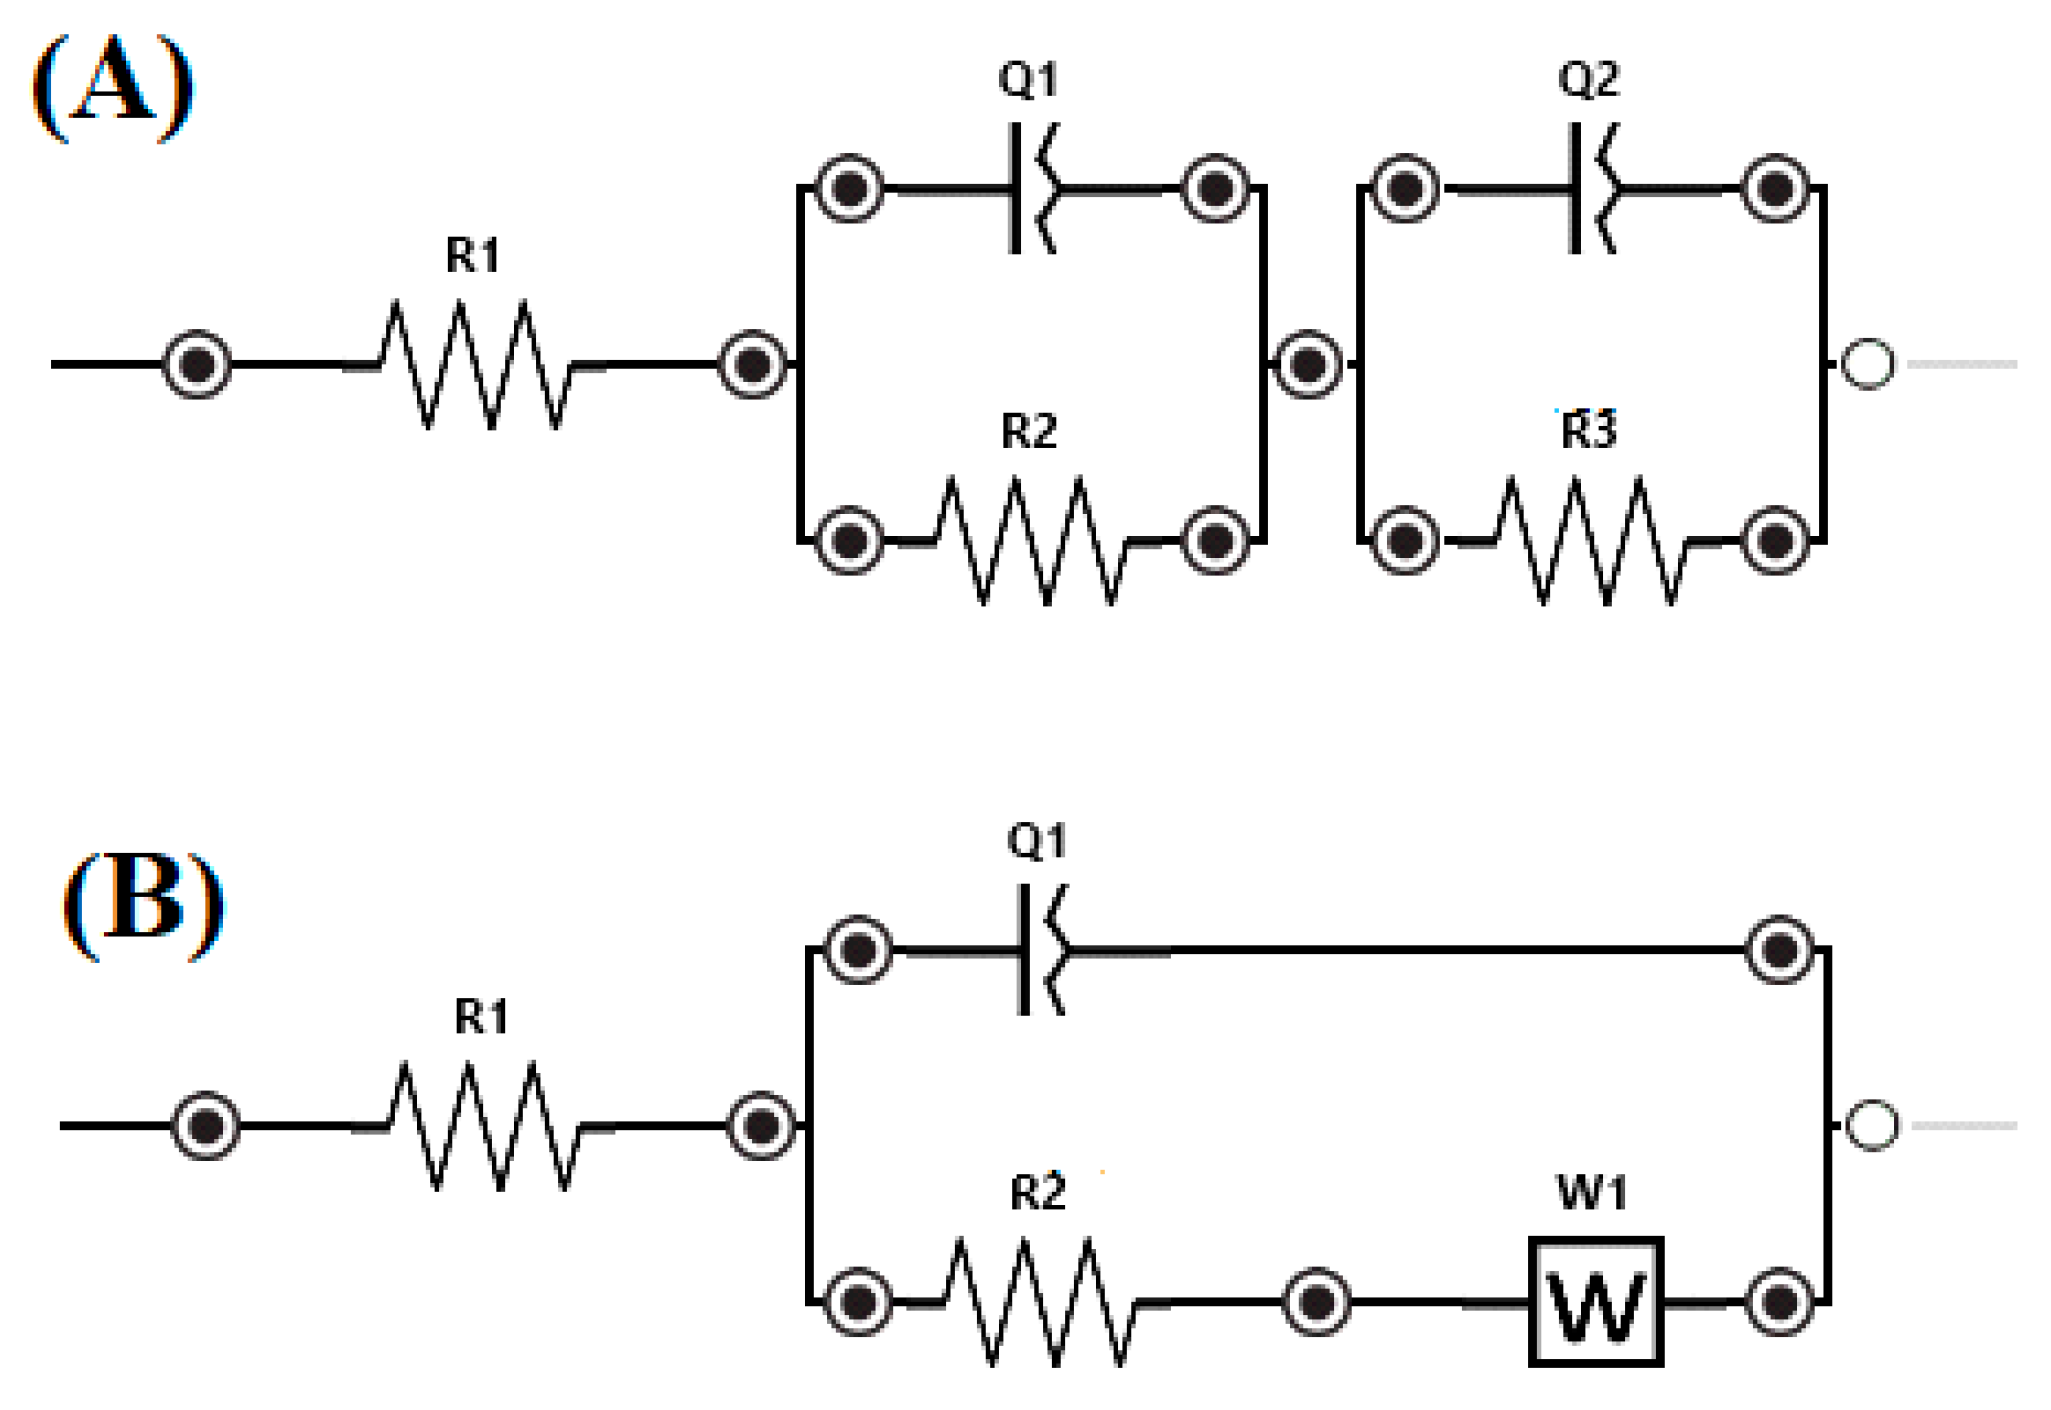
| Sample/Parameter | R 1 | Q 1 | n 1 | R 2 | Q 2 | n 2 | R 3 | W1 |
|---|---|---|---|---|---|---|---|---|
| Ω cm2 | μF−1 cm−2 s−n | Ω cm2 | μF−1 cm−2 s−n | Ω cm2 | KΩ s−0.5 | |||
| Ti60Zr10Si15Nb15 | 1.18 | 874.77 | 0.74 | 45.07 | 466.24 | 0.76 | 4536.16 | - |
| Ti64Zr10Si15Nb11 | 1.50 | 4327.90 | 0.59 | 438.05 | 1531.27 | 0.70 | 31.14 | - |
| Ti56Zr10Si15Nb19 | 1.39 | - | - | - | 638.04 | 0.75 | 40.98 | 441.00 |
© 2019 by the authors. Licensee MDPI, Basel, Switzerland. This article is an open access article distributed under the terms and conditions of the Creative Commons Attribution (CC BY) license (http://creativecommons.org/licenses/by/4.0/).
Share and Cite
Gabor, C.; Cristea, D.; Velicu, I.-L.; Bedo, T.; Gatto, A.; Bassoli, E.; Varga, B.; Pop, M.A.; Geanta, V.; Stefanoiu, R.; et al. Ti–Zr–Si–Nb Nanocrystalline Alloys and Metallic Glasses: Assessment on the Structure, Thermal Stability, Corrosion and Mechanical Properties. Materials 2019, 12, 1551. https://doi.org/10.3390/ma12091551
Gabor C, Cristea D, Velicu I-L, Bedo T, Gatto A, Bassoli E, Varga B, Pop MA, Geanta V, Stefanoiu R, et al. Ti–Zr–Si–Nb Nanocrystalline Alloys and Metallic Glasses: Assessment on the Structure, Thermal Stability, Corrosion and Mechanical Properties. Materials. 2019; 12(9):1551. https://doi.org/10.3390/ma12091551
Chicago/Turabian StyleGabor, Camelia, Daniel Cristea, Ioana-Laura Velicu, Tibor Bedo, Andrea Gatto, Elena Bassoli, Bela Varga, Mihai Alin Pop, Victor Geanta, Radu Stefanoiu, and et al. 2019. "Ti–Zr–Si–Nb Nanocrystalline Alloys and Metallic Glasses: Assessment on the Structure, Thermal Stability, Corrosion and Mechanical Properties" Materials 12, no. 9: 1551. https://doi.org/10.3390/ma12091551
APA StyleGabor, C., Cristea, D., Velicu, I.-L., Bedo, T., Gatto, A., Bassoli, E., Varga, B., Pop, M. A., Geanta, V., Stefanoiu, R., Codescu, M. M., Manta, E., Patroi, D., Florescu, M., Munteanu, S. I., Ghiuta, I., Lupu, N., & Munteanu, D. (2019). Ti–Zr–Si–Nb Nanocrystalline Alloys and Metallic Glasses: Assessment on the Structure, Thermal Stability, Corrosion and Mechanical Properties. Materials, 12(9), 1551. https://doi.org/10.3390/ma12091551