Formability Limits, Fractography and Fracture Toughness in Sheet Metal Forming


Abstract
:1. Introduction
2. Materials and Methods
2.1. Material Characterisation
2.2. Formability Limits
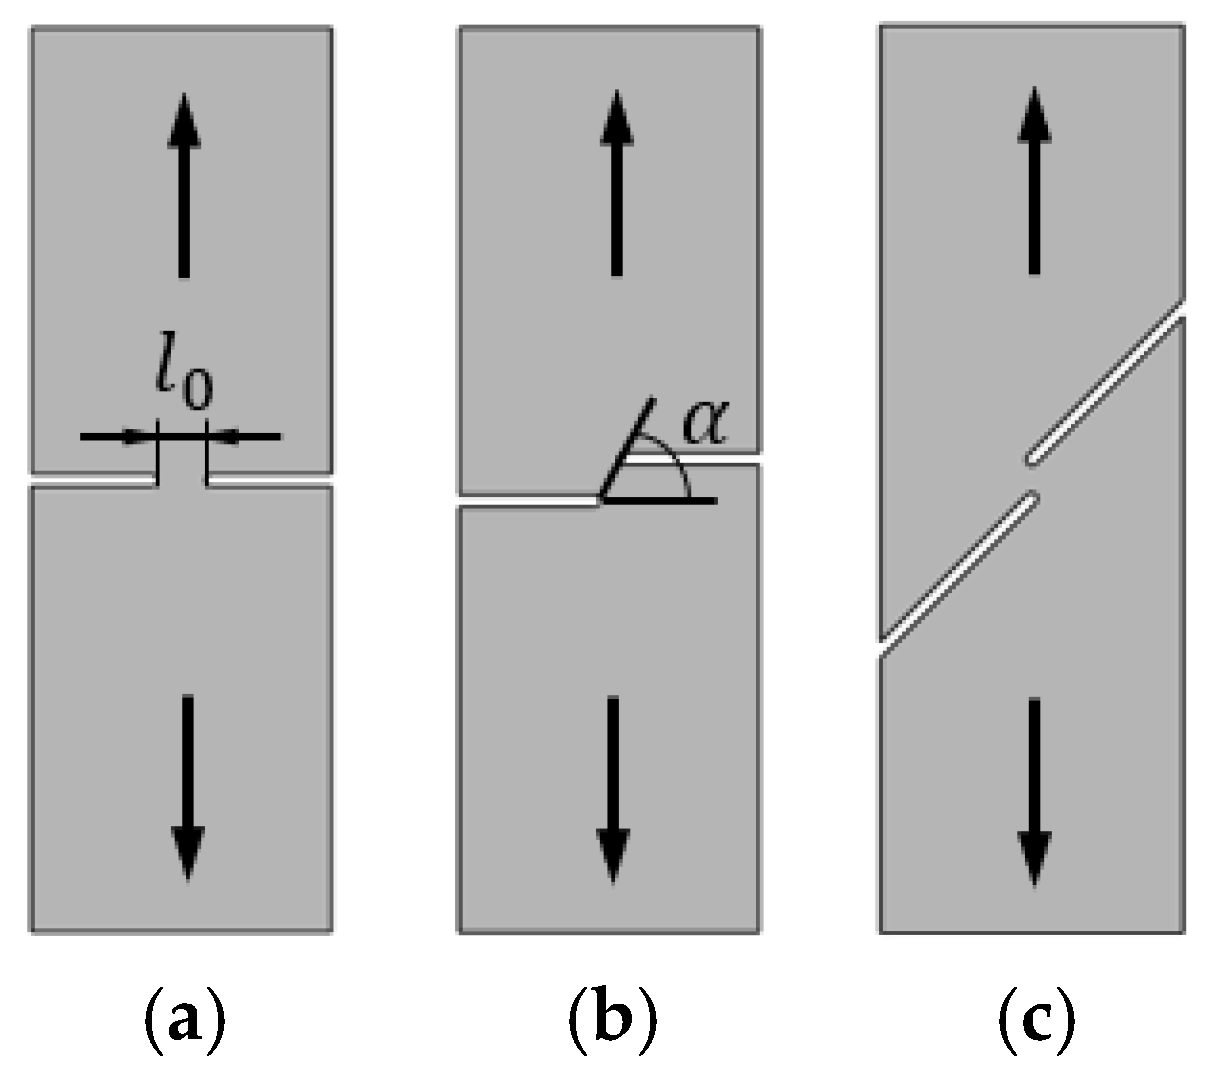
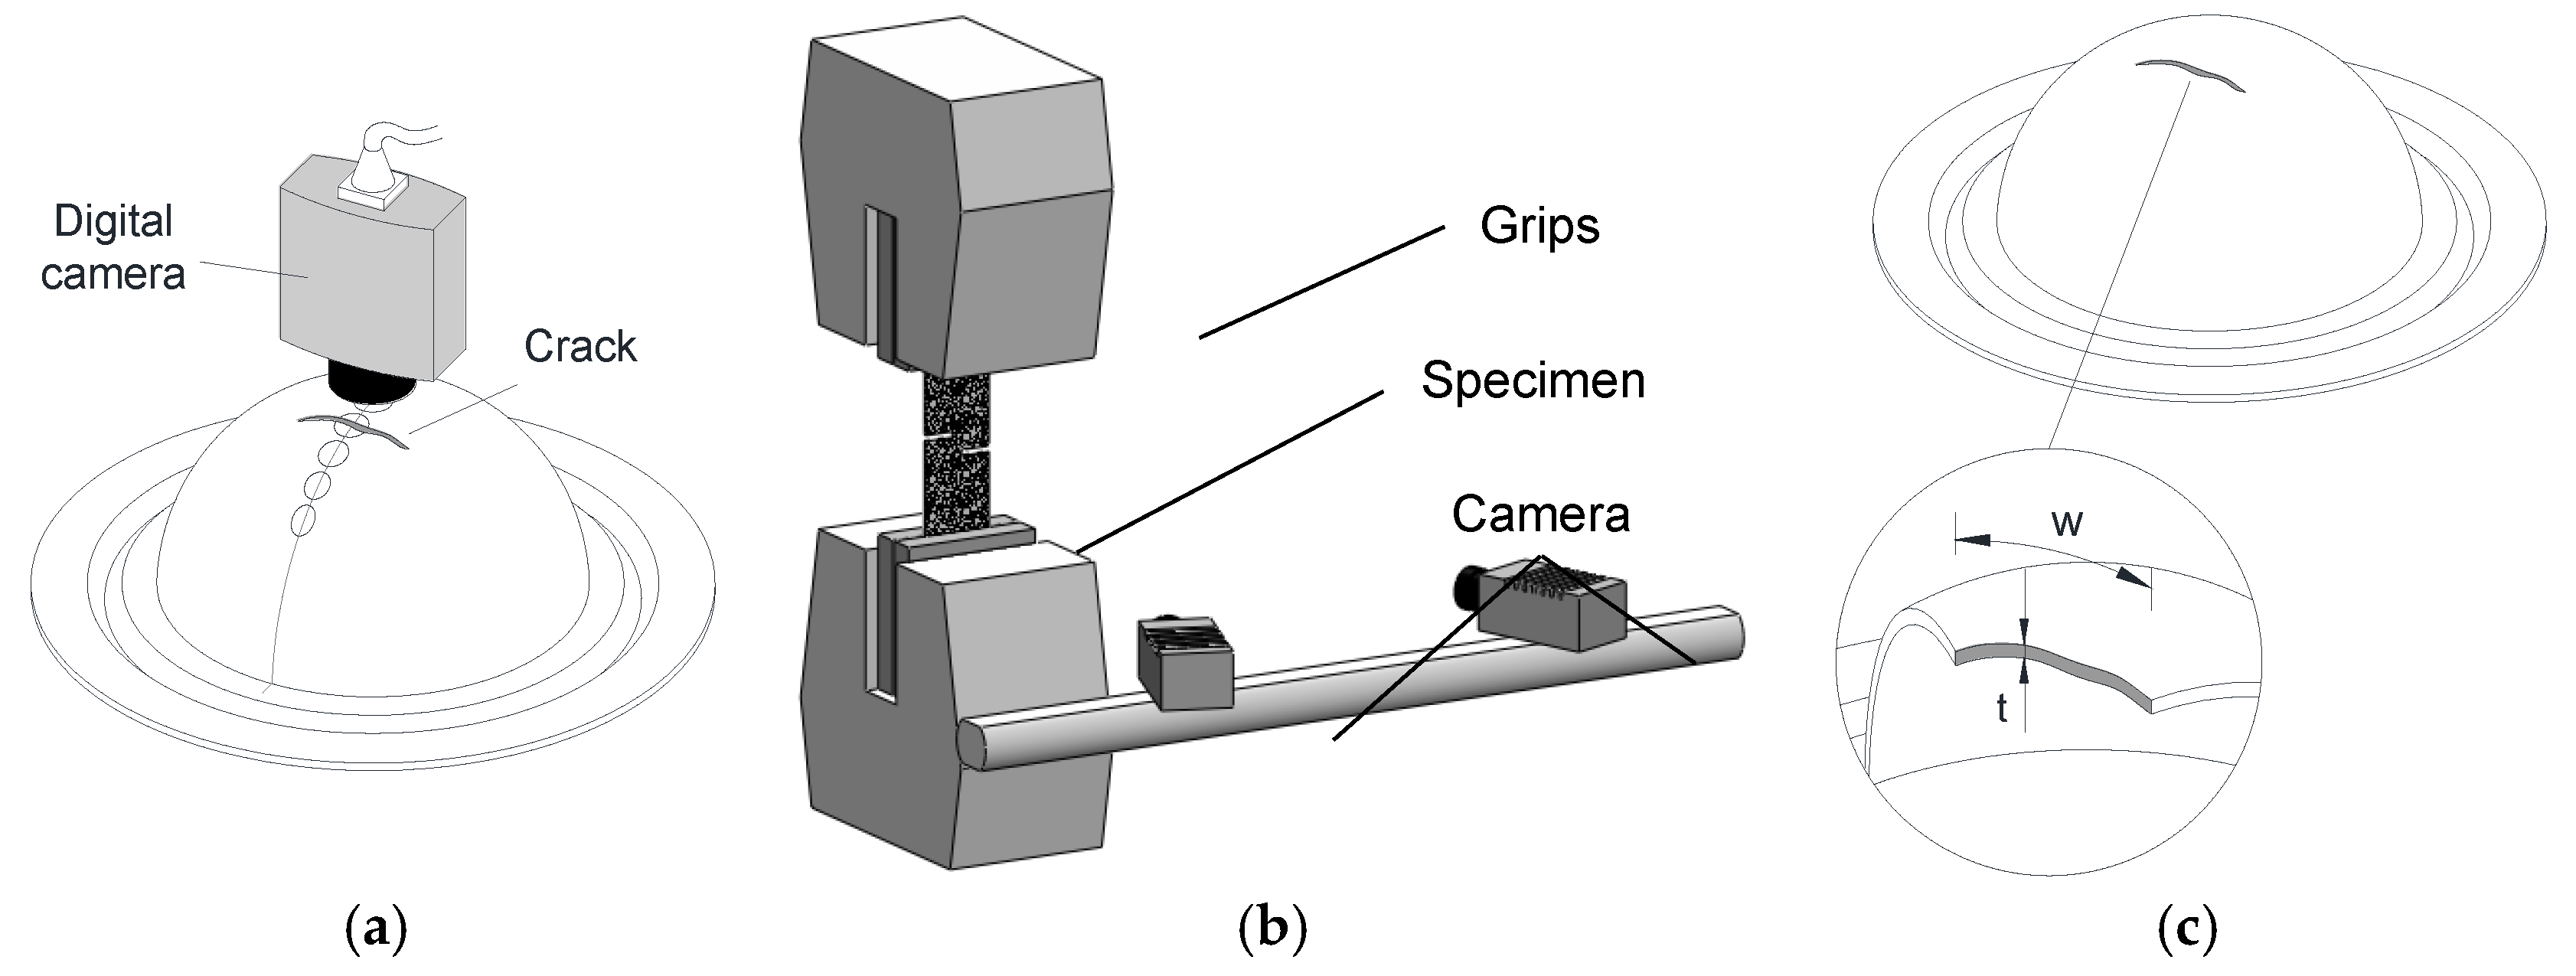
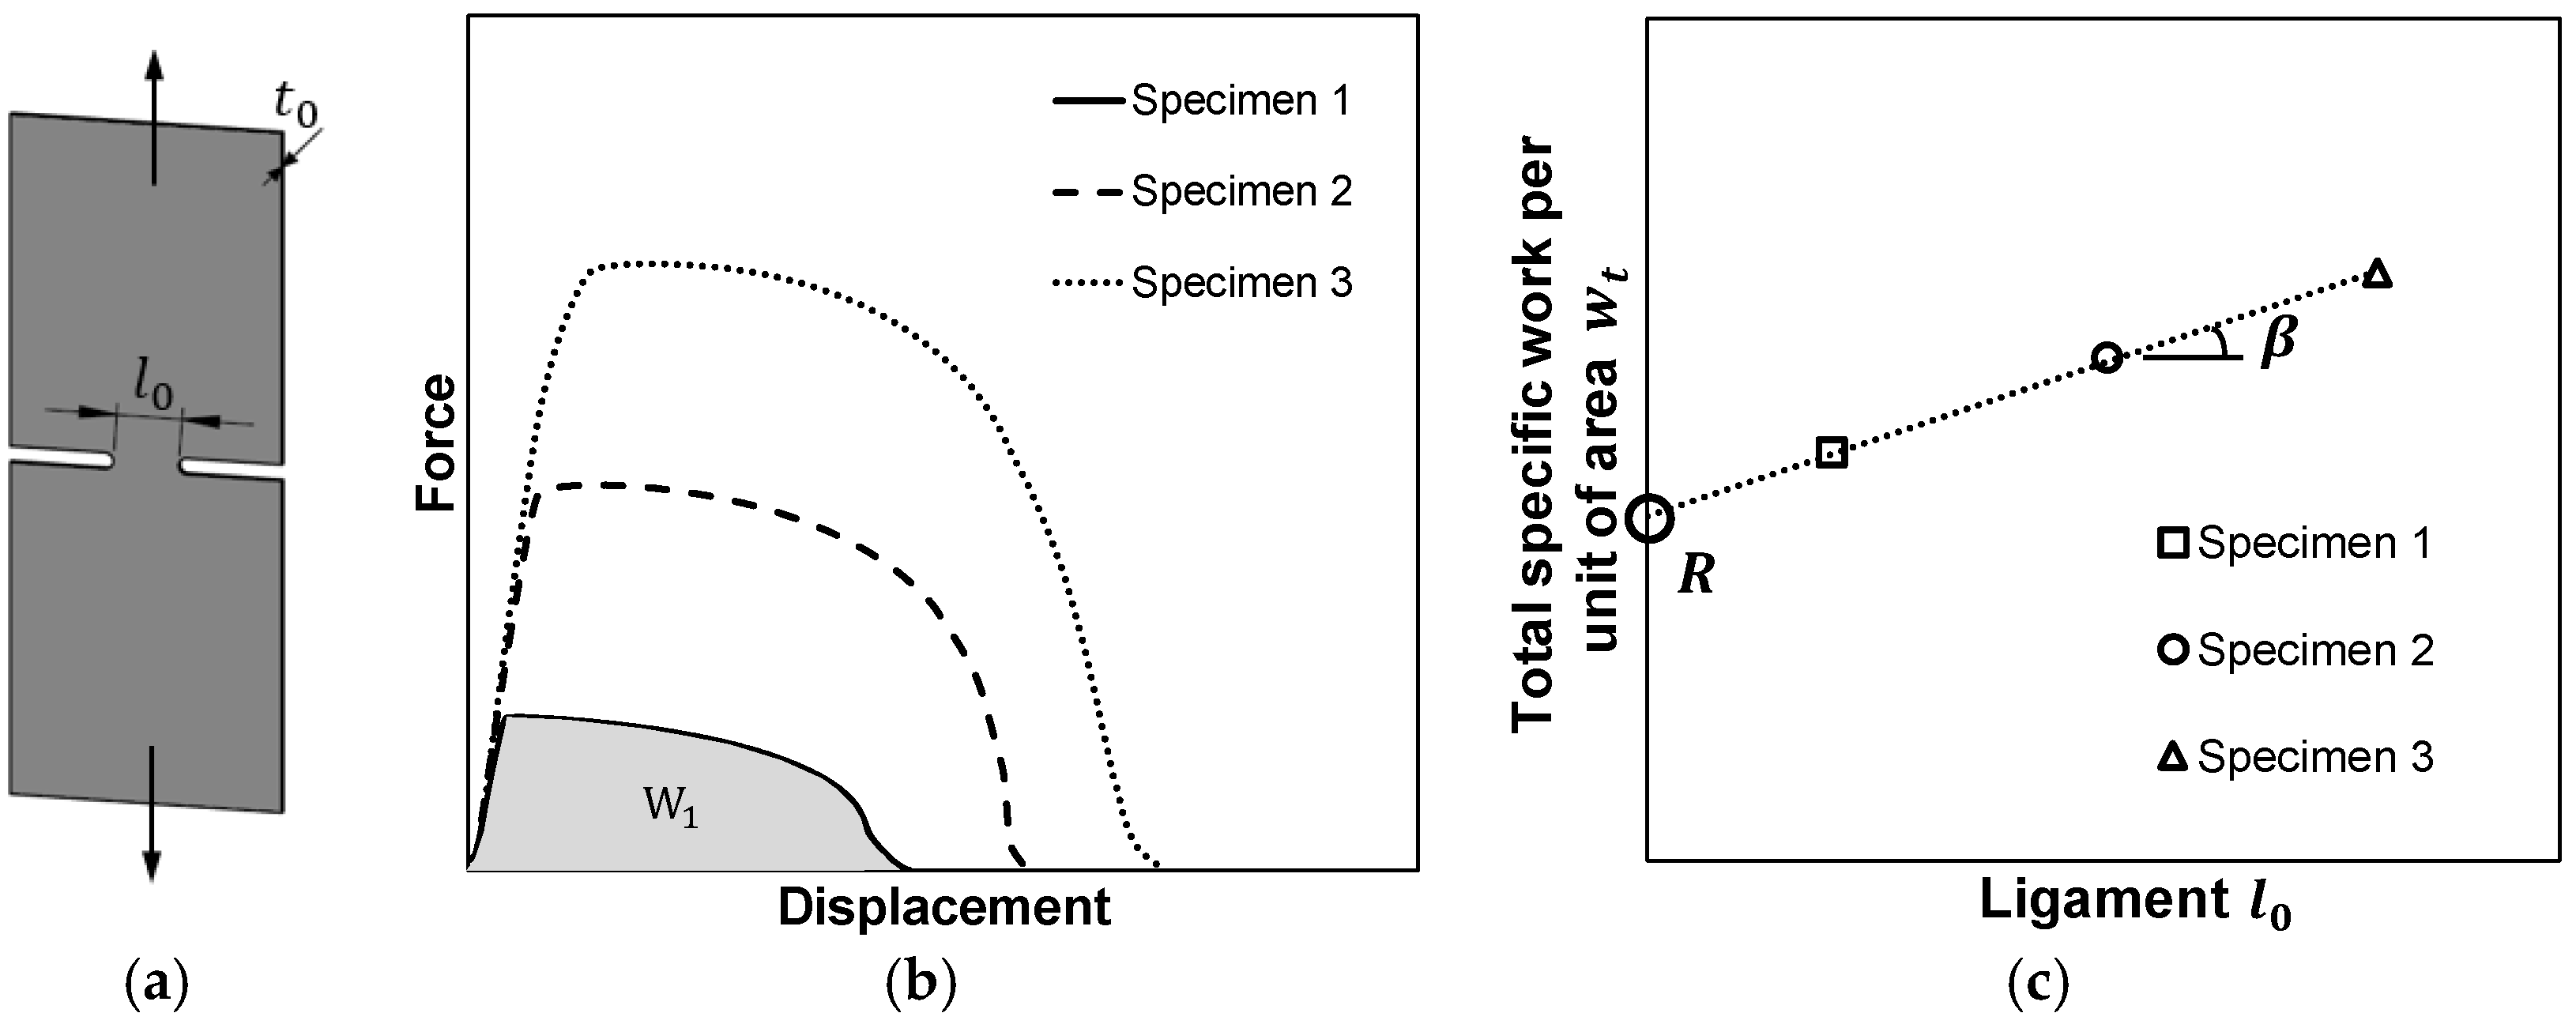
2.3. Fracture Toughness
3. Results and Discussion
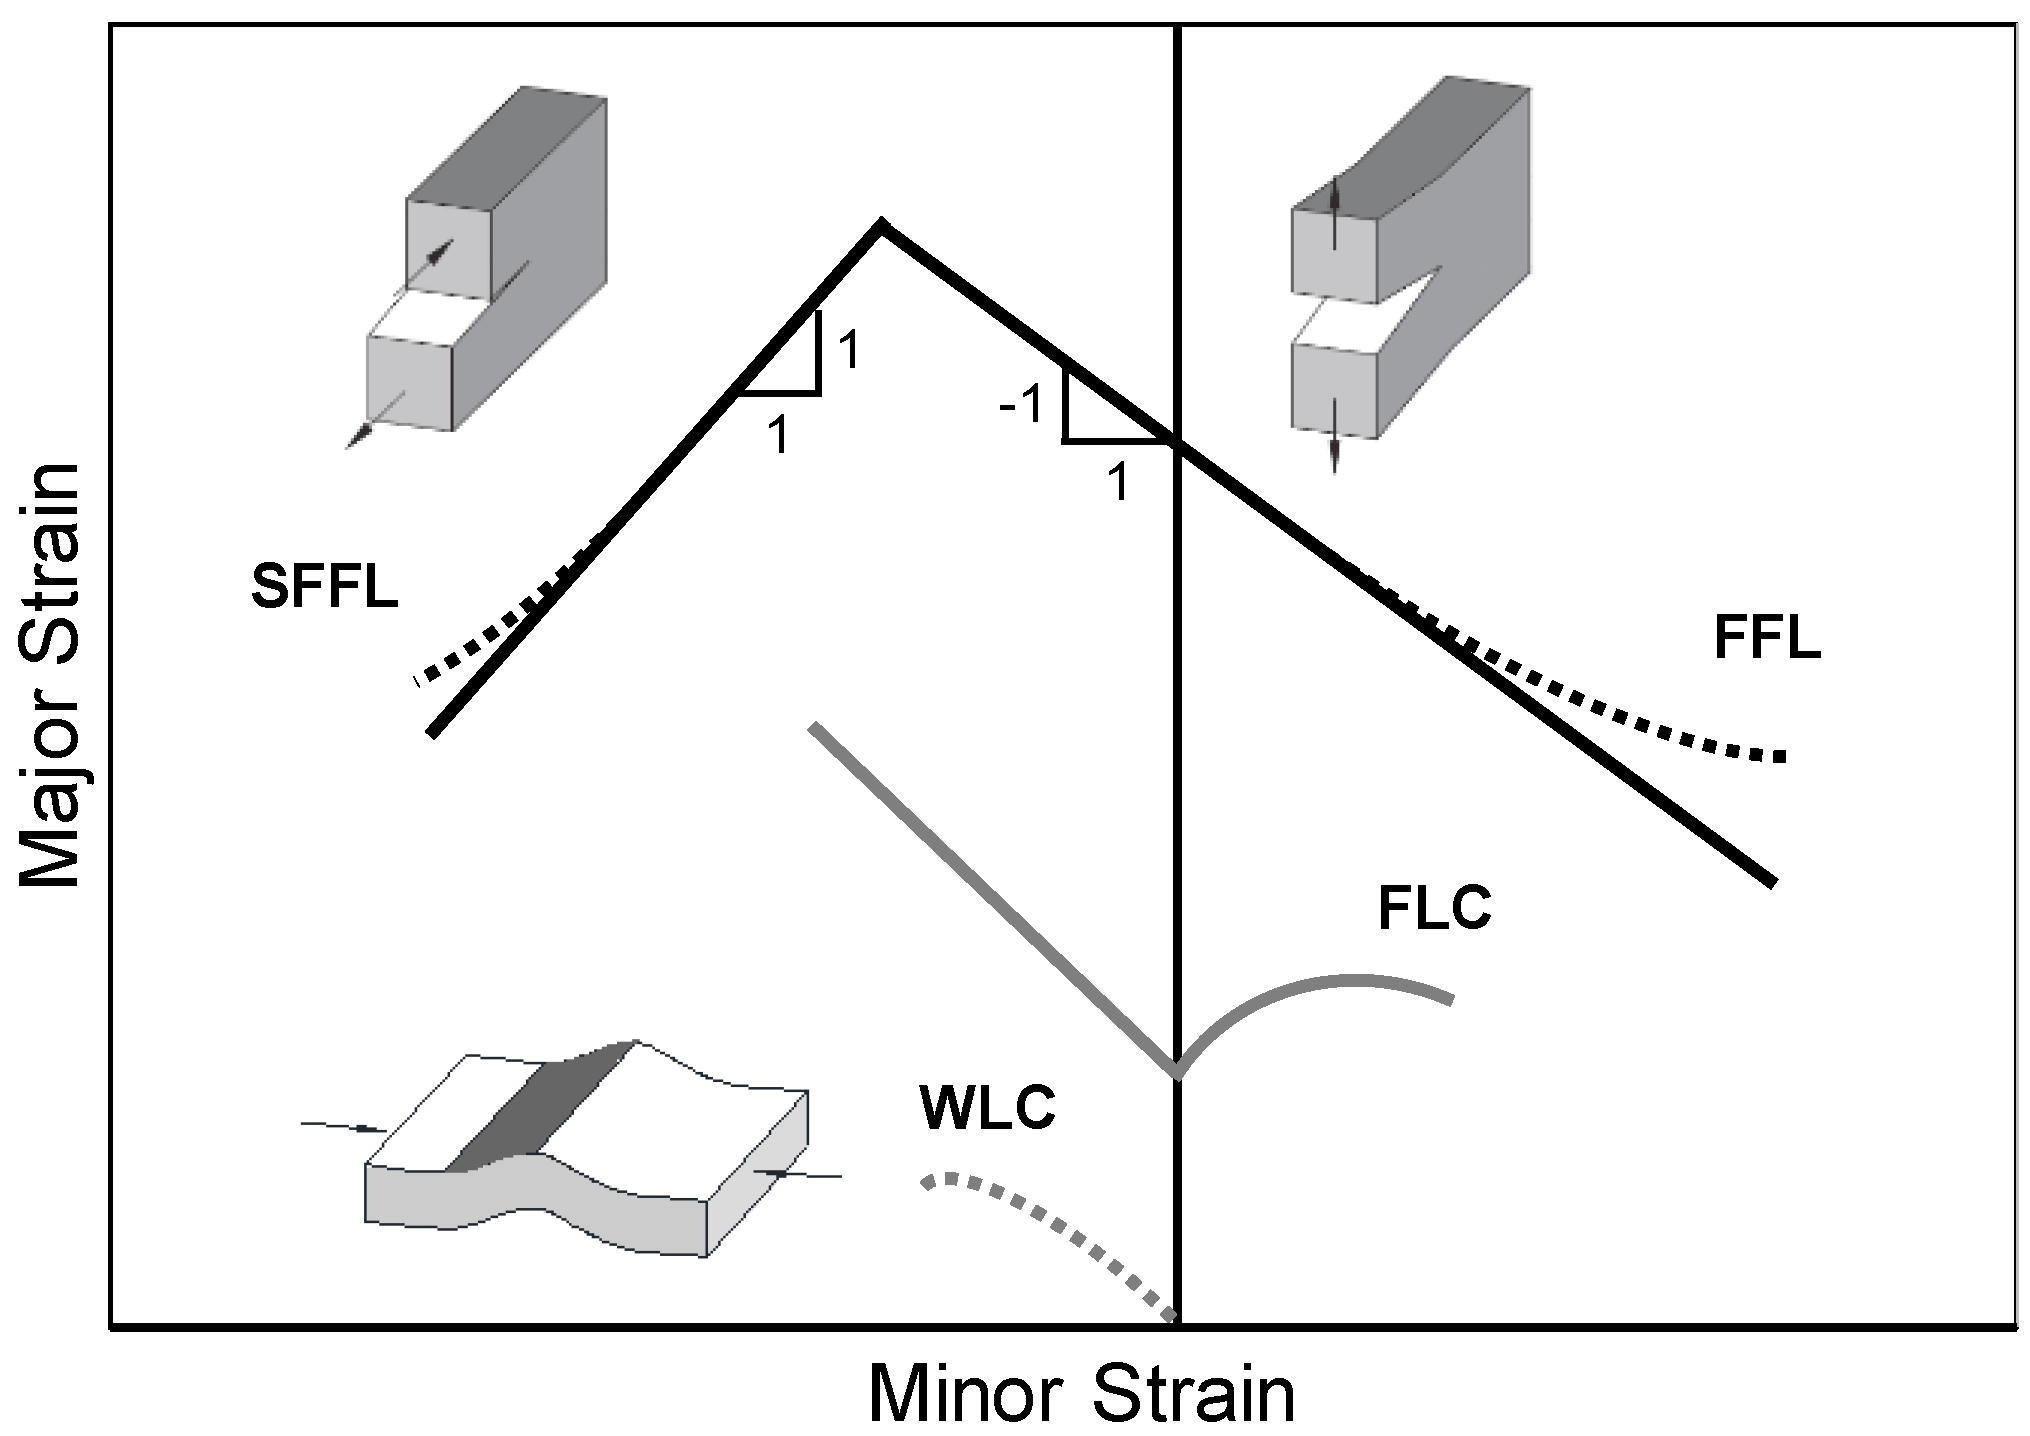
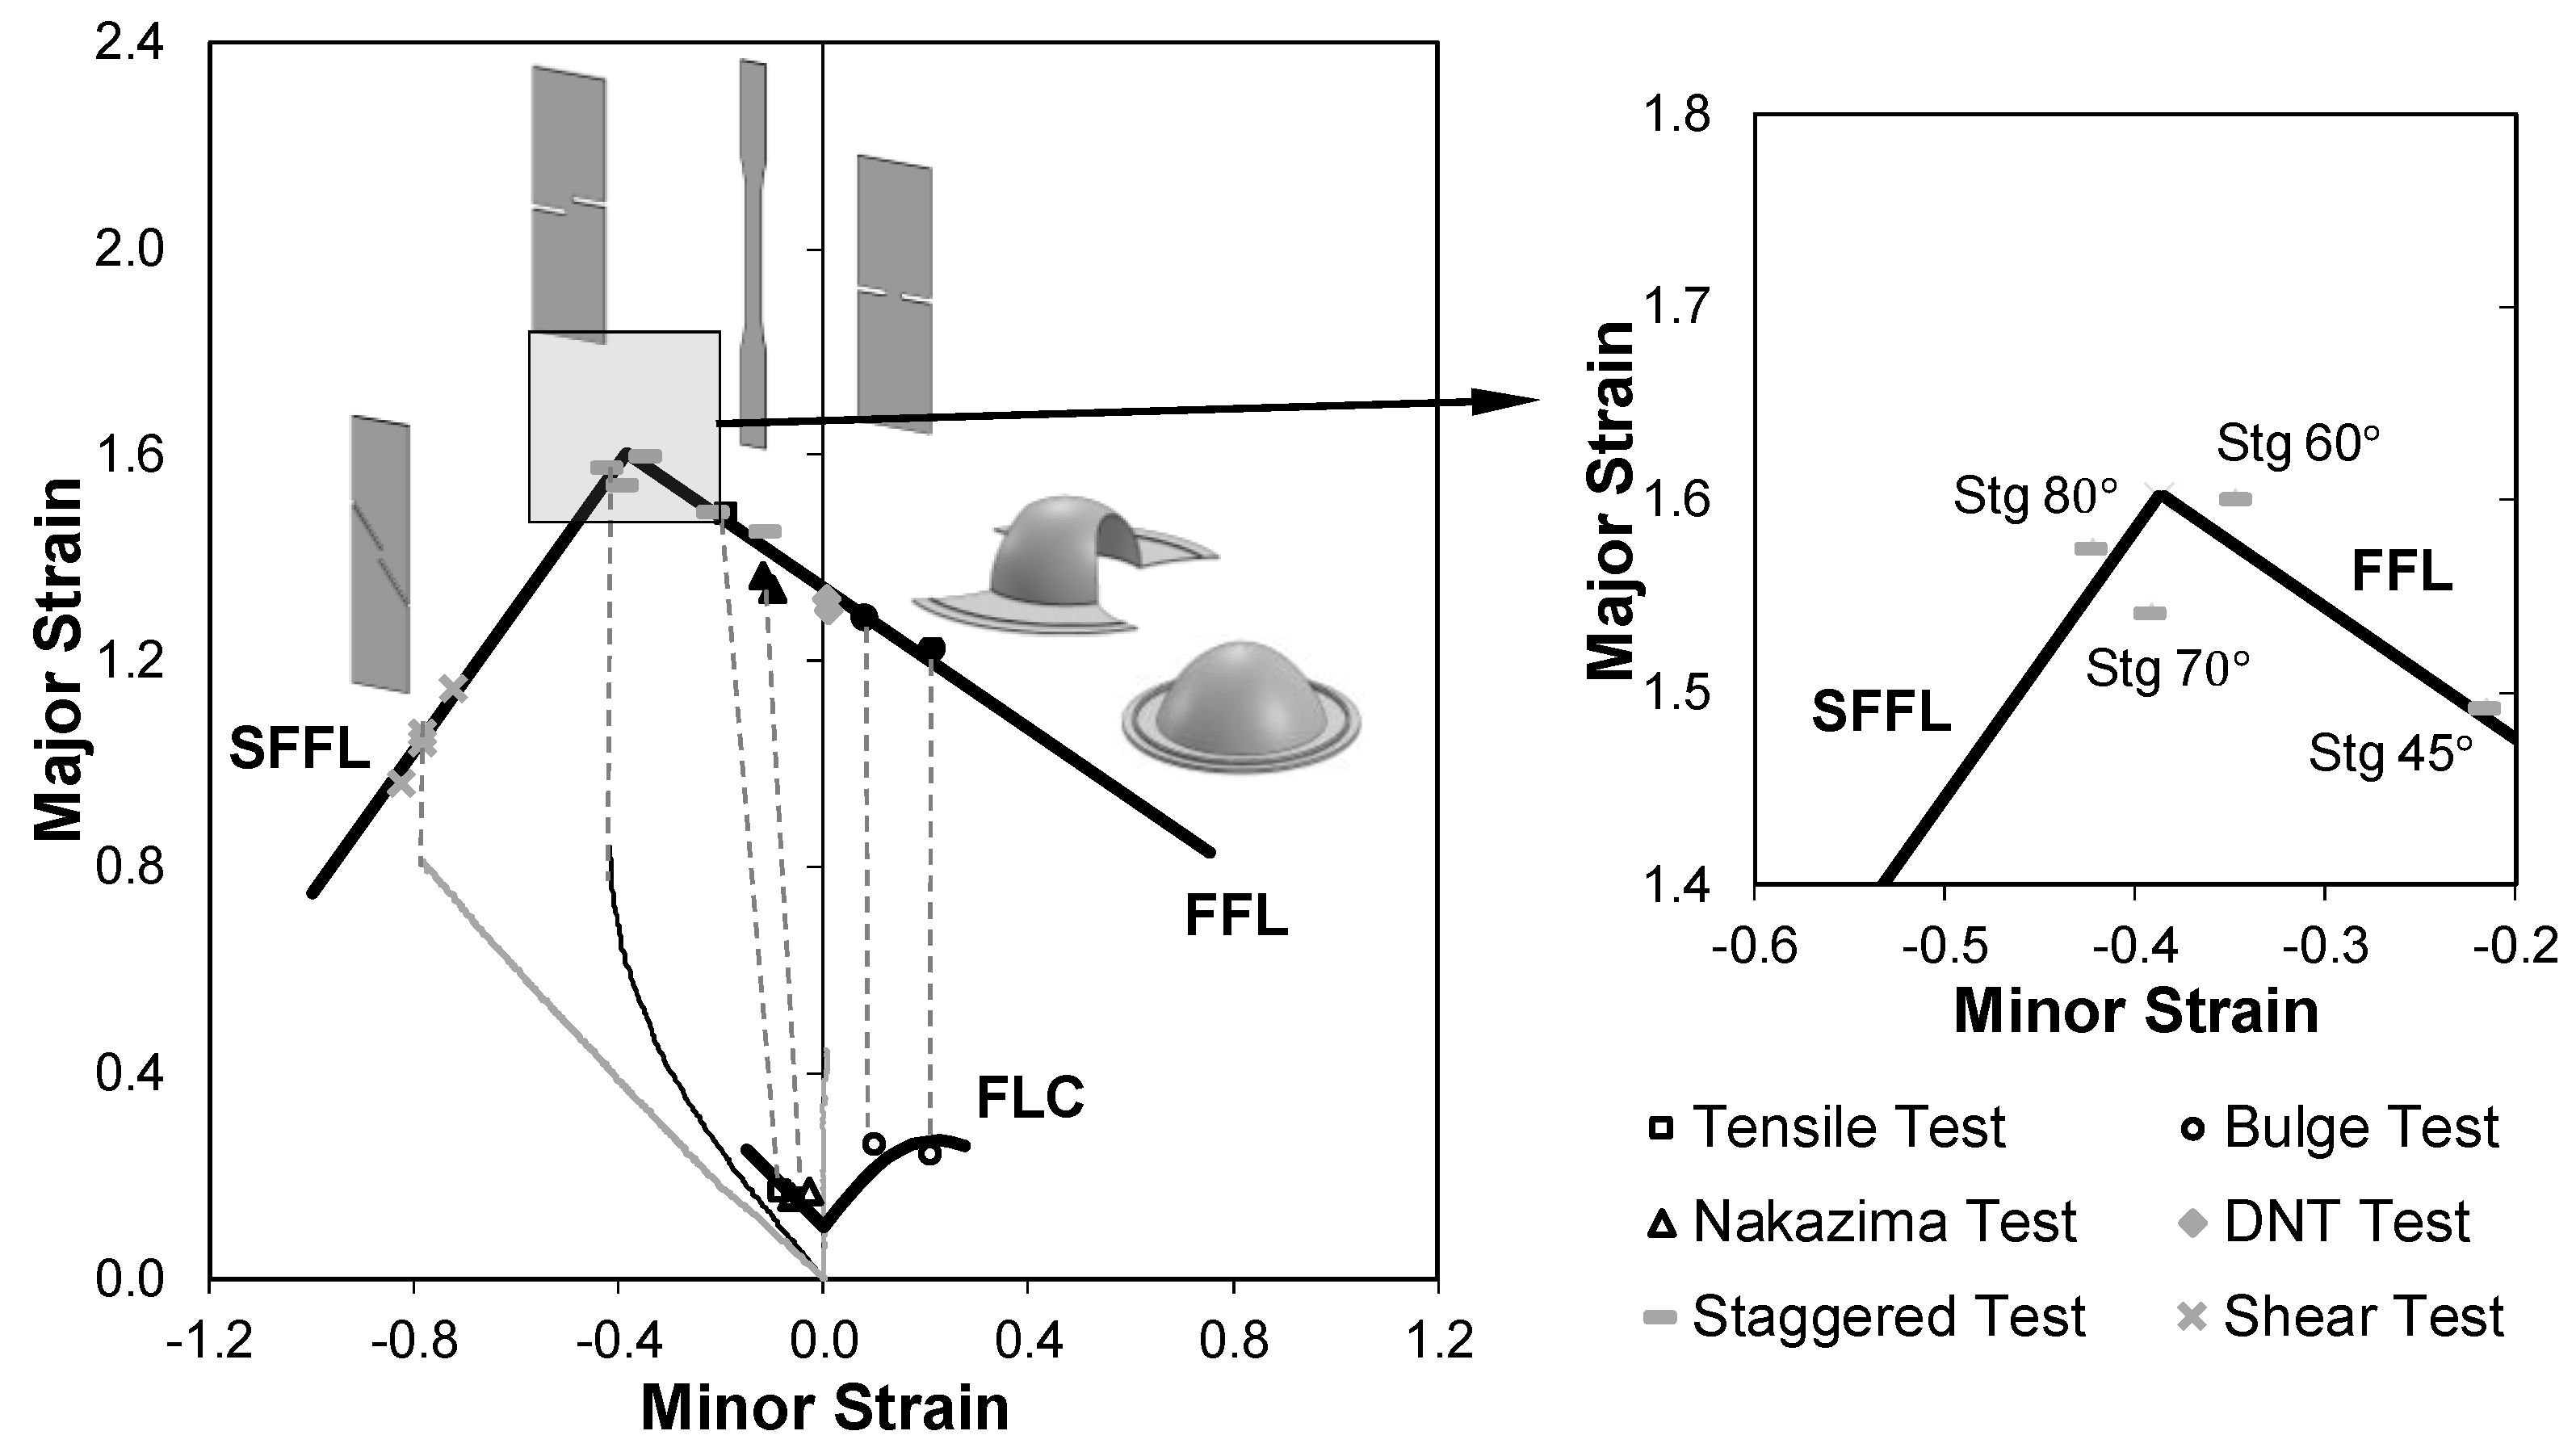
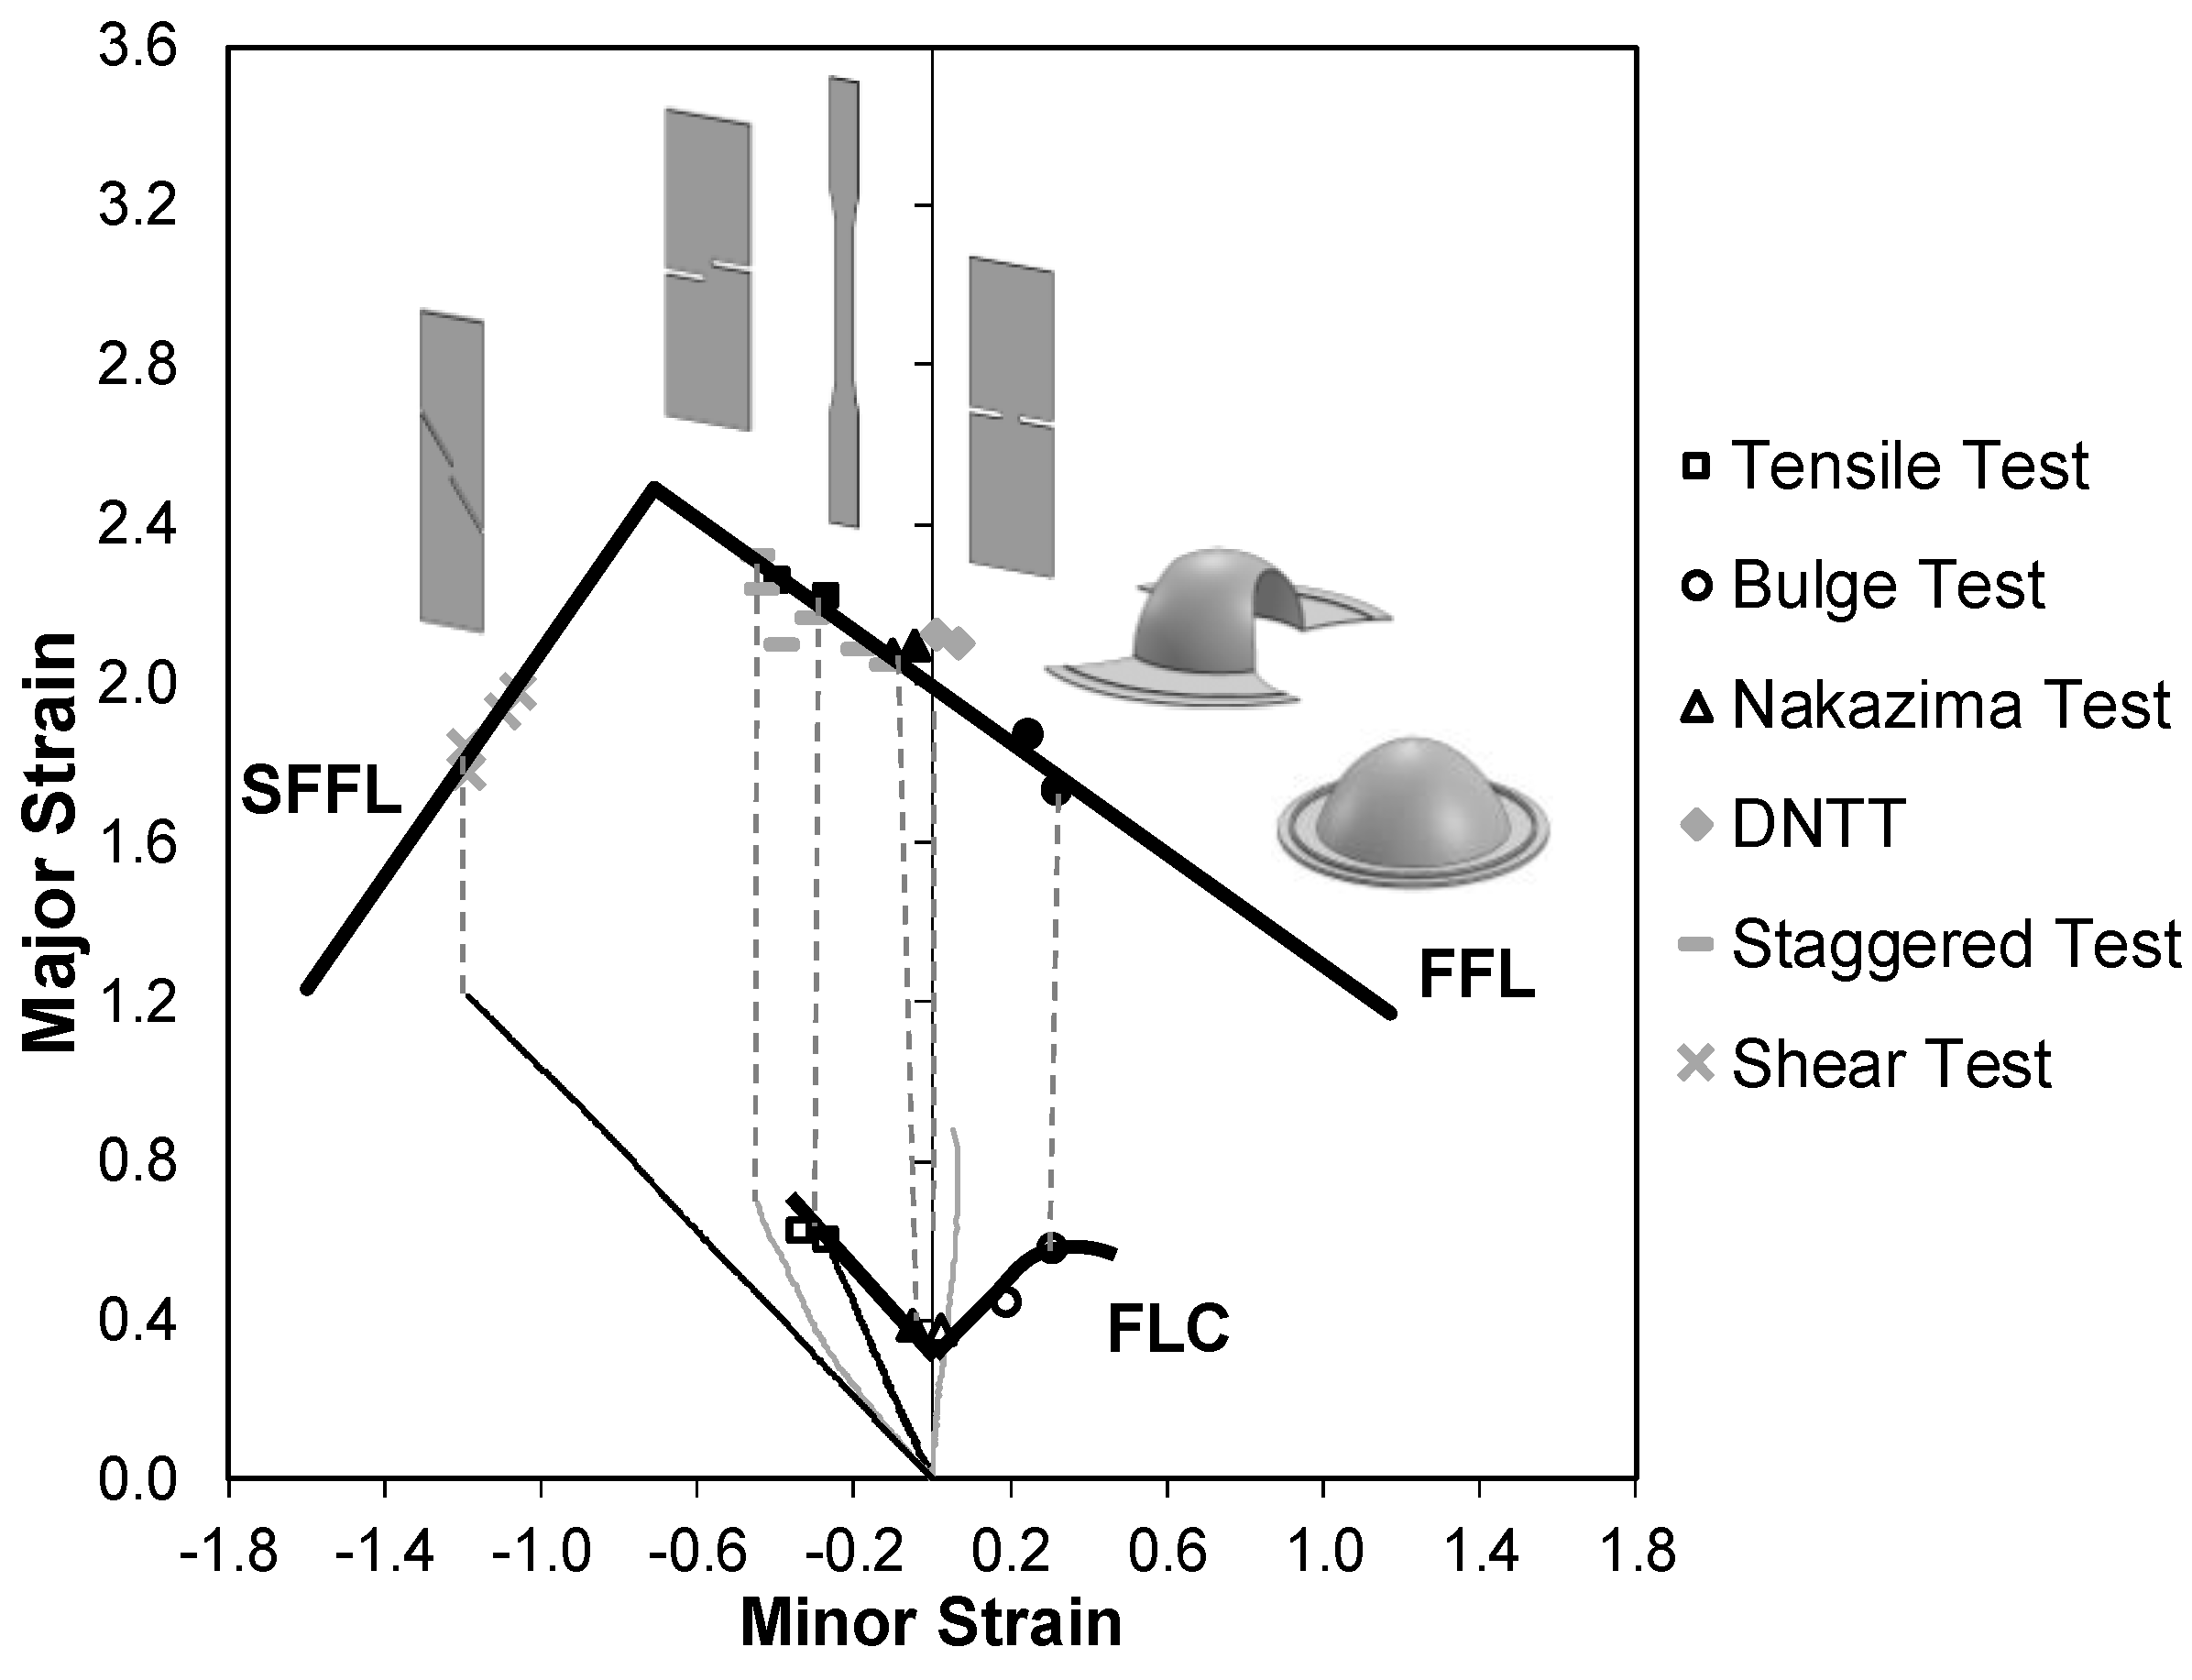
3.1. Formability Limits
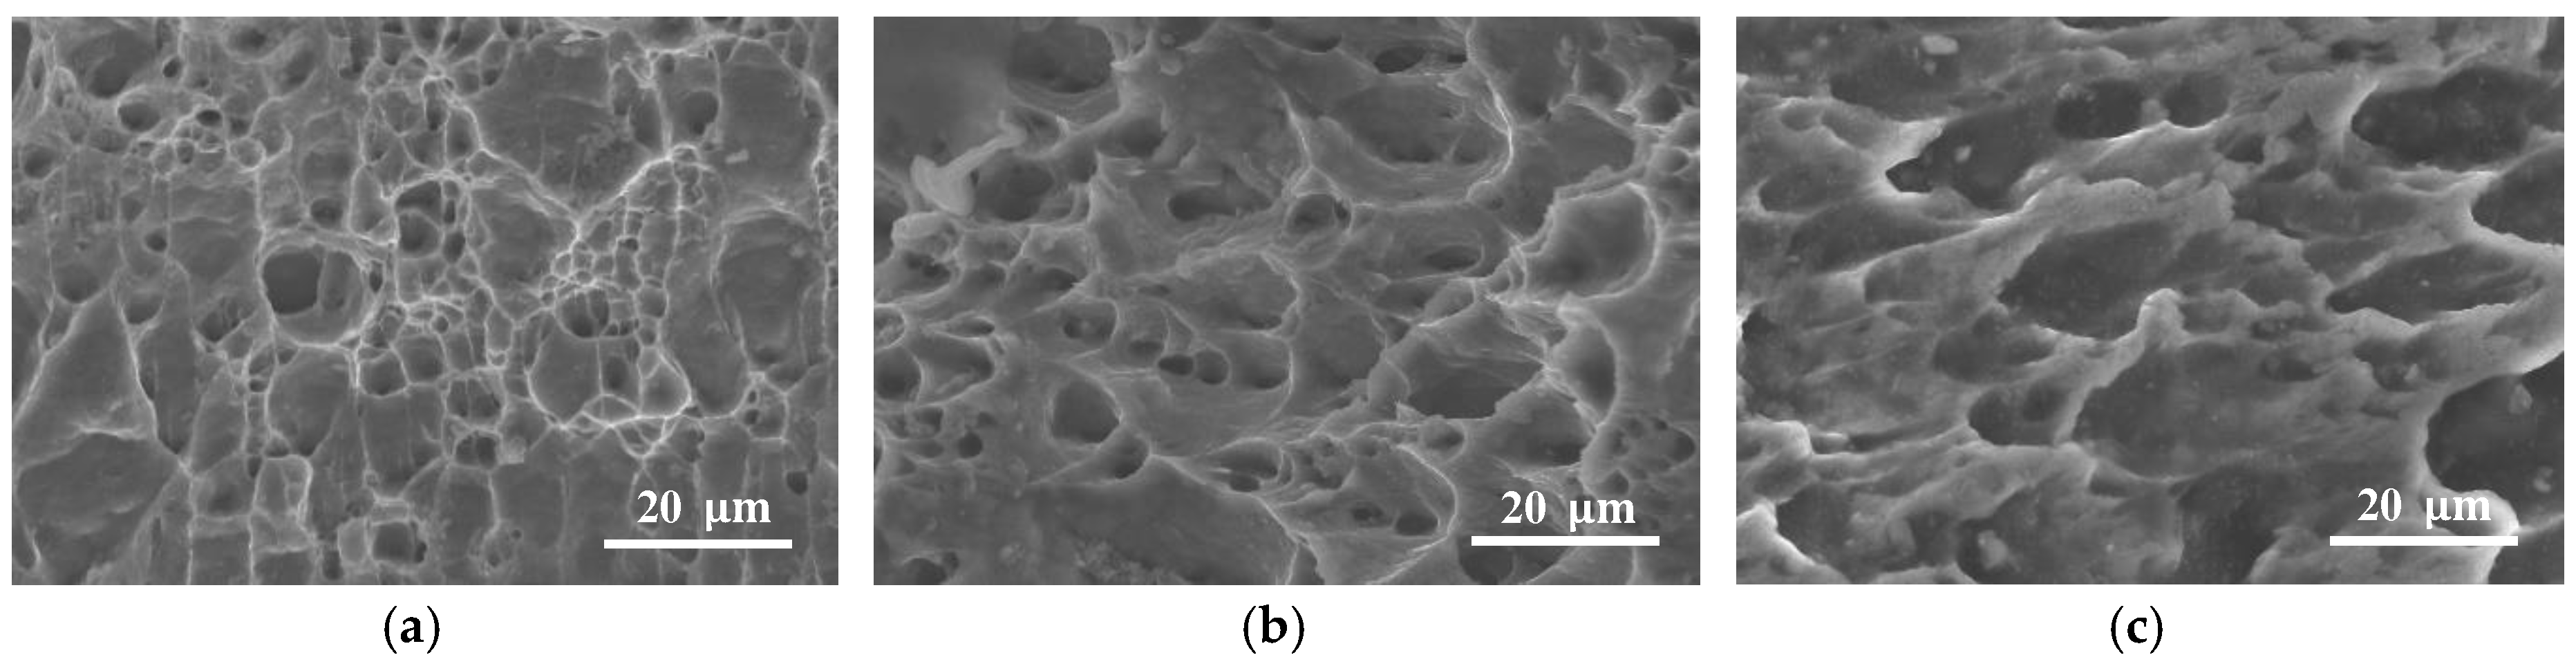
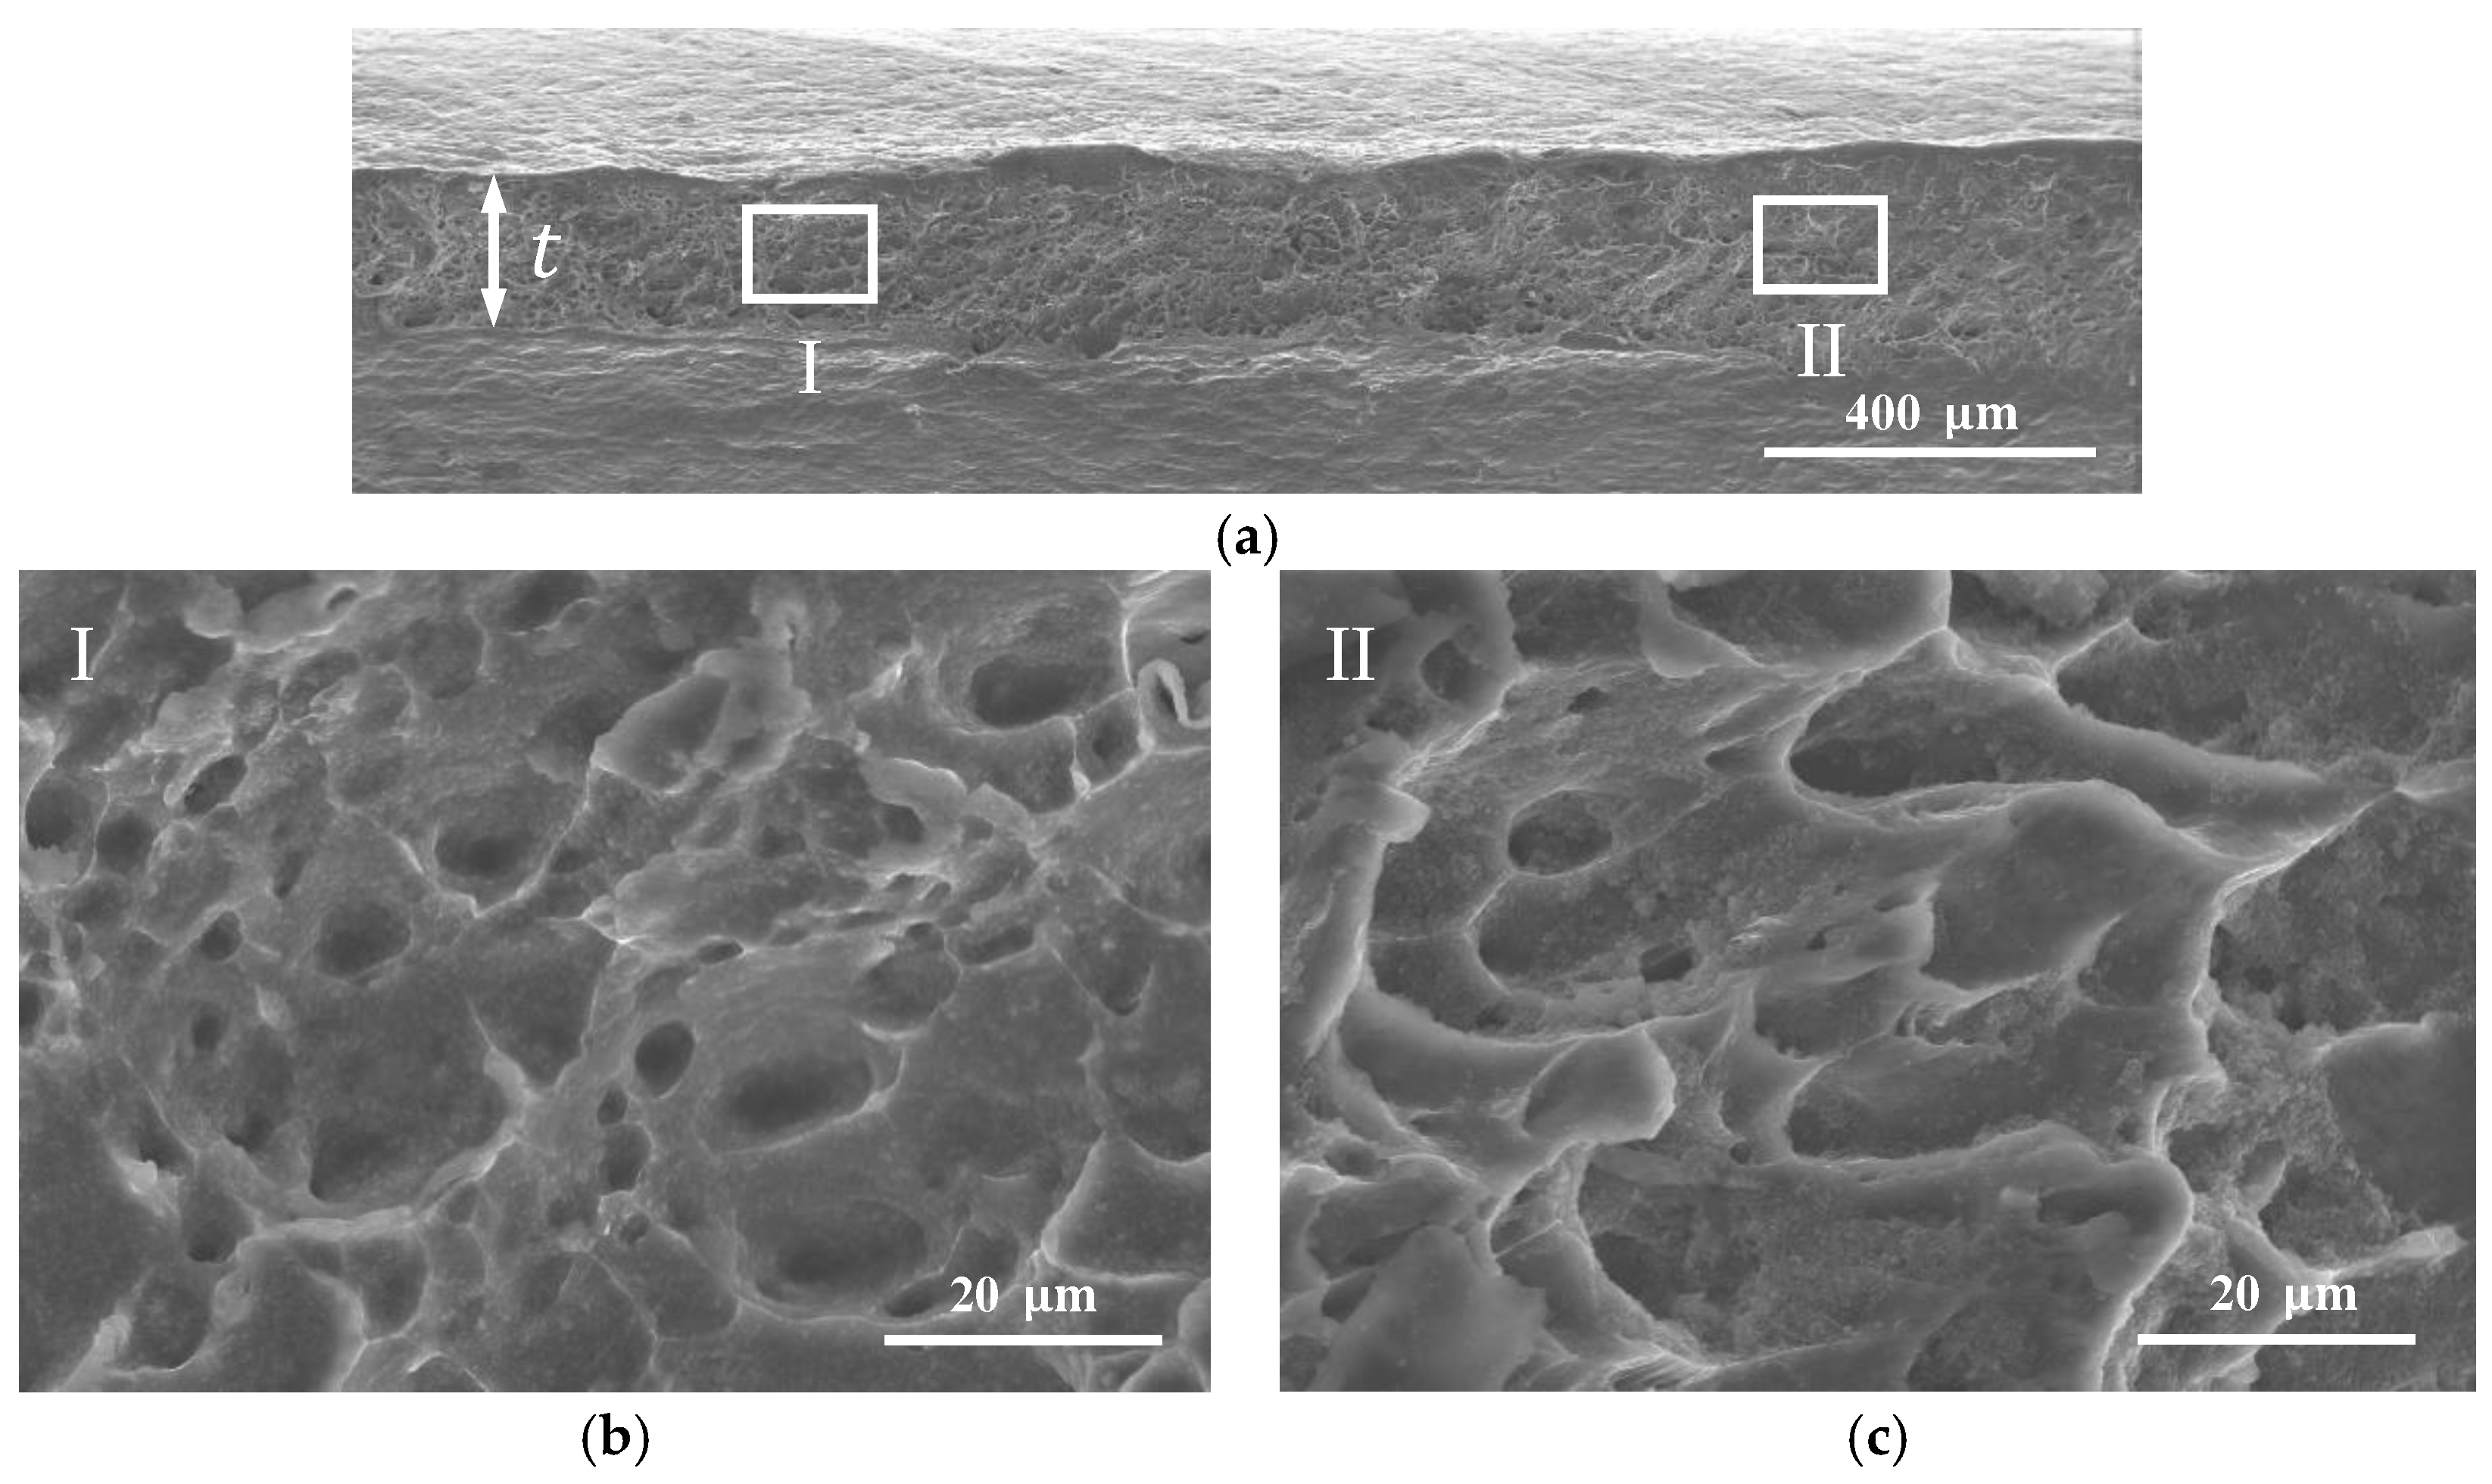
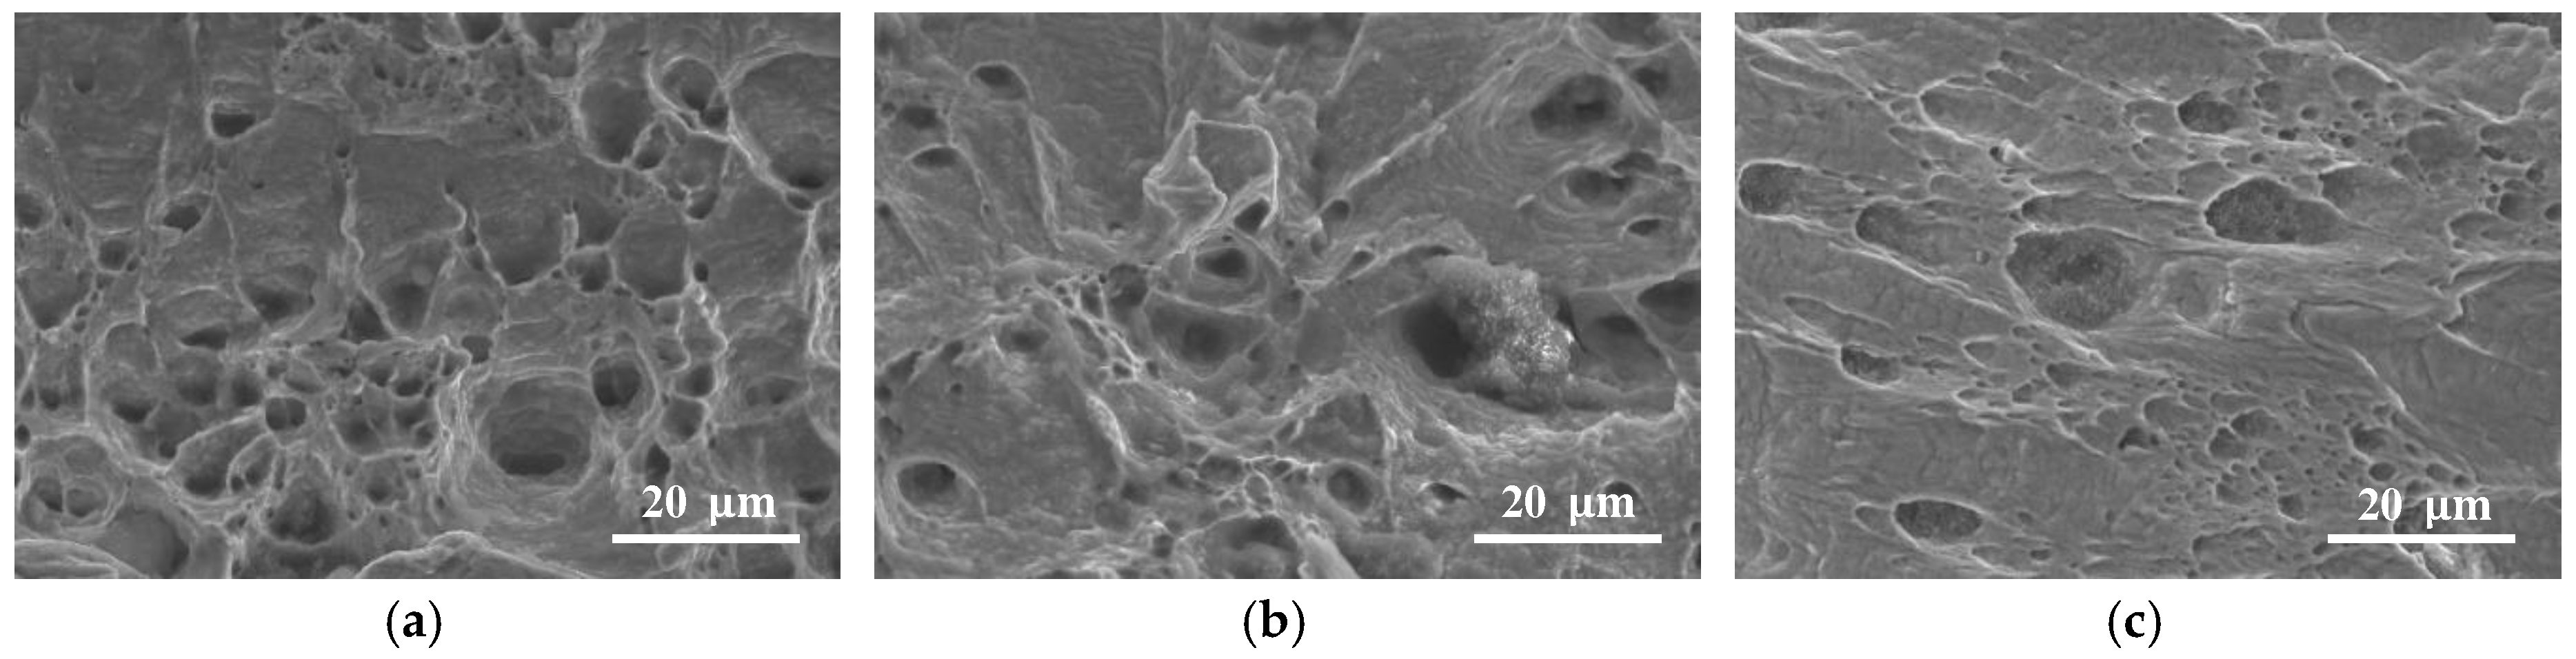
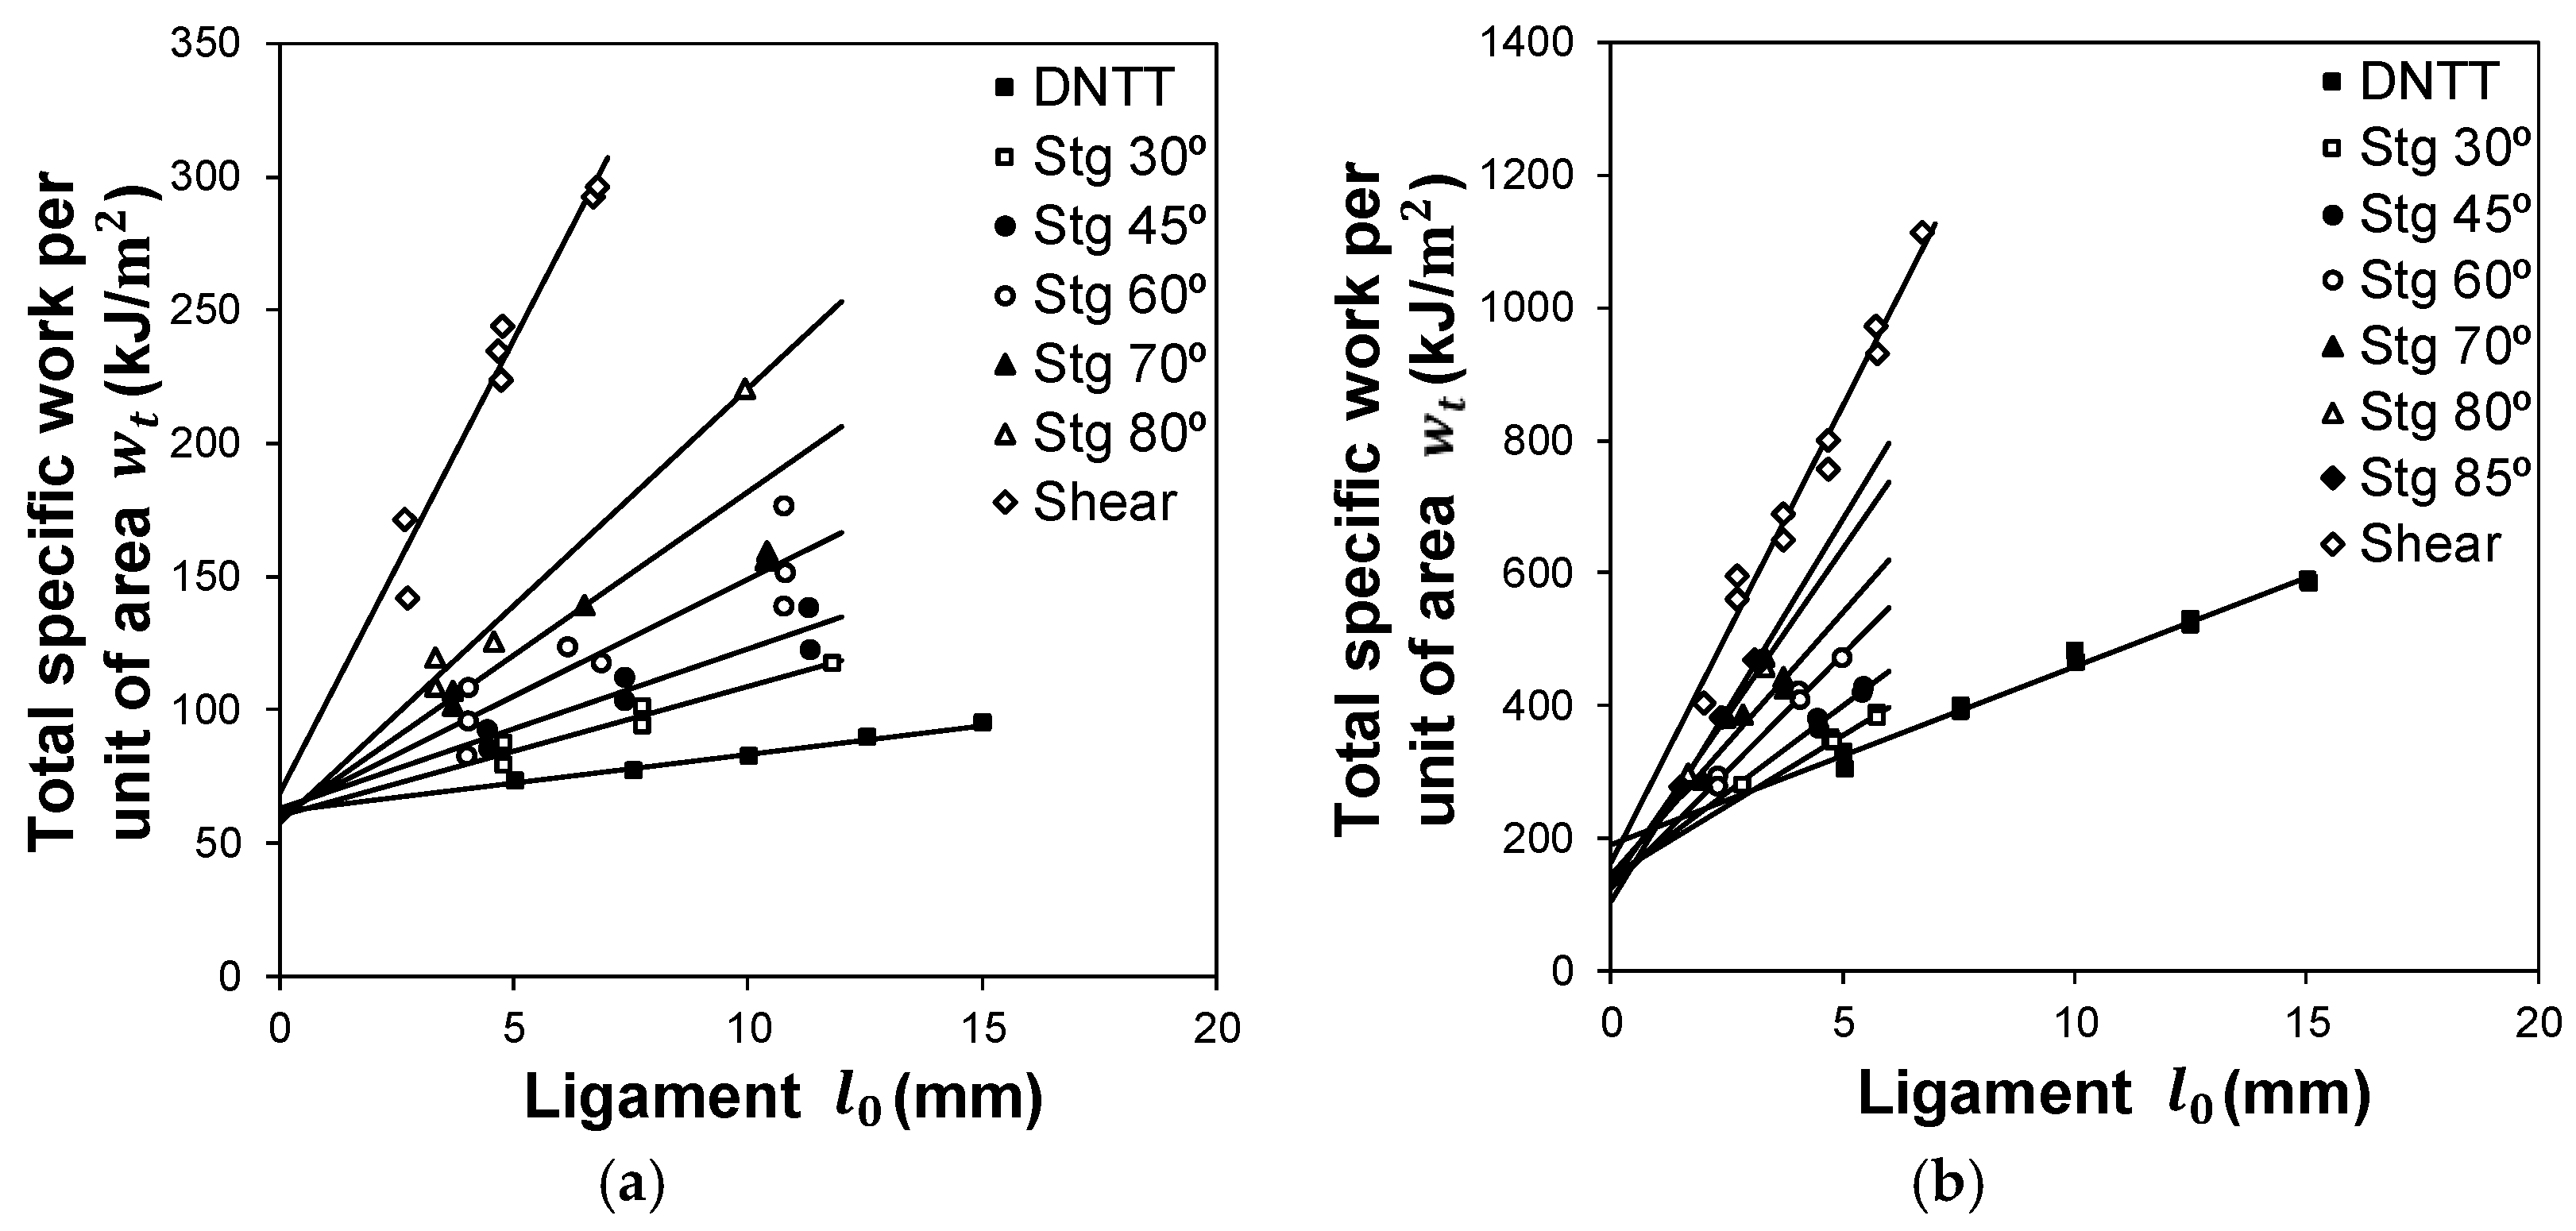
3.2. Fracture Toughness
4. Conclusions
Author Contributions
Funding
Acknowledgments
Conflicts of Interest
References
- Keeler, S.P. Circular Grid System—A Valuable Aid for Evaluating Sheet Metal Formability. SAE Tech. Pap. Ser. 1968, 371–379. [Google Scholar] [CrossRef]
- Goodwin, G.M. Application of Strain Analysis to Sheet Metal Forming Problems in the Press Shop. SAE Tech. Pap. Ser. 1968, 380–387. [Google Scholar] [CrossRef]
- Martins, P.; Bay, N.; Tekkaya, A.E.; Atkins, A.; Martins, P. Characterization of fracture loci in metal forming. Int. J. Mech. Sci. 2014, 83, 112–123. [Google Scholar] [CrossRef]
- Atkins, A.G. Fracture in forming. J. Mater. Process. Technol. 1996, 56, 609–618. [Google Scholar] [CrossRef]
- Isik, K.; Silva, M.B.; Tekkaya, A.E.; Martins, P.; Işık, K.; Martins, P. Formability limits by fracture in sheet metal forming. J. Mater. Process. Technol. 2014, 214, 1557–1565. [Google Scholar] [CrossRef]
- Magrinho, J.P.; Silva, C.M.A.; Silva, M.B.; Martins, P.A.F. Formability limits by wrinkling in sheet metal forming. Proc. Inst. Mech. Eng., Part L: J. Mater.: Des. Appl. 2018, 232, 681–692. [Google Scholar] [CrossRef]
- Centeno, G.; Martínez-Donaire, A.J.; Morales-Palma, D.; Vallellano, C.; Silva, M.B.; Martins, P.A.F. Novel experimental techniques for the determination of the forming limits at necking and fracture. In Materials Forming and Machining, 1st ed.; Davim, J.P., Ed.; Woodhead Publishing: Cambridge, UK, 2016; pp. 1–24. [Google Scholar]
- Bao, Y.; Wierzbicki, T. On fracture locus in the equivalent strain and stress triaxiality space. Int. J. Mech. Sci. 2004, 46, 81–98. [Google Scholar] [CrossRef]
- ASTM Standard B831-11. Standard Test Method for Shear Testing of Thin Aluminium Alloy Products; ASTM International: West Conshohocken, PA, USA, 2005.
- Barnwal, V.K.; Lee, S.-Y.; Kim, J.-H.; Barlat, F. Failure characteristics of advanced high strength steels at macro and micro scales. Mater. Sci. Eng. A 2019, 754, 411–427. [Google Scholar] [CrossRef]
- Atkins, T. The importance of toughness in manufacturing. J. Mater. Process. Technol. 2018, 261, 280–294. [Google Scholar] [CrossRef]
- Cotterell, B.; Reddel, J.K. The essential work of plane stress ductile fracture. Int. J. Fract. 1977, 13, 267–277. [Google Scholar]
- Cotterell, B.; Lee, E.; Mai, Y.W. Mixed mode plane stress ductile fracture. Int. J. Fract. 1982, 20, 243–250. [Google Scholar] [CrossRef] [Green Version]
- Atkins, A.K.; Mai, Y.-W. Elastic and plastic fracture: Metals, Polymers, Ceramics, Composites, Biological materials, 1st ed.; Halsted Press: Ellis Horwood, NY, USA, 1985. [Google Scholar]
- ASTM E8/E8M. Standard Test Methods for Tension Testing of Metallic Materials; ASTM International: West Conshohocken, PA, USA, 2016.
- ISO 12004-2 (2008). Metallic materials—Sheet and strip—Determination of forming-limit curves—Part 2: Determination of forming-limit curves in the laboratory; ICS: Geneva, Switzerland, 2008.
- Martínez-Donaire, A.; García-Lomas, F.; Vallellano, C. New approaches to detect the onset of localised necking in sheets under through-thickness strain gradients. Mater. Des. 2014, 57, 135–145. [Google Scholar] [CrossRef]
- Rossard, C. Mise en forme des métaux et alliages; Centre National de la Recherche Scientifique—CNRS: Paris, France, 1976. (In French) [Google Scholar]
- Madeira, T.; Silva, C.M.A.; Silva, M.B.; Martins, P.A.F. Failure in single point incremental forming. Int. J. Adv. Manuf. Technol. 2015, 80, 1471–1479. [Google Scholar] [CrossRef]
- Gerke, S.; Zistl, M.; Bhardwaj, A.; Brünig, M. Experiments with the X0-specimen on the effect of non-proportional loading paths on damage and fracture mechanisms in aluminum alloys. Int. J. Solids Struct. 2019, 163, 157–169. [Google Scholar] [CrossRef]
- Mai, Y.-W. On the plane-stress essential fracture work in plastic failure of ductile materials. Int. J. Mech. Sci. 1993, 35, 995–1005. [Google Scholar] [CrossRef]


| Material | Chemical Composition, wt.% | |||||||||
|---|---|---|---|---|---|---|---|---|---|---|
| AA1050-H111 | 0.40 Fe | 0.07 Zn | 0.05 Cr | 0.05 Cu | 0.05 Mg | 0.05 Mn | 0.05 Ni | 0.05 Ti | 0.25 Si | remnant Al |
| Copper | 0.0005 Bi | 0.04 O | 0.005 Pb | remnant Cu | ||||||
| AA1050-H111 | Copper |
|---|---|
| Material | ||||||
|---|---|---|---|---|---|---|
| AA1050-H111 | 0° RD | 72.7 ± 2.6 | 115.4 ± 0.4 | 119.0 ± 3.8 | 7.1 ± 2.1 | 0.71 ± 0.06 |
| 45° RD | 67.9 | 120.4 ± 0.9 | 121.2 ± 0.5 | 5.2 ± 1.2 | 0.88 ± 0.10 | |
| 90° RD | 71.8 ± 1.8 | 123.0 ± 3.6 | 120.8 ± 2.1 | 5.6 ± 1.8 | 0.87 ± 0.09 | |
| Average | 70.0 ± 7.3 | 119.9 ± 4.9 | 120.5 ± 6.4 | 6.8 ± 5.1 | 0.84 ± 0.25 | |
| Copper | 0° RD | 119.3 ± 4.3 | 131.2 ± 1.8 | 245.5 ± 1.0 | 34.4 ± 4.7 | 0.76 ± 0.08 |
| 45° RD | 115.1 ± 1.4 | 133.2 ± 1.5 | 236.2 ± 2.1 | 35.0 ± 3.3 | 1.09 ± 0.07 | |
| 90° RD | 140.0.9 | 141.3 ± 0.6 | 238.5 ± 1.1 | 36.3 ± 3.1 | 0.90 ± 0.06 | |
| Average | 122.4 ± 10.6 | 134.7 ± 3.9 | 239.1 ± 4.2 | 35.2 ± 11.1 | 0.96 ± 0.21 |
| Test | Dimensions (mm) | State of Stress | State of Strain | |
|---|---|---|---|---|
| Tensile |  | |||
| Hydraulic bulge | 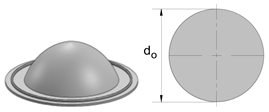 | |||
| Nakajima | 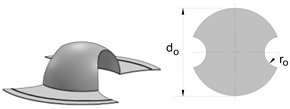 | |||
| Double Notched Tension (DNTT) | 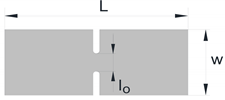 | |||
| Staggered DNTT |  | |||
| Shear | 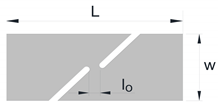 | |||
| AA1050-H111 | Copper | |
|---|---|---|
| FFL | ||
| SFFL |
| Test | AA1050-H111 R (kJ/m2) | Copper R (kJ/m2) |
|---|---|---|
| DNTT | ||
| Staggered 30° | ||
| Staggered 45° | ||
| Staggered 60° | ||
| Staggered 70° | ||
| Staggered 80° | ||
| Staggered 85° | - | |
| Shear |
© 2019 by the authors. Licensee MDPI, Basel, Switzerland. This article is an open access article distributed under the terms and conditions of the Creative Commons Attribution (CC BY) license (http://creativecommons.org/licenses/by/4.0/).
Share and Cite
Magrinho, J.P.; Silva, M.B.; Reis, L.; Martins, P.A.F. Formability Limits, Fractography and Fracture Toughness in Sheet Metal Forming. Materials 2019, 12, 1493. https://doi.org/10.3390/ma12091493
Magrinho JP, Silva MB, Reis L, Martins PAF. Formability Limits, Fractography and Fracture Toughness in Sheet Metal Forming. Materials. 2019; 12(9):1493. https://doi.org/10.3390/ma12091493
Chicago/Turabian StyleMagrinho, João P., Maria Beatriz Silva, Luís Reis, and Paulo A. F. Martins. 2019. "Formability Limits, Fractography and Fracture Toughness in Sheet Metal Forming" Materials 12, no. 9: 1493. https://doi.org/10.3390/ma12091493
APA StyleMagrinho, J. P., Silva, M. B., Reis, L., & Martins, P. A. F. (2019). Formability Limits, Fractography and Fracture Toughness in Sheet Metal Forming. Materials, 12(9), 1493. https://doi.org/10.3390/ma12091493