Mapping the Tray of Electron Beam Melting of Ti-6Al-4V: Properties and Microstructure

Abstract
:
1. Introduction
HIP as a Post-Process for Additively Manufactured End Products
2. Experimental
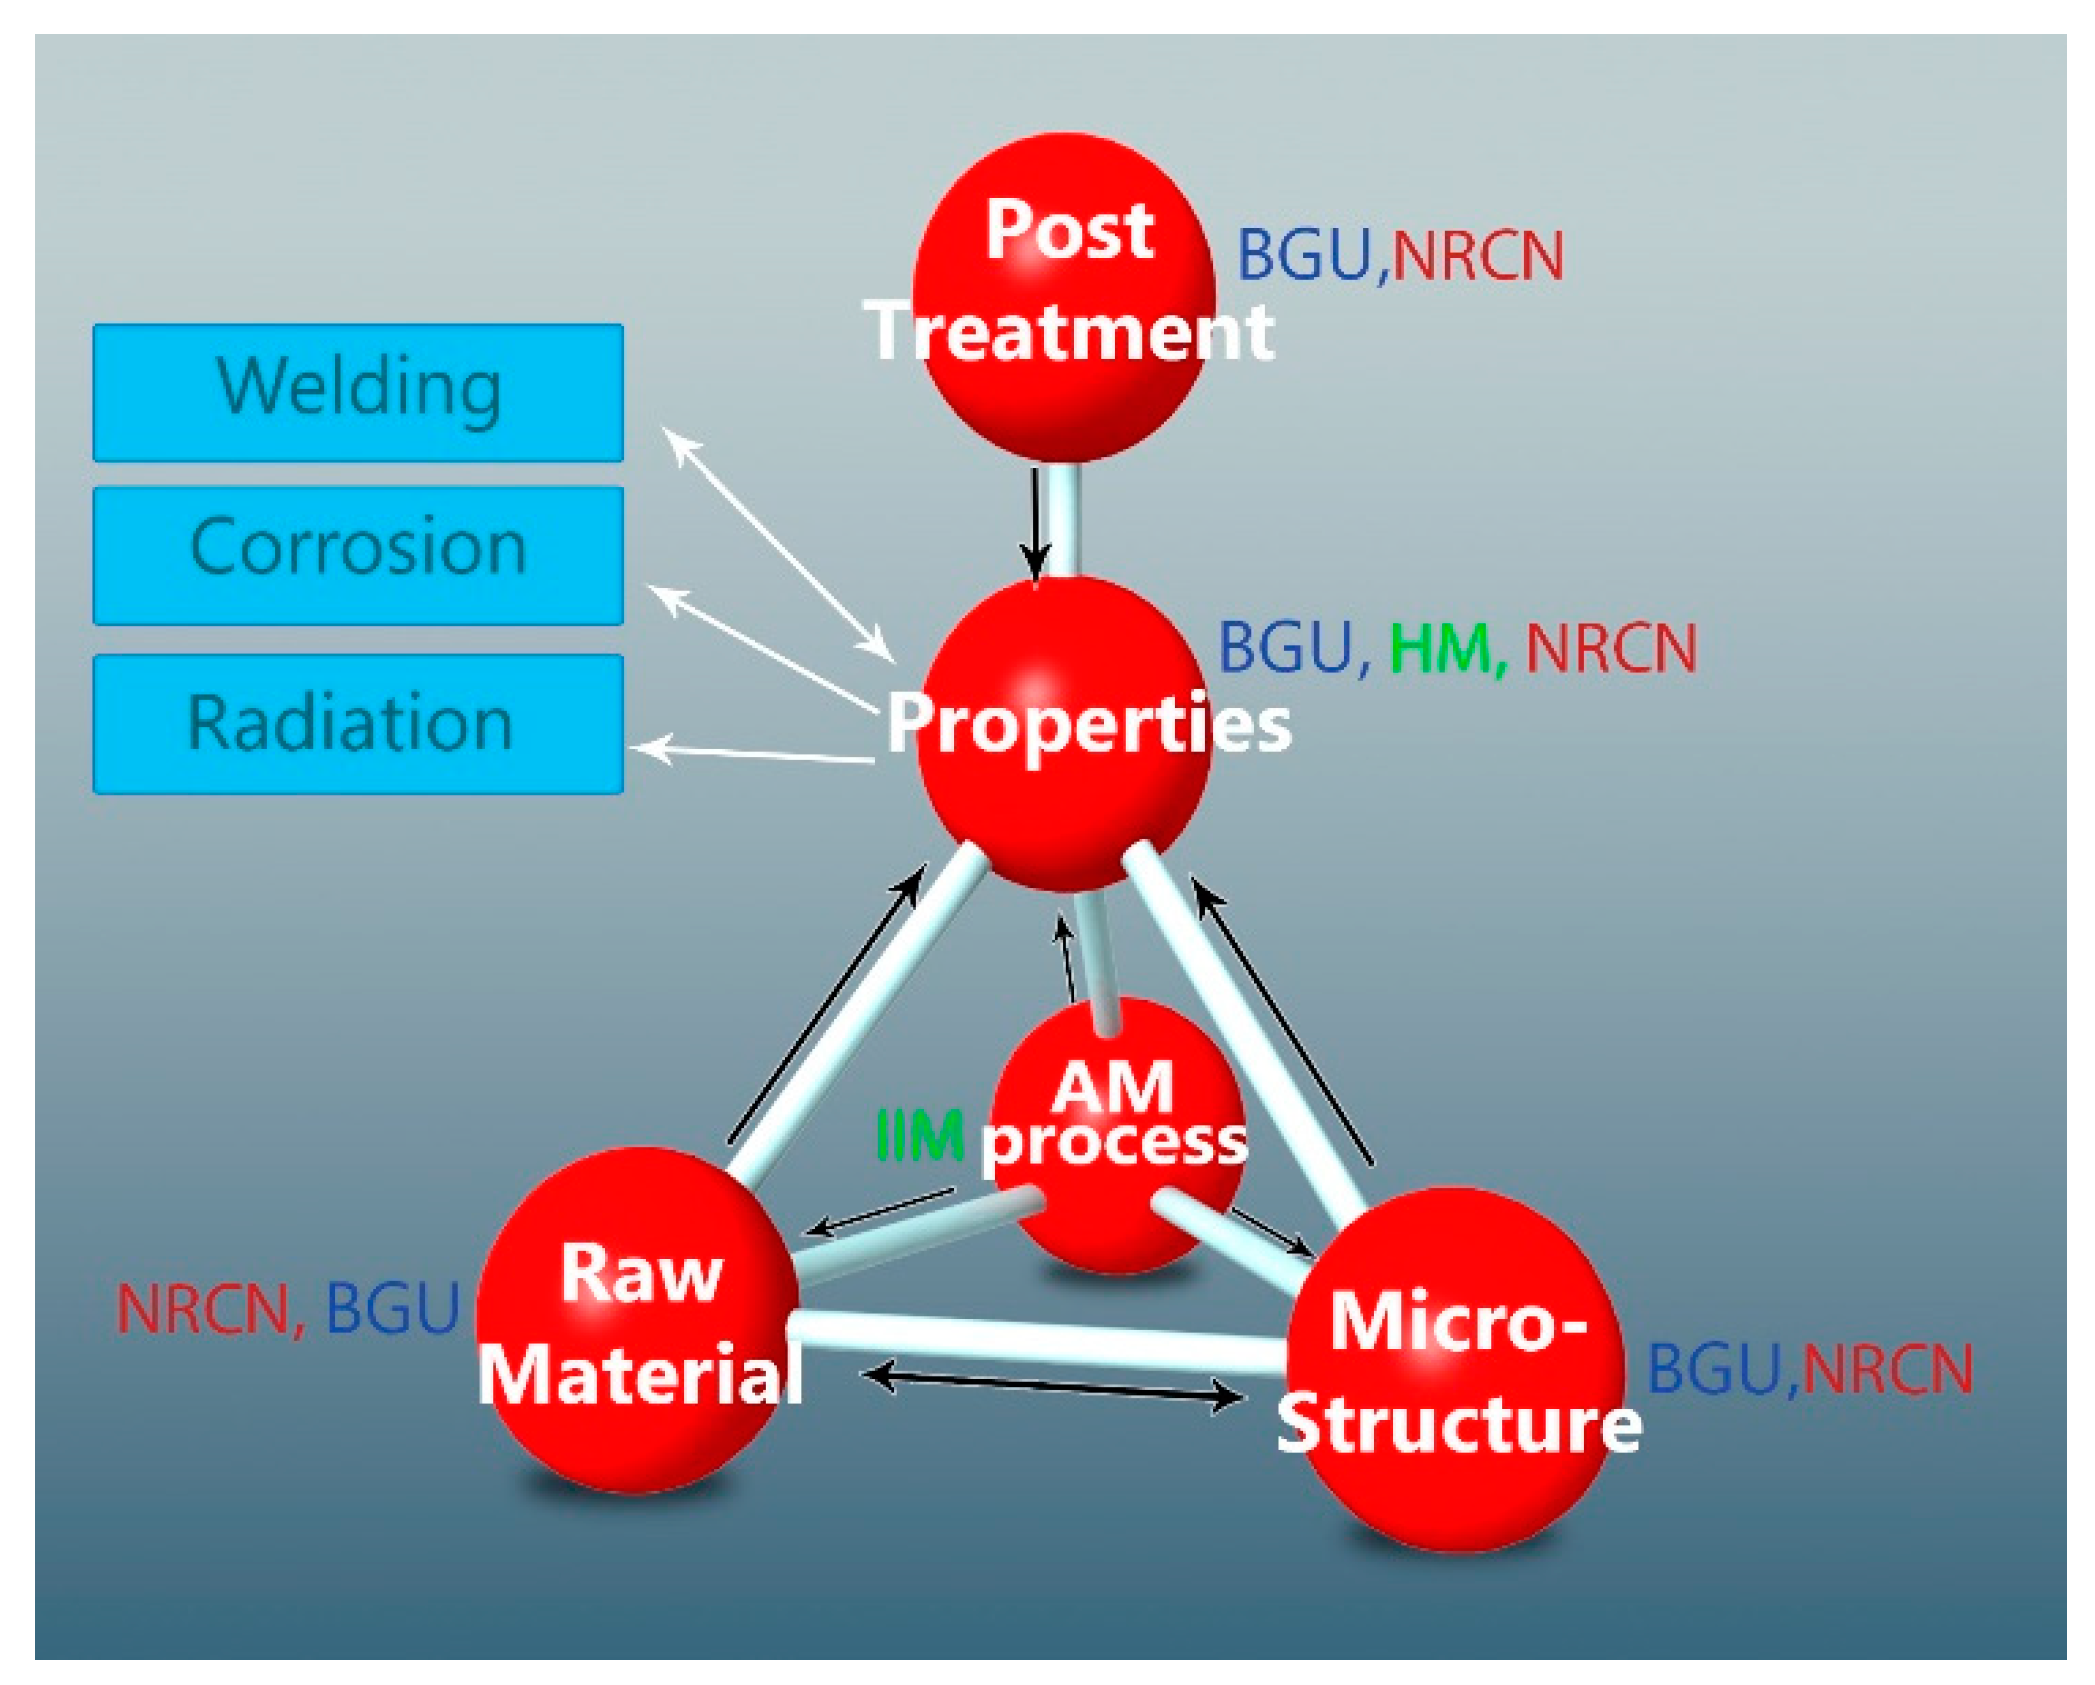
2.1. Research Methodology
2.2. Powder Characteristics
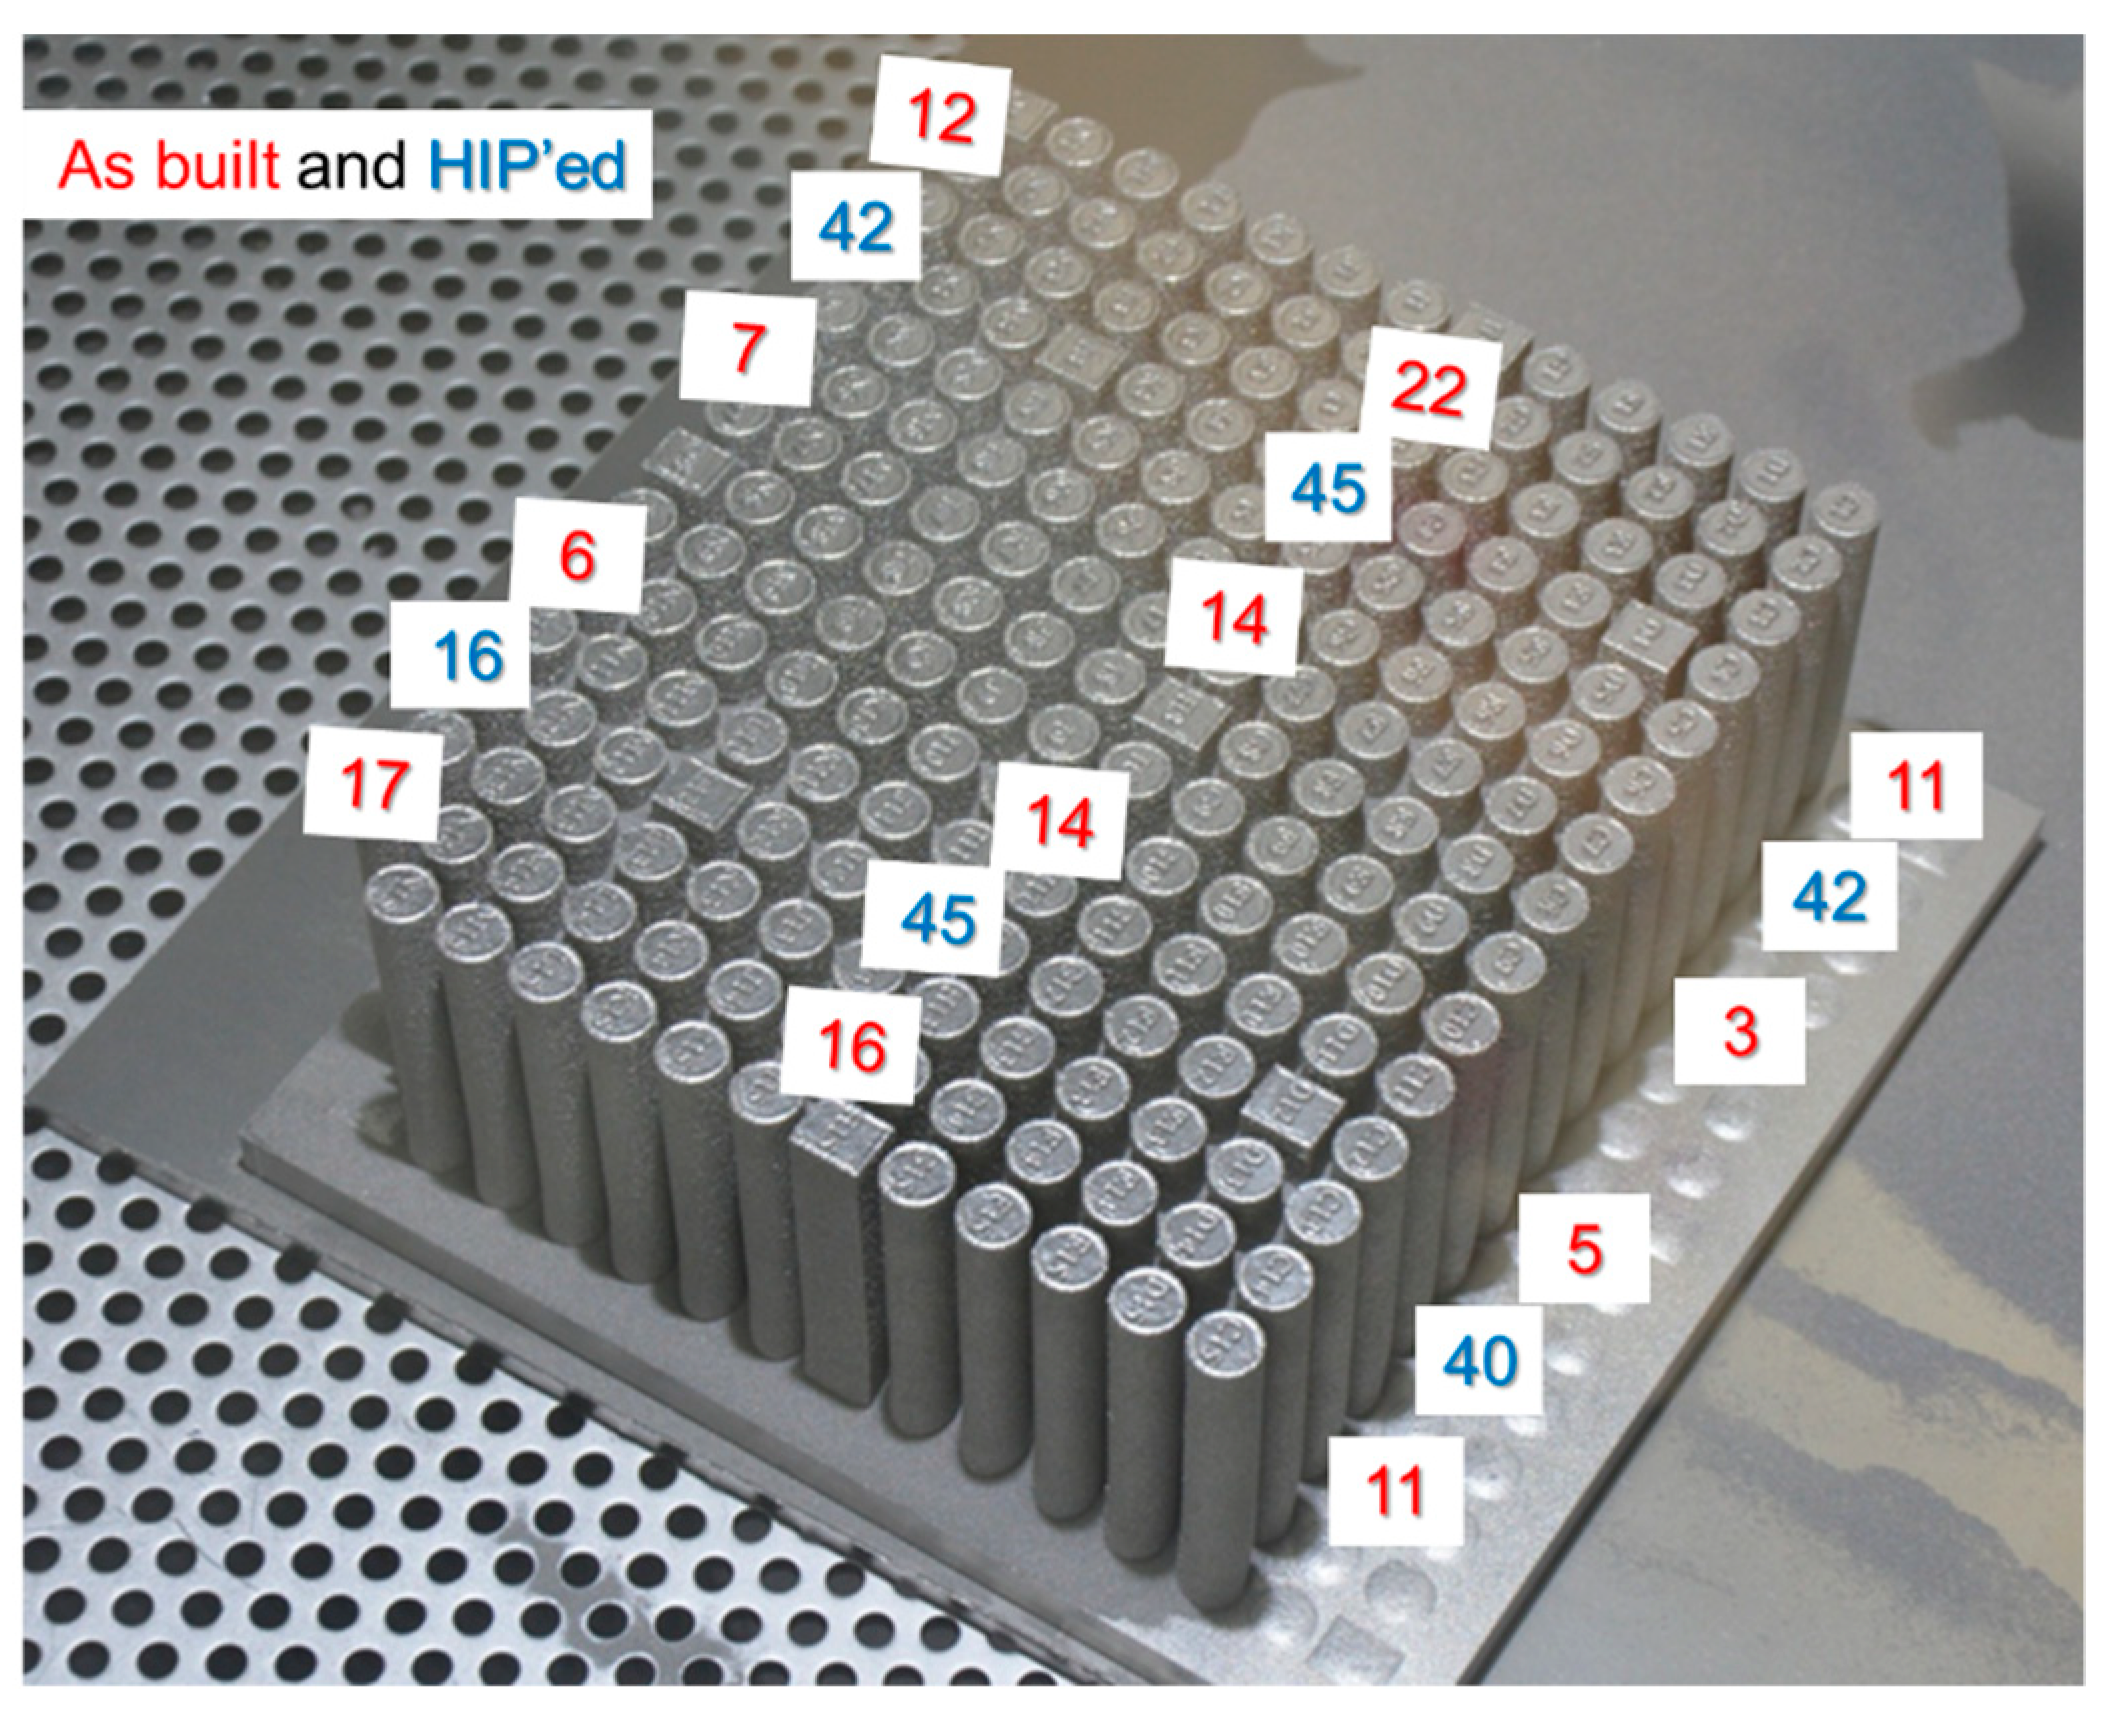
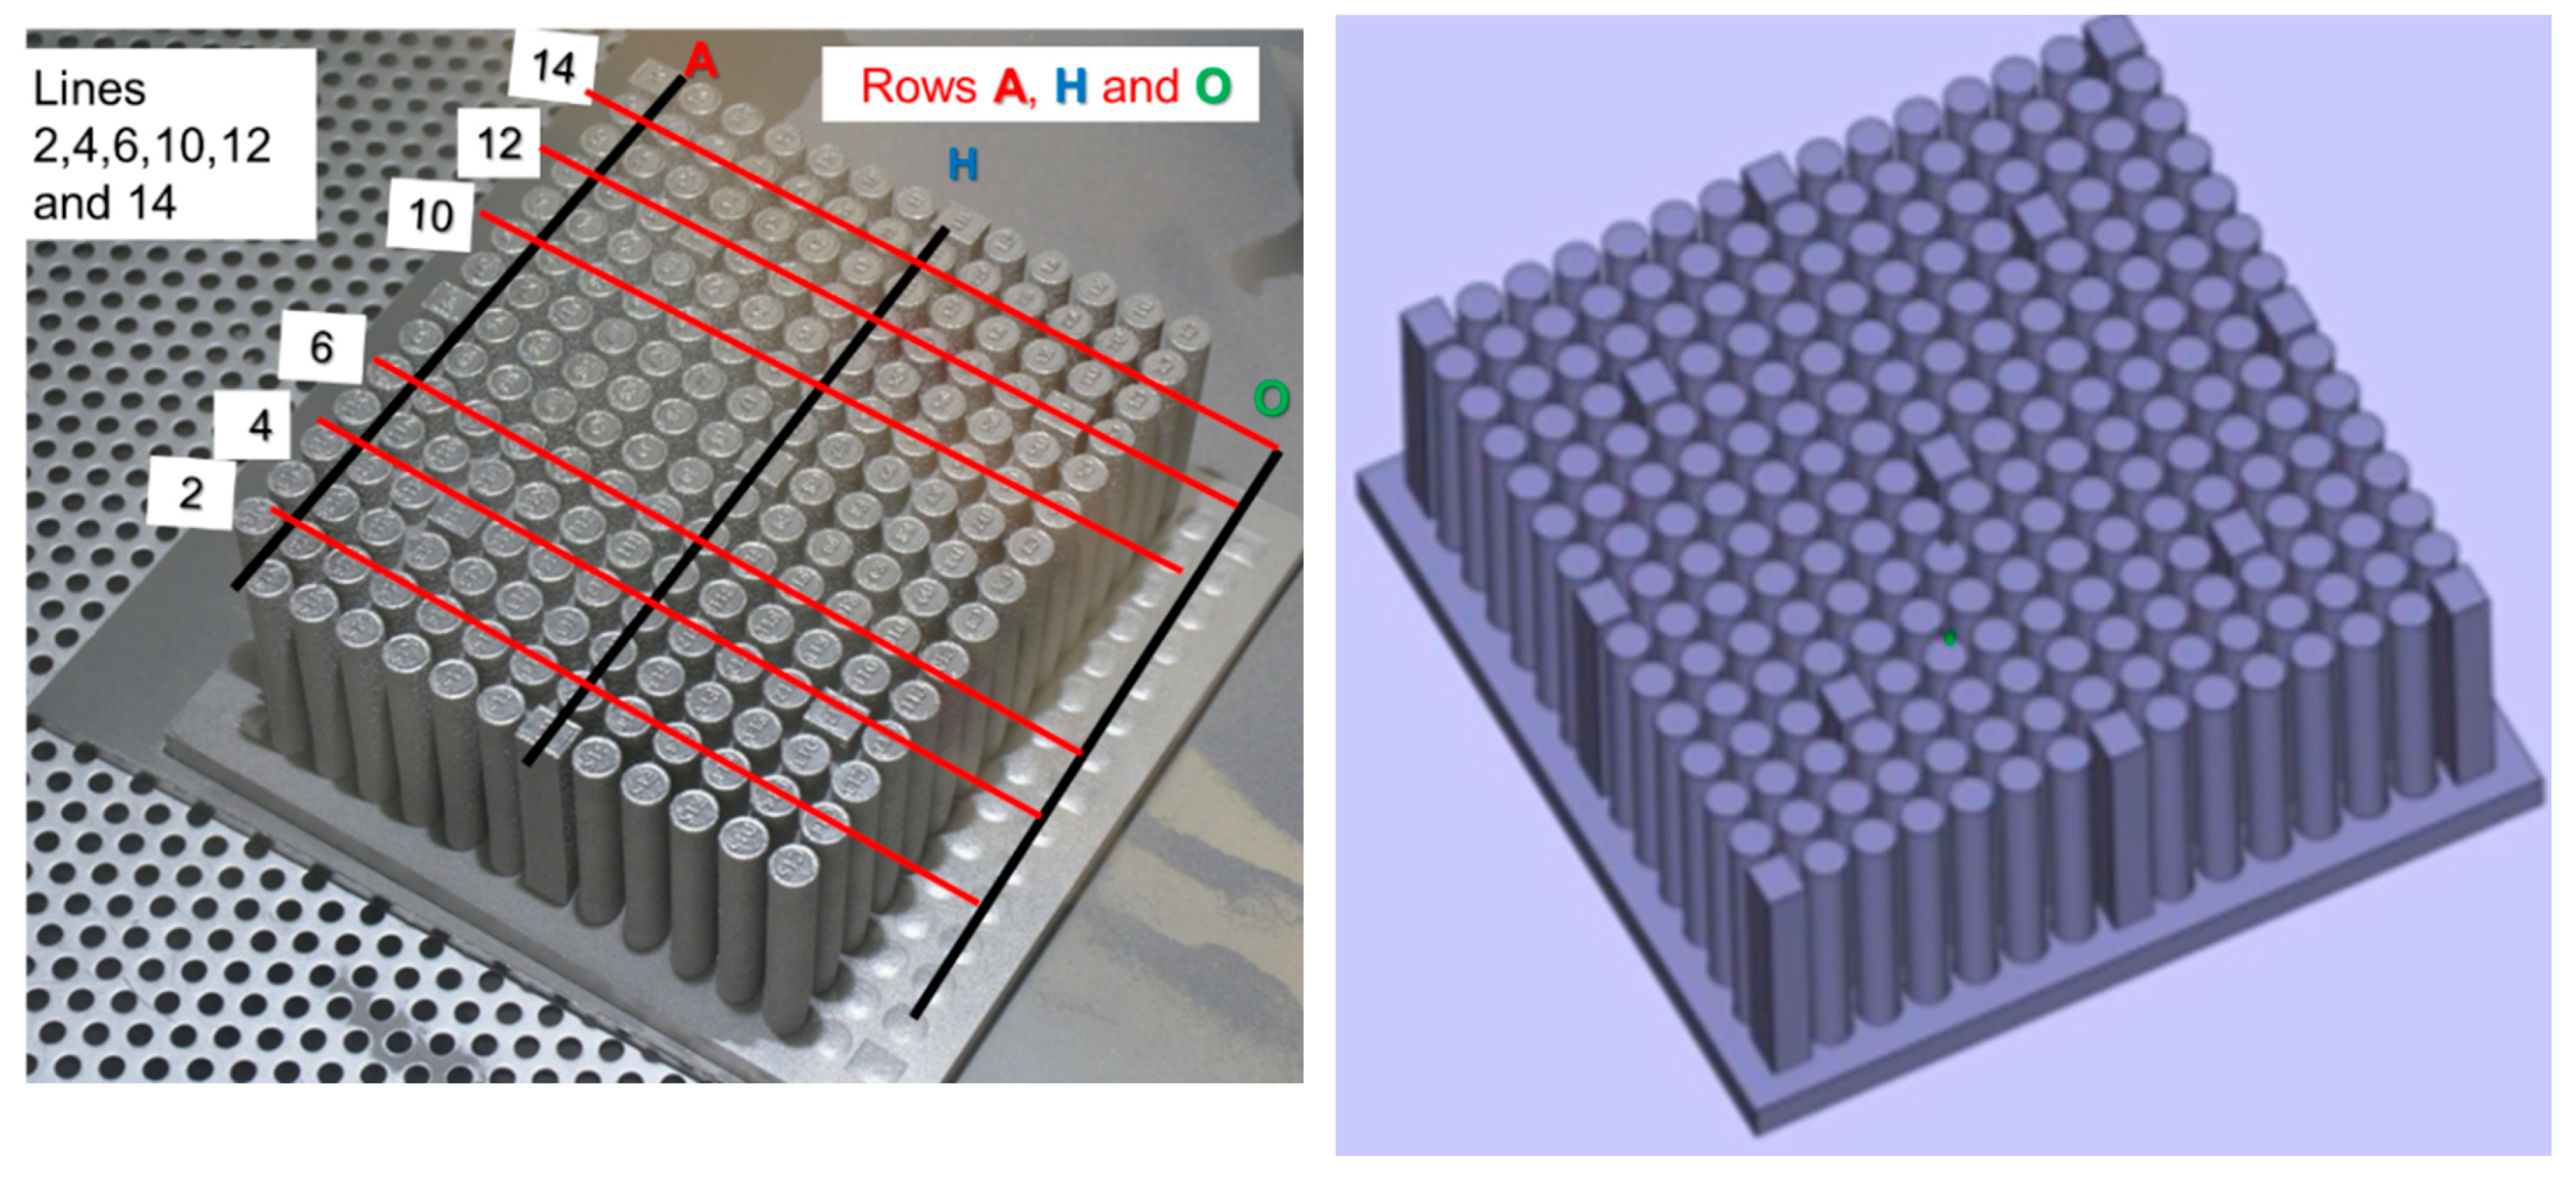
2.3. Printing Theme
2.4. HIP Post-Processing
2.5. Characterization Methods
3. Results
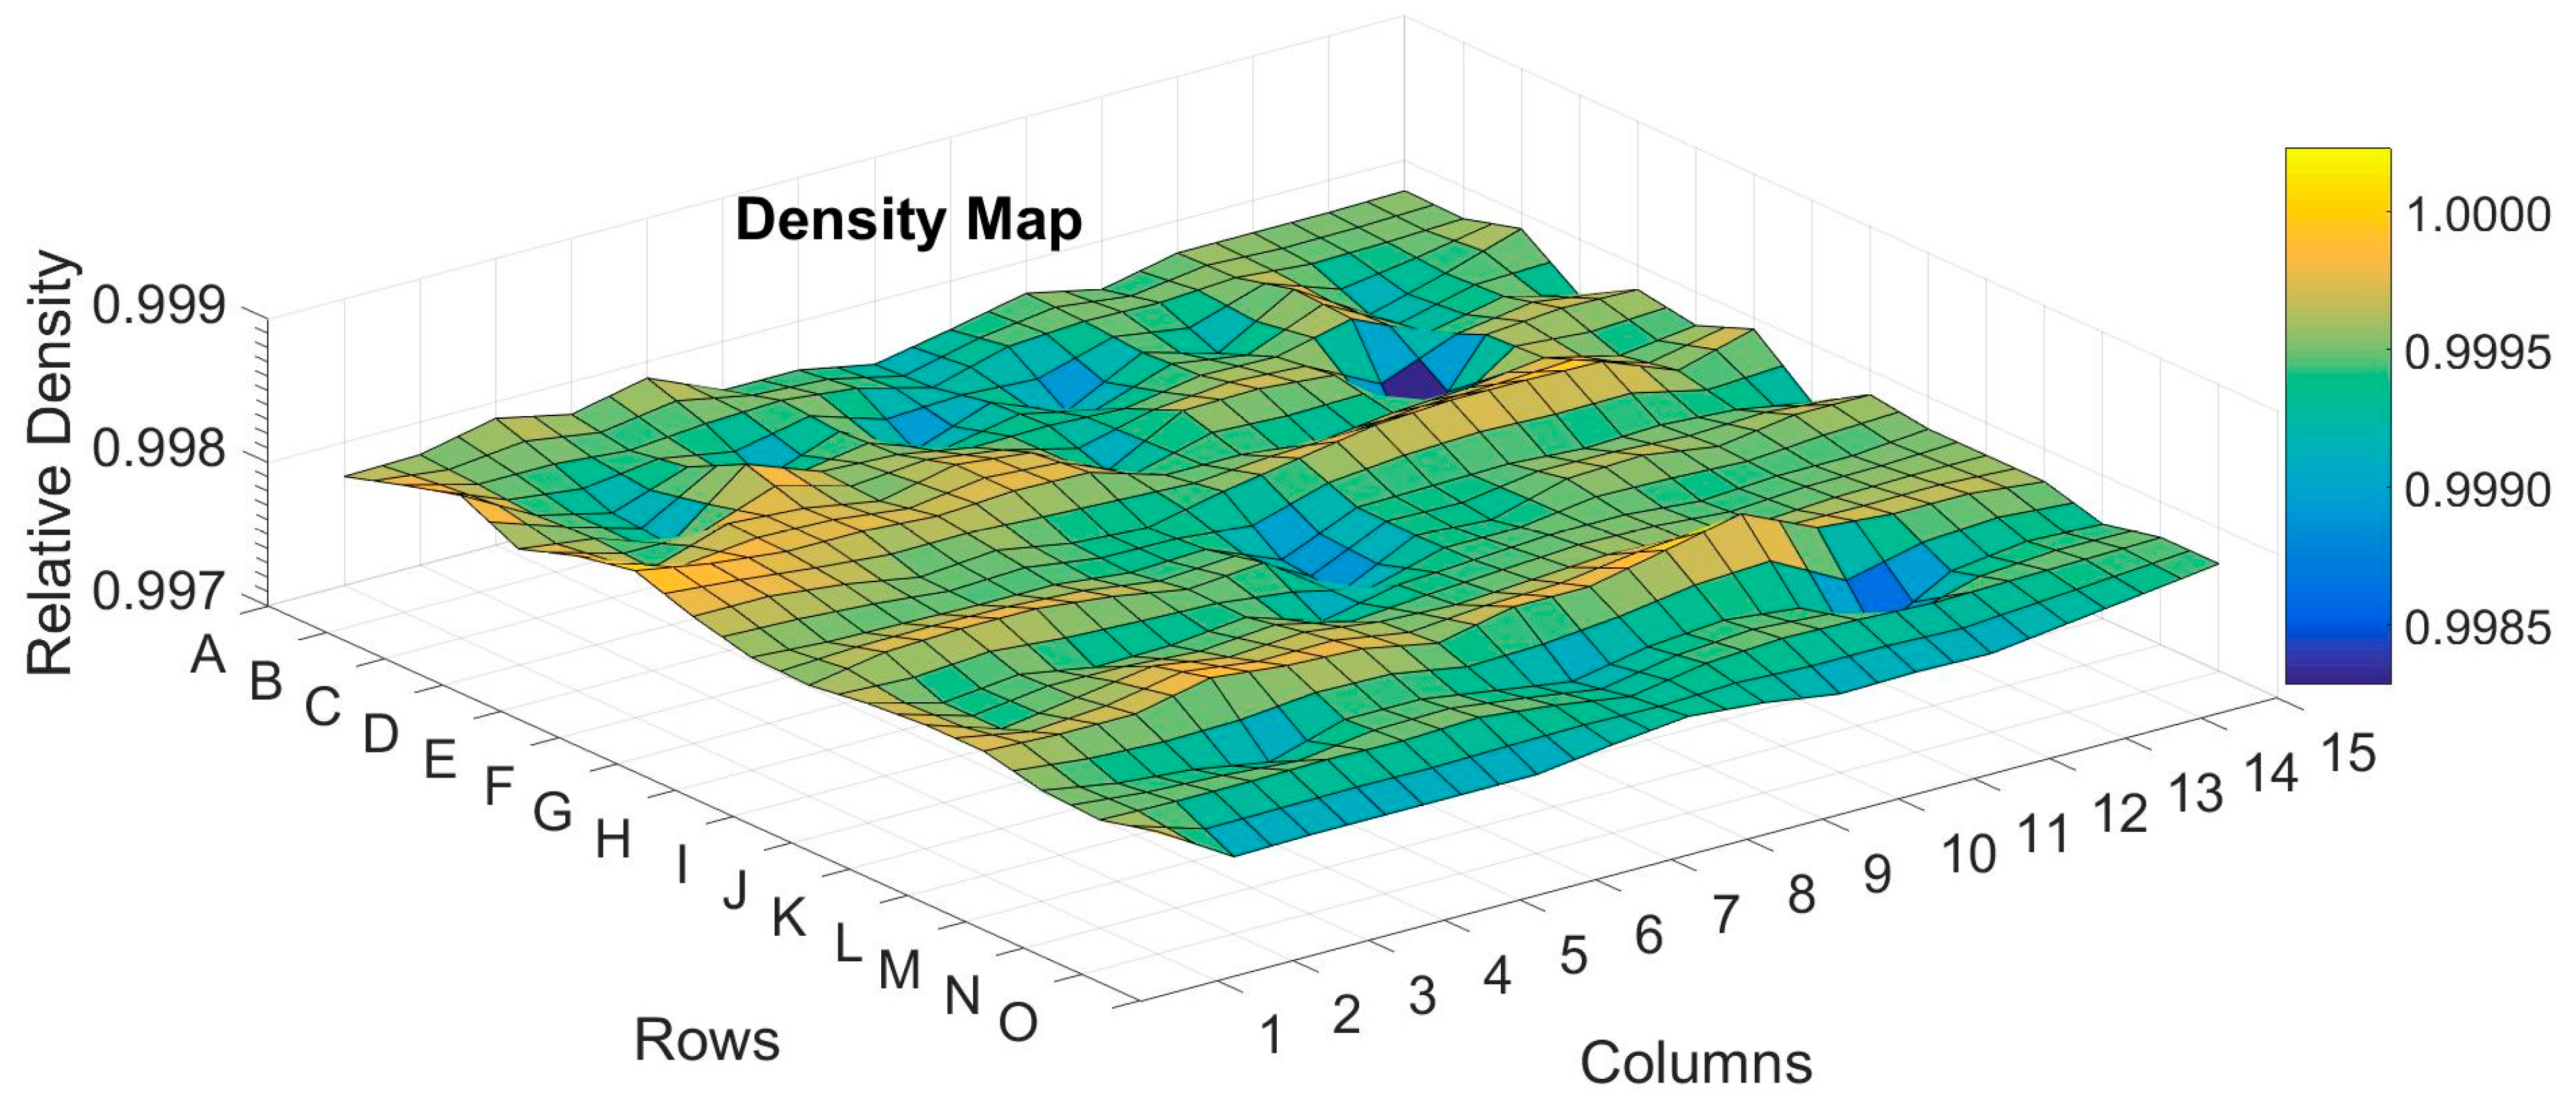
3.1. Bulk Density
3.2. Chemical Composition
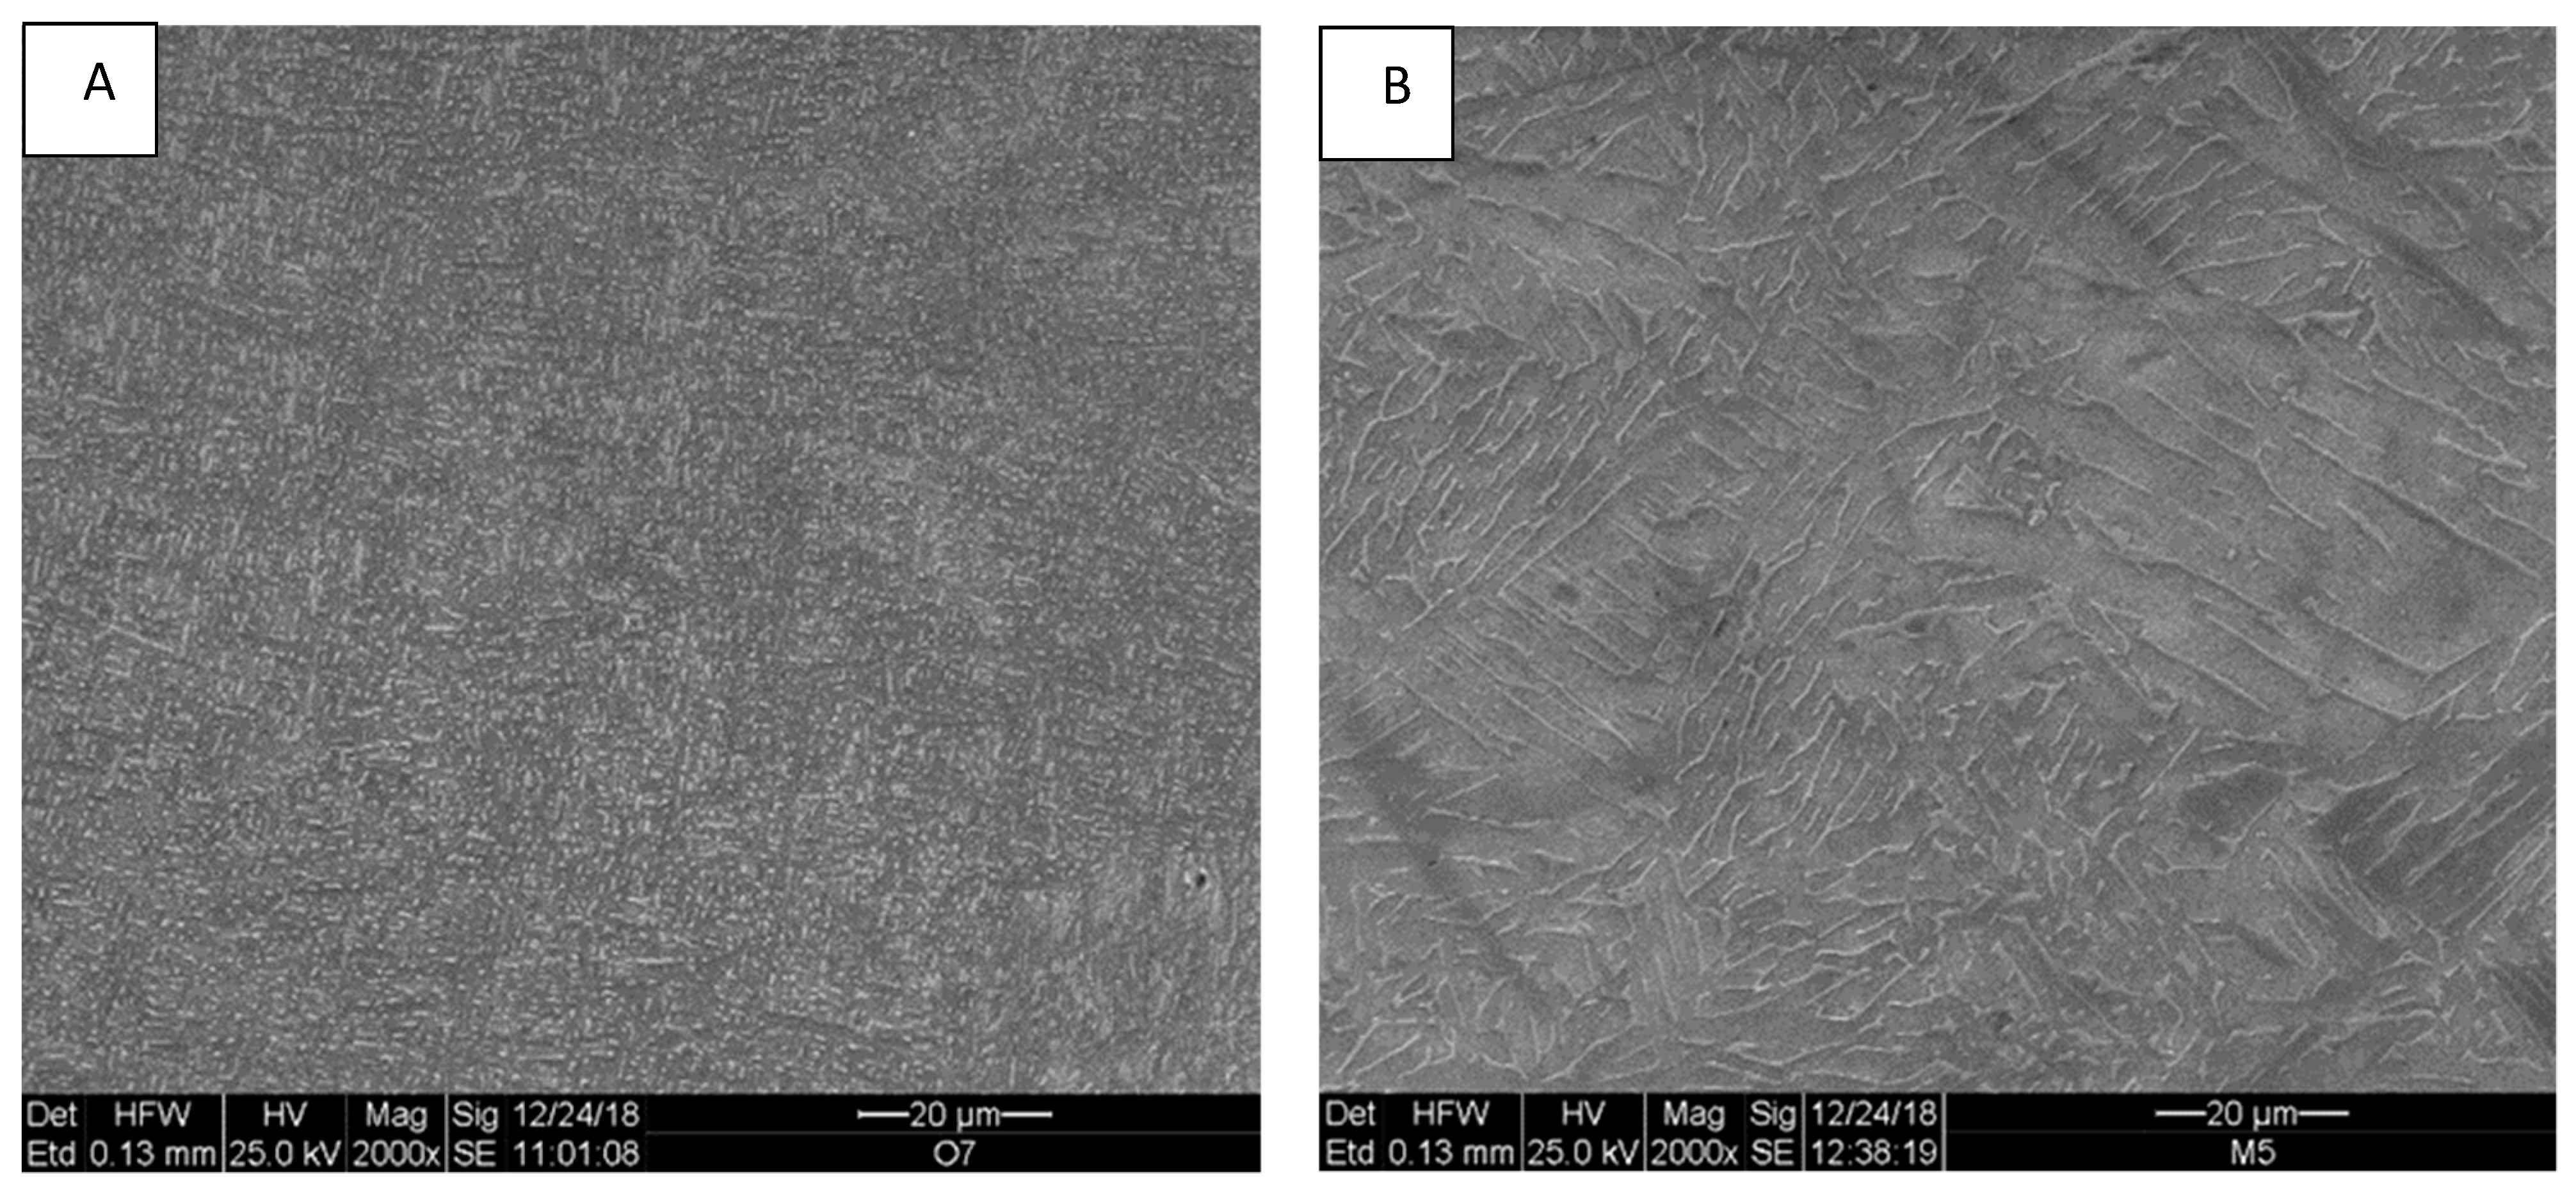
3.3. Microstructure
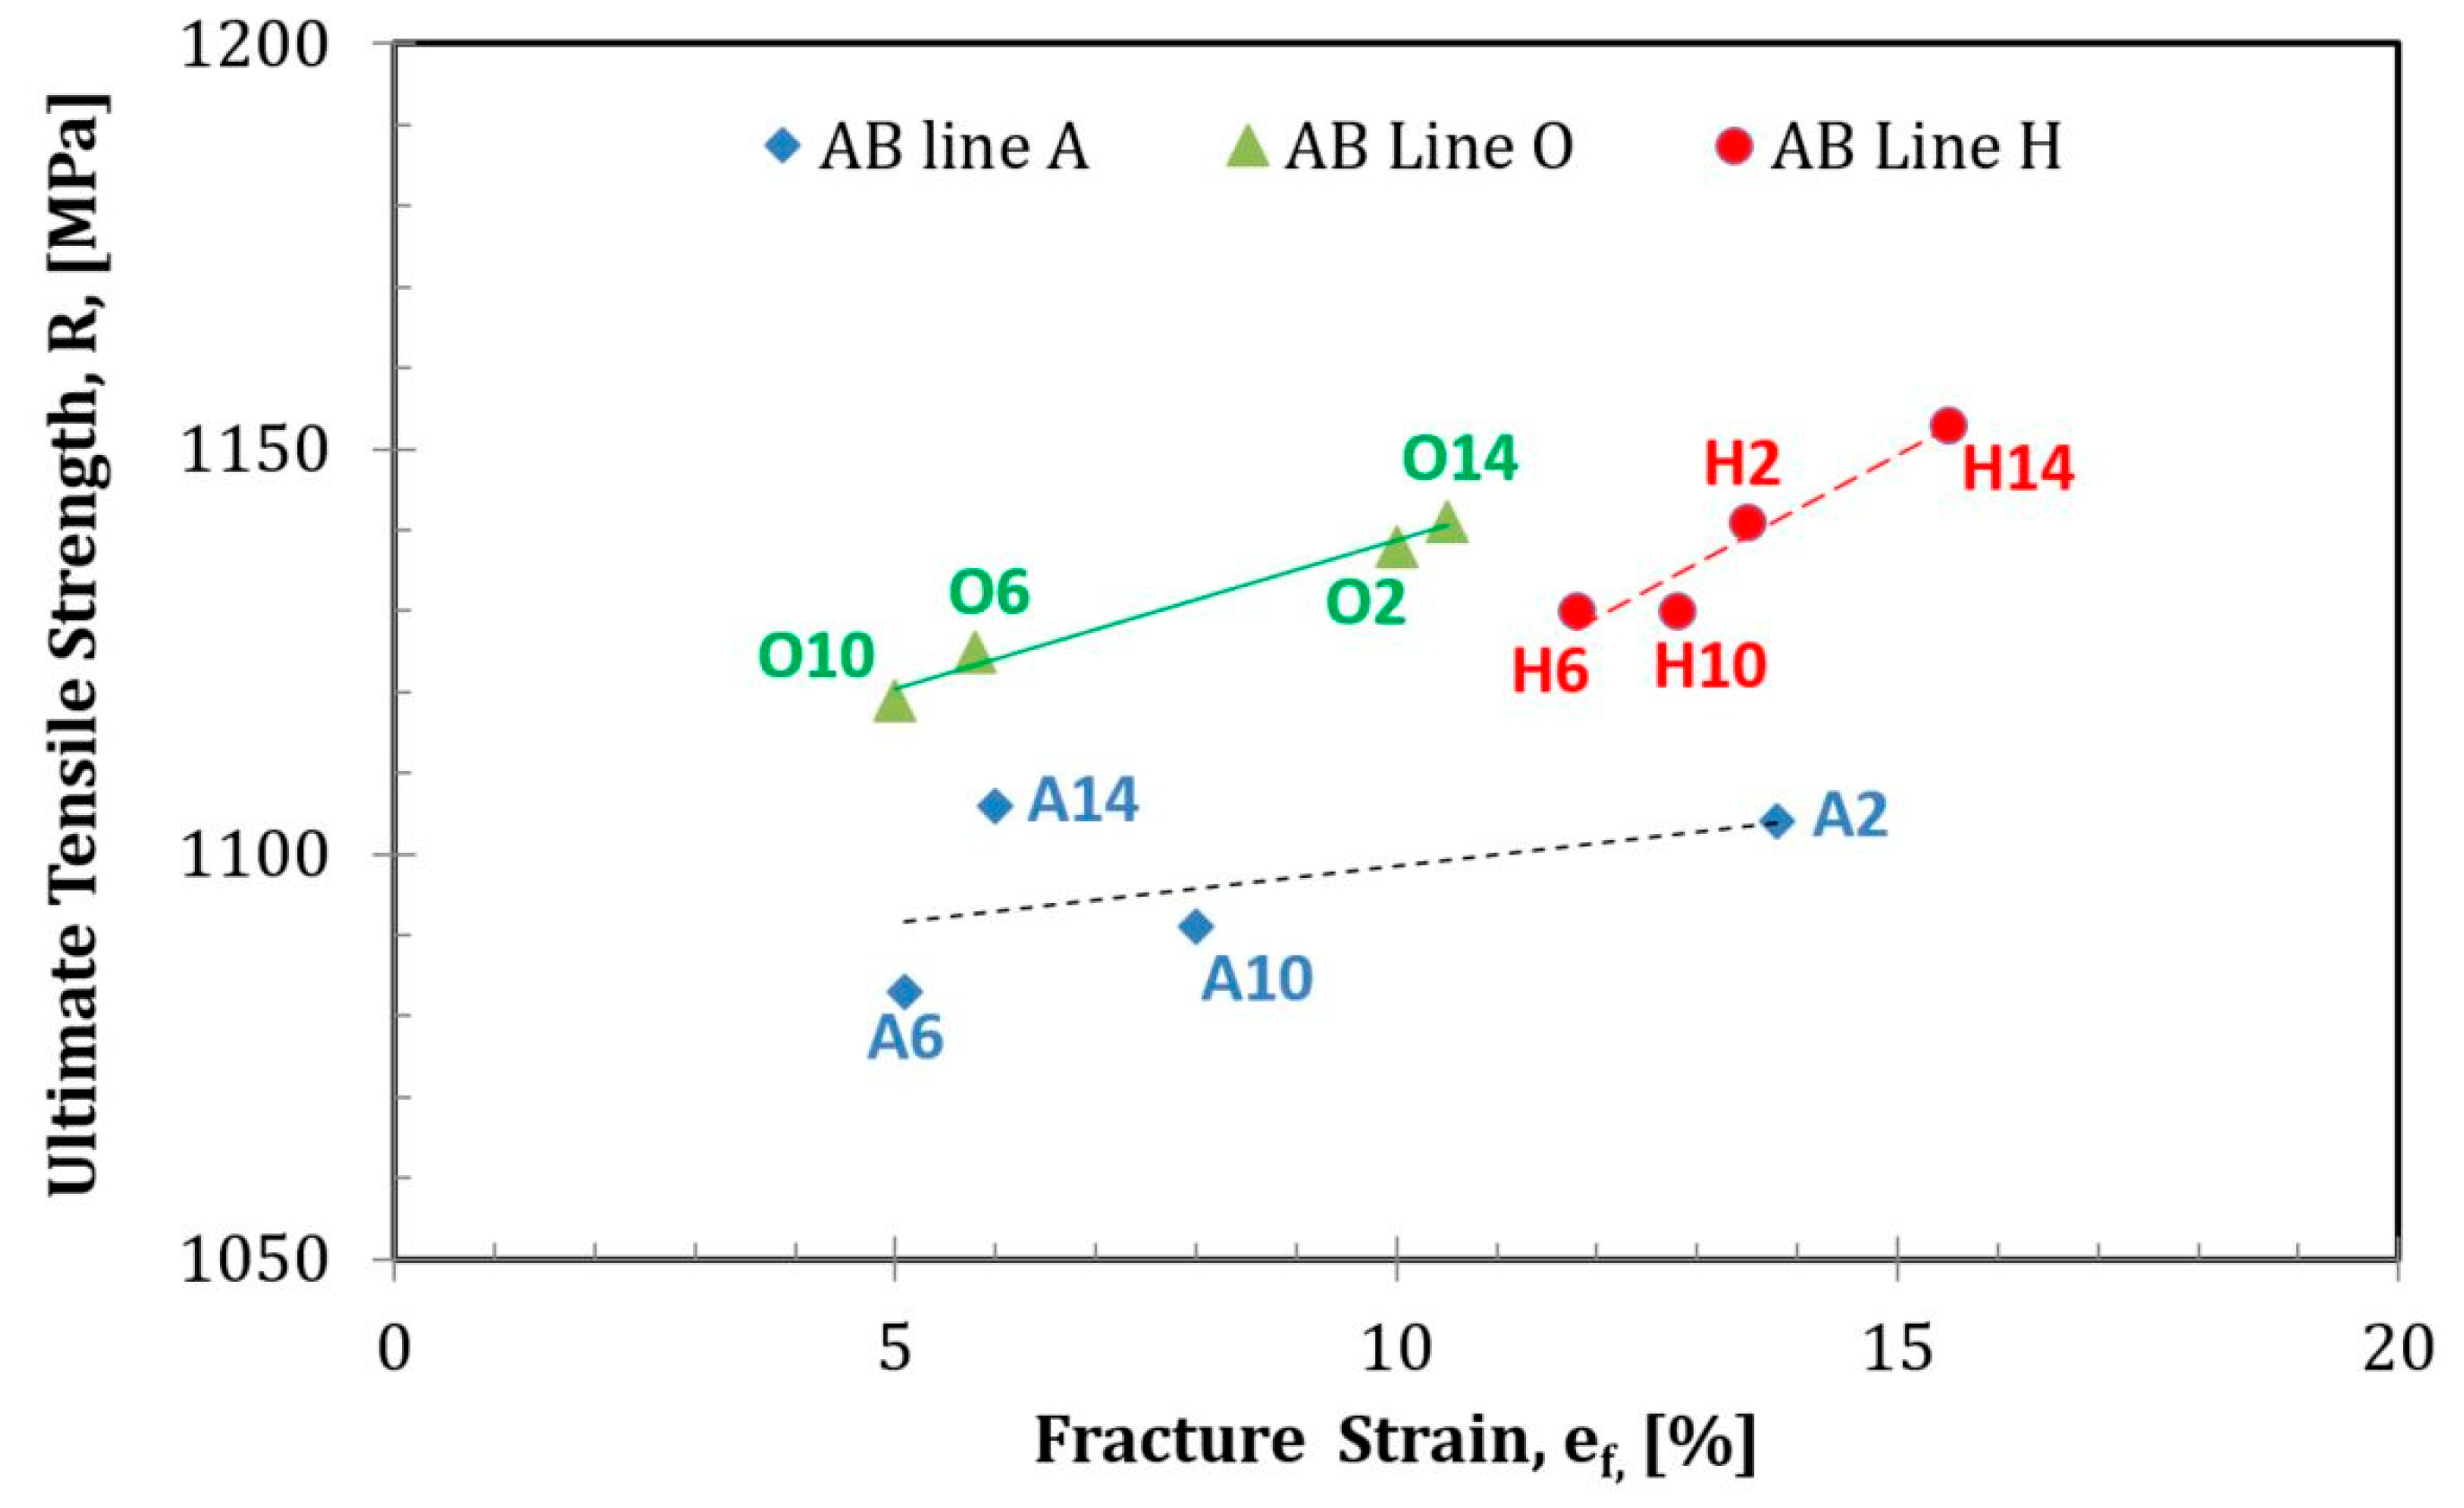
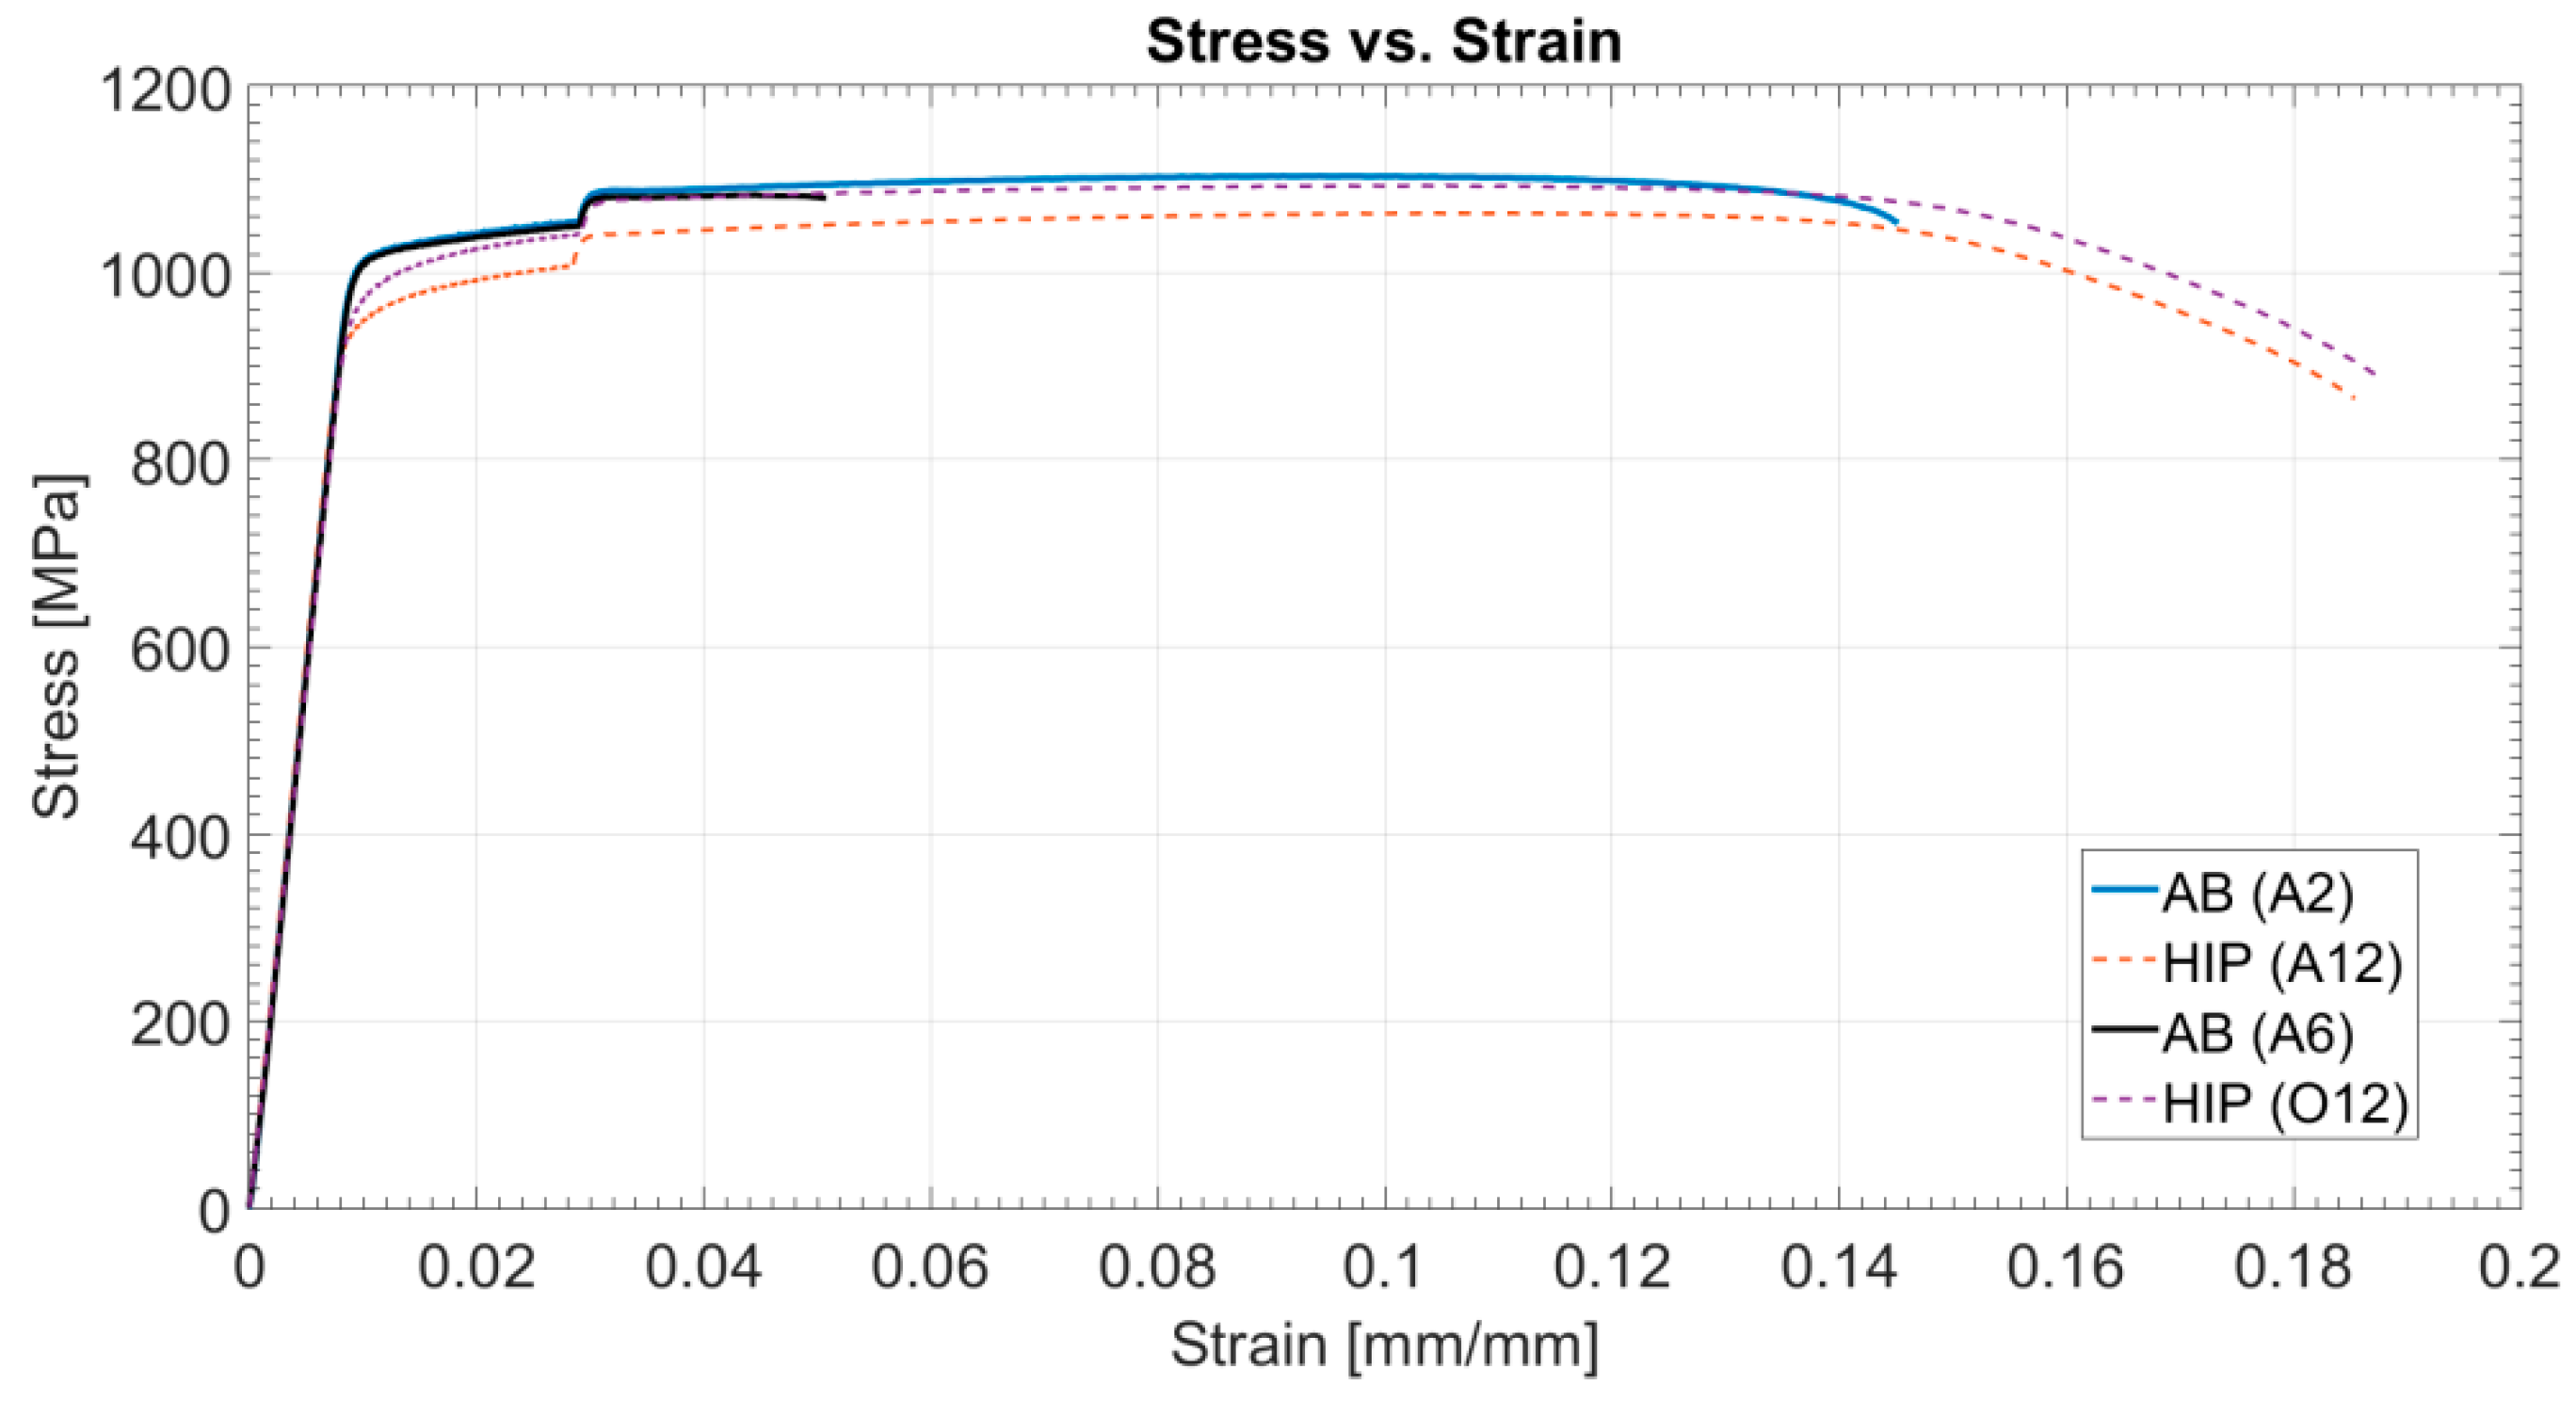
3.4. Tensile Properties and Fractography
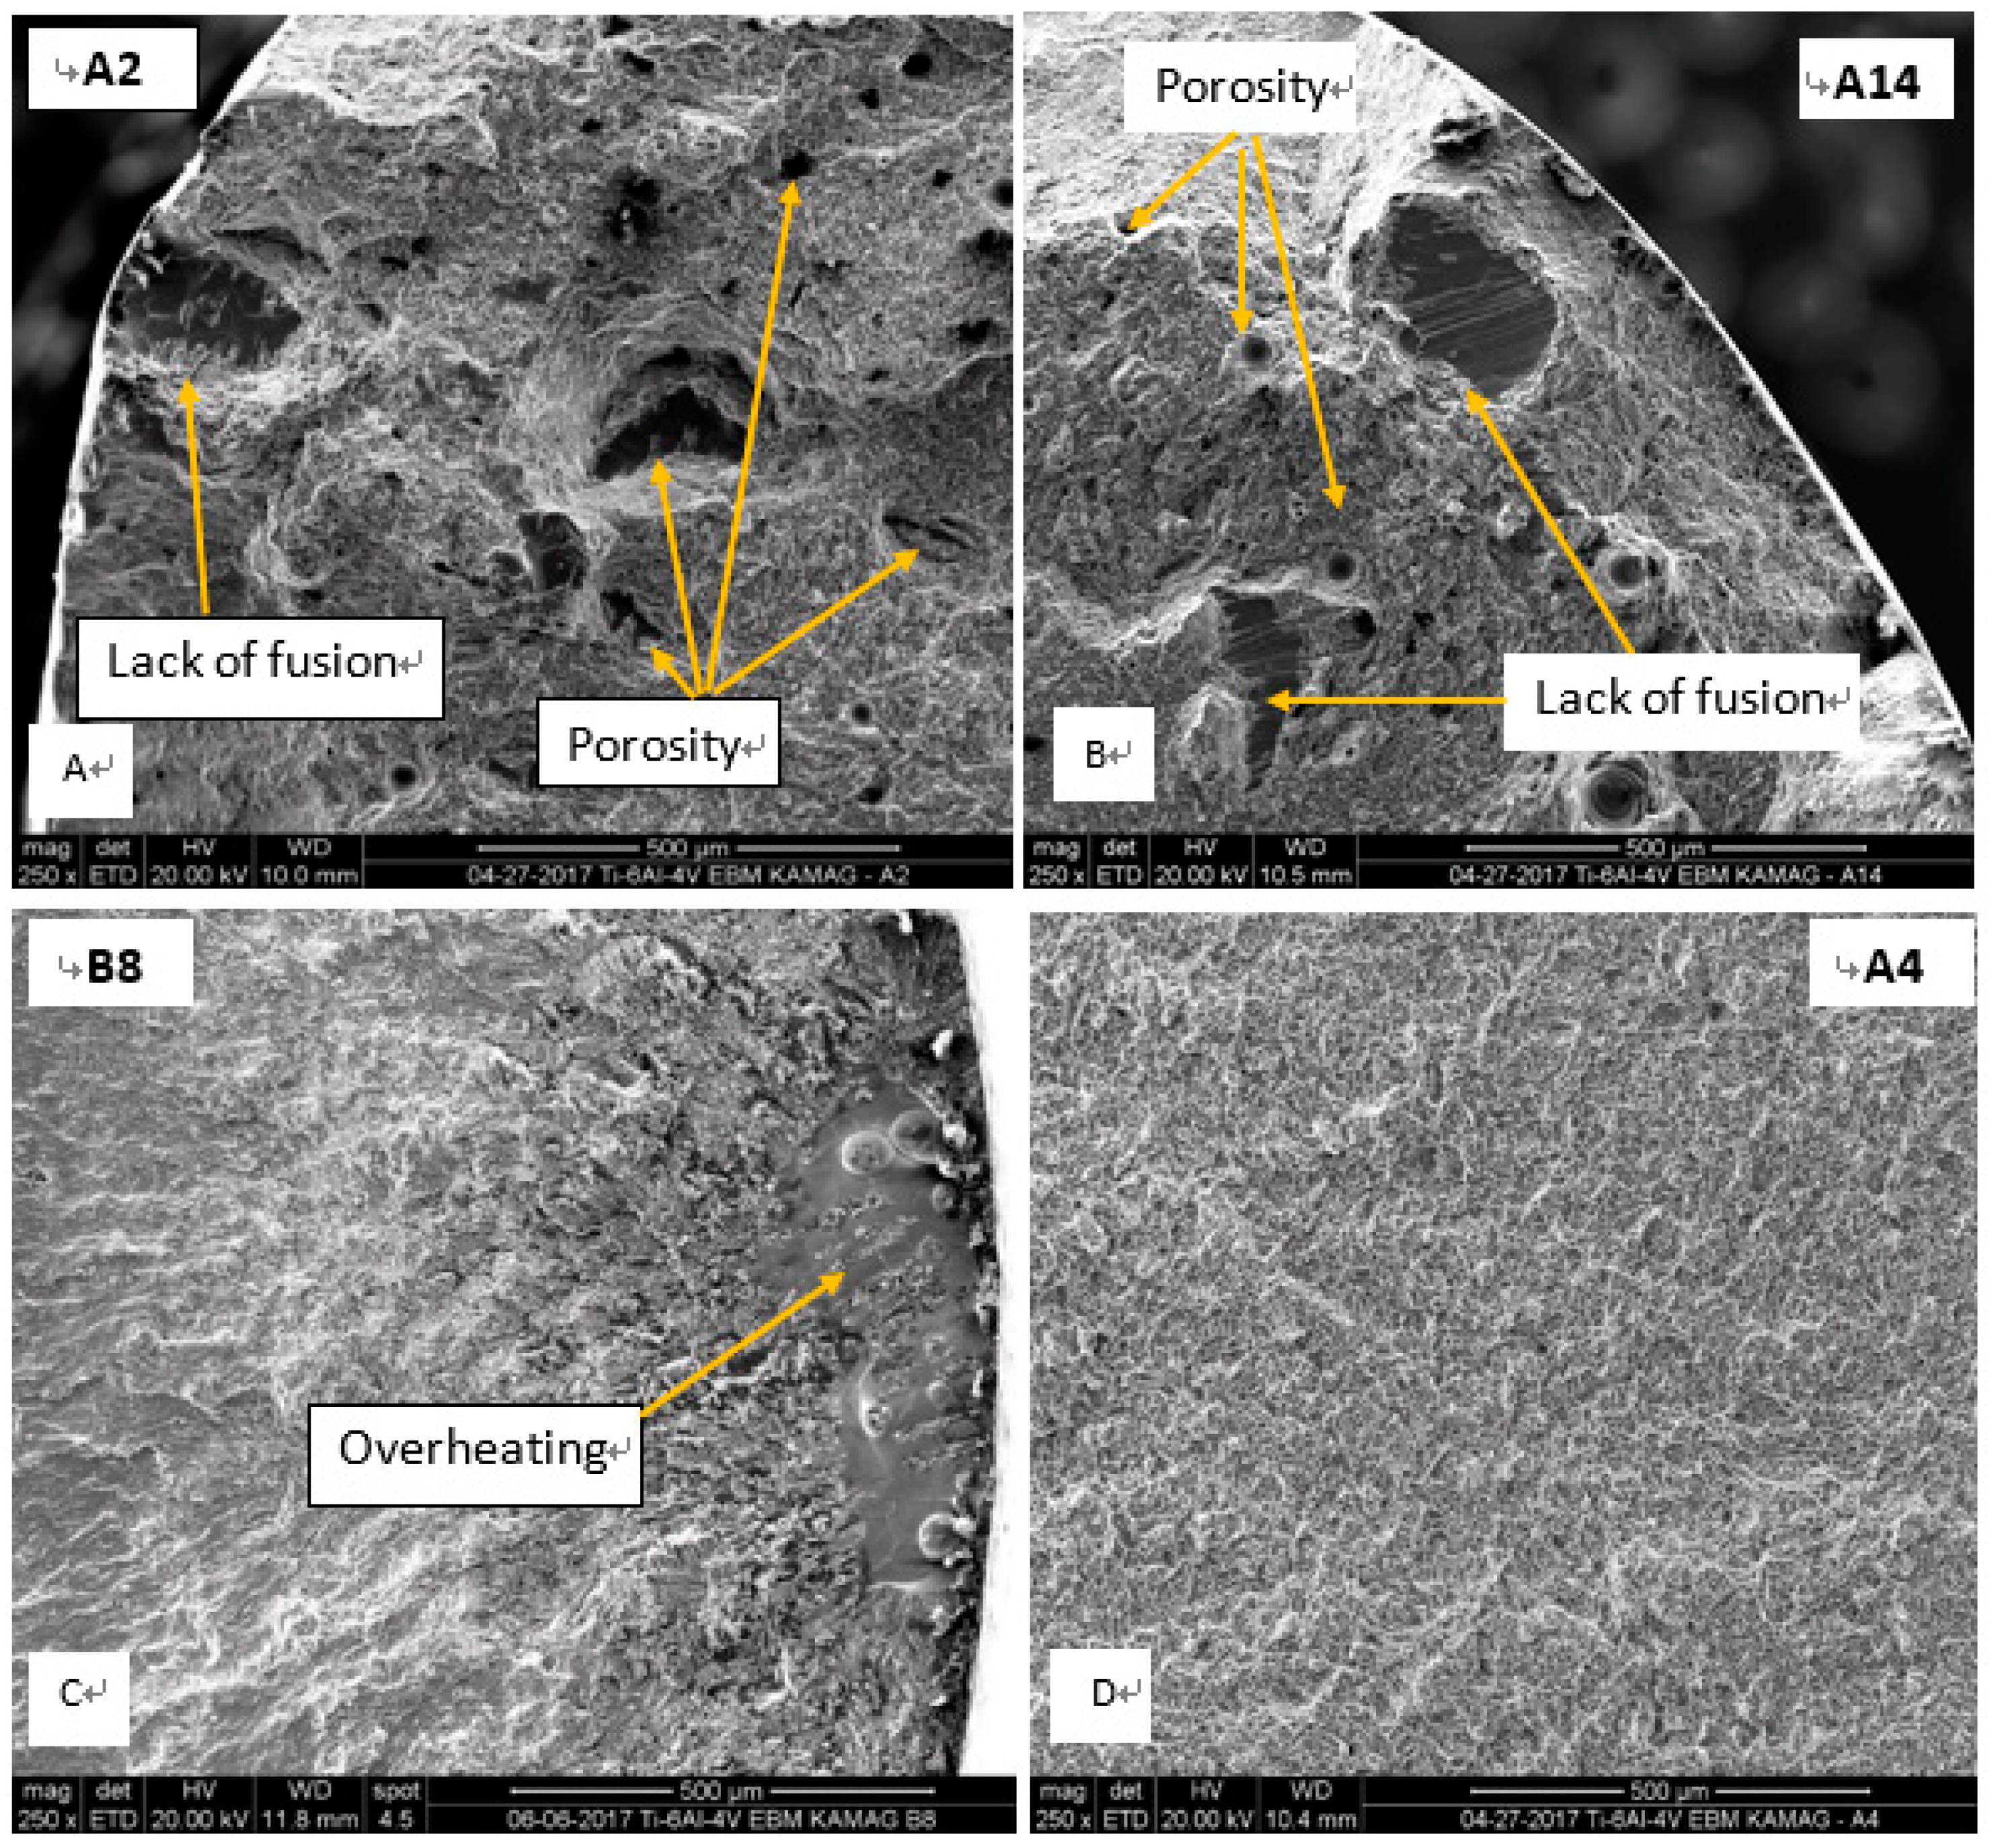
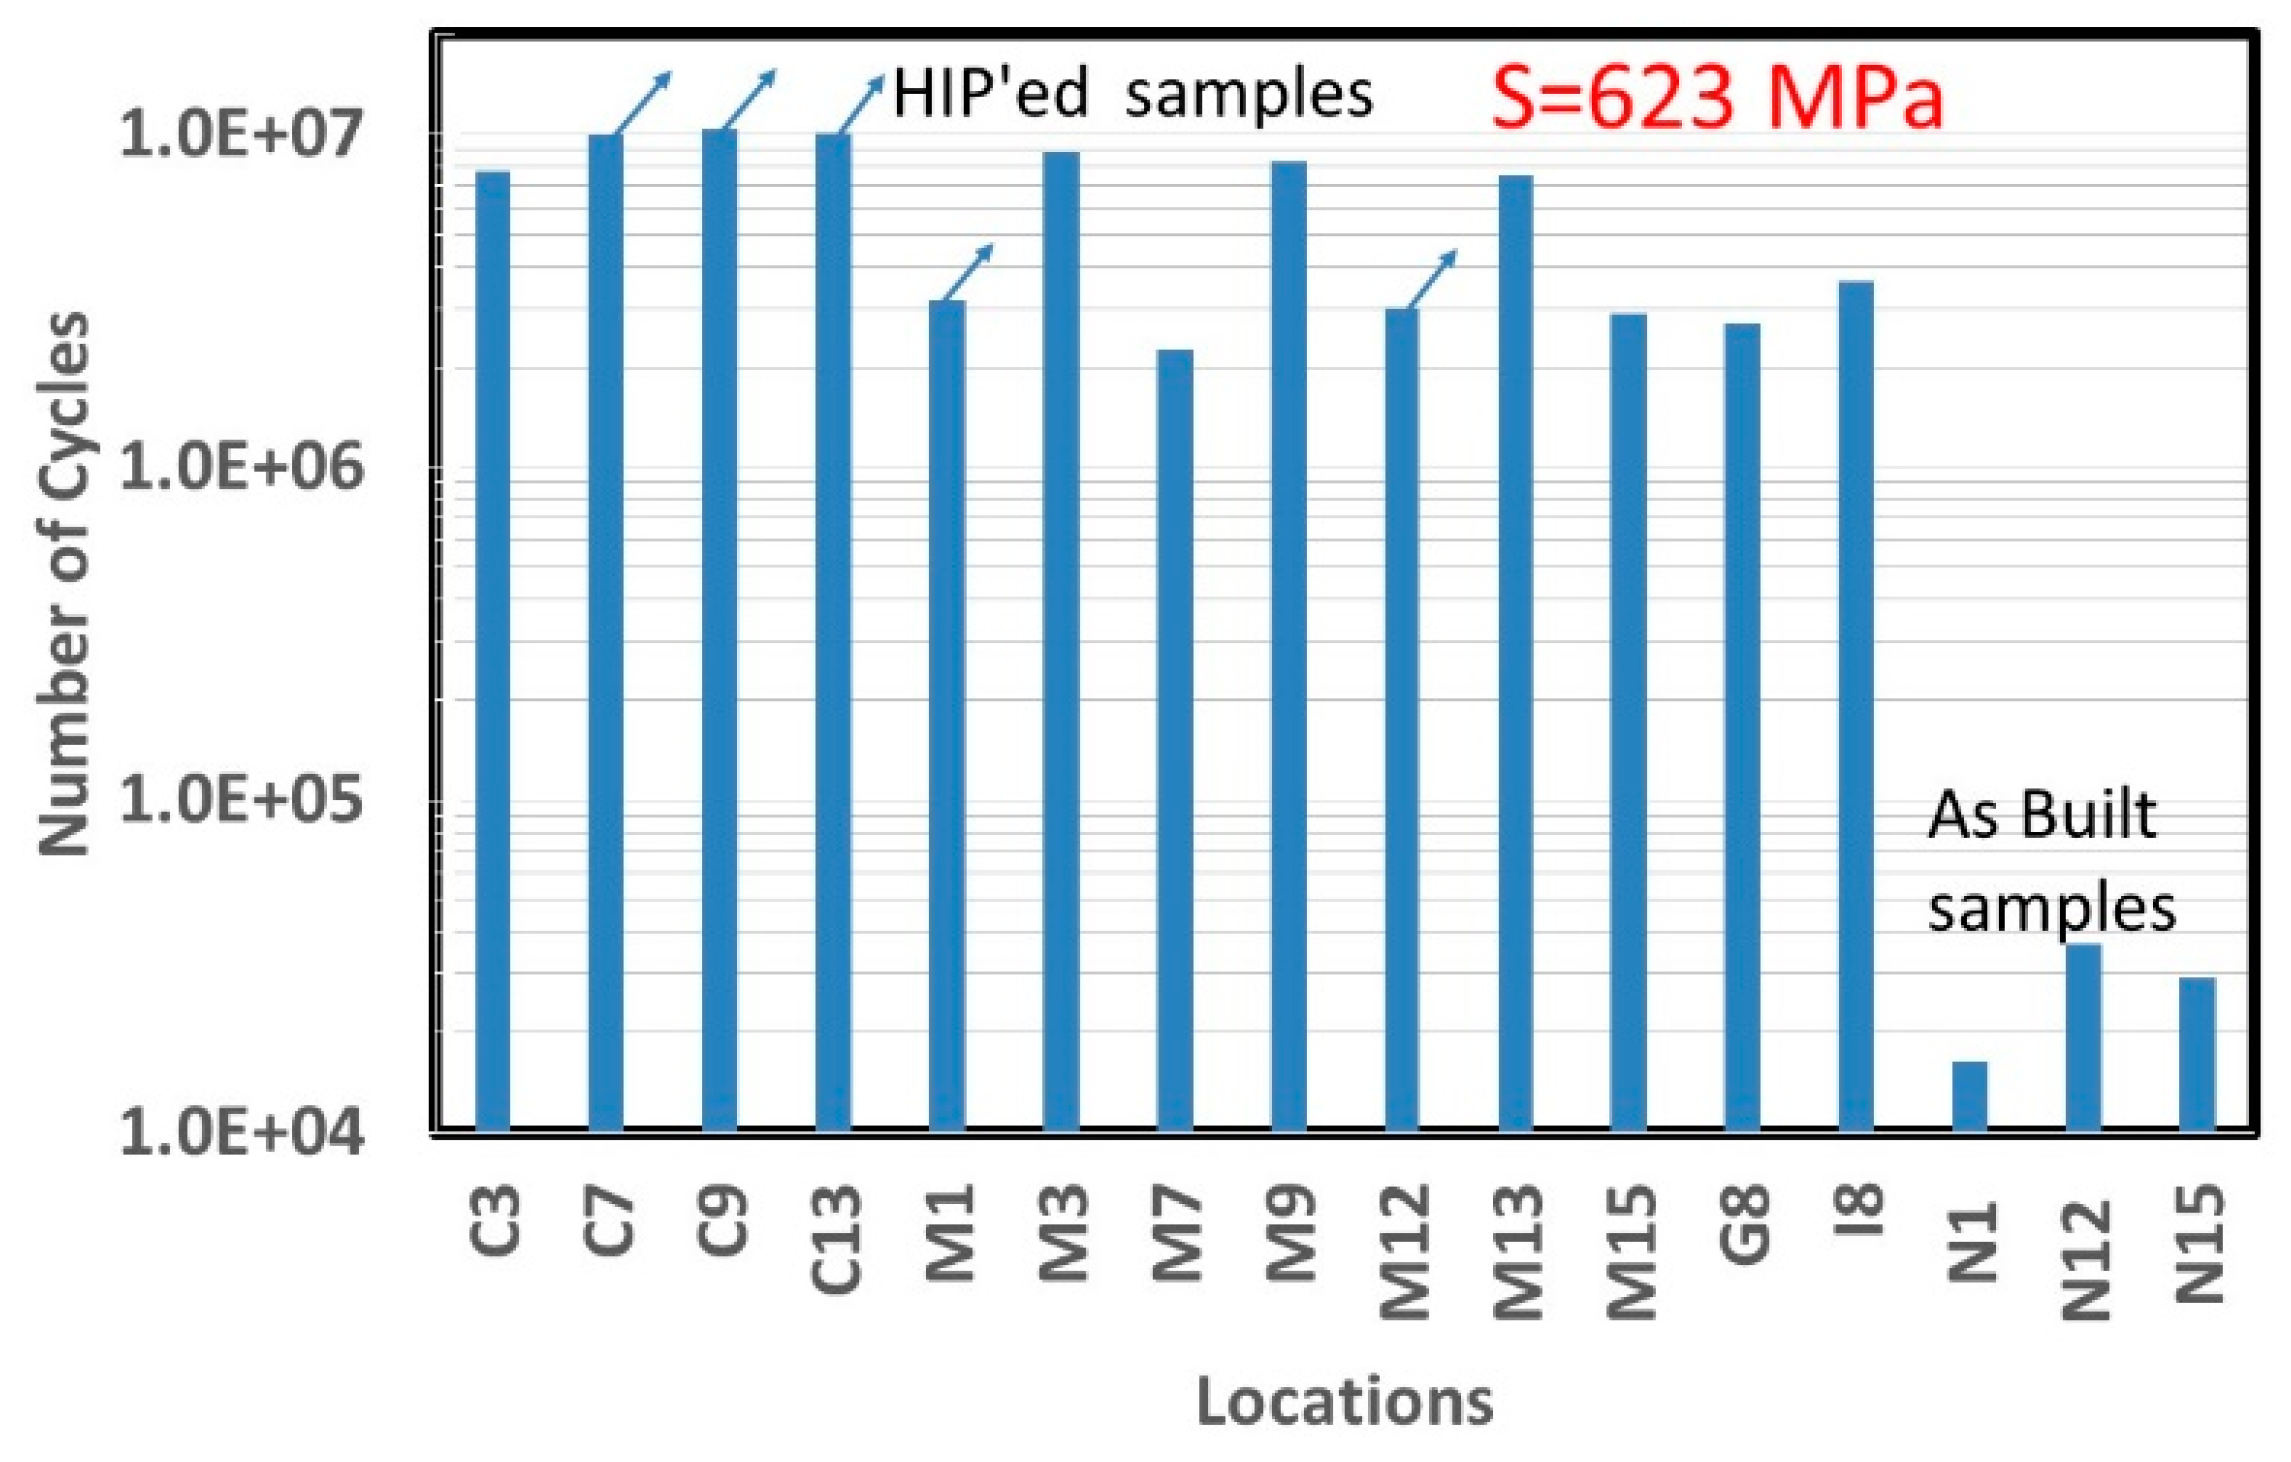
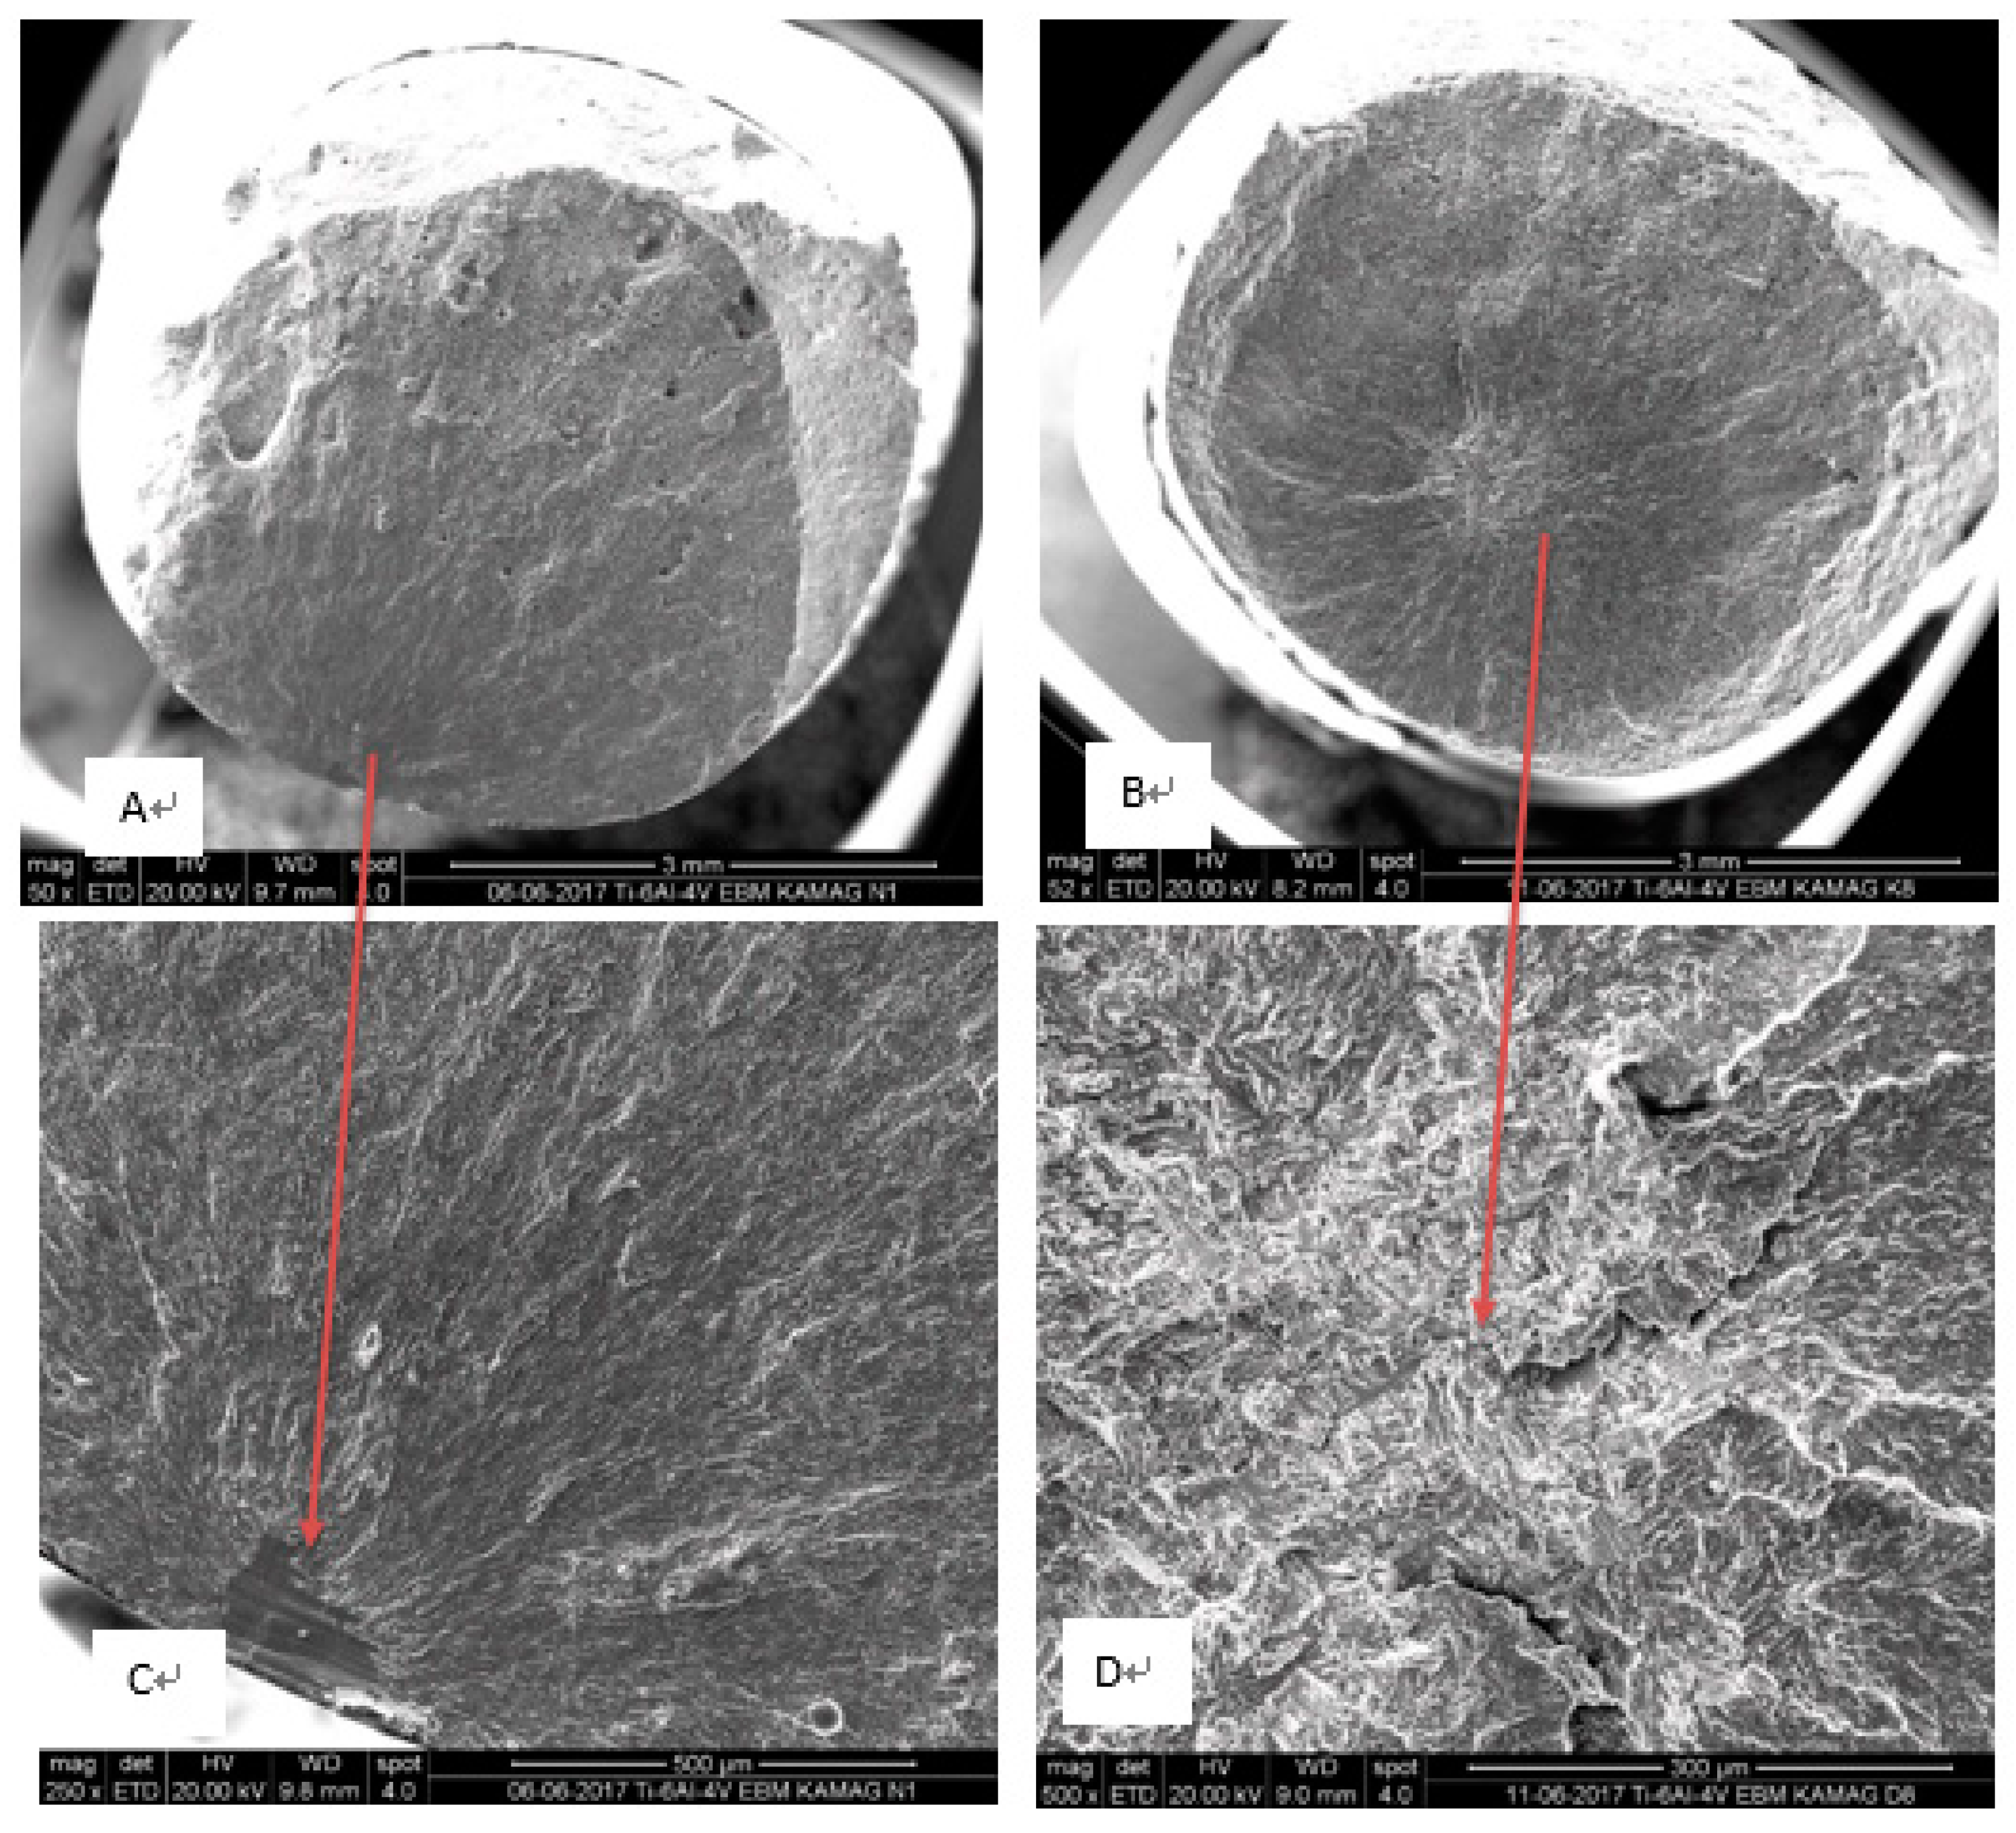
3.5. Fatigue Tests and Fractography
4. Discussion
4.1. Thermal Management of Built Tray
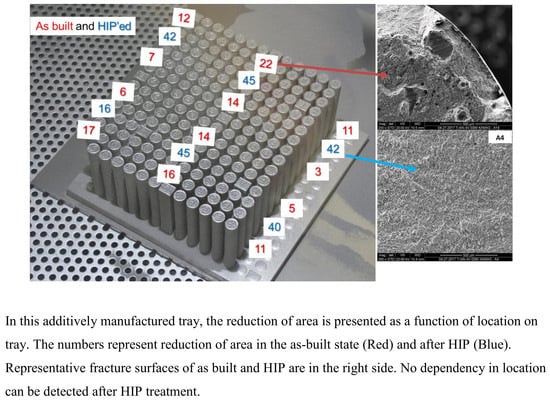
4.2. Location Dependency of As-Built Samples
4.3. HIP Influence
5. Summary
Author Contributions
Funding
Acknowledgments
Conflicts of Interest
References
- Ian, G.; David, R.; Brent, S. Additive Manufacturing Technologies; Springer: New York, NY, USA, 2014; ISBN 978-1-4419-1120-9. [Google Scholar]
- Rosenthal, I.; Tiferet, E.; Ganor, M.; Stern, A. Post-processing of am-slm alsi10mg specimens: Mechanical properties and fracture behaviour. Ann. Dunarea de Jos Univ. Galati Fascicle XII Weld. Equip. Technol. 2015, 26, 33–38. [Google Scholar]
- DebRoy, T.; Wei, H.L.; Zuback, J.S.; Mukherjee, T.; Elmer, J.W.; Milewski, J.O.; Beese, A.M.; Wilson-Heid, A.; De, A.; Zhang, W. Additive manufacturing of metallic components—Process, structure and properties. Prog. Mater. Sci. 2018, 92, 112–224. [Google Scholar] [CrossRef]
- Murr, L.E.; Martinez, E.; Amato, K.N.; Gaytan, S.M.; Hernandez, J.; Ramirez, D.A.; Shindo, P.W.; Medina, F.; Wicker, R.B. Metal fabrication by additive manufacturing using laser and electron beam melting technologies. J. Mater. Sci. Technol. 2012, 28, 1–14. [Google Scholar] [CrossRef]
- Siddique, S.; Imran, M.; Rauer, M.; Kaloudis, M.; Wycisk, E.; Emmelmann, C.; Walther, F. Computed tomography for characterization of fatigue performance of selective laser melted parts. Mater. Des. 2015, 83, 661–669. [Google Scholar] [CrossRef]
- Li, Y.; Gu, D. Parametric analysis of thermal behavior during selective laser melting additive manufacturing of aluminum alloy powder. Mater. Des. 2014, 63, 856–867. [Google Scholar] [CrossRef]
- Atkinson, H.V.; Davies, S. Fundamental aspects of hot isostatic pressing: An overview. Metall. Mater. Trans. A 2000, 31, 2981–3000. [Google Scholar] [CrossRef]
- Steffens, H.-D.; Lebkuchner-Neugebauer, J.; Wielage, B. Hot Isostatic Pressing. Mat.-Wiss. u. Werkstofftech 1990, 21, 28–31. [Google Scholar] [CrossRef]
- Harbe, N.; Gnäupel-Herold, T.; Quinn, T. Fatigue properties of a titanium alloy (Ti–6Al–4V) fabricated via electron beam melting (EBM): Effects of internal defects and residual stress. Int. J. Fatigue 2017, 94, 202–210. [Google Scholar]
- Qian, M.; Xu, W.; Brandt, M.; Tang, H. Additive manufacturing and postprocessing of Ti-6Al-4V for superior mechanical properties. MRS Bull. 2016, 41, 775–784. [Google Scholar] [CrossRef]
- LU, S.L.; TANG, H.P.; NING, Y.P.; LIU, N.; STJOHN, D.H.; QIAN, M. Microstructure and Mechanical Properties of Long Ti6Al-4V Rods Additively Manufactured by Selective Electron Beam Melting Out of a Deep Powder Bed and the Effect of Subsequent Hot Isostatic Pressing. Metall. Mat. Trans. A 2015, 46, 3824. [Google Scholar] [CrossRef]
- Günther, J.; Krewerth, D.; Lippmann, T.; Leuders, S.; Tröster, T.; Weidner, A.; Biermann, H.; Niendorf, T. Fatigue life of additively manufactured Ti–6Al–4V in the very high cycle fatigue regime. Int. J. Fatigue 2017, 94, 236–245. [Google Scholar] [CrossRef]
- Olakanmi, E.O.; Cochrane, R.F.; Dalgarno, K.W. Densification mechanism and microstructural evolution in selective laser sintering of Al-12Si powders. J. Mater. Process. Technol. 2011, 211, 113–121. [Google Scholar] [CrossRef]
- Jia, Q.B.; Gu, D.D. Selective laser melting additive manufacturing of Inconel 718 superalloy parts: Densification, microstructure and properties. J. Alloys Compd. 2014, 585, 713–721. [Google Scholar] [CrossRef]
- Greitemeier, D.; Palm, F.; Syassen, F.; Melz, T. Fatigue performance of additive manufactured TiAl6V4 using electron and laser beam melting. Int. J. Fatigue 2017, 94, 211–217. [Google Scholar] [CrossRef]
- Khan, A.S.; Kazmi, R.; Farrokh, B.; Zupan, M. Effect of oxygen content and microstructure on the thermo-mechanical response of three Ti–6Al–4V alloys: Experiments and modeling over a wide range of strain-rates and temperatures. Int. J. Plast. 2007, 23, 1105–1125. [Google Scholar] [CrossRef]
- Oh, J.M.; Lee, B.G.; Cho, S.W.; Lee, S.W.; Choi, G.S.; Lim, J.W. Oxygen effects on the mechanical properties and lattice strain of Ti and Ti-6Al-4V. Met. Mater. Int. 2011, 17, 733–736. [Google Scholar] [CrossRef]
- Nicolas, J.; Rousseau, A.; Brochu, B.; Blais, C. Effect of oxygen content in new and reused powder on microstructural and mechanical properties of Ti6Al4V parts produced by directed energy deposition. Addit. Manuf. 2018, 23, 197–205. [Google Scholar]
- Barre, C. Hot Isostatic Pressing. Adv. Mater. Process. 1999, 155, 47–48. [Google Scholar]
- Arzt, E.; Ashby, M.F.; Easterling, K.E. Practical applications of hotisostatic pressing diagrams: Four case studies. Met. Trans. A 1983, 14, 211–221. [Google Scholar] [CrossRef]
- Tillmanna, W.; Schaak, C.; Nellesen, J.; Schaper, M.; Aydinöz, M.E.; Hoyer, K.-P. Hot isostatic pressing of IN718 components manufactured by selective laser melting. Addit. Manuf. 2017, 13, 93–102. [Google Scholar] [CrossRef]
- Pesach, A.; Tiferet, E.; Vogel, S.; Rivin, O.; Yeheskel, O.; Caspi, E.N. Microstructure Study of Ti-6Al-4V Additively Manufactured using Neutron Diffraction. Addit. Manuf. 2018. submitted. [Google Scholar] [CrossRef]
- Tiferet, E.; Rivin, O.; Ganor, M.; Ettedgui, H.; Ozeri, O.; Caspi, E.N.; Yeheskel, O. Structural investigation of selective laser melting and electron beam melting of T6Al-4V using neutron diffraction. Addit. Manuf. 2016, 10, 43–46. [Google Scholar] [CrossRef]
- Tang, H.P.; Qian, M.; Liu, N.; Zhang, X.Z.; Yang, G.Y.; Wang, J. Effect of Powder Reuse Times on Additive Manufacturing of Ti-6Al-4V by Selective Electron Beam Melting. J. Met. 2015, 67, 555–563. [Google Scholar] [CrossRef]
- Cordero, Z.C.; Meyer, H.M.; Nandwana, P.; Dehoff, R.R. Powder bed charging during electron-beam additive manufacturing. Acta Mater. 2017, 124, 437–445. [Google Scholar] [CrossRef]
- ASTM F2924-14, Standard Specification for Additive Manufacturing Titanium-6 Aluminum-4 Vanadium with Powder Bed Fusion; ASTM International: West Conshohocken, PA, USA, 2014.
- Yeheskel, O.; Shokhat, M.; Salhov, S.; Tevet, O. Effect of initial particle and agglomerate size elastic moduli of porous yttria (Y2O3). J. Am. Ceram. Soc. 2009, 93, 2028–2034. [Google Scholar] [CrossRef]
- Sol, T.; Hayun, S.; Noiman, D.; Tiferet, E.; Yeheskel, O.; Tevet, O. Nondestructive ultrasonic evaluation of additively manufactured AlSi10Mg samples. Addit. Manuf. 2018, 22, 700–707. [Google Scholar] [CrossRef]
- ASTM E8/E8M-15a, Standard Test Methods for Tension Testing of Metallic Materials; ASTM International: West Conshohocken, PA, USA, 2015.
- Yeheskel, O.; Tevet, O. Elastic moduli of transparent yttria. J. Am. Ceram. Soc. 1999, 82, 136–144. [Google Scholar] [CrossRef]
- Vogel, S.C.; Takajo, S.; Kumar, M.A.; Caspi, E.N.; Pesach, A.; Tiferet, E.; Yeheskel, O. Ambient and High Temperature Bulk Characterization of Additively Manufactured Ti-6Al-4V Using Neutron Diffraction. JOM 2018, 70, 1714–1722. [Google Scholar] [CrossRef]
- Draper, S.L.; Lerch, B.A.; Telesman, J.; Martin, R.E.; Locci, I.E.; Ring, A.G.A.J. Materials Characterization of Electron Beam Melted Ti-6Al-4V. U.S. Patent NASA/TM—2016-219136, 1 September 2016. [Google Scholar]


| Element | Ti | Al | V | Fe | O | C | H |
|---|---|---|---|---|---|---|---|
| ASTM F2924 | Balance | 5.5–6.75 | 3.5–4.5 | <0.3 | <0.2 | <0.08 | <0.0015 |
| Average ±S † [%] | 89.0 ± 0.22 | 6.5 ± 0.13 | 3.86 ± 0.04 | 0.27 ± 0.05 | 0.34 ± 0.01 | 0.031 ± 0.001 | 0.0027 ± 0.0008 |
| Property | Young’s Modulus, E, GPa | Proof Stress, Rp0.2, MPa | Tensile Strength Rm, MPa | Elongation, e, % | Reduction of Area, A, % | Number of Samples |
|---|---|---|---|---|---|---|
| ASTM F2914 Requirements | 825 min | 895 min | 10 min | 15 min | ||
| Average and standard deviation, As-built | 118.8 ± 3.8 | 1036 ± 17 | 1122 ± 22 | 9.8 ± 3.8 | 11.5 ± 5.6 | 12 |
| Average and standard deviation, HIP | 119.5 ± 5.3 | 971 ± 20 | 1086 ± 19 | 18.9 ± 3.1 | 38.3 ± 11 | 6 |
| Average and standard deviation, HIP | 120.0 ± 5.8 | 976 ± 19 | 1090 ± 18 | 20.1 ± 0.7 | 42.8 ± 2.2 | 5 |
| Sample Designation | Density [kg/m3] | VL [m/s] | VS [m/s] | E [GPa] | G [GPa] | ν |
|---|---|---|---|---|---|---|
| A3 | 4422 ± 3 | 6201 ± 1 | 3213 ± 2 | 120.2 ± 0.3 | 45.7 ± 0.1 | 0.316 ± 0.005 |
| H3 | 4422 ± 3 | 6233 ± 4 | 3222 ± 2 | 121.0 ± 0.3 | 45.9 ± 0.1 | 0.318 ± 0.006 |
| O3 | 4222 ± 3 | 6212 ± 14 | 3211 ± 2 | 120.1 ± 0.4 | 45.6 ± 0.1 | 0.318 ± 0.007 |
© 2019 by the authors. Licensee MDPI, Basel, Switzerland. This article is an open access article distributed under the terms and conditions of the Creative Commons Attribution (CC BY) license (http://creativecommons.org/licenses/by/4.0/).
Share and Cite
Tiferet, E.; Ganor, M.; Zolotaryov, D.; Garkun, A.; Hadjadj, A.; Chonin, M.; Ganor, Y.; Noiman, D.; Halevy, I.; Tevet, O.; et al. Mapping the Tray of Electron Beam Melting of Ti-6Al-4V: Properties and Microstructure. Materials 2019, 12, 1470. https://doi.org/10.3390/ma12091470
Tiferet E, Ganor M, Zolotaryov D, Garkun A, Hadjadj A, Chonin M, Ganor Y, Noiman D, Halevy I, Tevet O, et al. Mapping the Tray of Electron Beam Melting of Ti-6Al-4V: Properties and Microstructure. Materials. 2019; 12(9):1470. https://doi.org/10.3390/ma12091470
Chicago/Turabian StyleTiferet, E., M. Ganor, D. Zolotaryov, A. Garkun, A. Hadjadj, M. Chonin, Y. Ganor, D. Noiman, I. Halevy, O. Tevet, and et al. 2019. "Mapping the Tray of Electron Beam Melting of Ti-6Al-4V: Properties and Microstructure" Materials 12, no. 9: 1470. https://doi.org/10.3390/ma12091470
APA StyleTiferet, E., Ganor, M., Zolotaryov, D., Garkun, A., Hadjadj, A., Chonin, M., Ganor, Y., Noiman, D., Halevy, I., Tevet, O., & Yeheskel, O. (2019). Mapping the Tray of Electron Beam Melting of Ti-6Al-4V: Properties and Microstructure. Materials, 12(9), 1470. https://doi.org/10.3390/ma12091470