Abstract
In this work, we employ computational modeling techniques to study the defect chemistry, Na ion diffusion paths, and dopant properties in sodium iron phosphate [Na3Fe2(PO4)3] cathode material. The lowest intrinsic defect energy process (0.45 eV/defect) is calculated to be the Na Frenkel, which ensures the formation of Na vacancies required for the vacancy-assisted Na ion diffusion. A small percentage of Na-Fe anti-site defects would be expected in Na3Fe2(PO4)3 at high temperatures. Long-range diffusion of Na is found to be low and its activation energy is calculated to be 0.45 eV. Isovalent dopants Sc, La, Gd, and Y on the Fe site are exoergic, meaning that they can be substituted experimentally and should be examined further. The formation of Na vacancies and Na interstitials in this material can be facilitated by doping with Zr on the Fe site and Si on the P site, respectively.
1. Introduction
Rechargeable sodium ion batteries (SIBs) have gained considerable attention for the development of large-scale energy storage applications due to the high abundance, low cost, and non-toxicity of sodium [1,2,3,4,5]. In practice, there are only a few electrode materials that have been reported. This is due to the larger ionic radius of Na compared to that of Li. Designing a new Na-based electrode material consisting of an appropriate transition metal with a high electrochemical performance could make this material promising.
A number of iron-based phosphate cathode materials [6,7,8,9,10] were proposed for Li-ion batteries due to the structural stability and high redox potential provided by the PO43− matrix. Although similar iron-based cathode materials can be prepared for NIBs in theory, only a few of them, including NaFePO4 [11], Na2FeP2O7 [12], Na3V2(PO4)3 [13] and Na4Fe3(PO4)2P2O7 [14], have been reported in the literature.
Recently, monoclinic phase Na3Fe2(PO4)3 was synthesized using the solid state method and examined as a cathode material for SIBs [15]. This material showed a very high cyclic stability and a reversible discharge capacity of 40 mA·h·g−1 with a flat plateau at about 2.5 V. Rajagopalan et al. [16] studied the electrochemical performance and reversible capacity of Na3Fe2(PO4)3. Their study shows that the discharge specific capacity and cycling stability can be improved by wrapping Na3Fe2(PO4)3 with conducting carbon. There are no further experimental or theoretical studies available on Na3Fe2(PO4)3 for the use of this material in rechargeable SIBs.
A fundamental understanding of Na3Fe2(PO4)3 gained through computational simulation techniques based on the classical pair-potentials can be used to optimize its performance as these techniques have been useful in experimental characterization, the prediction of ion pathways, and the determination of promising dopants. This technique has been used in a variety of oxide materials, including electrode materials for lithium and sodium ion batteries [17,18,19,20,21,22,23,24,25,26,27,28,29,30,31,32,33,34,35,36,37,38]. In this work, we have used classical pair-potential simulation to examine possible defects that can be observed in Na3Fe2(PO4)3, Na ion migration pathways and the solution of trivalent dopants (Al3+, Ga3+, Sc3+, Y3+, Gd3+ and La3+) on the Fe site and tetravalent dopants (Si4+, Ge4+, Ti4+, Sn4+, Zr4+ and Ce4+) on the Fe and P sites.
2. Computational Methods
The calculations employed in this study are based on the classical pair wise potentials. The General Utility Lattice Program (GULP) [39] was used. This code uses ion-ion interactions in the form of long-range (i.e., Coulombic) attraction and short-range repulsion (i.e., Pauli electron-electron) and attraction (dispersion). We used the Buckingham potentials (refer to Table S1 in the Supplementary Information) to model short-range interaction.
Bulk Na3Fe2(PO4)3 and defect configurations were optimized using the Broyden-Fletcher-Goldfarb-Shanno (BFGS) algorithm [40], as implemented in the GULP code. The forces on the atoms were below 0.001 eV/Å in all cases. The Mott-Littleton method [41] was employed to model point defects. This methodology has been well-explained in previous studies. The current simulation is expected to overestimate the defect enthalpies. This is due to the spherical shape of the ions with a low concentration. Nevertheless, trends in relative energies are expected to be consistent.
The present atomistic simulations use isobaric parameters in the calculations of formation and migration energies. The detailed thermodynamic relations associated with isobaric parameters are discussed in previous theoretical work [42,43,44,45,46,47].
3. Results and Discussion
3.1. Bulk Na3Fe2(PO4)3 Structure
Bulk Na3Fe2 (PO4)3 belongs to the monoclinic crystal system (space group C2/c). The crystal structure of Na3Fe2(PO4)3 is shown in Figure 1. Its lattice parameters (a = 15.070 Å, b = 8.740 Å, c = 8.724 Å, α = γ = 90.0° and β = 125.1°) were determined by Fanjet et al. [48] in their powder neutron diffraction study. The crystal structure consists of FeO6 octahedra and PO4 tetrahedra units sharing their corners.
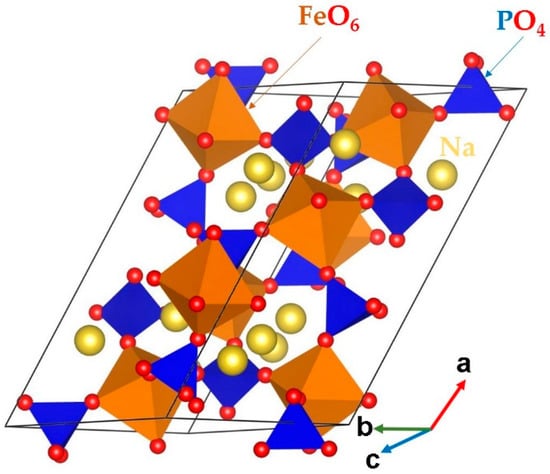
Figure 1.
Crystal structure of Na3Fe2(PO4)3 (space group C2/c).
In order to validate the interatomic potentials used in this study, a bulk Na3Fe2(PO4)3 structure was optimized under constant pressure. The difference between the calculated equilibrium lattice constants and its corresponding experimental values is less than 1.5%, showing the good reproduction and the suitability of these potential parameters for defect modeling. Table 1 lists the calculated and experimental values together with the error percentages.

Table 1.
Comparison of experimental and calculated values of monoclinic (C2/c) Na3Fe2(PO4)3.
3.2. Intrinsic Defect Process
Here, we consider the formation of point defects (vacancies and interstitials) to calculate the Schottky and Frenkel defect processes. The Na-Fe anti-site defect process is also considered. The intrinsic point defects are important as they stimulate the ions to diffuse in the lattice. The point defects were combined to construct reaction energy processes (Schottky, Frenkel and anti-site) using Kröger-Vink notation [49]. The reaction equations are as follows:
The energetics for the defect processes are shown in Figure 2. Our calculations show that the Na Frenkel is the lowest defect energy process (0.45 eV/defect), indicating that the formation of Na vacancies is facilitated by this process. Thus, this process would accelerate the vacancy-aided Na diffusion. The Na-Fe anti-site defect is found to be the second most favorable defect energy process (1.12 eV/defect). In this defect, a small population of Na on the Fe site and Fe on the Na site would be observed. This defect has been found in a variety of battery materials both experimentally and theoretically [17,18,19,50,51,52,53]. The formation of Na2O is calculated to be a 2.46 eV/defect, suggesting that there is a possibility of Na2O loss in this material at high temperatures. Other defect processes are relatively high energy, meaning that they cannot be observed under standard battery operating conditions.
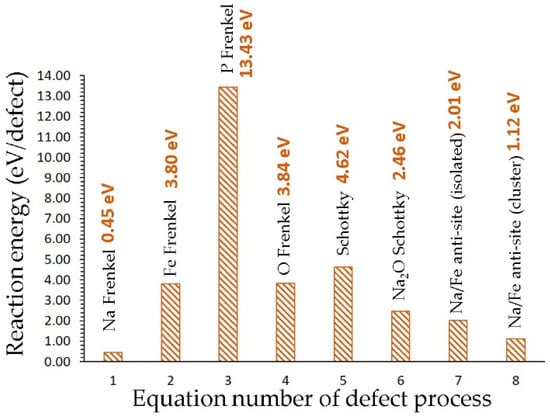
Figure 2.
Energetics of intrinsic defect processes.
3.3. Sodium Ion Diffusion
The diffusion of Na ions with a low migration barrier is a key requirement for a promising cathode material. There is no experimental report on the Na ion migration pathways in Na3Fe2(PO4)3. Using the current methodology, it is possible to calculate the Na ion diffusion pathways and activation energies. Three different local Na vacancy migration hops (refer to Figure 3) were calculated. Table 2 lists the Na-Na separations together with the activation energies. Energy profile diagrams together with activation energies for local Na hops are shown in Figure 4. The lowest activation energy (0.44 eV) is calculated for hop A in which Na migrates along the bc plane. Hop B exhibits an activation energy of 0.45 eV, which is very close to the value calculated for hop B. The highest activation energy (2.37 eV) is calculated for hop C. Both hops B and C are also along the bc plane.
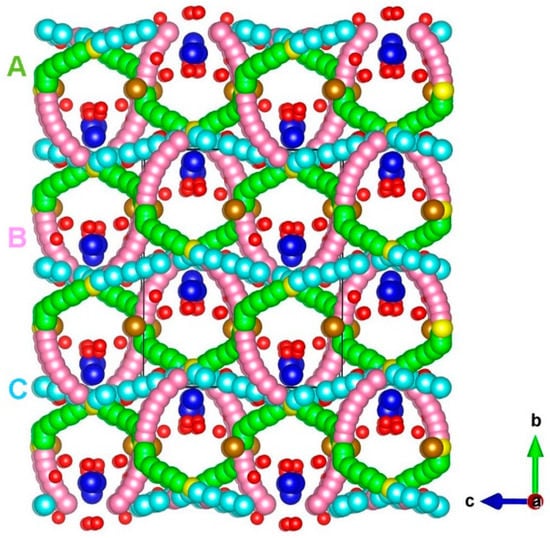
Figure 3.
Na ion diffusion paths calculated in Na3Fe2(PO4)3. Green, purple, and light blue atoms correspond to different local Na ion hopping trajectories.
Table 2.
Na-Na separations and their activation energies for the Na ion migration, as shown in Figure 3.
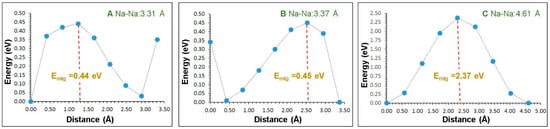
Figure 4.
Three different energy profile diagrams for Na local hops, as shown in Figure 3. (A–C) correspond to the local Na–Na hops.
We examined possible long-range Na ion pathways linked by local Na hops. Three possible long-range Na ion paths and their corresponding overall activation energies are listed in Table 3. The lowest activation energy of the migration (0.45) pathway consists of local hops A and B (A–A–B–B) along the bc plane. The other two pathways have higher activation energies of 2.37 eV due to the presence of local hop C.
Table 3.
Long-range Na ion diffusion paths and their overall activation energies.
Clark et al. [54] used classical atomistic simulation to calculate the activation energy of Na ions in Na2FeP2O7. In their study, three-dimensional long-range Na ion migration paths were observed in different directions with activation energies in the range of 0.33–0.49 eV. Sodium ion migration paths together with activation energies were calculated in “olivine” NaFePO4 material [55]. The lowest energy path was observed along the [010] direction with the activation energy of 0.30 eV. The current activation energy value of 0.45 eV calculated for long-range Na ion migration in Na3Fe2(PO4)3 suggests that this material is also a promising cathode material competitive with the other Fe-based polyanions materials for Na-ion batteries.
3.4. Isovalent Doping
Solutions of isovalent dopants (Al, Ga, Sc, Y, Gd, and La) were considered on the Fe site. The selection of trivalent dopants with a wide range of ionic radii is based on previous studies that considered these dopants in different materials, including phosphate-based battery materials [23,56,57,58]. Though they exhibit a high atomic weight, low abundance, or high cost, low-level doping of Na3Fe2(PO4)3 can exhibit improvement in electronic conductivity. The solution enthalpy was calculated using the following reaction:
Figure 5 reports the solution enthalpies of M3+ ions on the Fe site. The lowest solution energy is calculated for Sc. Solutions of La and Gd are also promising as they exhibit negative values. Yttrium shows a small but negative solution enthalpy. The solution enthalpy of Al is highly endoergic, suggesting that it cannot be doped under normal conditions. Dopants exhibiting endoergic solution enthalpies can be doped experimentally to prepare [Na3(FexM1−x)2(PO4)3; M = Sc, La, Gd and Y; x = 0–1] composites. Such composites may have the different chemical, electronic, and mechanical properties required for different purposes. Gaining knowledge on the exact composition requires experiments.
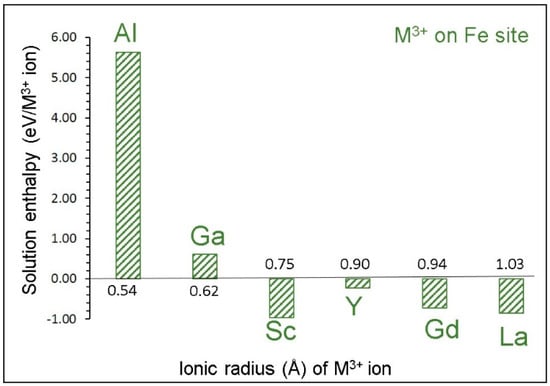
Figure 5.
Solution enthalpies calculated for R2O3 (R= Al, Ga, Sc, Y, Gd and La) with respect to the M3+ radius in an octahedral coordination.
3.5. Tetravalent Doping
Both the Fe and P sites were considered for tetravalent dopants (Si, Ge, Ti, Sn, Zr, and C). It is possible to form Na vacancies by doping with M4+ ions on the Fe site. Such vacancies facilitate Na ion migration in this material. The following reaction equation was constructed:
Solution enthalpies are shown in Figure 6a. In all cases, high solution enthalpies (>3 eV) are observed, suggesting that the formation of Na vacancies are unlikely at normal temperatures. The lowest solution enthalpy is calculated for Zr. Solution enthalpies for Ge and Sn are very close to the value calculated for Zr. The Si exhibits the highest solution enthalpy.
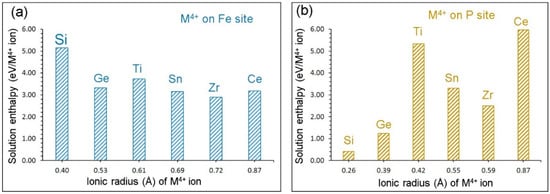
Figure 6.
Solution enthalpies calculated for RO2 (R = Si, Ge, Ti, Sn, Zr and Ce) on (a) the Fe site and (b) the P site with respect to the M4+ radius in an octahedral and tetrahedral coordination, respectively.
Doping with M4+ ions on the P site can lead to the formation of Na interstitials, as shown in Equation (11). This engineering strategy in turn would enhance the capacity of Na3Fe2(PO4)3.
Solution enthalpies calculated for this process are shown in Figure 6b. The promising candidate is Si as its solution enthalpy is 0.41 eV. The Ge exhibits a slightly higher (1.23 eV) solution enthalpy. Other dopants have solution enthalpies greater than 2.50 eV, meaning that they should be doped at high temperatures. The highest solution enthalpy (5.98 eV) is calculated for Ce.
4. Conclusions
Atomistic simulation techniques were employed to examine the defects, Na ion migration pathways, and a variety of isovalent and isovalent dopants on the Fe site in Na3Fe2(PO4)3. The lowest energy defect process is the Na Frenkel, suggesting that the Na diffusion in this material would be assisted by Na vacancies. The Na-Fe anti-site defect is calculated to be the second lowest energy process, meaning that a small population of Na and Fe ions exchange their positions. The diffusion of Na is calculated to be low in this material and Na ion migrates via the bc plane with the activation energy of 0.45 eV. The favorable isovalent dopants on the Fe site are Sc, La, Gd, and Y, meaning that the synthesis of [Na3(FexM1−x)2(PO4)3 M = Sc, La, Gd and Y] is worth investigating experimentally. Doping with Zr on the Fe site can increase the concentration of Na vacancies needed for the Na ion diffusion, while doping with Si on the P site can facilitate the formation of Na interstitials required for the improvement in the capacity of Na3Fe2(PO4)3.
Supplementary Materials
The following are available online at https://www.mdpi.com/1996-1944/12/8/1348/s1: Table S1: Interatomic potential parameters used in the atomistic simulations of Na3Fe2(PO4)3.
Author Contributions
Computation, N.K.; Writing, N.K.; Analysis and Editing, A.C.
Funding
This research was financially supported by the European Union’s H2020 Programme under Grant Agreement no. 824072–HARVESTORE.
Acknowledgments
We acknowledge Imperial College for providing high performance computing facilities.
Conflicts of Interest
The authors declare no conflict of interest.
References
- Ellis, B.L.; Nazar, L.F. Sodium and sodium-ion energy storage batteries. Curr. Opin. Solid State Mater. Sci. 2012, 16, 168–177. [Google Scholar] [CrossRef]
- Yabuuchi, N.; Kubota, K.; Dahbi, M.; Komaba, S. Research Development on Sodium-Ion Batteries. Chem. Rev. 2014, 114, 11636–11682. [Google Scholar] [CrossRef] [PubMed]
- Palomares, V.; Casas-Cabanas, M.; Castillo-Martinez, E.; Han, M.H.; Rojo, T. Update on Na-based battery materials. A growing research path. Energy Environ. Sci. 2013, 6, 2312–2337. [Google Scholar] [CrossRef]
- Hwang, J.-Y.; Myung, S.-T.; Sun, Y.-K. Sodium-ion batteries: Present and future. Chem. Soc. Rev. 2017, 46, 3529–3614. [Google Scholar] [CrossRef]
- Li, L.; Zheng, Y.; Zhang, S.; Yang, J.; Shao, Z.; Guo, Z. Recent progress on sodium ion batteries: Potential high-performance anodes. Energy Environ. Sci. 2018, 11, 2310–2340. [Google Scholar] [CrossRef]
- Padhi, A.K.; Nanjundaswamy, K.S.; Goodenough, J.B. Phospho-olivines as Positive-Electrode Materials for Rechargeable Lithium Batteries. J. Electrochem. Soc. 1997, 144, 1188–1194. [Google Scholar] [CrossRef]
- Ellis, B.L.; Makahnouk, W.R.M.; Makimura, Y.; Toghill, K.; Nazar, L.F. A multifunctional 3.5 V iron-based phosphate cathode for rechargeable batteries. Nat. Mater. 2007, 6, 749. [Google Scholar] [CrossRef]
- Nishimura, S.-I.; Nakamura, M.; Natsui, R.; Yamada, A. New Lithium Iron Pyrophosphate as 3.5 V Class Cathode Material for Lithium Ion Battery. J. Am. Chem. Soc. 2010, 132, 13596–13597. [Google Scholar] [CrossRef]
- Nishimura, S.-I.; Kobayashi, G.; Ohoyama, K.; Kanno, R.; Yashima, M.; Yamada, A. Experimental visualization of lithium diffusion in LixFePO4. Nat. Mater. 2008, 7, 707. [Google Scholar] [CrossRef]
- Tan, H. Nanostructured Li3V2(PO4)3 Cathodes. Small 2018, 14, 1800567. [Google Scholar] [CrossRef]
- Fang, Y.; Liu, Q.; Xiao, L.; Ai, X.; Yang, H.; Cao, Y. High-Performance Olivine NaFePO4 Microsphere Cathode Synthesized by Aqueous Electrochemical Displacement Method for Sodium Ion Batteries. ACS Appl. Mater. Interfaces 2015, 7, 17977–17984. [Google Scholar] [CrossRef]
- Barpanda, P.; Liu, G.; Ling, C.D.; Tamaru, M.; Avdeev, M.; Chung, S.-C.; Yamada, Y.; Yamada, A. Na2FeP2O7: A Safe Cathode for Rechargeable Sodium-ion Batteries. Chem. Mater. 2013, 25, 3480–3487. [Google Scholar] [CrossRef]
- Zhang, X.; Rui, X.; Chen, D.; Tan, H.; Yang, D.; Huang, S.; Yu, Y. Na3V2(PO4)3: An advanced cathode for sodium-ion batteries. Nanoscale 2019, 11, 2556–2576. [Google Scholar] [CrossRef]
- Fernández-Ropero, A.J.; Zarrabeitia, M.; Reynaud, M.; Rojo, T.; Casas-Cabanas, M. Toward Safe and Sustainable Batteries: Na4Fe3(PO4)2P2O7 as a Low-Cost Cathode for Rechargeable Aqueous Na-Ion Batteries. J. Phys. Chem. C 2018, 122, 133–142. [Google Scholar] [CrossRef]
- Liu, Y.; Zhou, Y.; Zhang, J.; Xia, Y.; Chen, T.; Zhang, S. Monoclinic Phase Na3Fe2(PO4)3: Synthesis, Structure, and Electrochemical Performance as Cathode Material in Sodium-Ion Batteries. ACS Sustain. Chem. Eng. 2017, 5, 1306–1314. [Google Scholar] [CrossRef]
- Rajagopalan, R.; Chen, B.; Zhang, Z.; Wu, X.-L.; Du, Y.; Huang, Y.; Li, B.; Zong, Y.; Wang, J.; Nam, G.-H.; et al. Improved Reversibility of Fe3+/Fe4+ Redox Couple in Sodium Super Ion Conductor Type Na3Fe2(PO4)3 for Sodium-Ion Batteries. Adv. Mater. 2017, 29, 1605694. [Google Scholar] [CrossRef]
- Kuganathan, N.; Islam, M.S. Li2MnSiO4 Lithium Battery Material: Atomic-Scale Study of Defects, Lithium Mobility, and Trivalent Dopants. Chem. Mater. 2009, 21, 5196–5202. [Google Scholar] [CrossRef]
- Fisher, C.A.J.; Kuganathan, N.; Islam, M.S. Defect chemistry and lithium-ion migration in polymorphs of the cathode material Li2MnSiO4. J. Mater. Chem. A 2013, 1, 4207–4214. [Google Scholar] [CrossRef]
- Armstrong, A.R.; Kuganathan, N.; Islam, M.S.; Bruce, P.G. Structure and Lithium Transport Pathways in Li2FeSiO4 Cathodes for Lithium Batteries. J. Am. Chem. Soc. 2011, 133, 13031–13035. [Google Scholar] [CrossRef]
- Jay, E.E.; Rushton, M.J.D.; Chroneos, A.; Grimes, R.W.; Kilner, J.A. Genetics of superionic conductivity in lithium lanthanum titanates. Phys. Chem. Chem. Phys. 2015, 17, 178–183. [Google Scholar] [CrossRef]
- Grimes, R.W.; Busker, G.; McCoy, M.A.; Chroneos, A.; Kilner, J.A.; Chen, S.-P. The Effect of Ion Size on Solution Mechanism and Defect Cluster Geometry. Bunsen-Gesellschaft Für Physikalische Chemie 1997, 101, 1204–1210. [Google Scholar] [CrossRef]
- Seymour, I.D.; Chroneos, A.; Kilner, J.A.; Grimes, R.W. Defect processes in orthorhombic LnBaCo2O5.5 double perovskites. Phys. Chem. Chem. Phys. 2011, 13, 15305–15310. [Google Scholar] [CrossRef]
- Fisher, C.A.J.; Hart Prieto, V.M.; Islam, M.S. Lithium Battery Materials LiMPO4 (M = Mn, Fe, Co, and Ni): Insights into Defect Association, Transport Mechanisms, and Doping Behavior. Chem. Mater. 2008, 20, 5907–5915. [Google Scholar] [CrossRef]
- Islam, M.S.; Driscoll, D.J.; Fisher, C.A.J.; Slater, P.R. Atomic-Scale Investigation of Defects, Dopants, and Lithium Transport in the LiFePO4 Olivine-Type Battery Material. Chem. Mater. 2005, 17, 5085–5092. [Google Scholar] [CrossRef]
- Kuganathan, N.; Kordatos, A.; Anurakavan, S.; Iyngaran, P.; Chroneos, A. Li3SbO4 lithium-ion battery material: Defects, lithium ion diffusion and tetravalent dopants. Mater. Chem. Phys. 2019, 225, 34–41. [Google Scholar] [CrossRef]
- Kordatos, A.; Kuganathan, N.; Kelaidis, N.; Iyngaran, P.; Chroneos, A. Defects and lithium migration in Li2CuO2. Sci. Rep. 2018, 8, 6754. [Google Scholar] [CrossRef]
- Kuganathan, N.; Chroneos, A. Defects, Dopants and Sodium Mobility in Na2MnSiO4. Sci. Rep. 2018, 8, 14669. [Google Scholar] [CrossRef]
- Kuganathan, N.; Chroneos, A. Defects and dopant properties of Li3V2(PO4)3. Sci. Rep. 2019, 9, 333. [Google Scholar] [CrossRef]
- Kuganathan, N.; Ganeshalingam, S.; Chroneos, A. Defects, Dopants and Lithium Mobility in Li9V3(P2O7)3(PO4)2. Sci. Rep. 2018, 8, 8140. [Google Scholar] [CrossRef]
- Kuganathan, N.; Iyngaran, P.; Chroneos, A. Lithium diffusion in Li5FeO4. Sci. Rep. 2018, 8, 5832. [Google Scholar] [CrossRef]
- Kuganathan, N.; Iyngaran, P.; Vovk, R.; Chroneos, A. Defects, dopants and Mg diffusion in MgTiO3. Sci. Rep. 2019, 9, 4394. [Google Scholar] [CrossRef]
- Kuganathan, N.; Kordatos, A.; Chroneos, A. Li2SnO3 as a Cathode Material for Lithium-ion Batteries: Defects, Lithium Ion Diffusion and Dopants. Sci. Rep. 2018, 8, 12621. [Google Scholar] [CrossRef]
- Kuganathan, N.; Kordatos, A.; Chroneos, A. Defect Chemistry and Li-ion Diffusion in Li2RuO3. Sci. Rep. 2019, 9, 550. [Google Scholar] [CrossRef]
- Kuganathan, N.; Kordatos, A.; Kelaidis, N.; Chroneos, A. Defects, Lithium Mobility and Tetravalent Dopants in the Li3NbO4 Cathode Material. Sci. Rep. 2019, 9, 2192. [Google Scholar] [CrossRef]
- Kuganathan, N.; Kordatos, A.; Fitzpatrick, M.E.; Vovk, R.V.; Chroneos, A. Defect process and lithium diffusion in Li2TiO3. Solid State Ion. 2018, 327, 93–98. [Google Scholar] [CrossRef]
- Kuganathan, N.; Tsoukalas, L.H.; Chroneos, A. Defects, dopants and Li-ion diffusion in Li2SiO3. Solid State Ion. 2019, 335, 61–66. [Google Scholar] [CrossRef]
- Kuganathan, N.; Chroneos, A. Na3V(PO4)2 cathode material for Na ion batteries: Defects, dopants and Na diffusion. Solid State Ion. 2019, 336, 75–79. [Google Scholar] [CrossRef]
- Kuganathan, N.; Sgourou, N.E.; Panayiotatos, Y.; Chroneos, A. Defect Process, Dopant Behaviour and Li Ion Mobility in the Li2MnO3 Cathode Material. Energies 2019, 12, 1329. [Google Scholar] [CrossRef]
- Gale, J.D.; Rohl, A.L. The General Utility Lattice Program (GULP). Mol. Simul. 2003, 29, 291–341. [Google Scholar] [CrossRef]
- Gale, J.D. GULP: A computer program for the symmetry-adapted simulation of solids. J. Chem. Soc. Faraday Trans. 1997, 93, 629–637. [Google Scholar] [CrossRef]
- Mott, N.F.; Littleton, M.J. Conduction in polar crystals. I. Electrolytic conduction in solid salts. Trans. Faraday. Soc. 1938, 34, 485–499. [Google Scholar] [CrossRef]
- Varotsos, P. Defect volumes and the equation of state in α-PbF2. Phys. Rev. B 2007, 76, 092106. [Google Scholar] [CrossRef]
- Varotsos, P. Comparison of models that interconnect point defect parameters in solids with bulk properties. J. Appl. Phys. 2007, 101, 123503. [Google Scholar] [CrossRef]
- Chroneos, A.; Vovk, R.V. Modeling self-diffusion in UO2 and ThO2 by connecting point defect parameters with bulk properties. Solid State Ion. 2015, 274, 1–3. [Google Scholar] [CrossRef]
- Cooper, M.W.D.; Grimes, R.W.; Fitzpatrick, M.E.; Chroneos, A. Modeling oxygen self-diffusion in UO2 under pressure. Solid State Ion. 2015, 282, 26–30. [Google Scholar] [CrossRef]
- Varotsos, P. Point defect parameters in β-PbF2 revisited. Solid State Ion. 2008, 179, 438–441. [Google Scholar] [CrossRef]
- Sarlis, N.V.; Skordas, E.S. Interconnection of a thermodynamical model for point defect parameters in solids with the dynamical theory of diffusion. Solid State Ion. 2019, 335, 82–85. [Google Scholar] [CrossRef]
- Fanjat, N.; Soubeyroux, J.L. Powder neutron diffraction study of Fe2Na3(PO4)3 in the low temperature phase. J. Magn. Magn. Mater. 1992, 104, 933–934. [Google Scholar] [CrossRef]
- Kröger, F.A.; Vink, H.J. Relations between the Concentrations of Imperfections in Crystalline Solids. In Solid State Physics; Academic Press: New York, NY, USA, 1956; pp. 307–435. [Google Scholar]
- Politaev, V.V.; Petrenko, A.A.; Nalbandyan, V.B.; Medvedev, B.S.; Shvetsova, E.S. Crystal structure, phase relations and electrochemical properties of monoclinic Li2MnSiO4. J. Solid State Chem. 2007, 180, 1045–1050. [Google Scholar] [CrossRef]
- Ensling, D.; Stjerndahl, M.; Nytén, A.; Gustafsson, T.; Thomas, J.O. A comparative XPS surface study of Li2FeSiO4/C cycled with LiTFSI- and LiPF6-based electrolytes. J. Mater. Chem. 2009, 19, 82–88. [Google Scholar] [CrossRef]
- Liu, H.; Choe, M.-J.; Enrique, R.A.; Orvañanos, B.; Zhou, L.; Liu, T.; Thornton, K.; Grey, C.P. Effects of Antisite Defects on Li Diffusion in LiFePO4 Revealed by Li Isotope Exchange. J. Phys. Chem. C 2017, 121, 12025–12036. [Google Scholar] [CrossRef]
- Kempaiah Devaraju, M.; Duc Truong, Q.; Hyodo, H.; Sasaki, Y.; Honma, I. Synthesis, characterization and observation of antisite defects in LiNiPO4 nanomaterials. Sci. Rep. 2015, 5, 11041. [Google Scholar] [CrossRef]
- Clark, J.M.; Barpanda, P.; Yamada, A.; Islam, M.S. Sodium-ion battery cathodes Na2FeP2O7 and Na2MnP2O7: Diffusion behavior for high rate performance. J. Mater. Chem. A 2014, 2, 11807–11812. [Google Scholar] [CrossRef]
- Tripathi, R.; Wood, S.M.; Islam, M.S.; Nazar, L.F. Na-ion mobility in layered Na2FePO4F and olivine Na[Fe,Mn]PO4. Energy Environ. Sci. 2013, 6, 2257–2264. [Google Scholar] [CrossRef]
- Liang, L.; Sun, X.; Zhang, J.; Sun, J.; Hou, L.; Liu, Y.; Yuan, C. Sur-/interfacial regulation in all-solid-state rechargeable Li-ion batteries based on inorganic solid-state electrolytes: Advances and perspectives. Mater. Horizons 2019. [Google Scholar] [CrossRef]
- Bévillon, É.; Hermet, J.; Dezanneau, G.; Geneste, G. How dopant size influences the protonic energy landscape in BaSn1−xMxO3−x/2 (M = Ga, Sc, In, Y, Gd, La). J. Mater. Chem. A 2014, 2, 460–471. [Google Scholar] [CrossRef]
- Chung, S.-Y.; Bloking, J.T.; Chiang, Y.-M. Electronically conductive phospho-olivines as lithium storage electrodes. Nat. Mater. 2002, 1, 123–128. [Google Scholar] [CrossRef]
© 2019 by the authors. Licensee MDPI, Basel, Switzerland. This article is an open access article distributed under the terms and conditions of the Creative Commons Attribution (CC BY) license (http://creativecommons.org/licenses/by/4.0/).