Article

Terbium Ion Adsorption from Aqueous Solution by Using Magnetic γ-Fe2O3-NH4OH@SiO2 Nanoparticles Functionalized with Amino Groups

1
Faculty of Chemistry and Chemical Engineering, University of Maribor, Smetanova 17, SI-2000 Maribor, Slovenia
2
Institute for Environmental Protection and Sensors, Beloruska 7, SI-2000 Maribor, Slovenia
3
Faculty of Mechanical Engineering, University of Maribor, Smetanova 17, SI-2000 Maribor, Slovenia
*
Authors to whom correspondence should be addressed.
Materials 2019, 12(8), 1294; https://doi.org/10.3390/ma12081294
Submission received: 19 March 2019 / Revised: 15 April 2019 / Accepted: 18 April 2019 / Published: 19 April 2019
(This article belongs to the Special Issue Advances in Microporous and Mesoporous Materials)

Abstract

:
New magnetic stabilized and functionalized core@shell nanoparticles (NPs) were synthesized in a simple way and characterized in order to adsorb Tb3+ from aqueous solution with a very low Tb3+ concentration. For the fluorescence determination of adsorption efficiency and capacity, tiron monohydrate as a ligand was used. The obtained results confirm the potential of the synthesized magnetic γ-Fe2O3-NH4OH@SiO2 NPs, functionalized with (3-Aminopropyl) trimethoxysilane (APTMS), to be used for adsorption of Tb3+ from aqueous solution, with the possibility of its removal from aqueous solution via an external magnet. The endothermic and spontaneous adsorption follows a pseudo-second-order kinetic model, and the adsorption equilibrium data fit the Temkin isotherm well. The maximum adsorption efficiency from aqueous solution with a 2 × 10⁻⁶ M concentration of Tb3+ is over 90% at pH 7.

Graphical Abstract

1. Introduction

Rare earth elements (REEs) are used as components in the energy and transport sectors, environmental protection, digital technology, and medical applications in order to reduce energy consumption, improve mobility and reduce weight, reduce emissions, improve lifestyle and communication, improve medical therapy, and improve life [1,2,3,4]. Due to their low natural abundance and high production demands, Nd, Y, Eu, Tb, and Dy are considered to be the most economically critical REEs [5]. The balance between the natural abundances of the REEs in ores and the economic market demand is a major balance problem for producers of these elements [6,7]. The main source of REEs is China, which has abundant REEs reserves and advanced processing technologies [7,8,9]. In order to solve the balance problem as well as to reduce the dependence on China, the recycling market for REEs has great potential due to the increasing consumption of REE-containing products. As REEs are important for many electronic products, many nations have started looking for alternative supplies of these elements. One potential source of REEs-containing waste is scrapped electronics. In E.U. countries, electronic waste could in theory cover a significant part of the demand for REEs. Furthermore, recycling of REEs should be an important part of a circular economy, especially considering the large resource demands and negative environmental impact of current REEs production processes.
The REEs recycling methods include pyro-metallurgical, electrochemical, and hydrometallurgical approaches [10,11]. Hydrometallurgical methods, such as precipitation, solvent extraction, and adsorption, play a major part in any process developed to recover REEs from a solution. Precipitation and solvent extraction are well-established techniques that are particularly useful for solutions containing high concentrations of the target REE3+, and adsorption can be used to recover REE3+ even from low-concentration sources [12,13,14,15]. Among the available methods, adsorption has gained wider attention because of its simplicity, high efficiency, and low cost [12,16]. In general, adsorption can either be physical or chemical. While by physical adsorption the adsorbate adheres to the surface only through weak intermolecular Van der Waals interactions in the low-temperature environment and under appropriate pH conditions, by chemical adsorption the adsorbate molecules are held to the solid by new chemical bonds (covalent, ionic) due to strong interactions between adsorbent and adsorbate [17]. The amount of heat produced, when one mole of the adsorbate is adsorbed on the adsorbent’s surface, is the enthalpy of adsorption. Adsorption is usually described through kinetic models and adsorption isotherms.
In recent years, the use of nanoparticles (NPs) as adsorbents has become very popular despite of potential health and safety hazards of some NPs [18,19,20,21]. Since adsorption is an effective, economical, and ecofriendly technique, the adsorption of REE3+ from aqueous solution by NPs is one of the best technologies for REE3+ removal from aqueous solution. Adsorption is a mass-transfer process, where REE3+ are transferred from the solution to the NP surface and become bonded by physical and/or chemical interactions depending on the type of NPs. Adsorption studies are conducted by mixing NPs as an adsorbent with REE3+ solution at the desired concentration. The mixtures are stirred with appropriate speed at some fixed temperature for a suitable time and the results are adsorbed REE3+ on the NPs (REE3+/NPs). Then, the non-magnetic NPs with adsorbed REE3+ can be separated by using column extraction, centrifugation, or membrane filtration [22,23,24]. Meanwhile, the magnetic NPs with adsorbed REE3+ can simply be removed by using an external magnet [25,26,27]. After removal of REE3+/NPs from aqueous solution, the concentration of REE3+ in the residual solution is measured in order to determine the adsorption capacity and efficiency [24,28].
To date, for adsorption of Tb3+, which is often used in phosphor production for its high number of green emissions that, combined with other lanthanides, produce white-emitting materials for light-emitting diodes (LEDs) [29,30], various non-magnetic and magnetic NPs have been synthesized successfully. By using poly(acrylic acid)-silica hydrogel nanofibers (PAA/SiO2 HNFs), the maximum adsorption capacity was 250 mg/g at pH 6 [31]. Double (silica and poly(allylamine) hydrochloride)-coated magnetic NPs, functionalized with diethylenetriaminepentaacetic acid (FeO@SiO2@PA/SiO2(DTPA) NPs), offer an adsorption capacity of 1.4 mg/g [20]. Yesiller and coauthors investigated the percentage uptake of terbium ions on magnetic NPs, and they showed a 100% uptake at pH 3 on zero valent iron (Fe0) NPs and a 95.98% uptake at pH 3 on alumina-supported zero valent iron (Fe0/Al) NPs [32]. Wang studied the adsorption capacity of various REEs on montmorillonite-supported zero-valent iron magnetic NPs (n-ZVI-M NPs). The maximum adsorption capacities were found to be 315.23 mg/g for Tb3+, which is the highest Tb3+ adsorption capacity among magnetic NPs [33]. Experimental data on terbium ions adsorption with all mentioned NPs, except for adsorption on n-ZVI-M NPs, which is best described by the Freundlich adsorption isotherm, were very well-fitted to the Langmuir isotherm model and the adsorption kinetics followed a pseudo-second order model [20,31,33].
This paper deals with the adsorption of Tb3+ from aqueous solutions onto very simple magnetic γ-Fe2O3-NH4OH@SiO2(APTMS) core@shell NPs, which enable simple removal of a low concentration of Tb3+ from aqueous solution with high adsorption efficiency. The dependence of adsorption parameters, such as contact time, mass of NPs, temperature, and initial concentration of Tb3+, on the adsorption efficiency was studied. The adsorption process took place in a time range of up to 1440 min, and the mass of NPs was varied from 5 mg to 40 mg; the volume of the solution was 20 mL. Meanwhile, initial concentration ranged from 5 × 10⁻⁷ to 4 × 10⁻⁶ M. Experiments were carried out at three different temperatures: 25 °C, 50 °C, and 75 °C. Furthermore, the adsorption kinetics and adsorption isotherms were analyzed by using nonlinear methods, and the thermodynamic parameters were derived from the obtained experimental results.

2. Results and Discussion

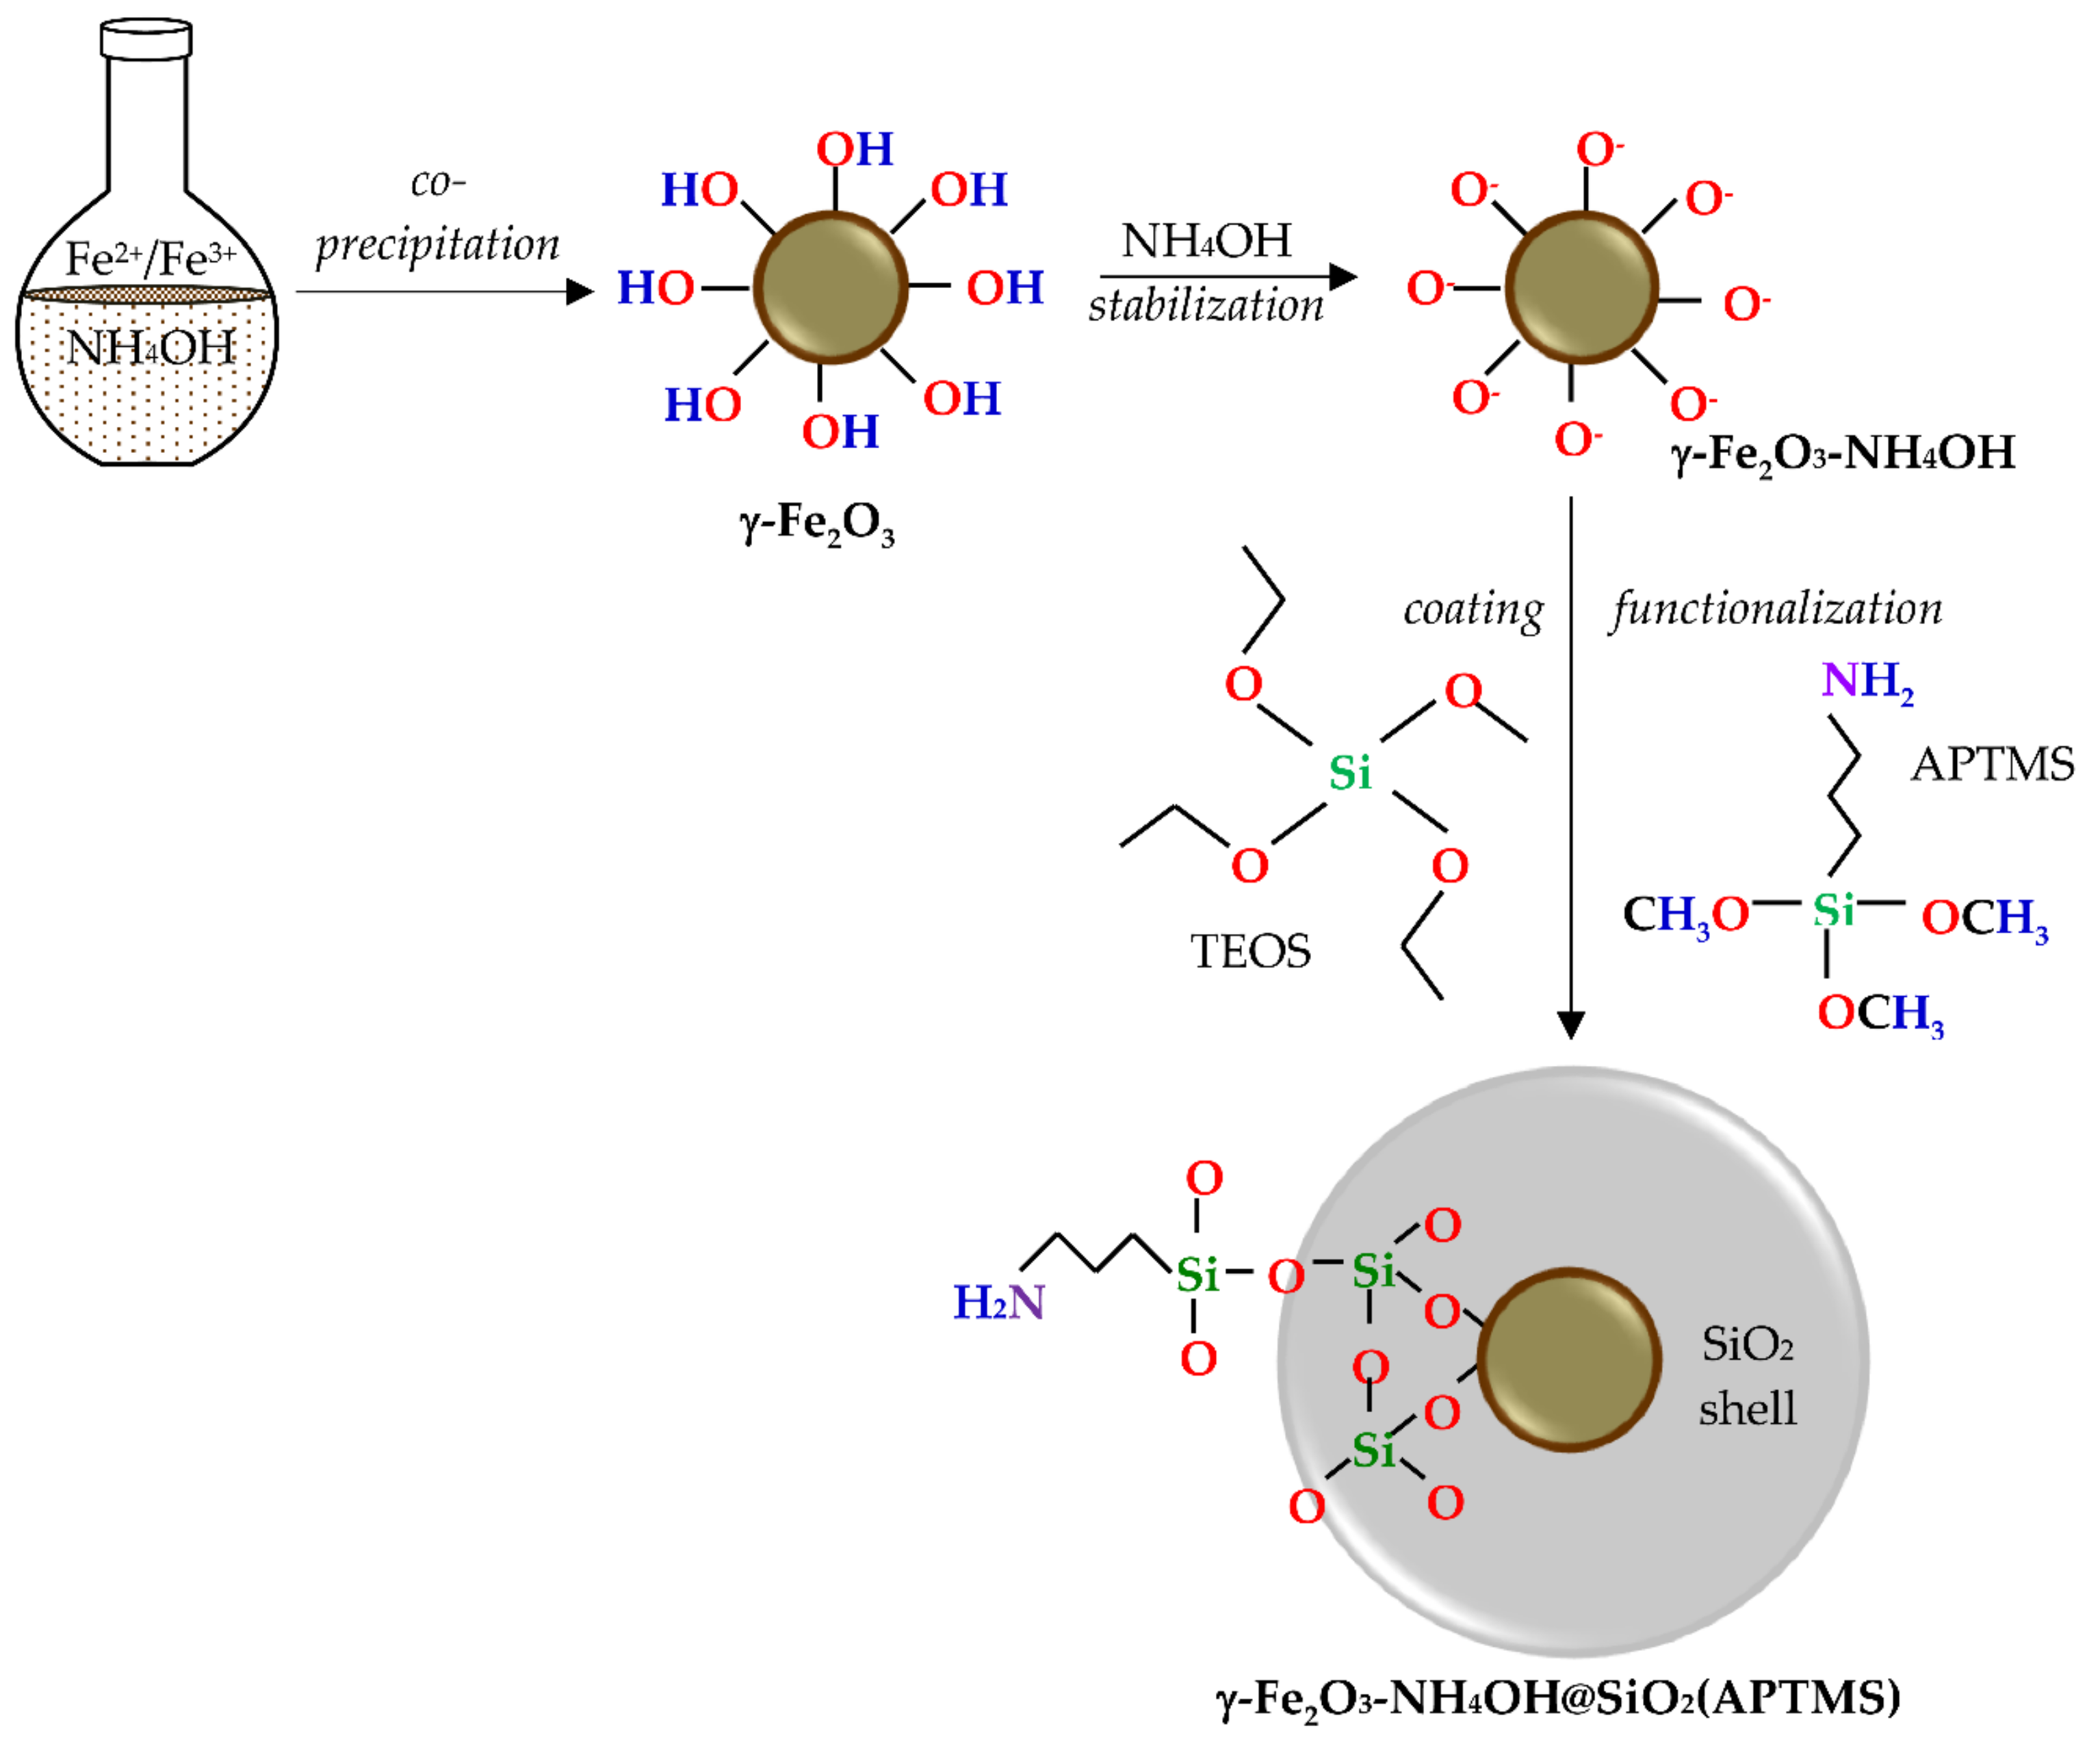
2.1. γ-Fe2O3-NH4OH@SiO2(APTMS) NPs

The γ-Fe2O3-NH4OH@SiO2(APTMS) NPs were synthesized by co-precipitation of ferrous and ferric salts in a basic medium to form a magnetic core, stabilized in NH4OH medium, coated with silica, and functionalized by an amino group from (3-Aminopropyl) trimethoxysilane (APTMS), as shown in Figure 1.

2.2. Characterization of γ-Fe2O3-NH4OH@SiO2(APTMS) NPs

The synthesized γ-Fe2O3-NH4OH@SiO2(APTMS) NPs were characterized in order to perform a structural study, thermogravimetric analysis, morphological and compositional study, and surface area and charge study, and to determine the magnetic properties.

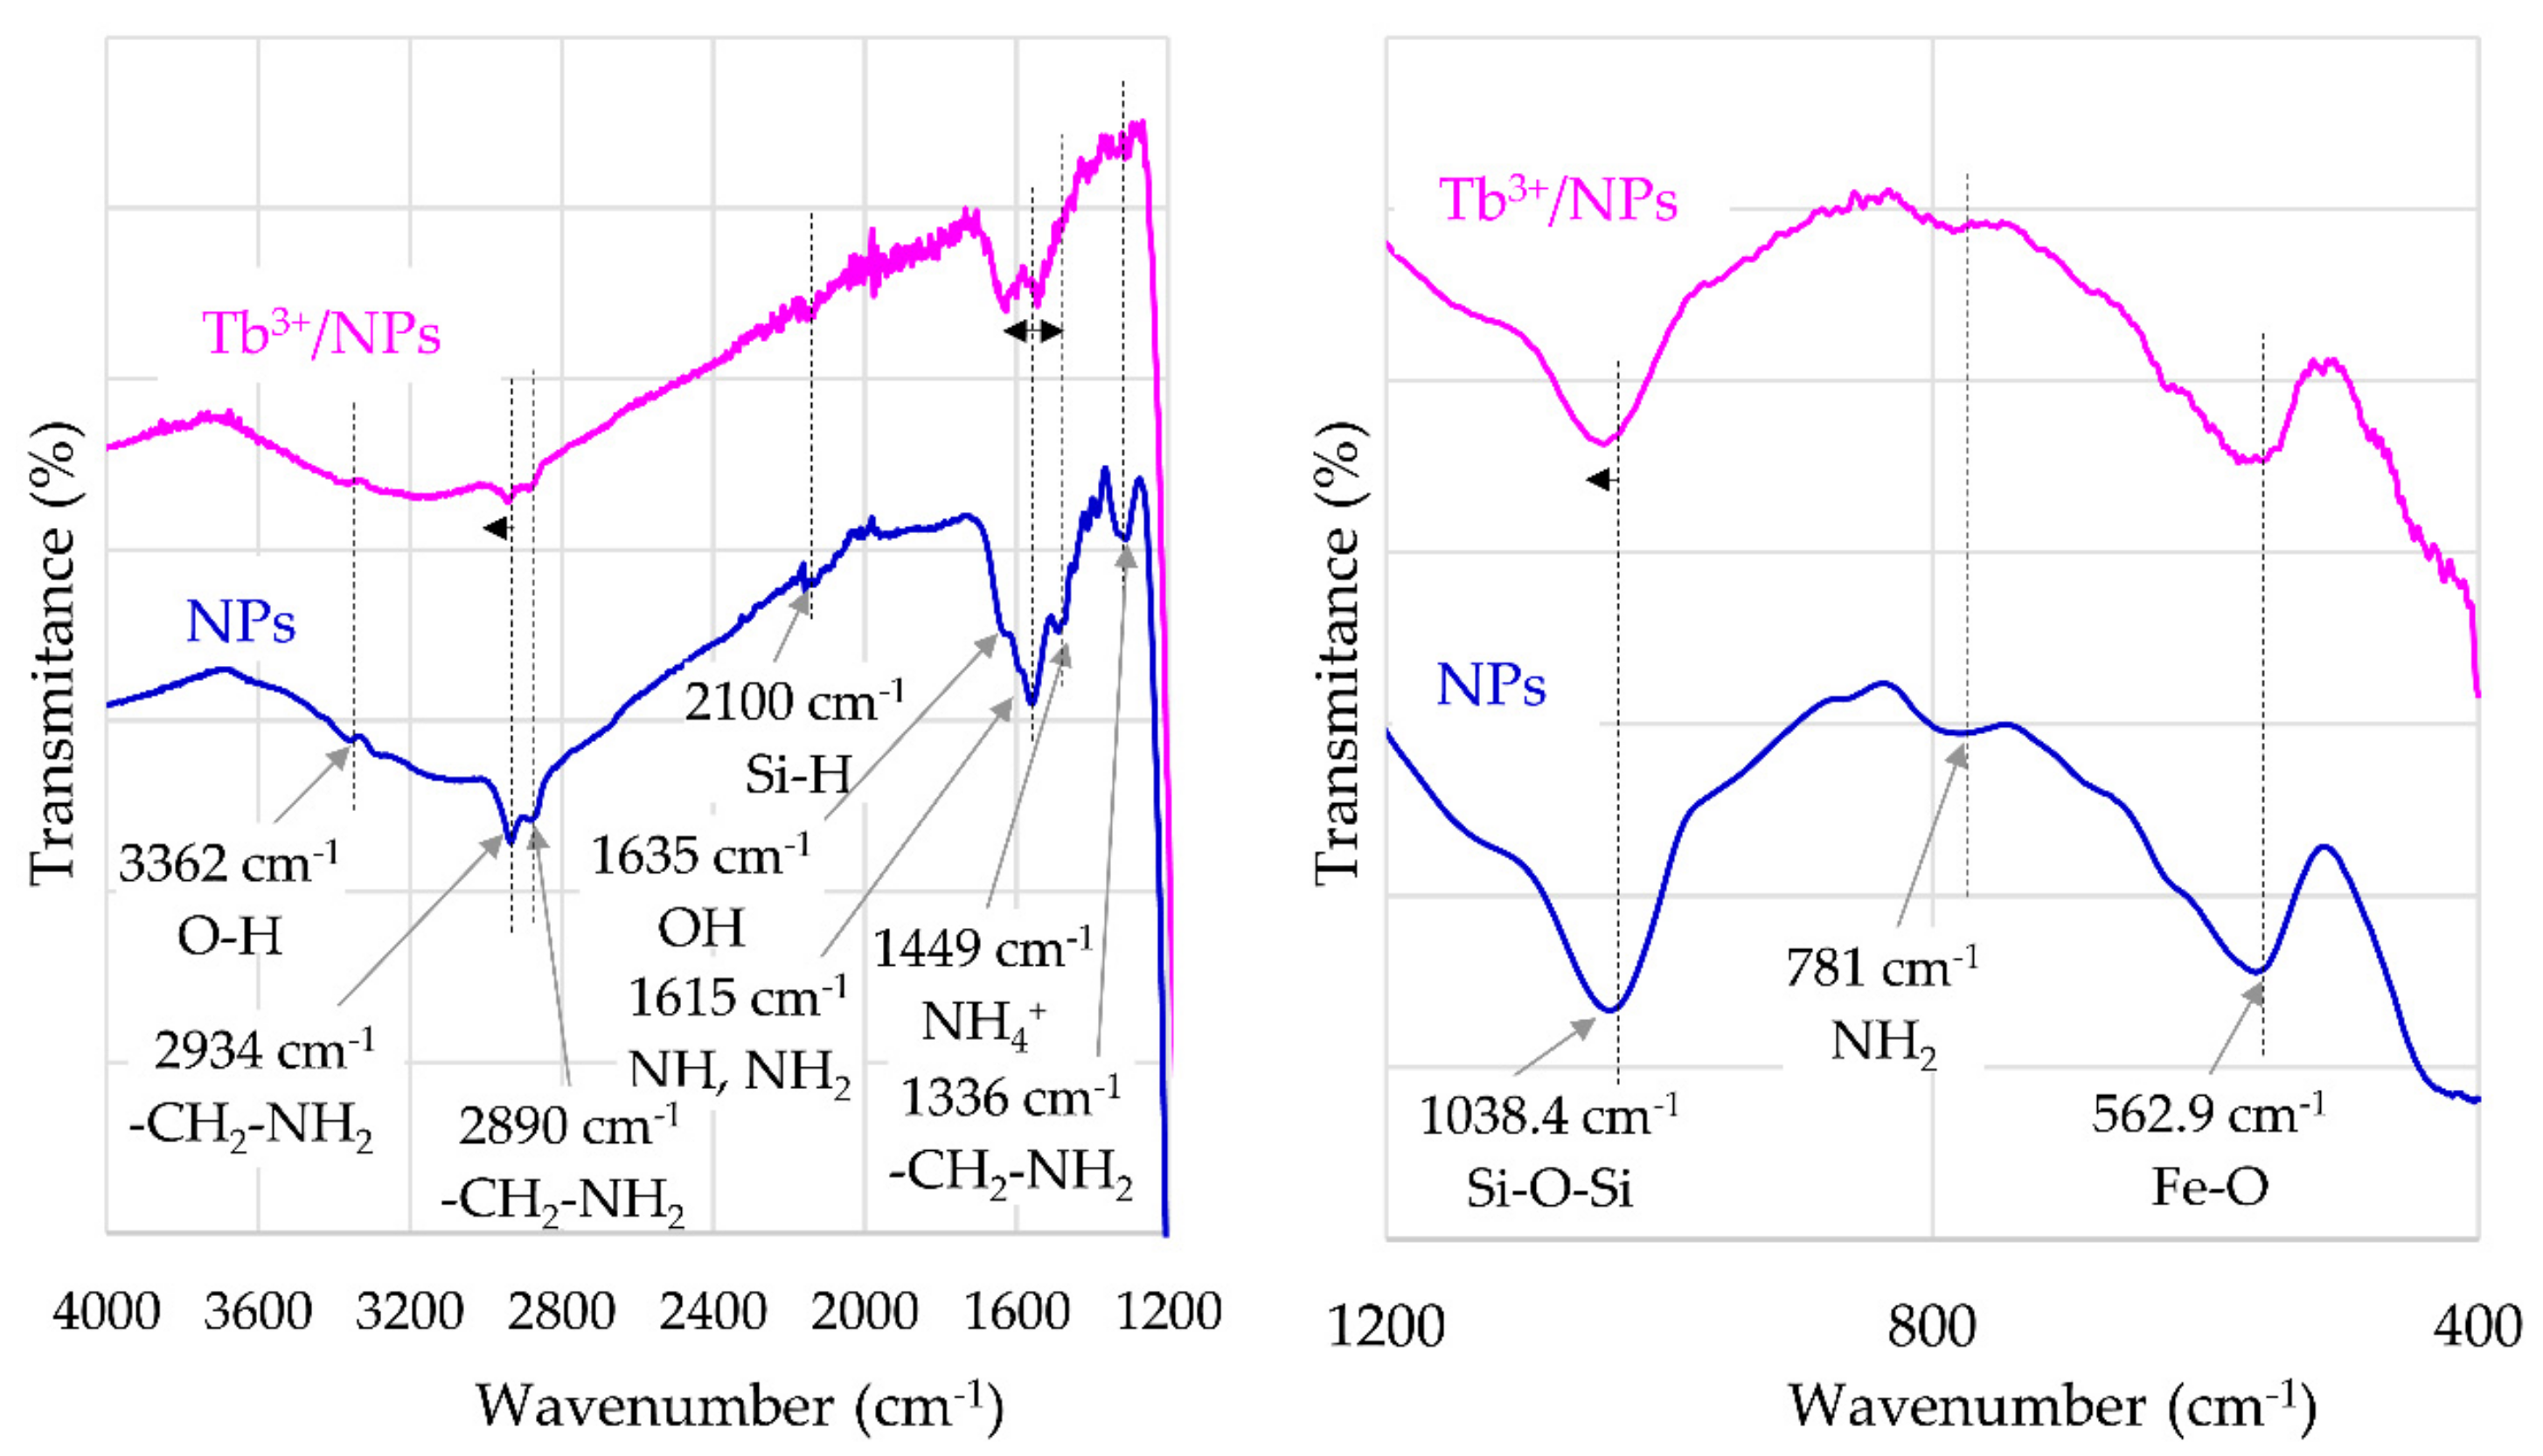
2.2.1. Structural Study

The presence of the magnetic γ-Fe2O3 NP core of the particles was confirmed by X-ray diffraction (XRD). All diffraction peaks in Figure 2 are consistent with the standard structure of maghemite (JCPDS Card No.: 39-1346). By taking three of the most intensive peaks, corresponding to the crystal planes of (311), (440), and (511), the average crystalline size of the γ-Fe2O3 NPs is (19.1 ± 3.3) nm, as calculated by the Debye-Scherrer’s equation.
FT-IR spectra of γ-Fe2O3-NH4OH@SiO2(APTMS) NPs are presented in Figure 3. The characteristic peak at 3362 cm−1 indicates the stretching vibrations of O–H groups; the peaks at 2934 cm−1 and 2890 cm−1 correspond to the stretching vibration of –CH2–NH2 groups. The peak at 1635 cm−1 can be assigned to the OH groups. The peak at 1615 cm−1 indicates the scissoring vibrations of N–H in NH2 groups; meanwhile, the peak at 1449 cm−1 confirms the presence of NH4+ groups. The peak at 1336 cm−1 is significant for the wagging and twisting vibration of the –CH2–NH2 bond. The asymmetric stretching vibration of the Si–O–Si bond corresponds to the peak at 1038.4 cm−1. The absorption peak at 781 cm−1 corresponds to wagging and twisting of NH2 amino groups, and the absorption peak at 562.9 cm−1 corresponds to stretching vibrations of the Fe–O bond. Figure 3 shows the shifting of peaks, corresponding to characteristic groups of synthesized γ-Fe2O3-NH4OH@SiO2(APTMS) NPs, by adsorbed Tb3+. The peak at 2934 cm−1, which corresponds to stretching vibrations of –CH2–NH2 bonds for γ-Fe2O3-NH4OH@SiO2(APTMS) NPs, is shifted to the peak at 2941 cm−1 for Tb3+/γ-Fe2O3-NH4OH@SiO2(APTMS) NP systems. The peak at 1615 cm−1, corresponding to scissoring vibrations of N–HHHH in NH2 bonds for γ-Fe2O3-NH4OH@SiO2(APTMS) NPs, is shifted to 1636 cm−1 and to 1545 cm−1 for the Tb3+/γ-Fe2O3-NH4OH@SiO2(APTMS) NP system. For this system, a minor peak shift of about 2 cm−1 to a higher wavenumber (with respect to γ-Fe2O3-NH4OH@SiO2(APTMS) NPs) was observed. This corresponds to the asymmetric stretching vibration of the Si–O–Si bond.
The FT-IR spectra of γ-Fe2O3-NH4OH@SiO2(APTMS) NPs after adsorption of Tb3+ exhibit shifts, intensity variations, and broadening of the peaks. With respect to the investigation of Dubey and Gandhi [34], these modifications in FT-IR spectra confirm the presence of contact between the NPs and Tb3+, as shown in Figure 3.
The amount 0.0448 mmol/g of amino groups on the γ-Fe2O3-NH4OH@SiO2(APTMS) NPs, obtained with potentiometric titration, confirms successful functionalization with amino groups [35].

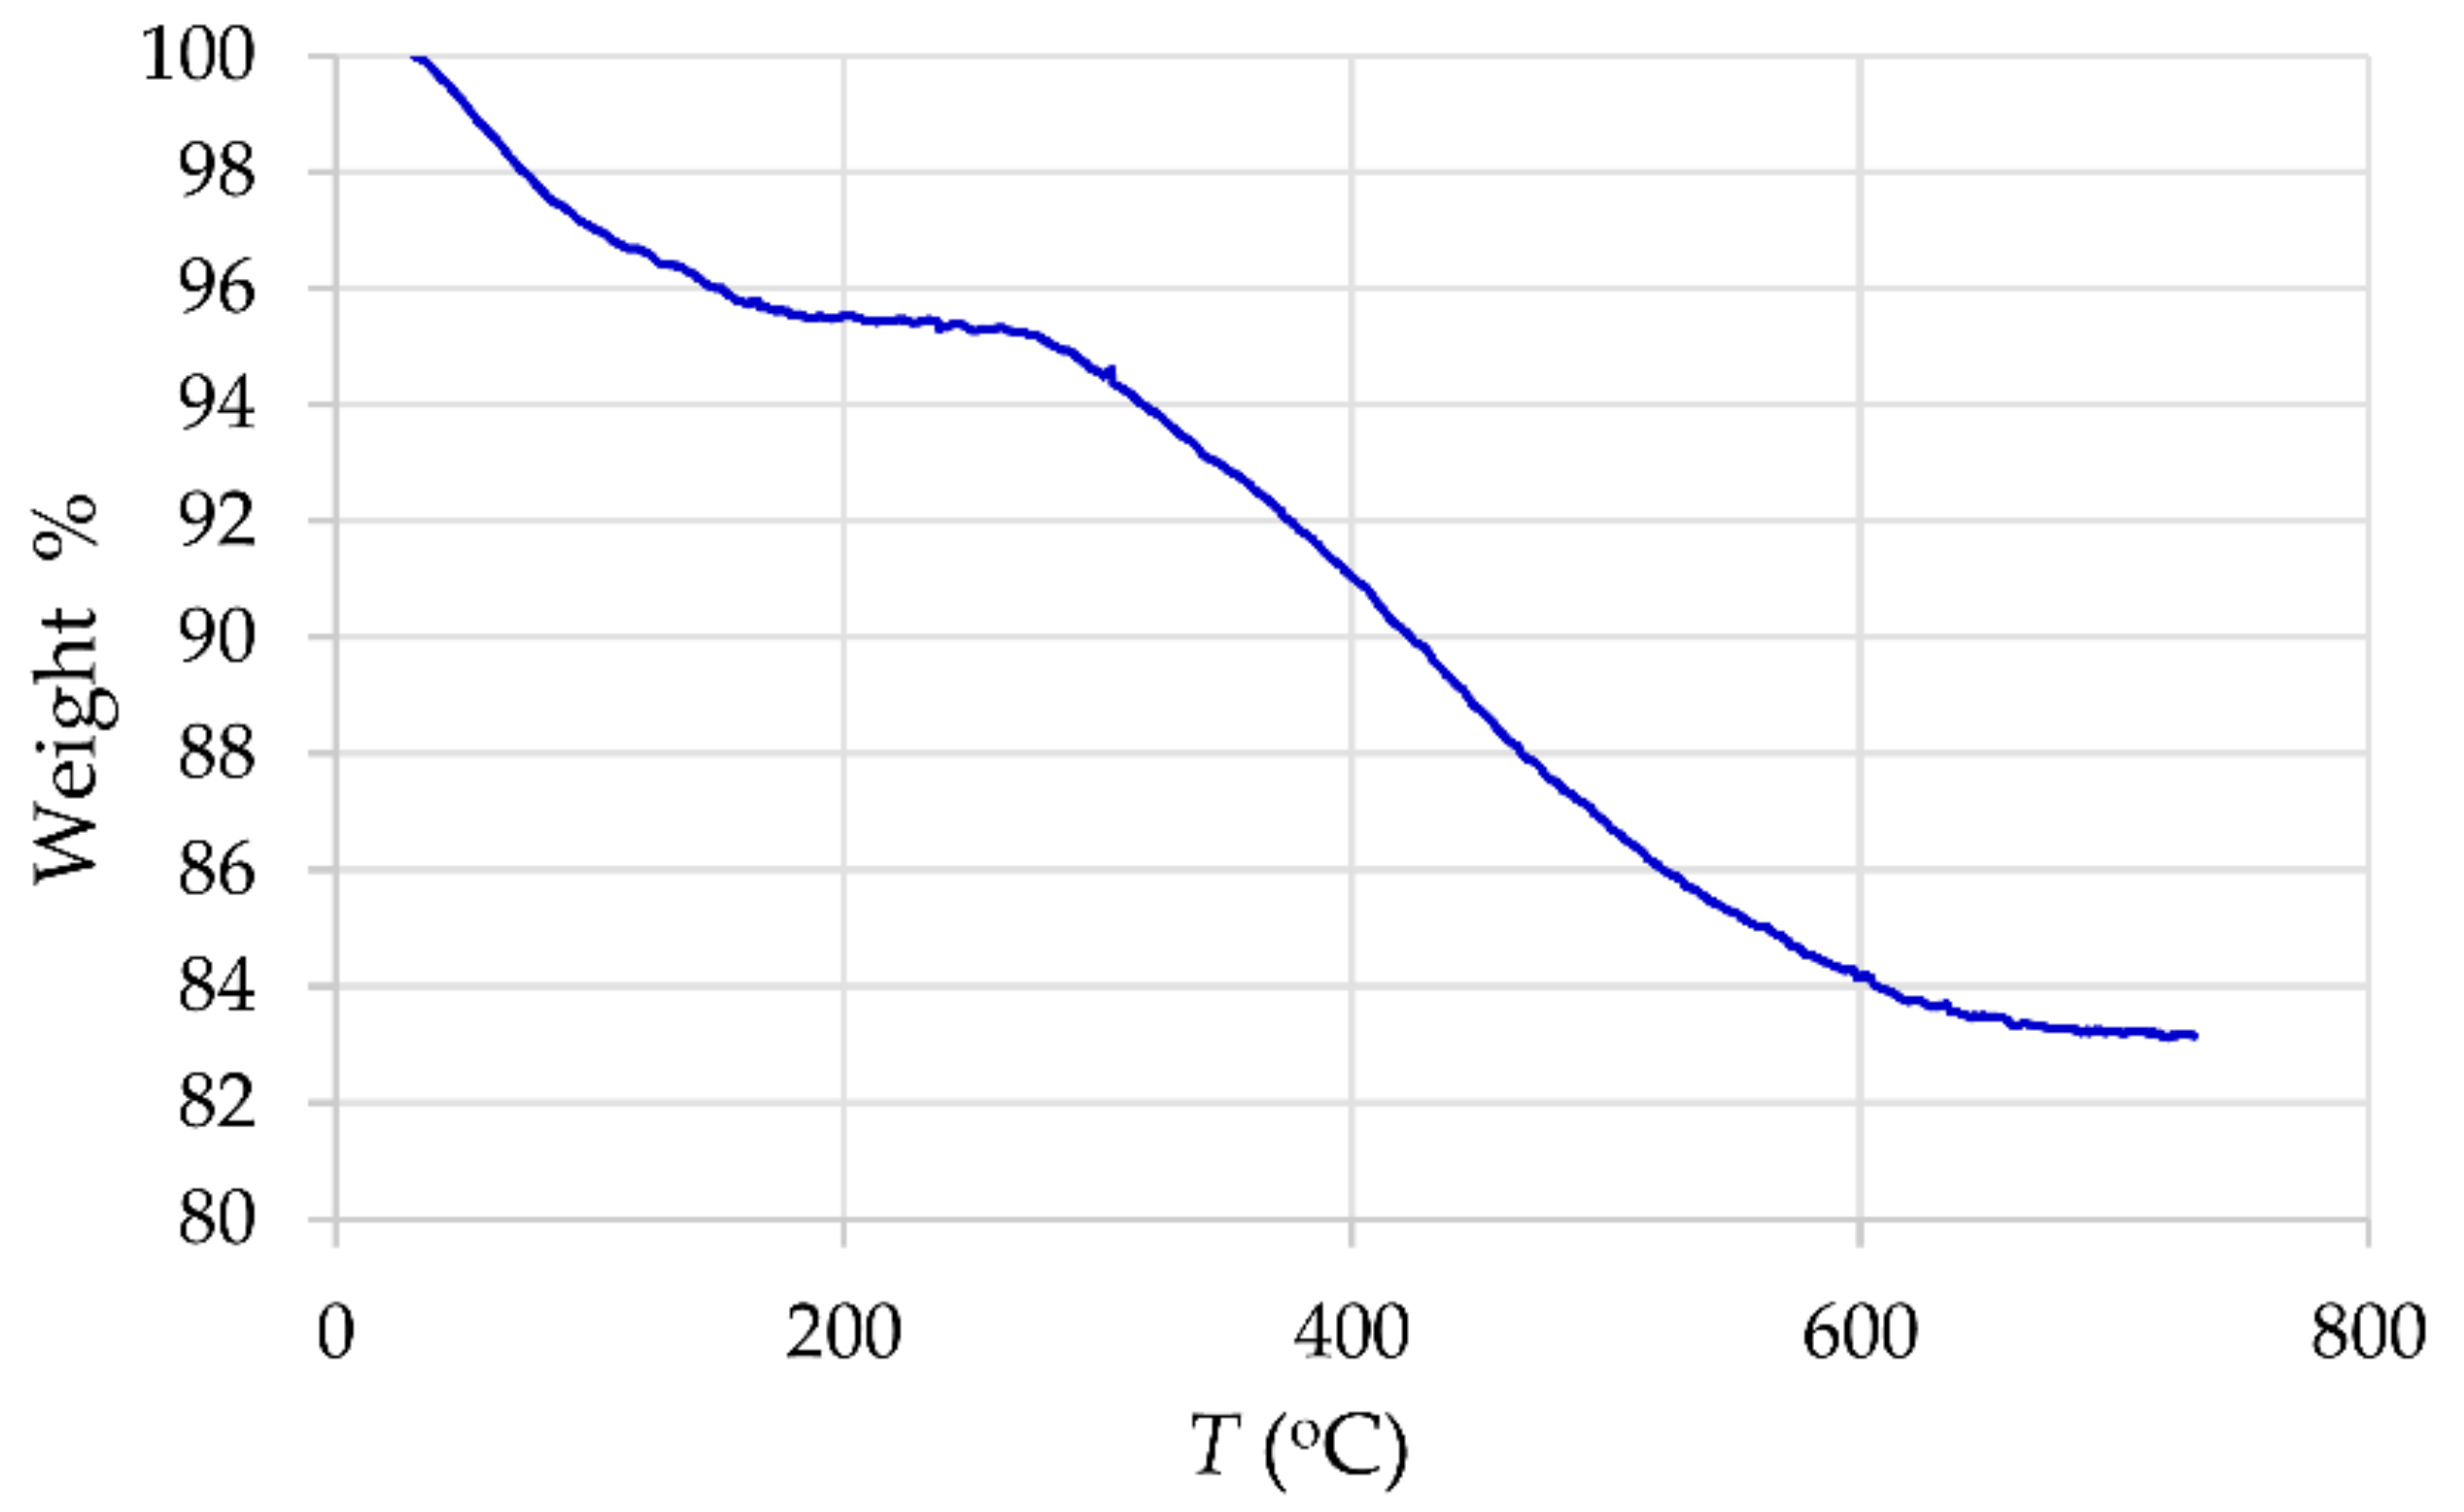
2.2.2. Thermogravimetric Analysis

The results of thermogravimetric analysis (TGA) are shown in Figure 4, where the mass loss of γ-Fe2O3-NH4OH@SiO2(APTMS) NPs by heating up to 800 °C is presented. The TGA curve shows that the weight loss occurs in two steps. The first step, probably related to the evaporation of absorbed moisture, can be observed in the range from 25 °C to 180 °C and leads to a loss of 4.7%. The second decomposition step occurs in the interval from 280 °C to 800 °C after a plateau where the material is thermally stable. This step corresponds to a weight loss of 12.1% and is associated with thermal destruction of amino NH2 groups and removal of the alkyl chains from the Si–O–Si framework (cracking of the residual surface alkyl siloxane Si–O–Si species) [36,37,38].

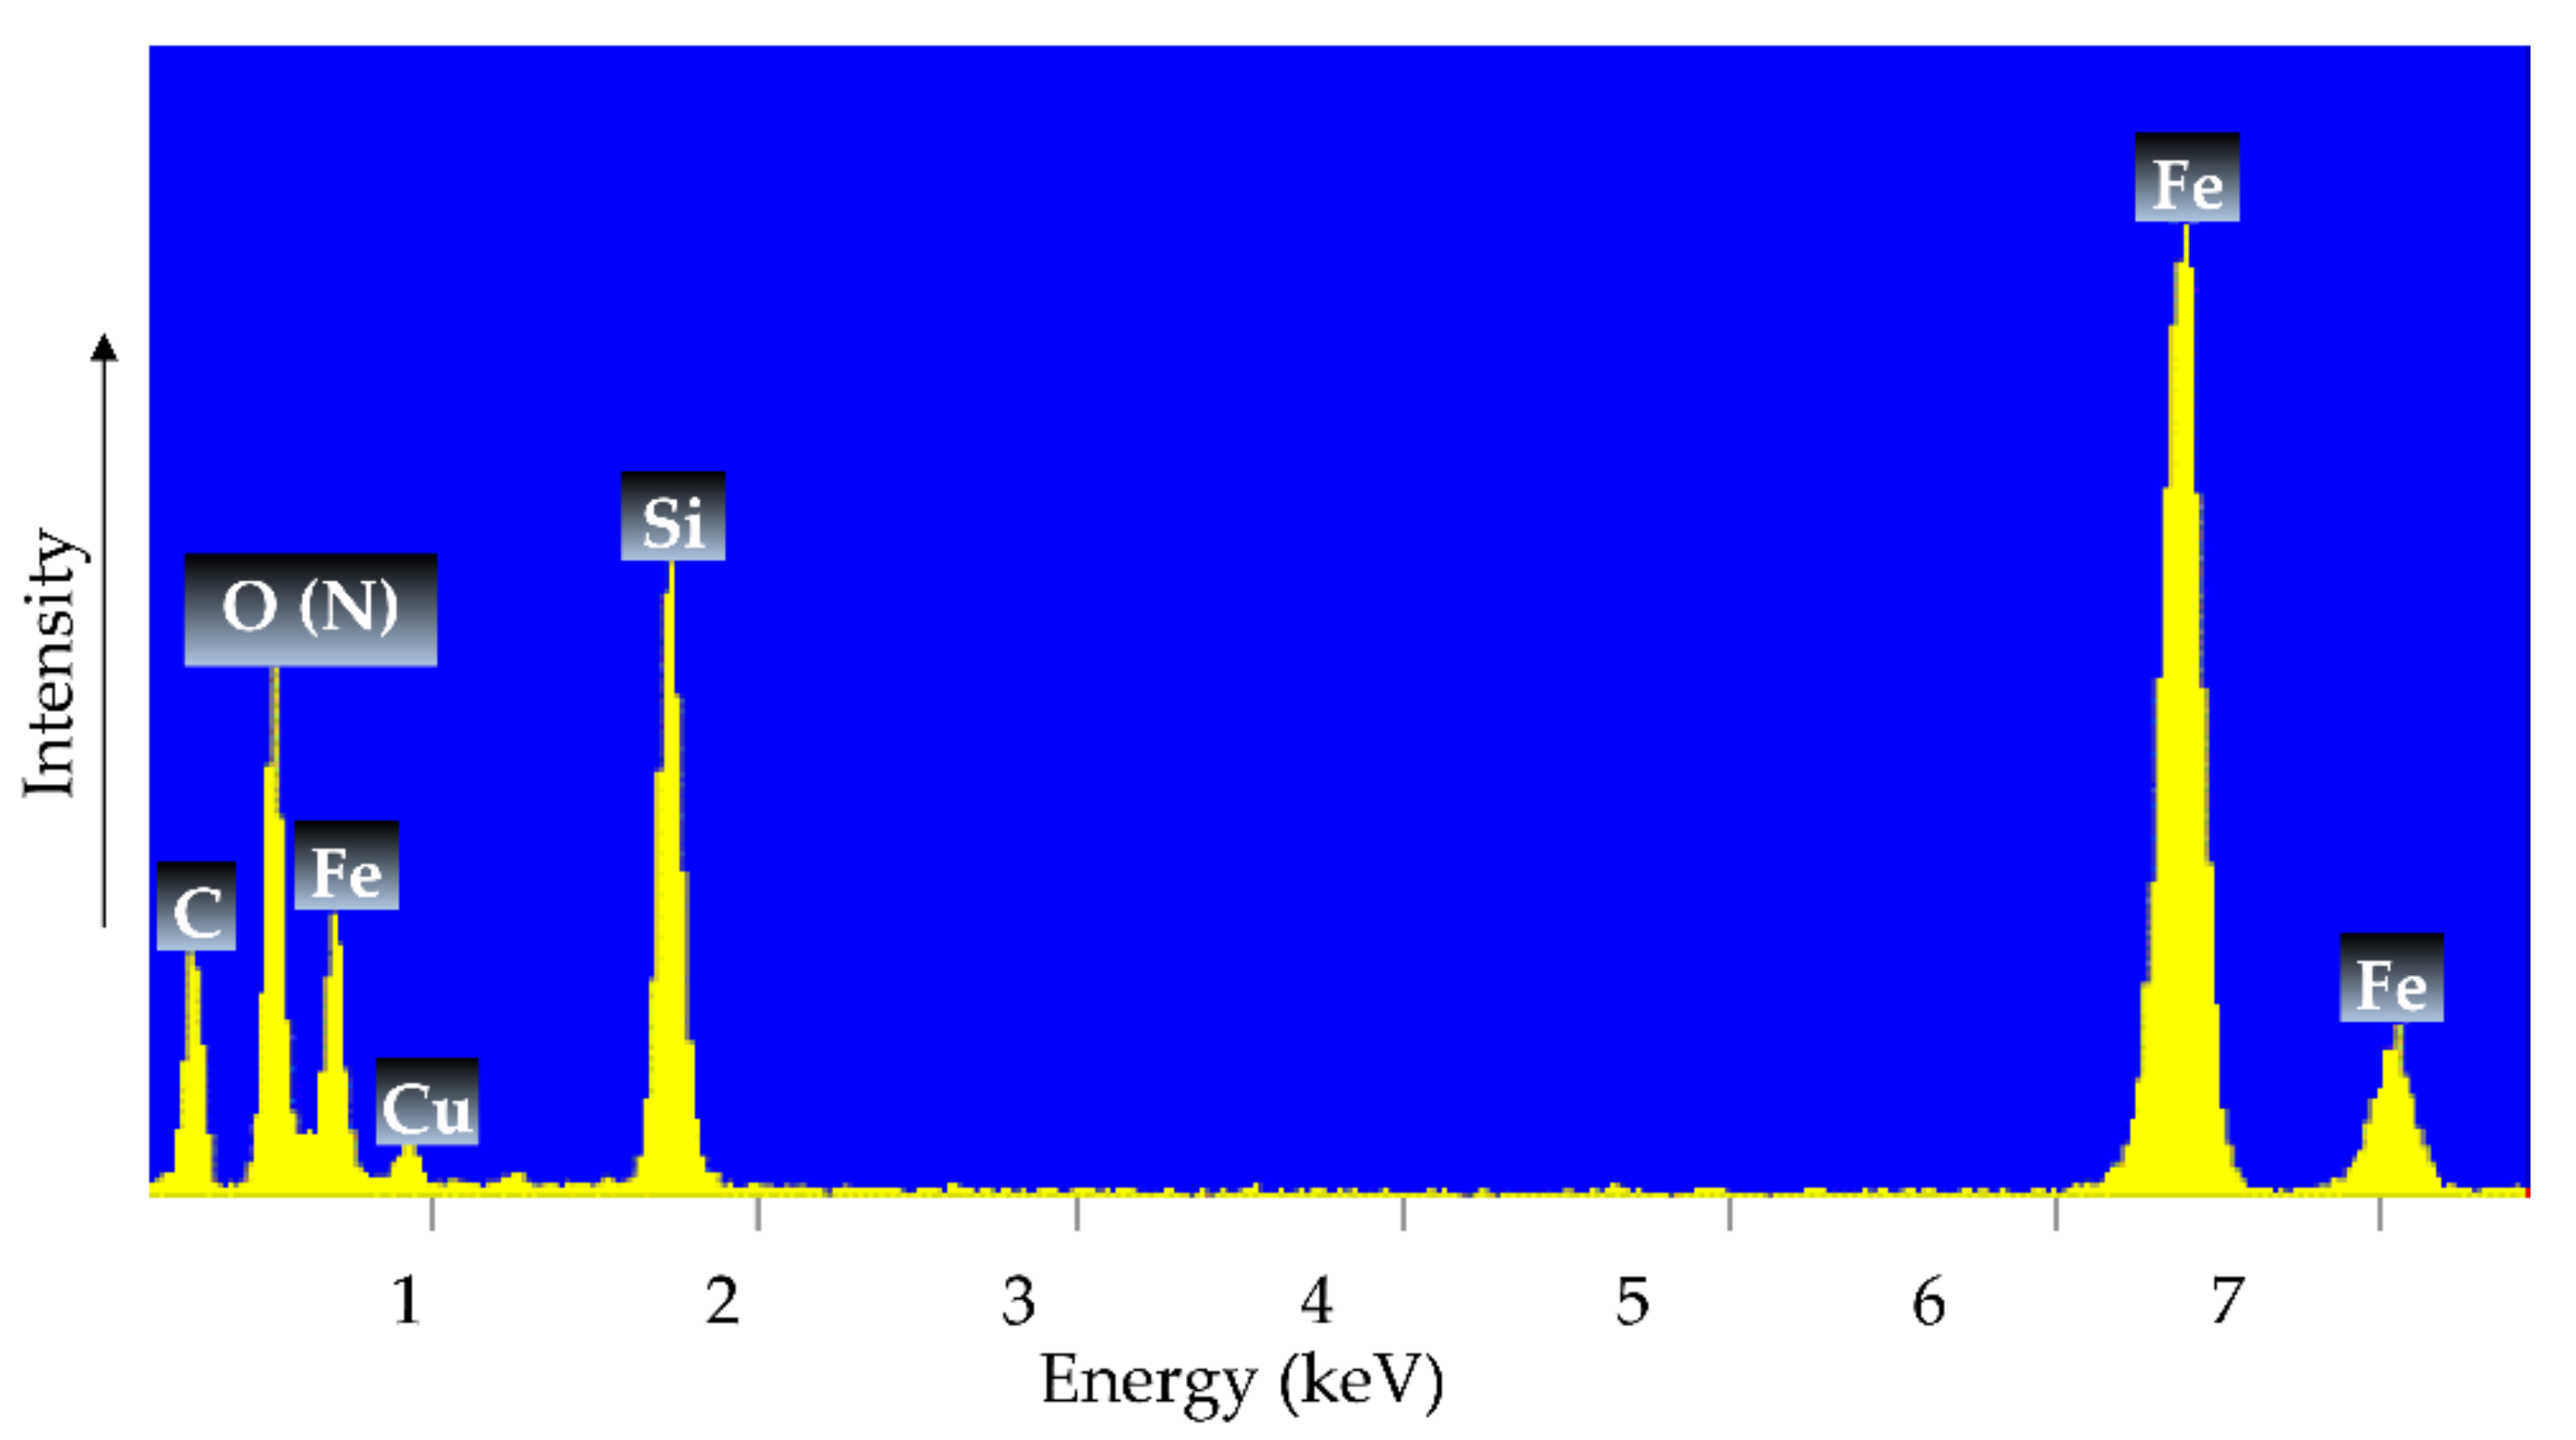
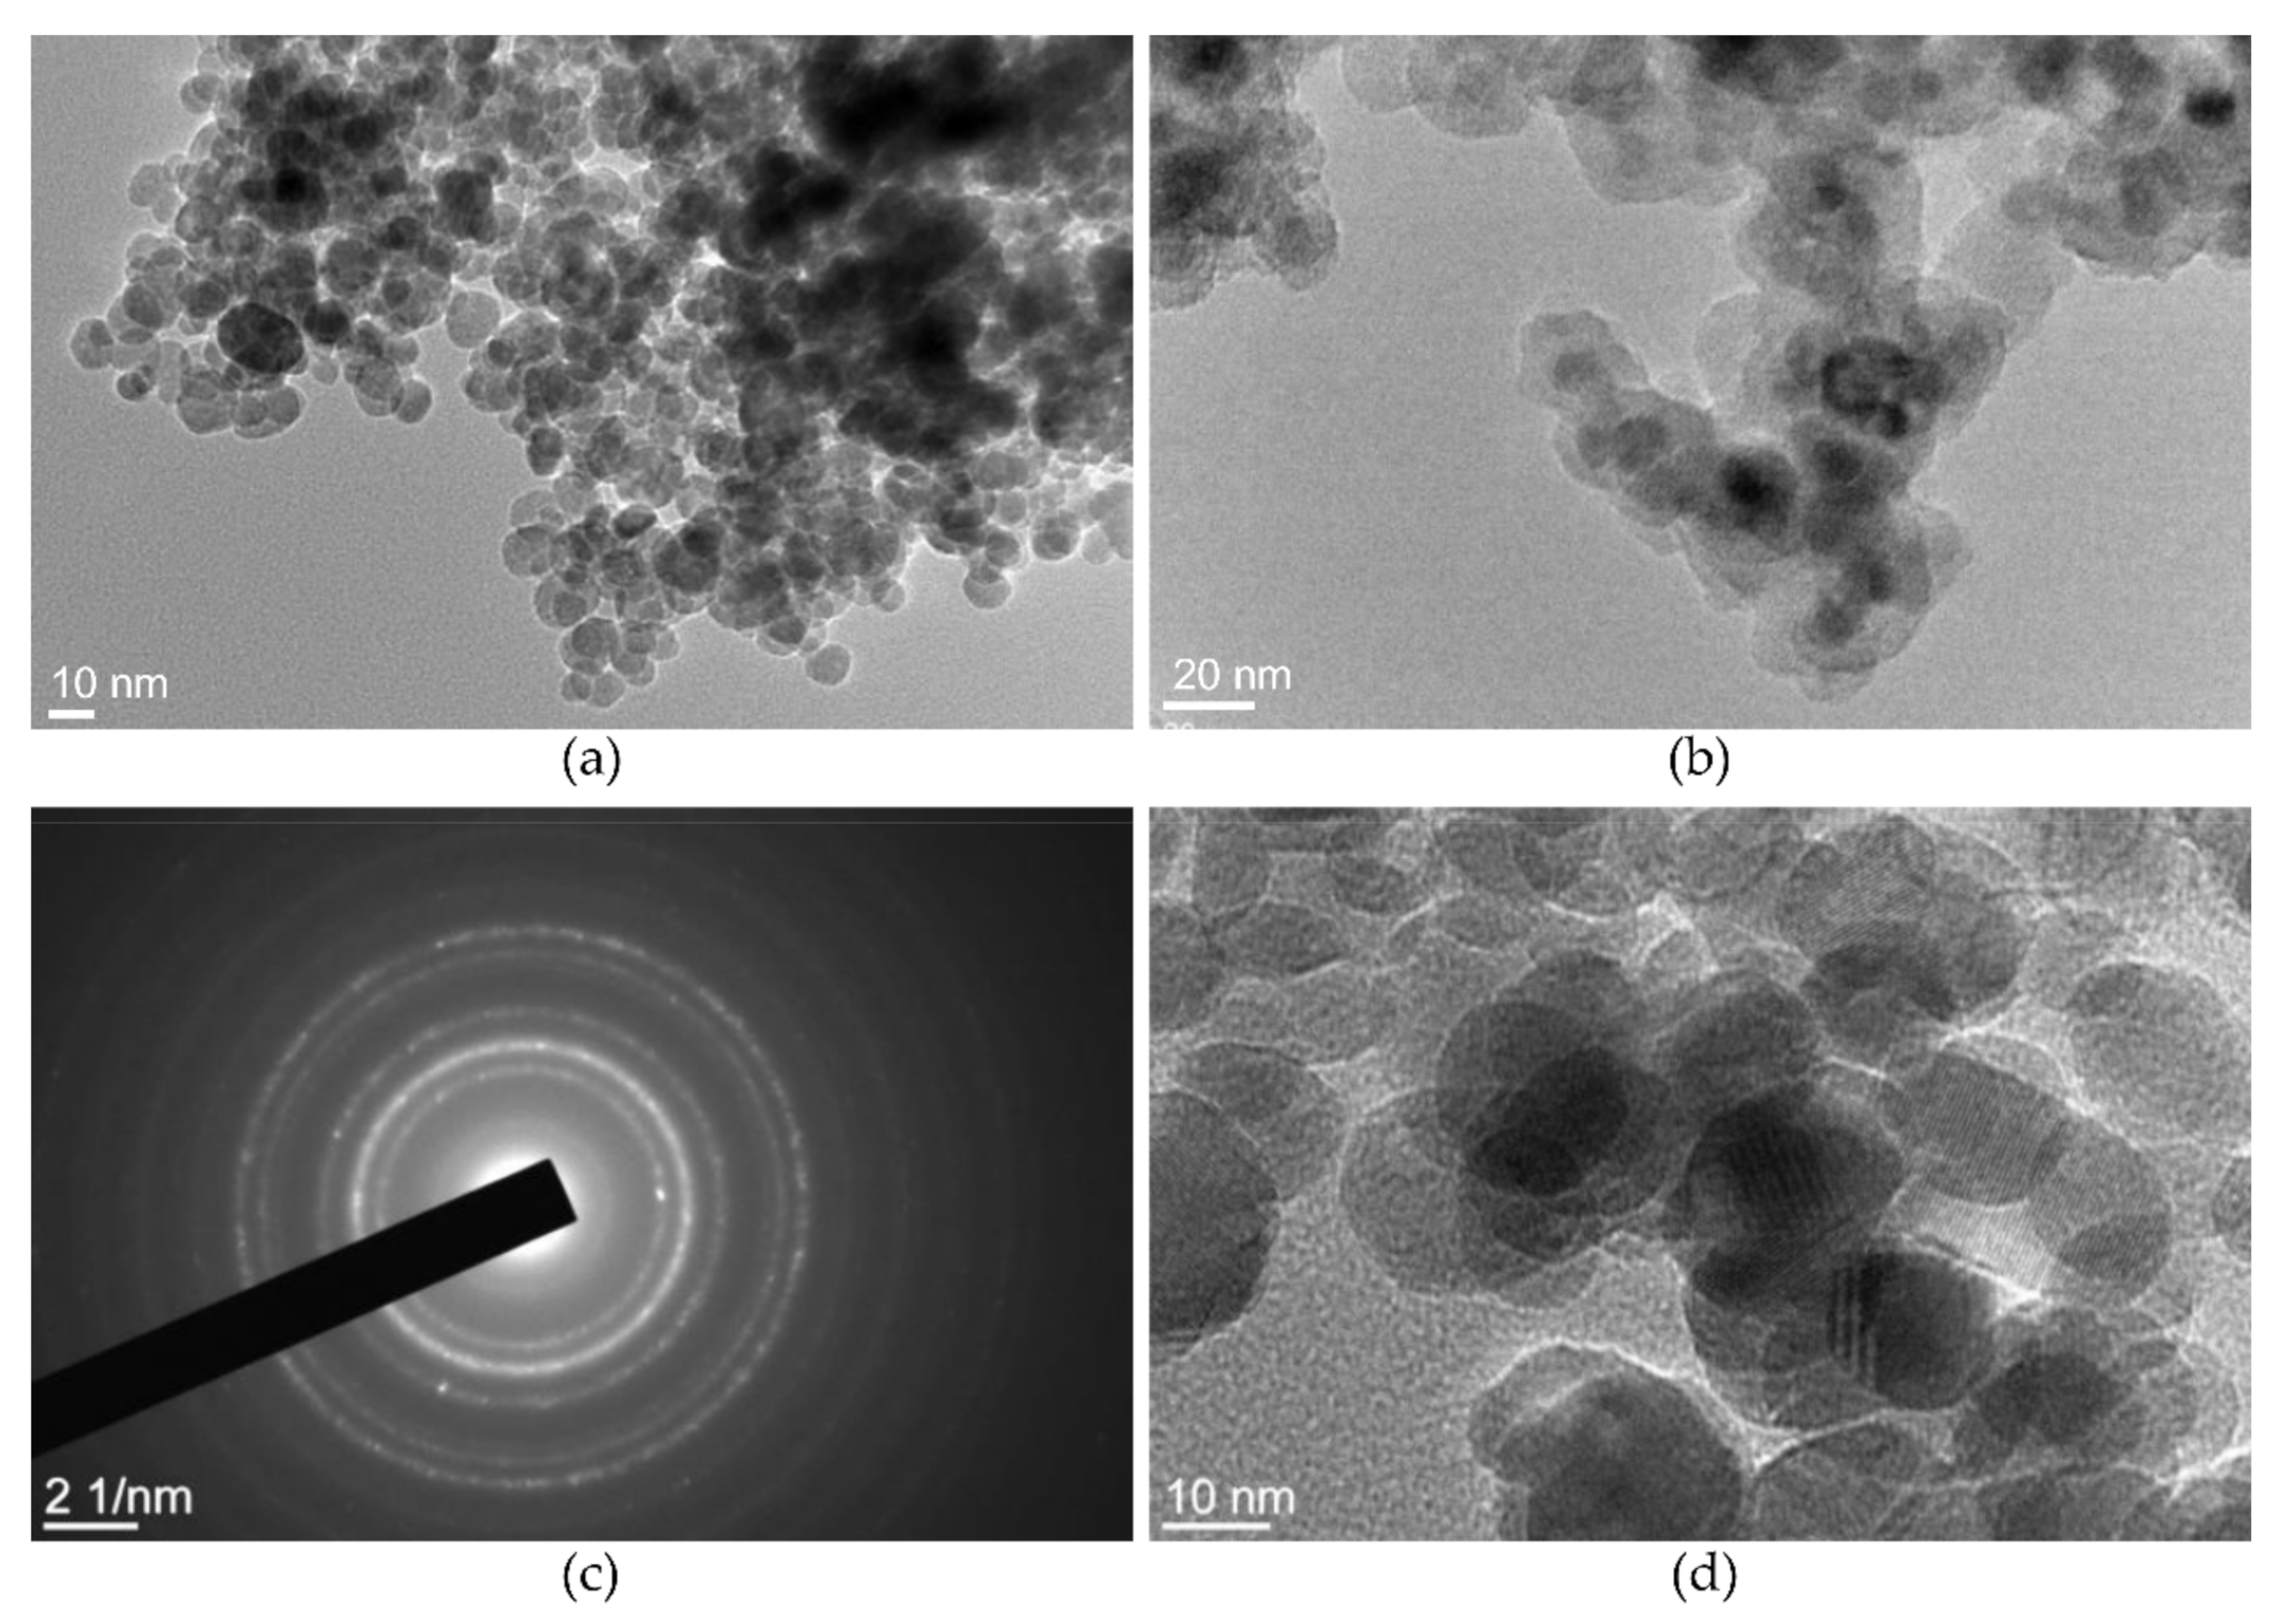
2.2.3. Morphological and Compositional Study

The TEM photos in Figure 5 display the morphology of the γ-Fe2O3 NPs and γ-Fe2O3-NH4OH@SiO2(APTMS) NPs. Figure 5a shows the relatively spherical morphology of the maghemite NPs with the narrow particle size distribution of (13.7 ± 4.1) nm. The TEM images in Figure 5b show the relatively spherical morphological structure of γ-Fe2O3-NH4OH@SiO2(APTMS) NPs samples with an eminent surface layer of amorphous siloxane (SiO2). The average size of γ-Fe2O3-NH4OH@SiO2(APTMS) NPs is about 55 nm. The electron diffraction pattern of the γ-Fe2O3 sample in Figure 5c confirms the formation of a spinel crystal structure with a relatively high material crystallinity, which is consistent with the HRTEM image of γ-Fe2O3 NPs in Figure 5d.
Figure 6 shows the EDXS spectrum of γ-Fe2O3-NH4OH@SiO2(APTMS) NPs, where the presence of Fe, O (N), Si, C, and Cu is evident. The elementary composition confirms the success of the synthesis of a magnetic maghemite core, a silicate shell, and functionalization with amino groups. The EDXS analysis of the sample indicated large peaks indicating iron (Fe) and silicon (Si), characteristic of Fe–O bond formation and siloxane (Si–O–Si) bonds, respectively, while there is overlap between the elemental peaks of oxygen (O) and nitrogen (N). Note that the peaks of Cu and C in the spectra belong to the TEM’s copper-grid-supported transparent carbon foil; the sample was measured on this grid during the EDXS analysis [39,40]. From the obtained EDXS pattern, it can be concluded that the amino groups of the APTMS are successfully attached to the surface of the γ-Fe2O3-NH4OH@SiO2, which is in a good agreement with the ζ-potential, as shown in Figure 7.

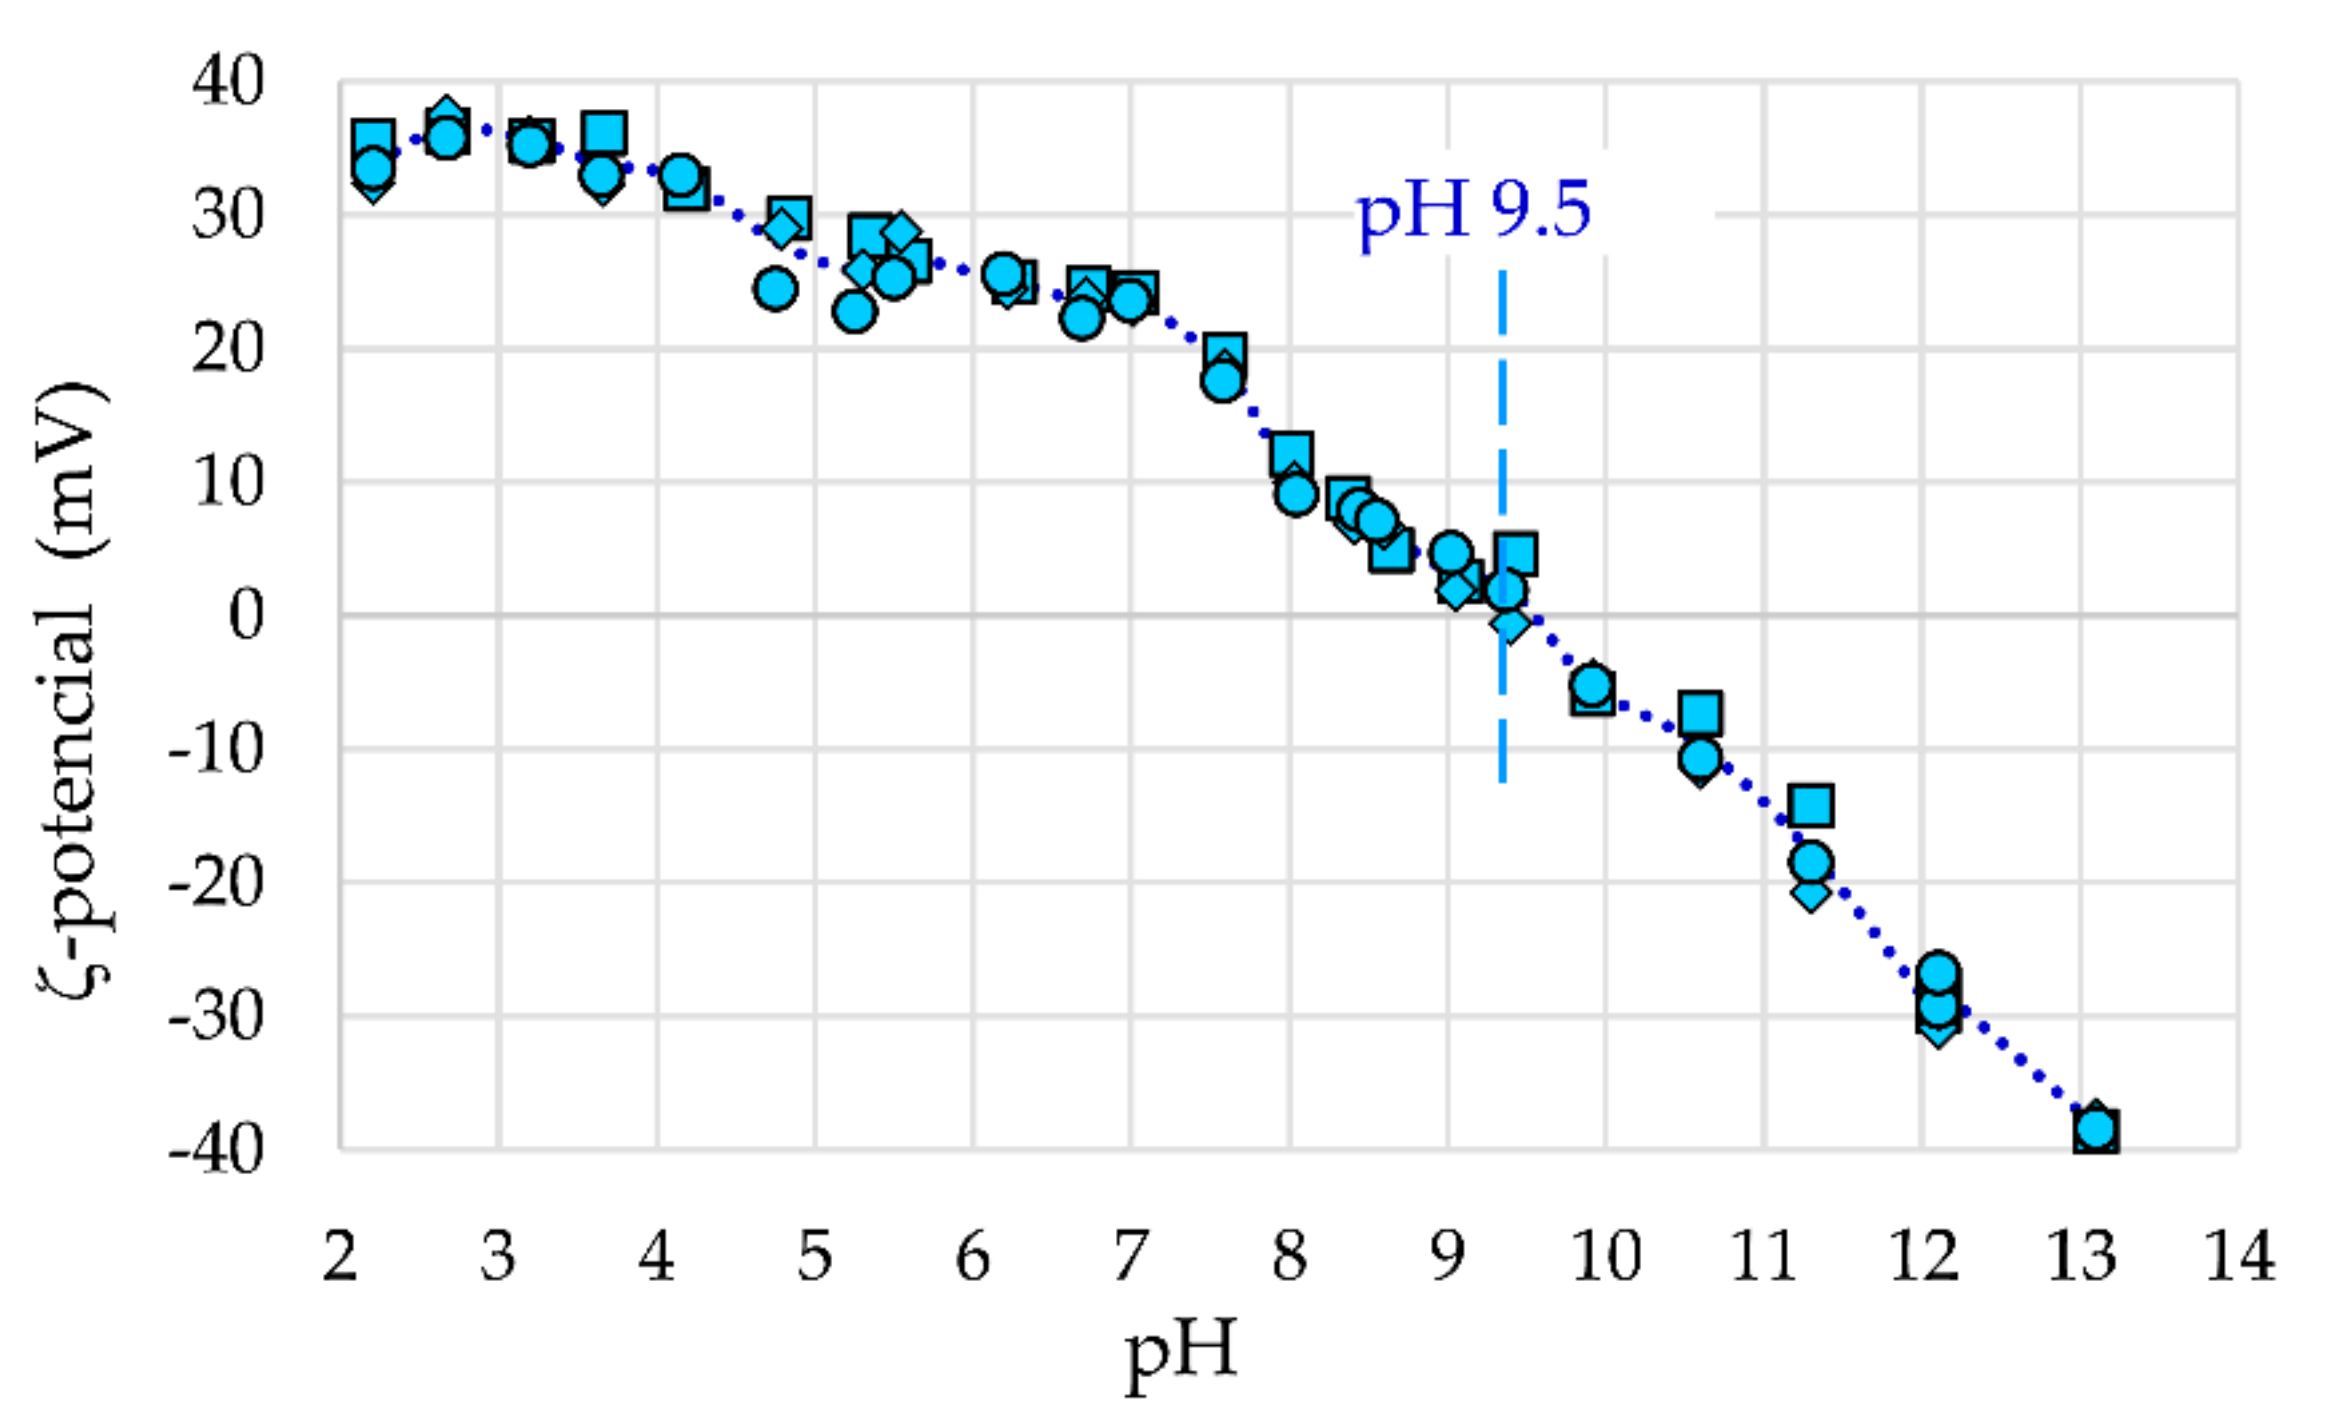
2.2.4. Surface Area and Charge Study

Brunauer-Emmet-Teller (BET) analysis gives a specific surface area of 6.41 m2/g for γ-Fe2O3-(NH4OH)@SiO2(APTMS) NPs. At Barrett-Joyner-Halenda (BJH) adsorption, the average pore size is 5.4 nm with a total pore volume of 0.0505 cm3/g. Meanwhile, at BJH desorption, the average pore size is 5.7 nm with a total pore volume of 0.05309 cm3/g. According to the BET specific surface area at a relative pressure of 0.3, the predicted average γ-Fe2O3-(NH4OH)@SiO2(APTMS) NP size is 53.6 nm.
In Figure 7, the ζ-potential as a function of pH of the synthesized γ-Fe2O3-NH4OH@SiO2(APTMS) NPs is shown. It can be seen that the isoelectric point is equal to 9.5, which confirms functionalization with amino groups from APTMS. The magnetic stabilized and functionalized core@shell NPs already show stability at pH 7, while they are fully stable at pH < 4.5, where the ζ-potential is >30 mV, and at pH > 12, where the ζ-potential is <−30 mV.

2.2.5. Magnetic Study

Figure 8 displays the magnetization curve of γ-Fe2O3-NH4OH@SiO2(APTMS) NPs at room temperature, where the MS value is 30.94 emu/g. However, this value of MS is similar to that of maghemite NPs [41,42]. These NPs show close superparamagnetic behavior with smaller remanence magnetization and smaller coercitivity than γ-Fe2O3 NPs. The obtained magnetization properties confirm simple separation of Tb3+/γ-Fe2O3-NH4OH@SiO2(APTMS) NPs from aqueous solution.

2.3. Adsorption Study

The absorption wavelength of the prepared standard solutions, obtained by UV/VIS spectroscopy, is 312 nm. The calibration curves of the prepared standard solutions with a low concentration of Tb3+, obtained by a Perkin Elmer LS 55 fluorescence spectrometer, are given in Figure 9. The correlation coefficient of the calibration curves is higher than 0.99.

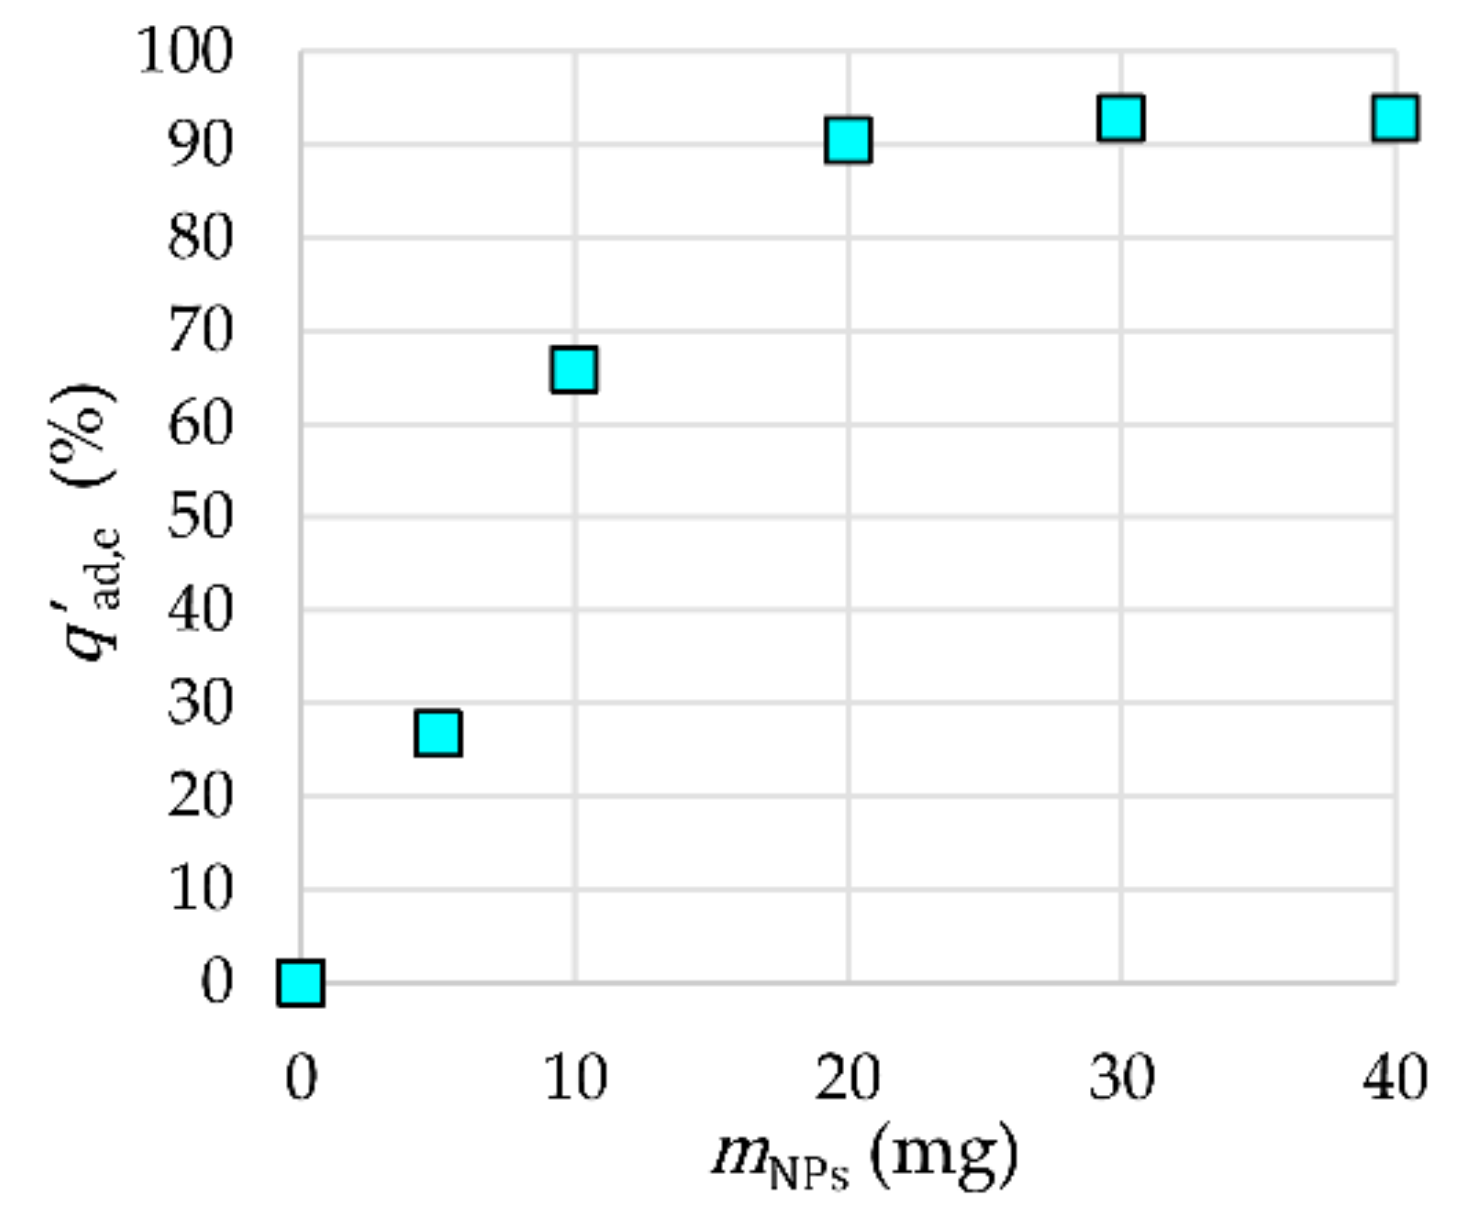
2.3.1. NP Mass Influence

The influence of the mass of γ-Fe2O3-NH4OH@SiO2(APTMS) NPs on the adsorption efficiency is presented in Figure 10. The equilibrium mass mNPs,eq of γ-Fe2O3-NH4OH@SiO2(APTMS) NPs as adsorbent for Tb3+, with respect to the adsorption efficiency, was 30 mg for a solution volume V = 20 mL, tad = 120 min, cads,0 = 2 × 10⁻⁶ M, and Tad = 25 °C, where the reached adsorption efficiency was 93%. An ultrasonic bath was used to mix the samples at pH 7. Figure 10 shows that the adsorption efficiency increased significantly by increasing the mass of NPs up to 30 mg due to an increase in the number of adsorption sites. Further increasing of the mass of NPs does not influence the adsorption efficiency; therefore, 30 mg of NPs was taken as mNPs,eq (i.e., an adsorbent dosage of 1.5 mg/mL) for further investigation of the adsorption process. This value offers a good compromise between cost and efficiency.

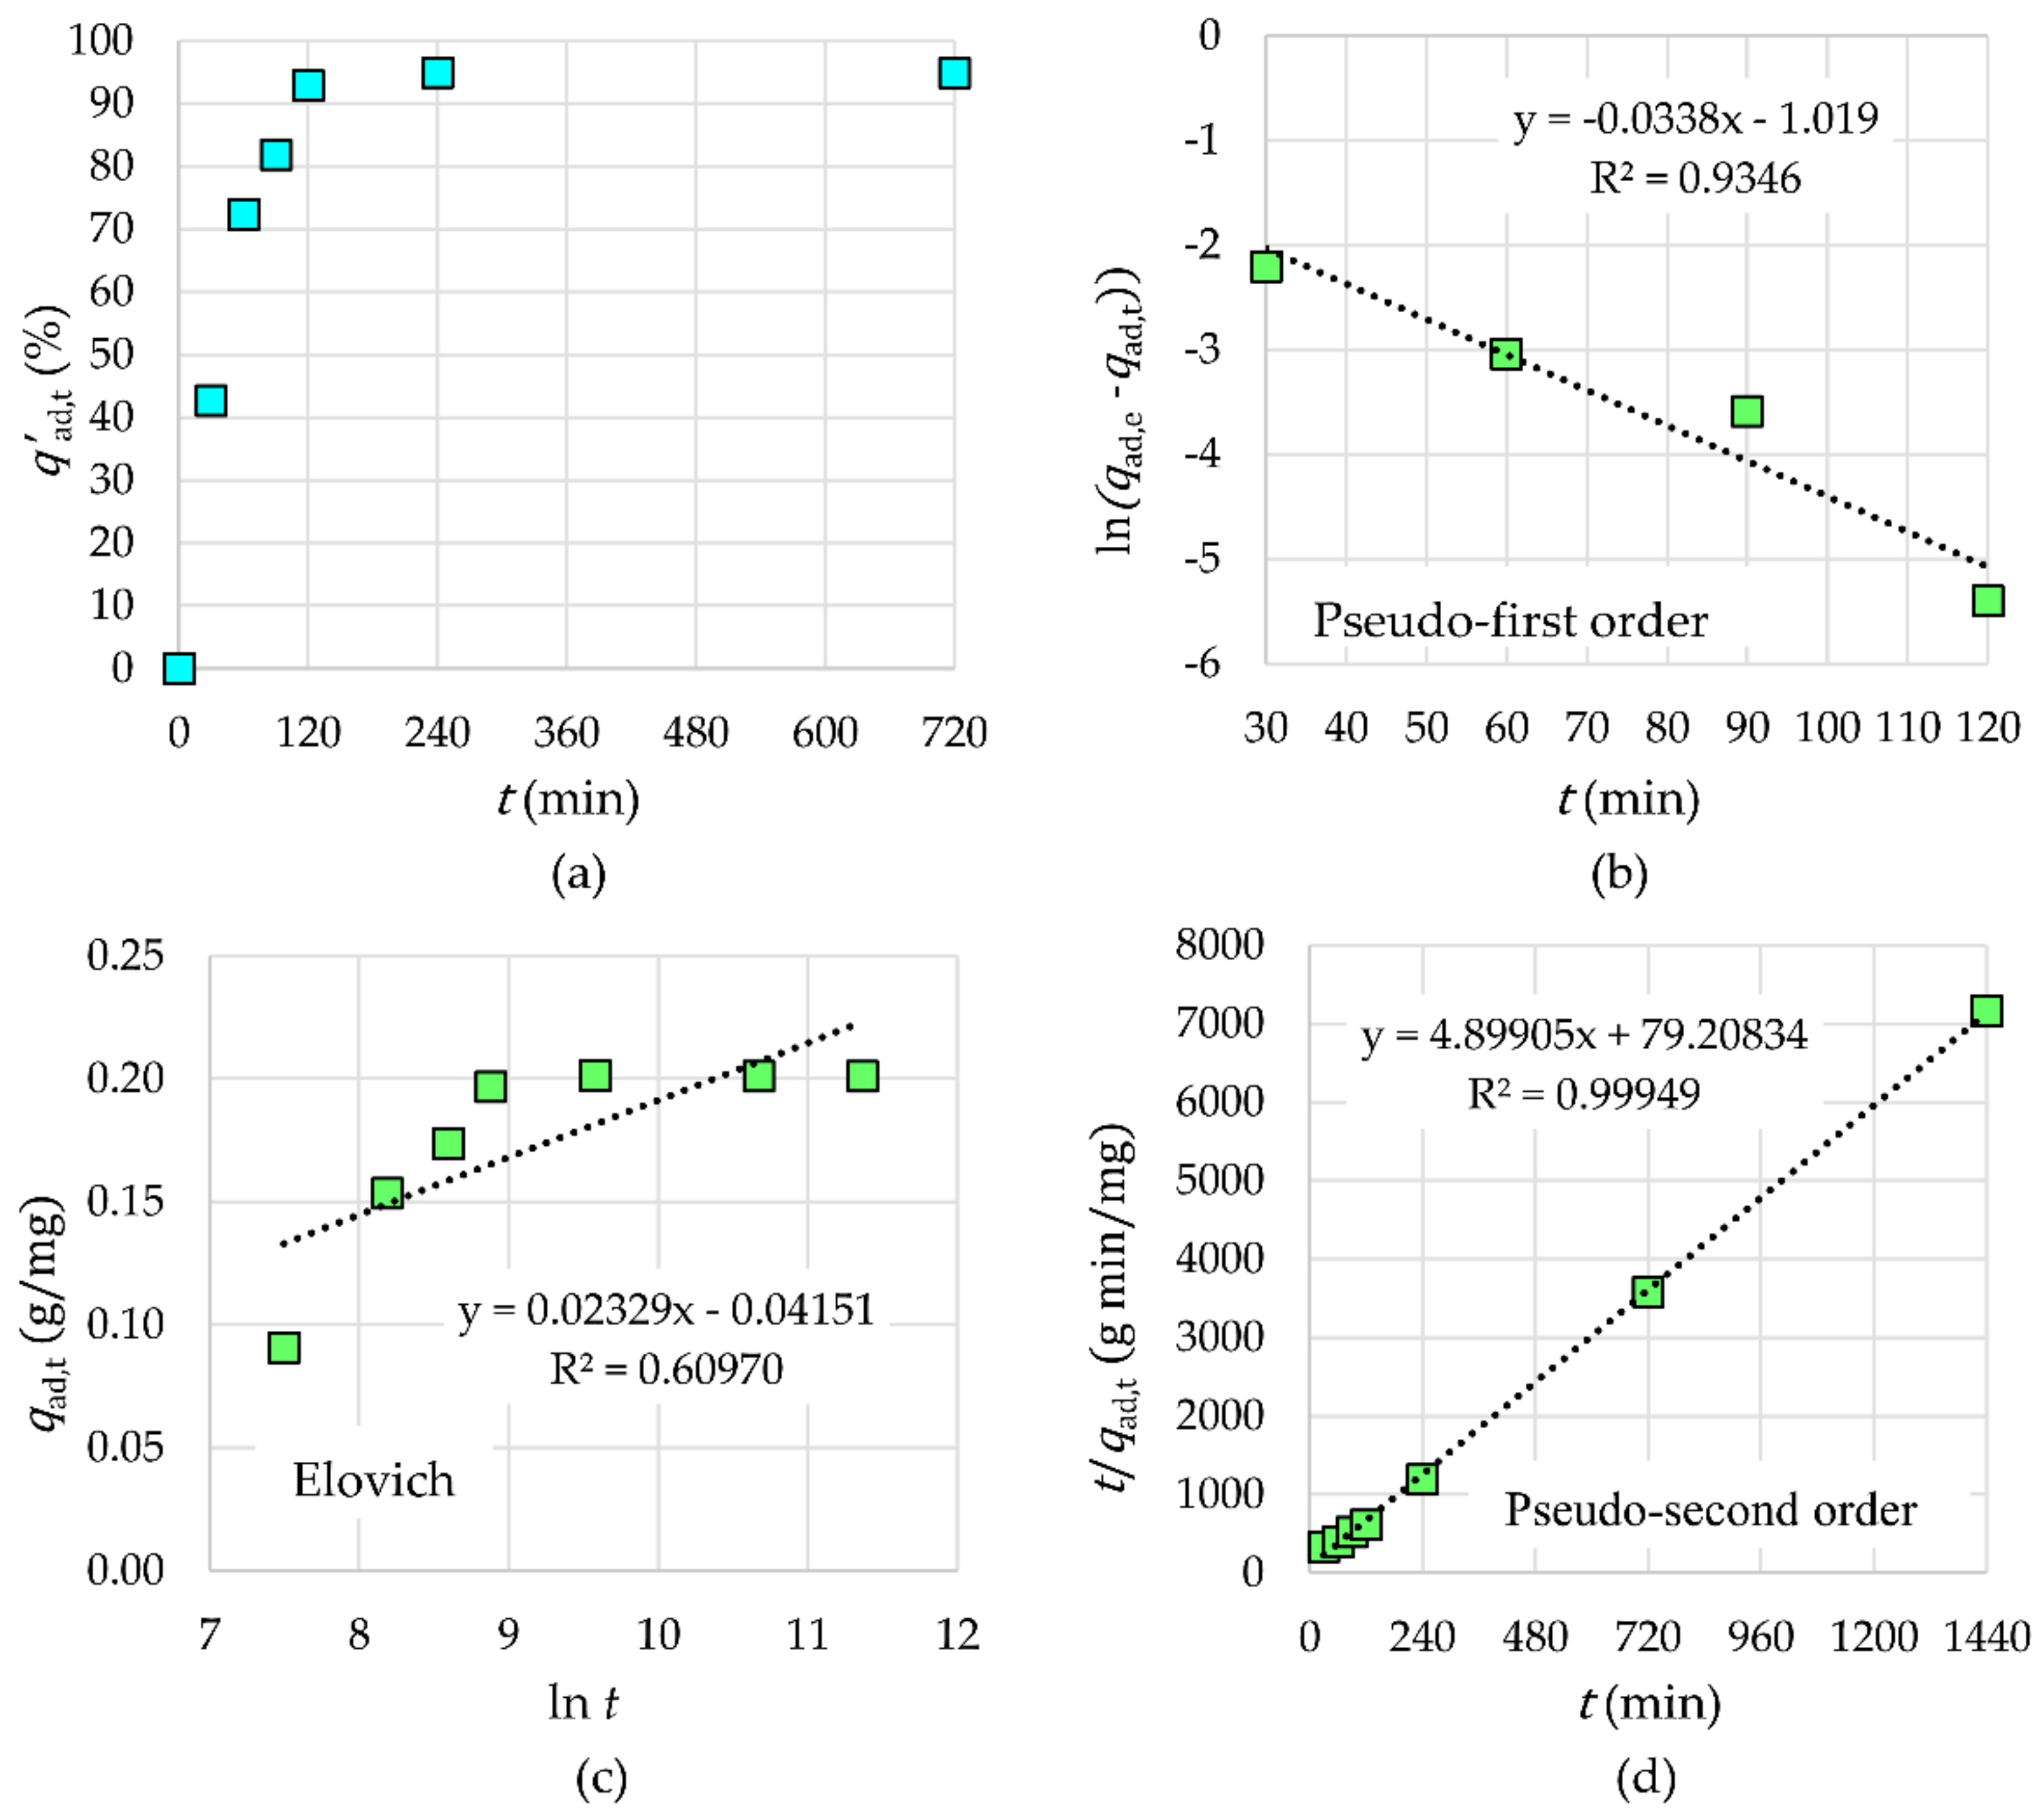
2.3.2. Kinetic Study

The adsorption kinetics of Tb3+ by γ-Fe2O3-NH4OH@SiO2(APTMS) NPs is shown in Figure 11. One can see that Tb3+ were completely removed from the aqueous solution within 120 min of contact time (V = 20 mL, mNPs = 30 mg, cads,0 = 2 × 10⁻⁶ M, and Tad = 25 °C). Among the tested models (pseudo-first order, Elovich, and pseudo-second order), the experimental data fitted very well with the pseudo-second order rate equation with an R2 value close to 0.9995. The appropriate values of parameters of the pseudo-second order kinetic model are as follows: k2 = 0.3030 g·mg−1·min−1 and qad,e = 0.2041 mg/g for Tb3+ adsorption. The rate-limiting step may be chemical adsorption or chemisorption through sharing or exchange of electrons between adsorbents and adsorbates. In the initial time interval of 120 min, the adsorption efficiency increases rapidly, which means that the chemical adsorption worked at a low rate.

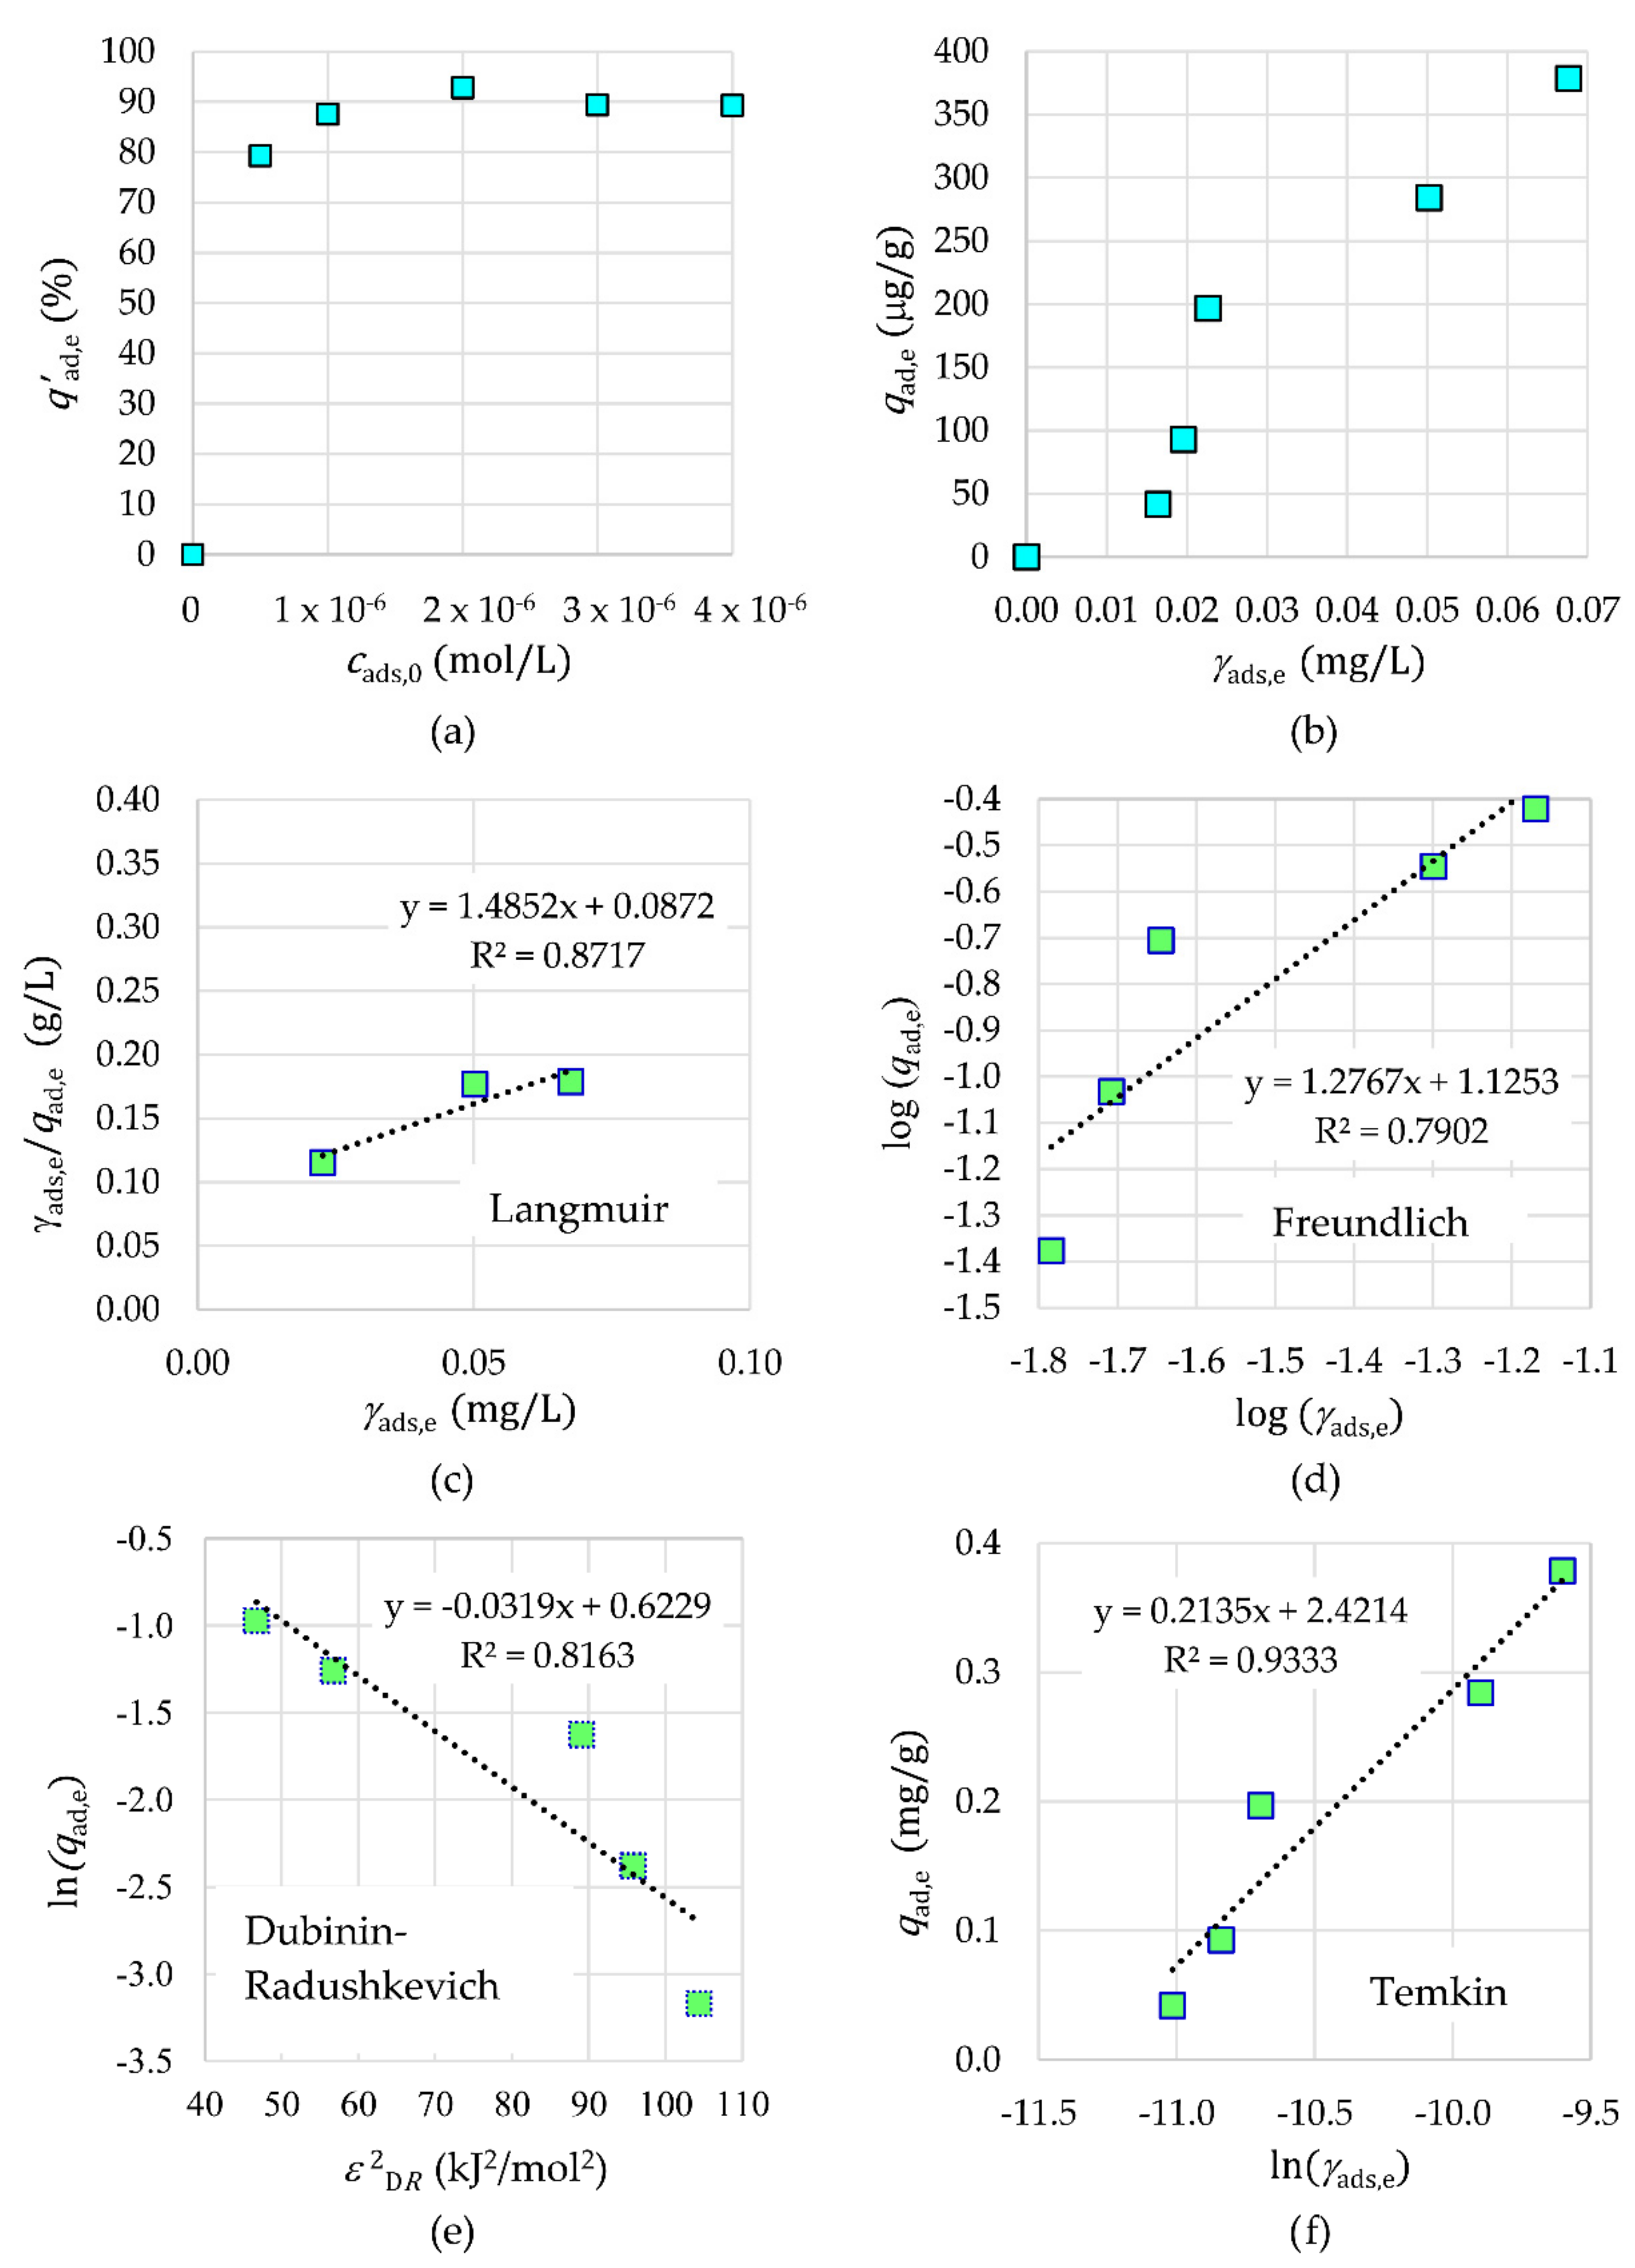
2.3.3. Adsorption Isotherms

The results in Figure 12 show that the adsorption efficiency increased with an increasing initial concentration of Tb3+ cads,0 and reached a plateau at a higher concentration due to saturation of the number of binding sites in a fixed amount of NPs. The optimum initial concentration relates mainly to the availability of active sites, which is interrelated to the presence of surface functional groups. The adsorption capacity in equilibrium qads,e for Tb3+ with respect to the equilibrium mass concentration of adsorbate γads,e shows an S-type adsorption isotherm (Figure 12). This means low adsorption at a very low Tb3+ concentration and then a rapid increase of adsorption with the increasing Tb3+ concentration, until there is no more space on the surface of the nanoparticle to hold the adsorbates. The S-type isotherm confirms that the synthesized NPs are a porous material with the cohesive forces between adsorbate and adsorbent being greater than those between adsorbate molecules. To characterize the adsorption equilibria, the linear data from Langmuir, Freundlich, Dubinin–Radushkevich, and Temkin isotherms for Tb3+ as adsorbate are presented in Figure 12. The experimental data fitted very well with the Temkin adsorption isotherm with an R2 value of 0.9333 for Tb3+. The values of appropriate parameters of the Temkin isotherm are as follows: bT = 1.1605 × 10⁴ J·g·mol−1·mg−1 and AT = 8.4242 × 10⁴ L/g for Tb3+. The Temkin isotherms confirm the chemisorption and the assumptions that the adsorption energy decreases linearly with the increase in coverage of the adsorbent surface and that the binding energy is uniformly distributed.
Due to the fact that the Temkin isotherm model fits very well with the Tb3+ adsorption data, it can be concluded that the heat of adsorption of all molecules of the tested Tb3+ in the γ-Fe2O3-NH4OH@SiO2(APTMS) NP layer is not the same. Furthermore, the adsorption is not monolayer, and transmigration of adsorbate in the plane of the NP surface is present.
The maximum adsorption capacity relates mainly to the availability of an active site, which is correlated to the presence of surface functional groups. The neutral nitrogen atoms of –NH2 and –NH– groups have a lone pair of electrons that could be shared with rare earth ions, thus leading to the formation of a coordination bond between the N atoms of the amino groups from APTMS and rare earth atoms. The coordination number of Tb3+ is 9. Due to the hypothesis that the primary and secondary amino groups are the most important sites for Tb3+ adsorption, the predicted adsorption mechanism is based on coordination of Tb3+ with one or two amino groups. Meanwhile, the remaining coordination sites may be provided by water molecules [43]. The predicted adsorption mechanism for Tb3+ adsorption on the surface of γ-Fe2O3-NH4OH@SiO2(APTMS) NPs can be written as:
R-NH2 + Tb3+ ⇌ [Tb(R-NH2)(H2O)8]3+.

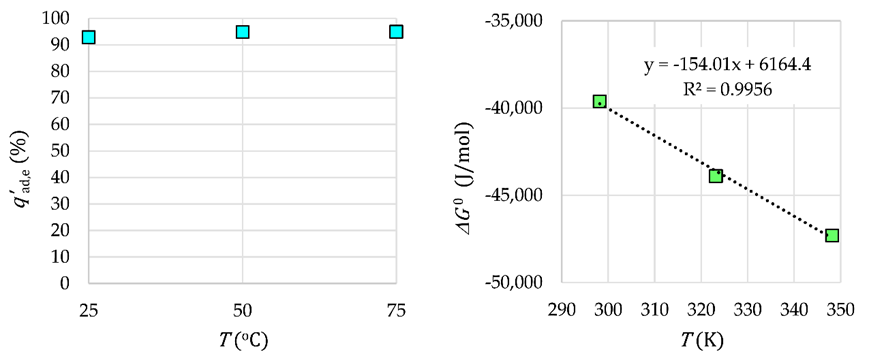
2.3.4. Thermodynamic Study

The Tb3+ adsorption efficiency on γ-Fe2O3-NH4OH@SiO2(APTMS) NPs at various temperatures and the linearization of the Van’t Hoff equation are presented in Figure 13. The thermodynamic data are given in Table 1.
In the case of Tb3+ adsorption on γ-Fe2O3-NH4OH@SiO2(APTMS) NPs, a change in the standard enthalpy or the adsorption heat ΔH0 > 0 is obtained. Therefore, this adsorption is an endothermic reaction. The resulting positive change in the standard entropy ΔS0 > 0, similar to the negative Gibbs free energy ΔG0 < 0, indicates a spontaneous adsorption reaction. The endothermic and spontaneous adsorption reaction of Tb3+ on γ-Fe2O3-NH4OH@SiO2(APTMS) NPs can be explained by good dissolution of Tb3+ in water. When dissolving Tb-salt in water, water molecules coat the ions, and molecular bonds between the ions and water are formed: hydration. In order for Tb3+ to be adsorbed, they must lose a part of their hydrating coat. This ion dehydration process requires energy that is greater than the released heat during adsorption of the ions on the surface of the adsorbent. Therefore, the removal of water from the Tb3+ coating is an endothermic process whose energy exceeds the energy of the exothermic reaction of adsorption of ions that are attached to the surface. The obtained Gibbs energy values are negative, which is expected for a spontaneous adsorption process.

3. Materials and Methods

3.1. Materials

For each used material, its chemical formula, purity, molar mass, density at 25 °C, and Chemical Abstract Service (CAS) number and supplier are given as follows: 2-propanol (C3H8O, 99.8%, 60.1 g/mol, 0.785 g/mL, CAS 67-63-0, Gram Mol), 3-aminopropyltrimethoxysilane (APTMS) (C6H17NO3Si, 97%, 179.29 g/mol, 1.027 g/mL, CAS 13822-56-5, Merck), ammonium hydroxide (NH4OH, 25%, 35.05 g/mol, 0.91 g/mL, CAS 1336-21-6, Gram Mol), ethanol (C2H5OH, 96%, 46.07 g/mol, 0.810 g/mL, CAS 64-17-5, Honeywell), ferric chloride hexahydrate (FeCl3·6H2O, 270.3 g/mol, 1.82 g/mL, CAS 10025-77-1, Sigma Aldrich), ferrous chloride tetrahydrate (FeCl2·4H2O, 198.81 g/mol, 1.93 g/mL, CAS 13478-10-9, Sigma Aldrich), terbium(III)chloride hexahydrate (TbCl3·6H2O, 99.9%, 373.38 g/mol, 4.35 g/mL, CAS 13798-24-8, Sigma Aldrich), tetraethyl orthosilicate (TEOS) (C6H20O4Si, 99%, 208.33 g/mol, 0.94 g/mL, CAS 78-10-4, Sigma Aldrich), tiron monohydrate (C6H4Na2O8S2·H2O, 98%, 314.2 g/mol, CAS 149-45-1, Sigma Aldrich), tris(hydroxymethyl) aminomethane (H2NC(CH2OH)3, 121.14 g/mol, 0.8 g/mL, CAS 77-86-1, Merck). All chemicals were used as received without further purification. For the preparation of all suspensions and solutions, deionized water (dH2O) was used.

3.2. Synthesis of γ-Fe2O3-NH4OH@SiO2(APTMS) NPs

At first, 25% NH4OH (150 mL) was heated up to (87 ± 2) °C and stirred (300 rpm). The solution (50 mL of 0.5 M) of FeCl2⋅4H2O (1.6735 g) and FeCl3⋅6H2O (4.5505 g) was added to the prepared ammonium solution and heated by reflux at (87 ± 2) °C. The reaction (60 min, pH 9.9) was carried out in a round-bottom reaction flask. The particles were precipitated and separated from the reaction mixture by a permanent magnet and washed several times with dH2O. The washing process includes addition of dH2O, decantation of NPs by a magnet, and removal of the supernatant. The 25% NH4OH solution (25 mL) was added to the washing sediment of γ-Fe2O3 NPs (~1.6 g) into the reaction flask. After the reaction (24 h, 50 °C) under continuous stirring, the stabilized γ-Fe2O3-NH4OH NPs were separated from the supernatant with a permanent external magnet and the dH2O was added. The silica shell from TEOS and functionalization with APTMS was performed “in-situ”. For this purpose, 2-propanol (66 mL), dH2O (15.42 mL), 25% NH4OH solution (1.7 mL), the prepared γ-Fe2O3-NH4OH colloid suspension (4.93 mL, 1.038 g/mL), TEOS (0.324 mL), and APTMS (0.518 mL) were mixed under magnetic stirring (500 rpm) in a closed vessel (24 h, 25 °C). After the completed reaction, the sediment was washed with ethanol and dH2O several times, and the magnetic stabilized and functionalized γ-Fe2O3-NH4OH@SiO2(APTMS) core@shell NPs were decanted by using an external magnet.

3.3. Characterization and Adsorption Techniques

The synthesized γ-Fe2O3-NH4OH@SiO2(APTMS) NPs were characterized in order to analyze their structural, morphological, thermogravimetric, surface charge, and magnetic properties. XRD analysis was used for structural characterization with a Brucker D4 Endavor X-ray diffractometer, equipped with Cu Kα radiation (λ = 0.15418 nm); the measurement was done at room temperature within the range of Bragg’s angle 2θ from 20° to 80°. A Fourier Transform Infrared (FT-IR) spectrometer of the type PerkinElmer with Spectrum GX software was applied to qualitatively identify the functional groups on the material. FT-IR spectra were recorded at room temperature in a range of 400–4000 cm−1 in the transmittance mode. The amounts of the functional groups were quantitatively determined via a potentiometric titration using a two-burette Mettler T-70 instrument, equipped with a Mettler T DG 117 combined glass electrode. The burettes were filled with 0.1 M HCl and 0.1 M KOH. The stability criterion for taking a reading after each addition was set to 0.1 mV/20 s, where 20 s was the minimum time to reach equilibrium conditions between additions of the titrant, and the maximum time was set to 180 s. Thermogravimetric analysis (TGA) was performed on the dried powdered samples (previously dried at 80 °C for 10 h) in alumina crucibles, with the heating rate of 20 °C/min by using a PerkinElmer TGA 4000 under a nitrogen atmosphere (20 mL/min) up to 900 °C. The particles were observed by transmission electron microscopy (TEM) using a Jeol JEM-2100 (JEOL USA, Inc., Peabody, MA, USA), where the nanoparticles were deposited on a copper-grid-supported, perforated, and transparent carbon film. Energy Dispersive X-ray Spectroscopy (EDXS) mapping analysis was performed at 200 kV using a JEOL-2010 microscope. The Brunauer–Emmet–Teller (BET) technique was used to determine the specific surface area of nanoparticles by using a Micromeritics Flow Prep 060 with a Tristar II 3020. All samples were degassed at 110 °C for 24 h prior to each measurement. The specific surface area was evaluated in the 0.05–0.3 range of relative pressure in nitrogen gas at a temperature of 77.35 K after 24 h. To determine the electro kinetic effects at a moving interface, Dynamic Light Scattering (DLS) analysis was used, where the ζ-potential was measured by ZetaSizer Nano series Malvern Instruments. The saturation magnetization of NPs was studied by a Vibrating Sample Magnetometer (VSM, Lake Shore 7400) at a magnetic field H of 10,000 Oe and room temperature. The excitation wavelength of fluorescence spectroscopy was determined by a Perkin Elmer 35 UV/VIS spectrophotometer. To determine the amount of adsorbed Tb3+ on the surfaces of NPs, the emission wavelengths were identified using a Perkin Elmer LS 55 fluorescence spectrometer. In order to increase the intensity of Tb3+ fluorescence, complexes of Tb3+ with tiron monohydrate as a ligand were used. The calibration curve was determined with standard solutions, prepared from 10−4 M Tb3+ solution, 10−4 M C6H4Na2O8S2·H2O solution, and 0.05 M tris(hydroxymethyl) aminomethane solution at a pH of 7 and a temperature of 25 °C. The measurements of fluorescence of Tb3+ complexes were performed with sample solutions, where, instead of 10−4 M Tb3+ solution, the same volume of supernatant (after removal of adsorbed Tb3+ on NPs) was used.

3.4. Procedure for Adsorption

The adsorption study was performed by mixing the prescribed mass of γ-Fe2O3-NH4OH@SiO2(APTMS) NPs (mNPs) with a water solution of initial Tb3+ concentrations (cads,0) at a prescribed temperature (Tad) and at a prescribed adsorption time (tad). The adsorption capacity of the mass (mg) of adsorbed Tb3+ per mass (g) of NPs qad (mg/g) and adsorption efficiency qad (%) were calculated by using Equations (2) and (3):
q ad   =   c ads , 0     c ads , e M ads V m NPs
q ad   =   c ads , 0     c ads , e c ads , 0
where cads,0 (mol/L) and cads,e (mol/L) are the initial and equilibrium concentrations of Tb3+, respectively, V (L) denotes the solution volume, Mads (g/mol) is the molar mass of the adsorbate, and mNPs (g) is the mass of NPs.
To determine the affinity of Tb3+ on the γ-Fe2O3-NH4OH@SiO2(APTMS) NP surface, the adsorption conditions (equilibrium mass of adsorbent, adsorption time, initial Tb3+ concentration, and temperature of adsorption) were changed. The Tb3+/γ-Fe2O3-NH4OH@SiO2(APTMS) NPs were removed from aqueous solution with an external permanent magnet. For determination of the adsorption capacity, UV/VIS spectroscopy and fluorescence spectroscopy were used.
The influence of the equilibrium mass mNPs,eq of γ-Fe2O3-NH4OH@SiO2(APTMS) NPs as an adsorbent up to 40 mg (to weigh a mass, the Mettler Toledo XPE205 balance was used) for Tb3+ on the adsorption was tested for: V = 20 mL, tad = 120 min, cads,0 = 2 × 10⁻⁶ M, and Tad = 25 °C.
Then, the influence of adsorption time (up to 1440 min) at the determined mNPs,eq for Tb3+, V = 20 mL, cads,0 = 2 × 10⁻⁶ M, and Tad = 25 °C was investigated. The equivalence adsorption time tad,eq and the most appropriate kinetic model were determined. The tested kinetic models were pseudo-first order, Elovich, and pseudo-second order models using the equations shown in Table 2, where the symbols used are: qad,t (mg/g), adsorption capacity in time t; qad,e (mg·g−1·min−1), equilibrium adsorption capacity; t (min), adsorption time; qad,e,exp (mg/g), experimentally obtained equilibrium adsorption capacity; k1 min−1, a constant of the pseudo-first order model; αE (mg·g−1·s−1), the initial sorption rate in the Elovich model; βE (g/mg), a constant related to the extent of surface coverage and activation energy for chemisorption in the Elovich model; and k2 (g·mg−1·min−1), a constant of the pseudo-second order model [44,45]. In the pseudo-first order kinetic model, the appearance of adsorption is assumed only on localized sites. Further assumptions are: no interaction between adsorbate ions, independence of adsorption energy on surface coverage, and the influence of the saturated monolayer of adsorbates on the NP surface on maximum adsorption. On the other hand, the Elovich model considers the interaction between adsorbate ions by adsorption on localized sites of NPs and a linear increase of the adsorption energy with the surface coverage. The pseudo-second order kinetic model is based on the assumption that the rate-limiting step may be chemical adsorption involving valence forces through sharing or exchange of electrons between the adsorbent and adsorbate, where the removal from a solution is due to the physicochemical interaction between two phases.
The initial Tb3+ concentration was varied (up to 4 × 10⁻⁶ M) in order to study the adsorption isotherm of Tb3+ on the surface of γ-Fe2O3-NH4OH@SiO2(APTMS) NPs at V = 20 mL, mNPs,eq, tad,eq, and Tad = 25 °C. Low Tb3+ concentrations were used due to investigation of the adsorption of Tb3+ from aqueous solution with a very low concentration of Tb3+ (from 5 × 10⁻⁷ M to 4 × 10⁻⁶ M). The experimental data were interpreted by Langmuir, Freundlich, Dubini–Radushkevich, and Temkin adsorption isotherms using the equations shown in Table 3, where the symbols used are: qad,e (mg/g), equilibrium adsorption capacity; qm (mg/g), adsorption monolayer coverage capacity; KL (L/mg), Langmuir isotherm constant; γads,e (mg/L), equilibrium mass concentration of adsorbate; KF ((mg/g)·(L/mg)1/n), Freundlich isotherm constant; n(/), dsorption intensivity; qs (mg/g), theoretical isotherm saturation capacity; KDR (mol2·kJ−2), εDR (kJ2·mol−2), Dubinin–Radushkevich constant; T (K), temperature; R (8.314 J·mol−1·K−1), a gas constant; bT (J·g·mol−1·mg−1), Temkin isotherm constant; AT (L/g), the Temkin isotherm equilibrium binding constant [46,47,48,49,50]. The Langmuir isotherm describes quantitatively the formation of a monolayer adsorbate on the outer surface of NPs, and after that no further adsorption takes place. The Langmuir isotherm is valid for monolayer adsorption onto a surface containing a finite number of identical sites. The model assumes uniform energies of adsorption onto the surface and no transmigration of the adsorbate in the plane of the surface. The Freundlich isotherm describes the adsorption characteristics of a heterogeneous surface. The Dubinin–Radushkevich isotherm model expresses the adsorption mechanism with a Gaussian energy distribution onto a heterogeneous surface of NPs. The Temkin isotherm model assumes that the heat of adsorption of all molecules in the layer decreases linearly rather than logarithmically with coverage, and it takes into account the adsorbate–adsorbent interaction.
The thermodynamic analysis of Tb3+ adsorption on the surface of γ-Fe2O3-NH4OH@SiO2(APTMS) NPs was done at various temperatures of adsorption. The free energy ΔG0 was evaluated by applying Gibb’s free energy (Equation (4)) and the standard enthalpy change ΔH0; entropy change ΔS0 was calculated from the Van’t Hoff Equation (5):
G 0 = R · T · ln K d = R · T · ln γ r · q ad , e γ ads , e
G 0 = H 0 T · S 0
where ΔG0 (J/mol) denotes the Gibb’s energy change, ΔH0 (J/mol) is the standard enthalpy change, ΔS0 (J·mol−1·K−1) is the entropy change, T (K) is the adsorption temperature, R (8.314 J·mol−1·K−1) is the gas constant, kd (/) is the distribution coefficient, γr (1000 g/L) is the mass concentration of water, qad,e (mg/g) is the equilibrium mass concentration, and γads,e (mg/L) is the equilibrium mass concentration of the adsorbate in aqueous solution.
On the basis of the calculated distribution constant Kd and Gibb’s energy ΔG0 at various temperatures and from the linearization of Equation (3) by a linear plot of ΔG0 = f(T), the standard enthalpy change ΔH0 and the entropy change ΔS0 were determined.

4. Conclusions

Magnetic γ-Fe2O3 NPs stabilized with NH4OH, coated by SiO2, and functionalized by APTMS were synthesized, characterized, and investigated as an adsorbent for Tb3+ adsorption from aqueous solution. One of the advantages of γ-Fe2O3-NH4OH@SiO2(APTMS) NPs is their simple synthesis procedure and good properties, confirmed by XRD, FT-IR, TGA, TEM, EDXS, DLS, and VSM characterization and the adsorption process. The experimental data of endothermic spontaneous adsorption of Tb3+ were well-fitted to the Temkin’s adsorption isotherm and pseudo-second order kinetic model. The grafted and functionalized NPs have good magnetization properties. Therefore, NPs with adsorbed Tb3+ can be easily retrieved from the solution using a small external magnet. The main advantage of this study is that adsorption takes place at a neutral pH, which is environmentally friendly. Furthermore, the obtained high adsorption efficiency of the low concentration of Tb3+ from aqueous solution confirms a promising application of γ-Fe2O3-NH4OH@SiO2(APTMS) NPs as an adsorbent for Tb3+. The maximum adsorption efficiency was obtained at a contact time of 120 min, an adsorbent dosage of 1.5 mg/mL, an initial concentration of Tb3+ of 2 × 10⁻⁶ M, and at a temperature of 25 °C. In future work, it might be reasonable to investigate the optimal adsorption conditions (pH, agitation speed), the possibility of adsorption of other REE3+ on these functionalized magnetic nanoparticles, as well as the separation of various REE3+ by selective uptake.

Author Contributions

Conceptualization, T.K., A.K., A.L. and I.B.; methodology, T.K., A.K. and I.B.; formal analysis, T.K., I.B. and A.K.; investigation, T.K.; experiments, T.K.; writing—original draft preparation, T.K.; writing—review and editing, T.K., I.B., A.K. and A.L.; supervision, I.B. and A.L.; project administration, A.L.; funding acquisition, A.L.

Funding

This research received no external funding.

Acknowledgments

The project MetRecycle is supported by the ERA-NET Cofound on Raw Materials (ERA-MIN 2) under Horizon 2020. We express our gratitude to the European Commission and the national funding organization Slovenian Ministry of Education, Science and Sport (www.mizs.gov.si/en) for co-financing the project MetRecycle.

Conflicts of Interest

The authors declare no conflict of interest.

References

  1. De Lima, I.B.; Leal Filho, W. Rare Earths Industry: Technological, Economic, and Environmental Implications; Elsevier Publisher: Amsterdam, The Netherlands, 2016. [Google Scholar]
  2. Chakhmouradian, A.R.; Wall, F. Rare earth elements: Minerals, Mines, Magnets. Elements 2012, 8, 333–340. [Google Scholar] [CrossRef]
  3. Charalampides, G.; Vatalis, K.I.; Apostolos, B.; Ploutarch-Nikola, B. Rare earth elements: Industrial applications and economics dependency of Europe. Procedia Econ. Finance 2015, 24, 126–135. [Google Scholar] [CrossRef]
  4. Migaszewskia, Z.M.; Gałuszka, A. The characteristics, occurrence, and geochemical behavior of rare earth elements in the environment: A review. Crit. Rev. Env. Sci. Technol. 2015, 45, 429–471. [Google Scholar] [CrossRef]
  5. Golev, A.; Scott, M.; Erskine, P.D.; Ali, A.H.; Ballantyne, G.R. Rare earths supply chains: Current status, constraints and opportunities. Resour. Policy 2014, 41, 52–59. [Google Scholar] [CrossRef]
  6. Binnemans, K.; Jones, P.T. Rare earths and the balance problem. J. Sustain. Metall. 2015, 1, 29–38. [Google Scholar] [CrossRef]
  7. Zhou, B.; Li, Z.; Zhao, Y.; Zhang, C.; Wei, Y. Rare earth elements supply vs. clean energy technologies: New problems to be solve. Mineral Resour. Manag. 2016, 32, 29–44. [Google Scholar] [CrossRef]
  8. Shen, L.; Wu, N.; Zhong, S.; Gao, L. Overview on China’s rare earth industry restructuring and regulation reforms. J. Resour. Ecol. 2017, 8, 213–222. [Google Scholar]
  9. Zhang, S. On problem in rare earth exports of China and countermeasures. Int. Bus. Manag. 2013, 6, 21–25. [Google Scholar]
  10. Haque, N.; Hughes, A.; Lim, S.; Vernon, C. Rare earth elements: Overview of mining, mineralogy, uses, sustainability and environmental impact. Resources 2014, 3, 614–635. [Google Scholar] [CrossRef]
  11. Tunsu, C.; Petranikova, M.; Gergorić, M.; Ekberg, C.; Retegan, T. Reclaiming rare earth elements from end-of-life products: A review of the perspectives for urban mining using hydrometallurgical unit operations. Hydrometallurgy 2015, 156, 239–258. [Google Scholar] [CrossRef]
  12. Anastopoulos, I.; Bhatnagar, A.; Lima, E.C. Adsorption of rare earth metals: A review of recent literature. J. Mol. Liq. 2016, 221, 954–962. [Google Scholar] [CrossRef]
  13. Ogata, T.; Narita, H.; Tanaka, M. Adsorption mechanism of rare earth elements by adsorbents with diglycolamic acid ligands. Hydrometallurgy 2016, 163, 156–160. [Google Scholar] [CrossRef]
  14. Roosen, J.; Binnemans, K. Adsorption and chromatographic separation of rare earths with EDTA and DTPA functionalized chitosan biopolymers. J. Mater. Chem. A 2014, 2, 1530–1540. [Google Scholar] [CrossRef]
  15. Wang, F.; Zhao, J.; Pan, F.; Zhou, H.; Yang, X.; Li, W.; Liu, H. Adsorption properties toward trivalent rare earths by alginate beads doping with silica. Ind. Eng. Chem. Res. 2013, 52, 3453–3461. [Google Scholar] [CrossRef]
  16. Ramasamy, D.L.; Repo, E.; Srivastava, V.; Sillanpää, M. Chemically immobilized and physically adsorbed PAN/acetylacetone modified mesoporous silica for the recovery of rare earth elements from the waste water-comparative and optimization study. Water Res. 2017, 114, 264–276. [Google Scholar] [CrossRef]
  17. Ms, A.R.; Arm, A.R. Removal of heavy metals from industrial waste water by biomass based materials: A review. J. Pollut. Eff. Cont. 2017, 5, 1–13. [Google Scholar]
  18. Fisher, A.; Kara, D. Determination of rare earth elements in natural water samples—A review of sample separation, preconcentration and direct methodologies. Anal. Chim. Acta 2016, 935, 1–29. [Google Scholar] [CrossRef]
  19. Patra, S.; Roy, E.; Madhuri, R.; Sharma, P.K. Removal and recycling of precious rare earth elements from wastewater samples using imprinted magnetic ordered mesoporous carbon. ACS Sustain. Chem. Eng. 2017, 5, 6910–6923. [Google Scholar] [CrossRef]
  20. Zhang, H.; McDowell, R.G.; Martin, L.R.; Qiang, Y. Selective extraction of heavy and light lanthanides from aqueous solution by advanced magnetic nanosorbents. ACS Appl. Mater. Inter. 2016, 8, 9523–9531. [Google Scholar] [CrossRef]
  21. Jafarizadeh-Malmiri, H.; Sayyar, Z.; Anarjan, N.; Berenjian, A. Nanobiotechnology in Food: Concepts, Applications and Perspectives; Springer Nature: Cham, Switzerland, 2019. [Google Scholar]
  22. Li, X.; Zhang, F.; Zhao, D. Highly efficient lanthanide upconverting nanomaterials: Progress and challenges. Nano Today 2013, 8, 643–676. [Google Scholar] [CrossRef]
  23. Wang, F.; Zhao, J.; Pan, F.; Zhou, H.; Yang, X.; Li, W.; Liu, H. O-carboxymethyl chitosan entrapped by silica: Preparation and adsorption behavior toward neodymium (III) ions. J. Chem. Technol. Biotechnol. 2013, 88, 317–325. [Google Scholar] [CrossRef]
  24. Ogata, T.; Narita, H.; Zanaka, M. Adsorption behavior of rare earth elements on silica gel modified with diglycol amic acid. Hydrometallurgy 2015, 152, 178–182. [Google Scholar] [CrossRef]
  25. Vázquez, O.F.G.; Virgen, M.R.M.; Montoya, V.H.; Gómez, R.T.; Flores, J.L.A.; Cruz, M.A.P.; Morán, M.A.M. Adsorption of heavy metals in the presence of a magnetic fields on adsorbents with different magnetic properties. Ind. Eng. Chem. Res. 2016, 55, 9323–9331. [Google Scholar] [CrossRef]
  26. Rajczykowski, K.; Loska, K. Stimulation of heavy metal adsorption process by using a strong magnetic field. Water Air Pollut. 2018, 229, 1–7. [Google Scholar] [CrossRef]
  27. Tang, S.C.N.; Yan, D.Y.S.; Lo, M.C. Sustainable wastewater treatment using microsized magnetic hydrogel with magnetic separation technology. Ind. Eng. Chem. Res. 2014, 53, 15718–15724. [Google Scholar] [CrossRef]
  28. Iftekhar, S.; Srivastava, V.; Sillanpää, M. Enrichment of lanthanides in aqueous system by cellulose based silica nanocomposite. Chem. Eng. J. 2017, 320, 151–159. [Google Scholar] [CrossRef]
  29. Zhu, G.; Xin, S.; Wen, Y.; Wang, Q.; Que, M.; Wang, Y. Warm white generation from a single phased phosphor Sr10[(PO4)5.5(BO4)0.5](BO2): Eu2+, Mn2+, Tb3+ for light emitting diodes. RCS Adv. 2013, 3, 9311–9318. [Google Scholar] [CrossRef]
  30. Nelli, I.; Kaczmarek, A.K.; Locardi, F.; Caratto, V.; Costa, G.A.; Deun, R.V. Multidoped Ln3+ gadolinium dioxycarbonates as tunable white light emitting phosphors. Dalton Trans. 2017, 46, 2785–2792. [Google Scholar] [CrossRef] [PubMed]
  31. Wang, M.; Li, X.; Hua, W.; Shen, L.; Yu, X.; Wang, X. Electrospun poly(acrylic acid)/silica hydrogel nanofibers scaffold for highly efficient adsorption of lanthanide ions and its photoluminescence performance. ACS Appl. Mater. Inter. 2016, 8, 23995–24007. [Google Scholar] [CrossRef]
  32. Yesiller, S.U.; Eroğlu, A.E.; Shahwan, T. Removal of aqueous rare earth elements (REEs) using nano-iron based materials. J. Ind. Eng. Chem. 2013, 19, 898–907. [Google Scholar] [CrossRef]
  33. Wang, J. Adsorption of aqueous neodymium, europium, gadolinium, terbium, and yttrium ions onto nZVI-montmorillonite: Kinetics, thermodynamic mechanism, and the influence of coexisting ions. Environ. Sci. Pollut. Res. 2018, 25, 33521–33537. [Google Scholar] [CrossRef] [PubMed]
  34. Dubey, S.S.; Grandhi, S. Sorption studies of yttrium(III) ions on nano maghemite. J. Environ. Chem. Eng. 2016, 4, 4719–4730. [Google Scholar] [CrossRef]
  35. Čakara, D.; Fras, L.; Bračič, M.; Kleinschek, K.S. Protonation behavior of cotton fabric with irreversibly adsorbed chitosan: A potentiometric titration study. Carbohydr. Polym. 2009, 78, 36–40. [Google Scholar] [CrossRef]
  36. Topel, S.D.; Legaria, E.P.; Tiseanu, C.; Rocha, J.; Nedelec, J.M.; Kessler, V.G.; Seisenbaeva, G.A. Hybrid silica nanoparticles for sequestration and luminescence detection of trivalent rare-earth ions (Dy3+ and Nd3+) in solution. J. Nanopart. Res. 2014, 16, 2783. [Google Scholar] [CrossRef]
  37. Legaria, E.P.; Topel, S.D.; Kessler, V.G.; Seisenbaeva, G.A. Molecular insight into the selective action of a magnetically removable complexone-grafted adsorbent. Dalton Trans. 2015, 44, 1273–1282. [Google Scholar] [CrossRef] [PubMed]
  38. Murray, E.; Born, P.; Weber, A.; Kraus, T. Robust, ultrasmall organosilica nanoparticles without silica shells. J. Nanopart. Res. 2014, 16, 2462. [Google Scholar] [CrossRef]
  39. Sattler, K.D. Silicon Nanomaterials Sourcebook: Low-Dimensional Structures, Quantum Dots, and Nanowires; CRC Press: Boca Raton, FL, USA, 2017. [Google Scholar]
  40. Košak, A.; Bauman, M.; Lobnik, A. Adsorption of Mercury(II), Lead(II), Cadmium(II) and Zinc(II) from Aqueous Solutions Using Mercapto-Modified Silica Particles. Int. J. Appl. Ceram. Technol. 2015, 12, 461–472. [Google Scholar] [CrossRef]
  41. Khodabakhshi, M.; Bahari, A. Investigation and characterization of maghemite (γ-Fe2O3) nanoparticles and its cytotoxicity studies. Indian. J. Pharm. Educ. 2017, 51, 295–301. [Google Scholar] [CrossRef]
  42. Nurdin, I.; Yaacob, I.I.; Johan, M.R.; Ang, B.C. Characterization and stability monitoring of maghemite nanoparticle suspensions. Adv. Mat. Res. 2012, 576, 398–401. [Google Scholar] [CrossRef]
  43. Zhao, F.; Repo, E.; Song, Y.; Yin, D.; Hammouda, S.B.; Chen, L.; Kalloola, S.; Tang, J.; Tam, K.C.; Sillanpää, M. Polyethylenimine-cross-linked cellulose nanocrystals for highly efficient recovery of rare earth elements from water and a mechanism study. Green. Chem. 2017, 19, 4186–4828. [Google Scholar] [CrossRef]
  44. Iftekhar, S.; Ramasamy, D.L.; Srivastava, V.; Asif, M.B.; Silanpää, M. Understanding the factors affecting the adsorption of Lanthanum using different adsorbents: A critical review. Chemosphere 2018, 204, 413–430. [Google Scholar] [CrossRef]
  45. Largitte, L.; Pasquier, R. A review of the kinetics adsorption models and their application to the adsorption of lead by an activated carbon. Chem. Eng. Res. Des. 2016, 109, 495–504. [Google Scholar] [CrossRef]
  46. Dada, A.O.; Olalekan, A.P.; Olatunya, A.M.; Dada, O. Langmuir, Freundlich, Temkin and Dubinin–Radushkevich isotherms studies of equilibrium sorption of Zn2+ onto phosphoric acid modified rice husk. IOSR J. Appl. Chem. 2012, 3, 38–45. [Google Scholar]
  47. Foo, K.Y.; Hameed, B.H. Insight into the modeling of adsorption isotherm systems. Chem. Eng. J. 2010, 156, 2–10. [Google Scholar] [CrossRef]
  48. Chen, X. Modeling of experimental adsorption isotherm data. Information 2015, 6, 14–22. [Google Scholar] [CrossRef]
  49. Koohaki-Mohammadpour, S.M.A.; Torab-Mostaedi, M.; Talebizadeh-Rafsanjani, A.; Naderi-Behdani, F. Adsorption isotherm, kineticm thermodynamic, and desorption studies of lanthanum and dysprosium on oxidized multiwalled carbon nanotubes. J. Disper. Sci. Technol. 2014, 35, 244–254. [Google Scholar] [CrossRef]
  50. Syafiuddin, A.; Salmiati, S.; Jonbi, J.; Fulazzaky, M.A. Application of the kinetic and isotherm models for better understanding of the behavior of silver nanoparticles adsorption onto different adsorbents. J. Environ. Manag. 2018, 218, 59–70. [Google Scholar] [CrossRef]
Figure 1. Magnetic γ-Fe2O3-NH4OH@SiO2(APTMS) nanoparticles (NPs).
Materials 12 01294 g001
Figure 2. XRD of γ-Fe2O3 NPs.
Materials 12 01294 g002
Figure 3. FT-IR spectra for γ-Fe2O3-NH4OH@SiO2(APTMS) NPs and Tb3+/γ-Fe2O3-NH4OH@SiO2(APTMS) NPs.
Materials 12 01294 g003
Figure 4. Thermogravimetric analysis (TGA) for γ-Fe2O3-NH4OH@SiO2(APTMS) NPs.
Materials 12 01294 g004
Figure 5. TEM of γ-Fe2O3 NPs (a), γ-Fe2O3-NH4OH@SiO2(APTMS) NPs (b), the electron diffraction pattern of γ-Fe2O3 NPs (c), the spinel structure of γ-Fe2O3 NPs (d).
Materials 12 01294 g005
Figure 6. EDXS of the new, gradually synthesized γ-Fe2O3-(NH4OH)@SiO2(APTMS) NPs.
Materials 12 01294 g006
Figure 7. The ζ-potential for γ-Fe2O3-(NH4OH)@SiO2(APTMS) NPs.
Materials 12 01294 g007
Figure 8. Magnetization curve of γ-Fe2O3-NH4OH@SiO2(APTMS) NPs.
Materials 12 01294 g008
Figure 9. Calibration curves of Tb3 adsorption from the fluorescence spectrometer.
Materials 12 01294 g009
Figure 10. Influence of the mass of NPs on adsorption efficiency.
Materials 12 01294 g010
Figure 11. The influence of time on adsorption efficiency (a) and kinetic models for Tb3+ adsorption: pseudo-first order (b), Elovich (c), and pseudo-second order (d).
Materials 12 01294 g011
Figure 12. The influence of initial concentration (a) and equivalent concentration (b) on adsorption. Adsorption isotherms for Tb3+ on γ-Fe2O3-NH4OH@SiO2(APTMS) NPs: Langmuir (c), Freundlich (d), Dubinin–Radushkevich (e), and Temkin (f).
Materials 12 01294 g012
Figure 13. The influence of temperature and thermodynamics for Tb3+ adsorption.
Materials 12 01294 g013
Table 1. Thermodynamic data.
Tb3+/NPsTemperature (°C)
255075
ΔG0 (J/mol)−39,606−43,900−47,307
ΔH0 (J/mol)616461646164
ΔS0 (J/(mol·K))154154154
Table 2. Kinetic models for adsorption.
Kinetic ModelNonlinear FormLinear FormLinear Plot
Pseudo-first order q ad , t =   q ad , e · 1 e k 1 · t ln q ad , e q ad , t = k 1 t + ln q ad , e ln q ad , e , exp q ad , t = f t
Elovich q ad , t = 1 β E · ln α E · β E · t q ad , t = 1 β E · ln α E · β E + 1 β E ln t q ad , t =   f ln t
Pseudo-second order q ad , t = k 2 · q ad , e 2 · t 1 + k 2 · q ad , e · t t q ad , t = 1 q ad , e · t + 1 k 2 · q ad , e 2 t q ad , t = f t
Table 3. Adsorption isotherm models.
Adsorption IsothermNonlinear FormLinear FormLinear Plot
Langmuir q ad , e = q m · K L · γ ads , e 1 + K L · γ ads , e γ ads , e q ad , e = 1 q m · γ ads , e   +   1 q m · K L γ ads , e q ad , e = f γ ads , e
Freundlich q ad , e = K F · γ ads , e 1 n log q ad , e = 1 n log γ ads , e   +   log K F log q ad , e = f log γ ads , e
Dubinin–Radushkevich q ad , e = q s · exp · K DR · ε DR 2 ,
ε D R = R · T · ln 1 + 1 γ ad s , e
ln q ad , e = ln q s K DR · ε DR 2 ln q ad , e = f ε DR 2
Temkin q ad , e = R · T b T · ln A T γ ad s , e q ad , e = R T b T ln γ ad s , e   +   R T b T ln A T q ad , e = f ln γ ads , e

