Performance Evaluation of Precast Concrete Using Microwave Heating Form


Abstract
:1. Introduction
2. Experimental Method
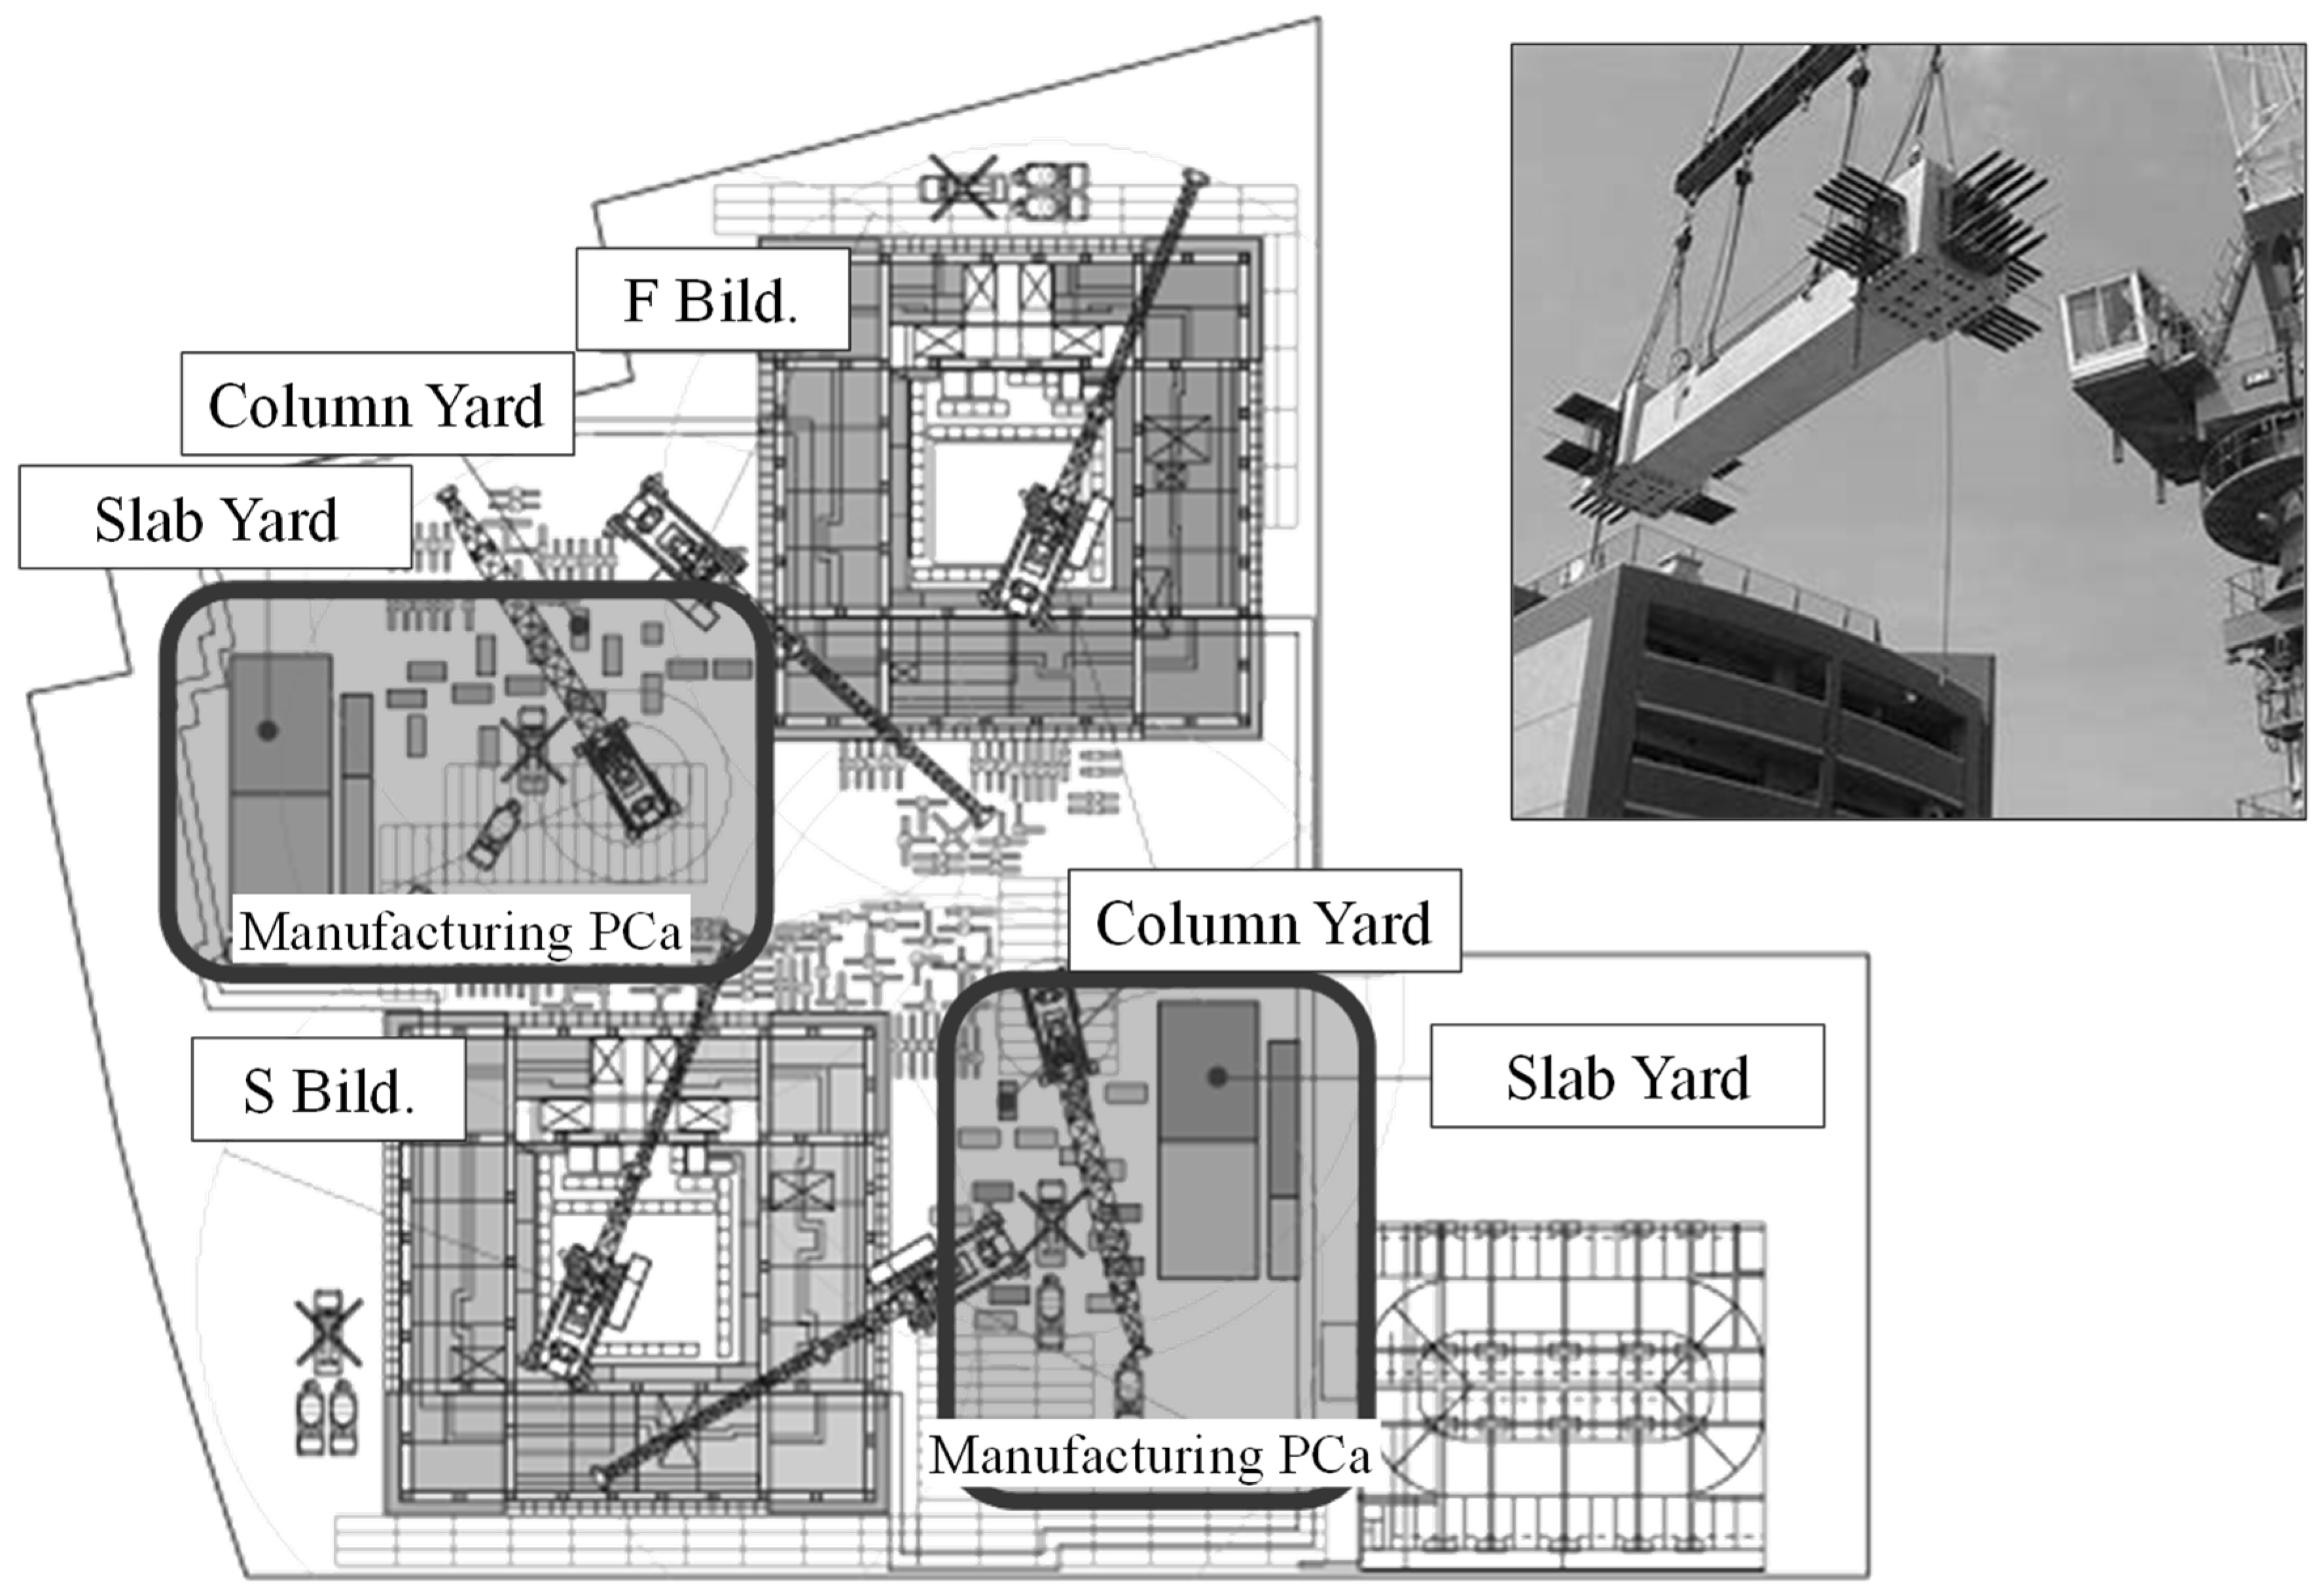
2.1. Outline of Experiment
2.2. Experimental Method
2.2.1. Evaluation of the Basic Properties of Applied Concrete
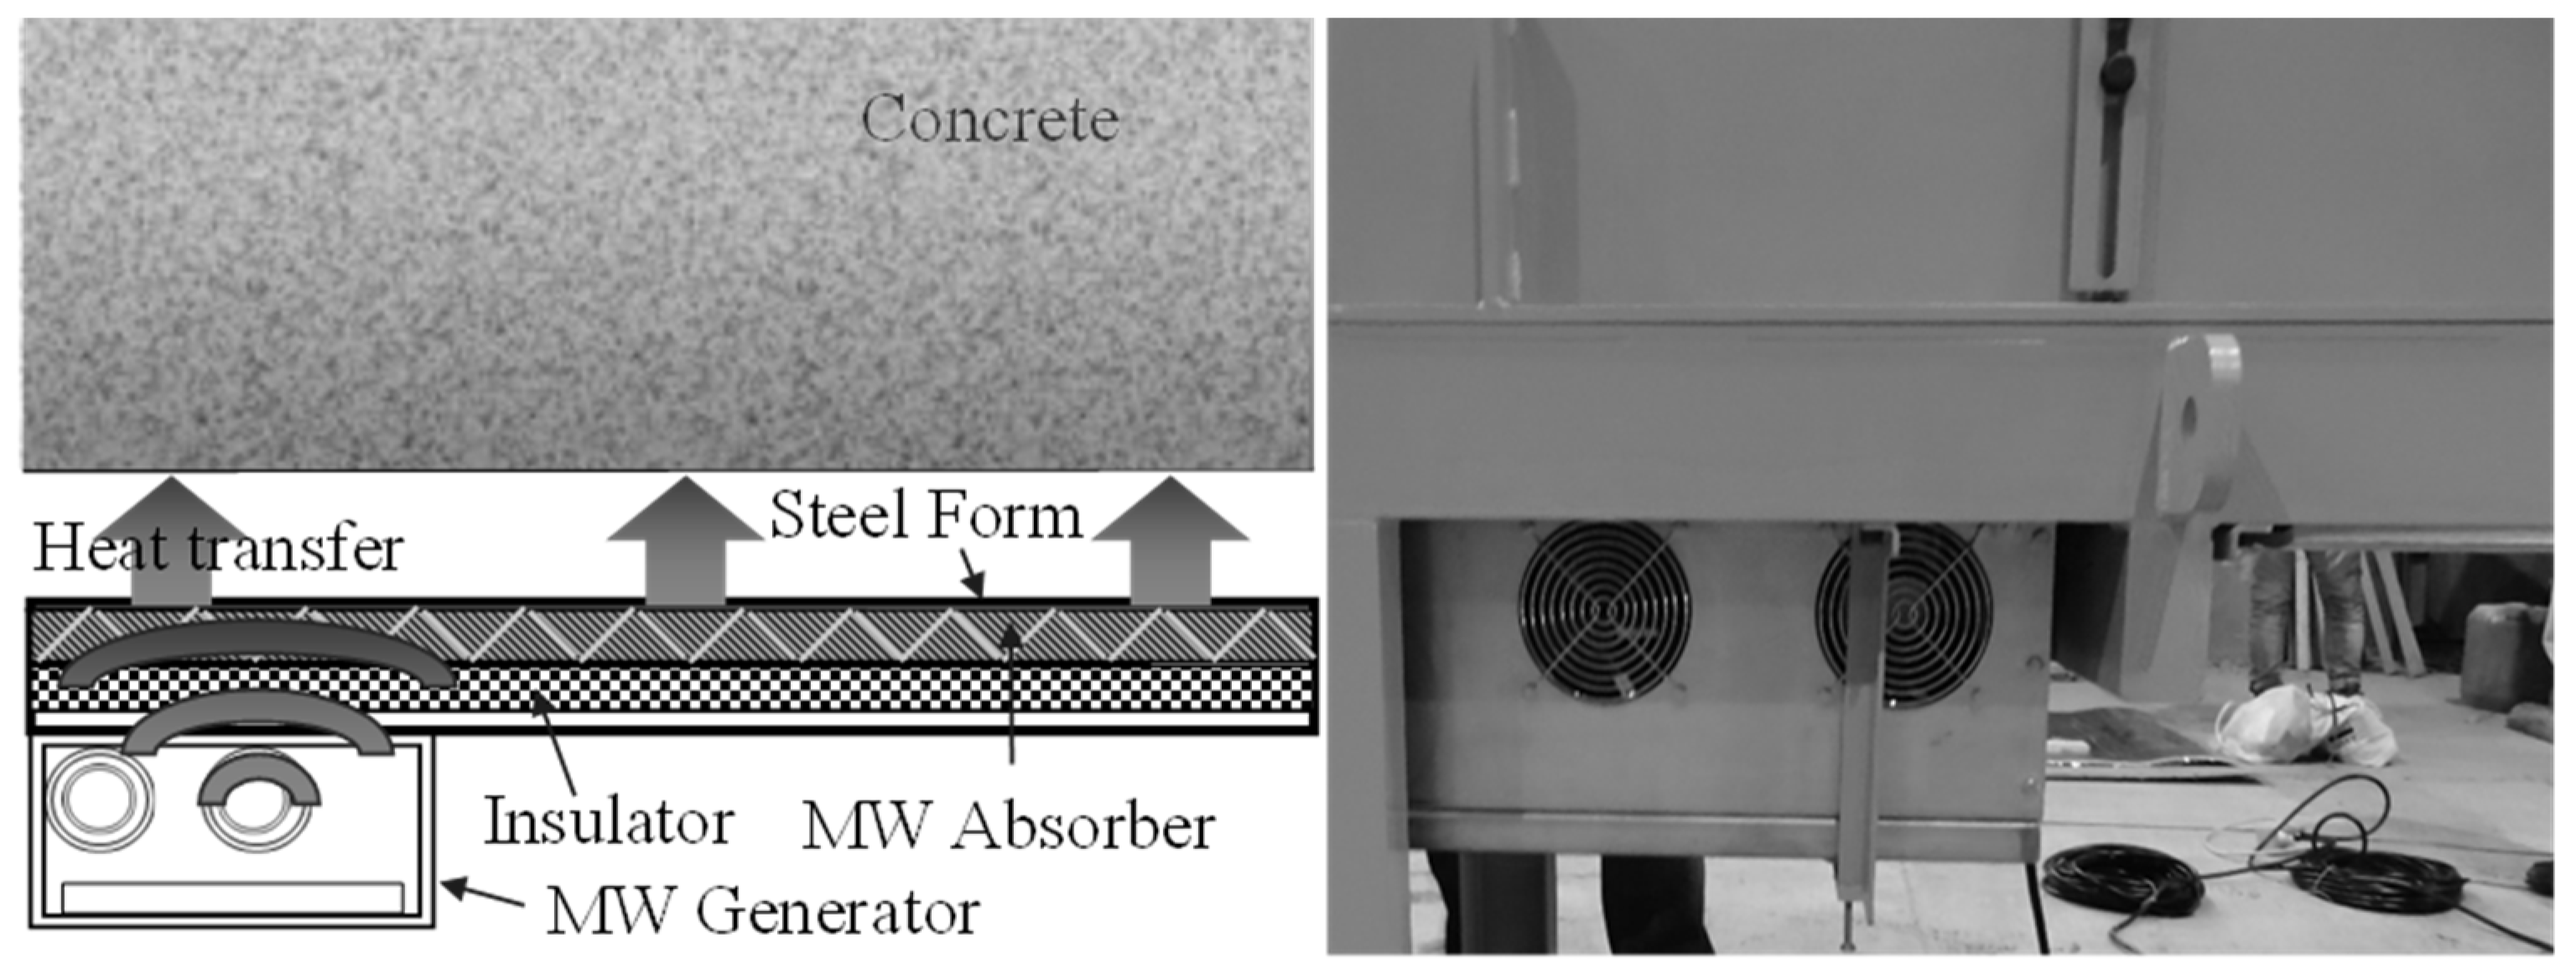
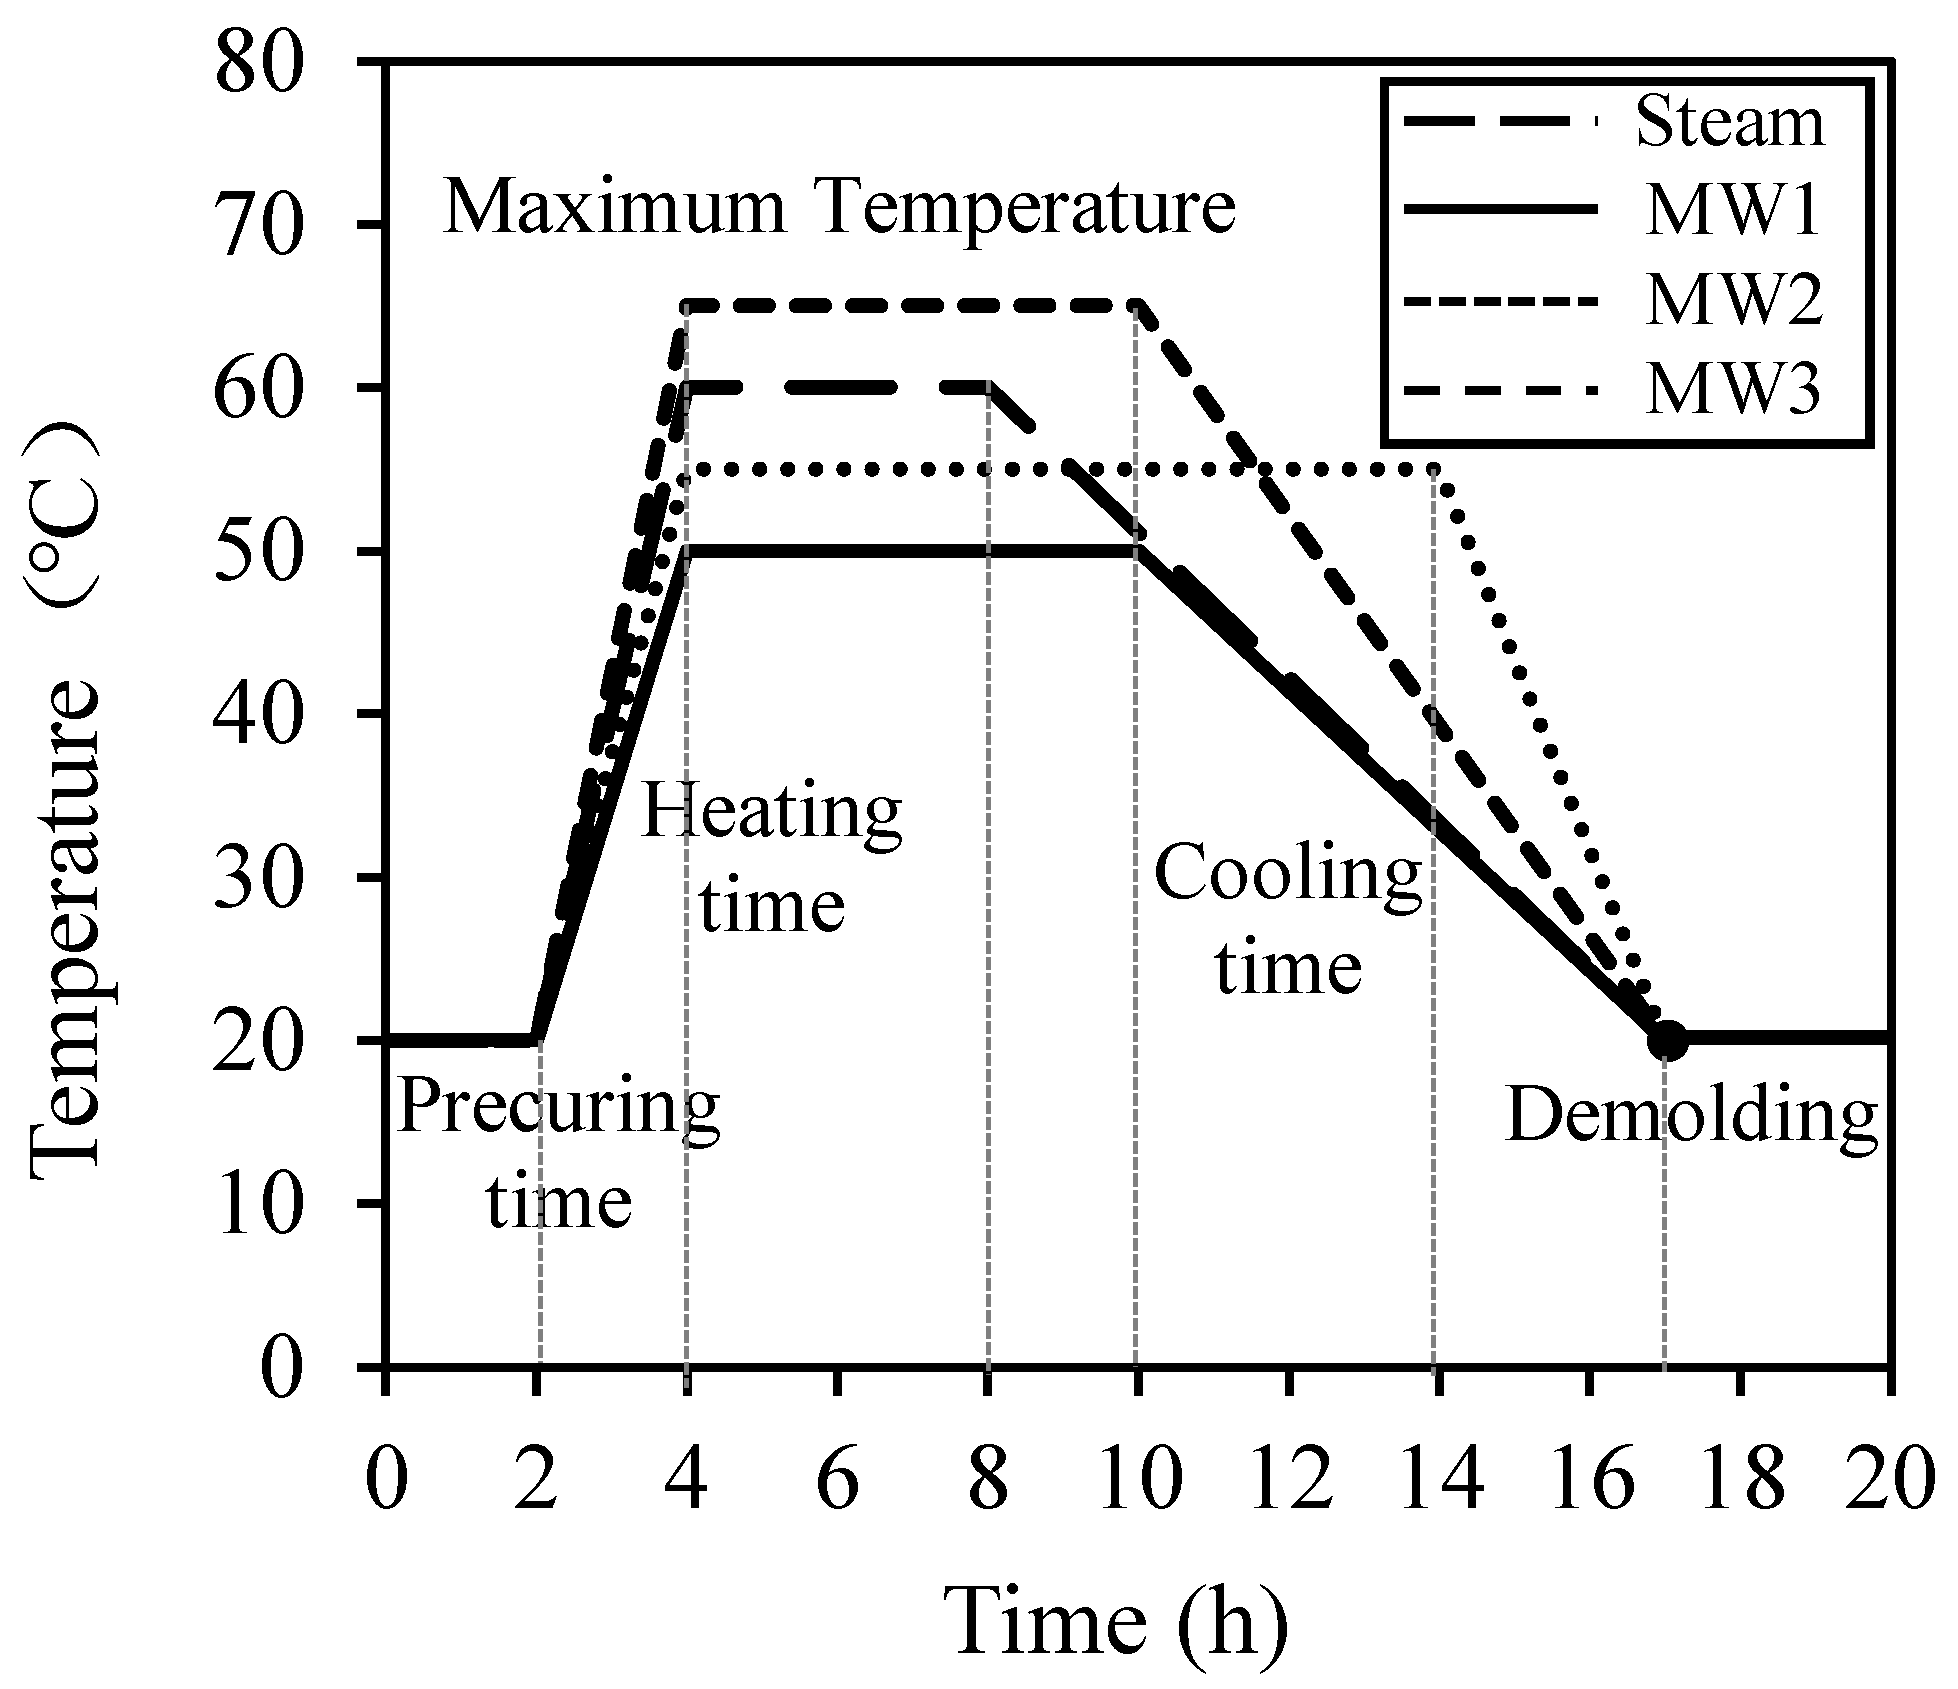
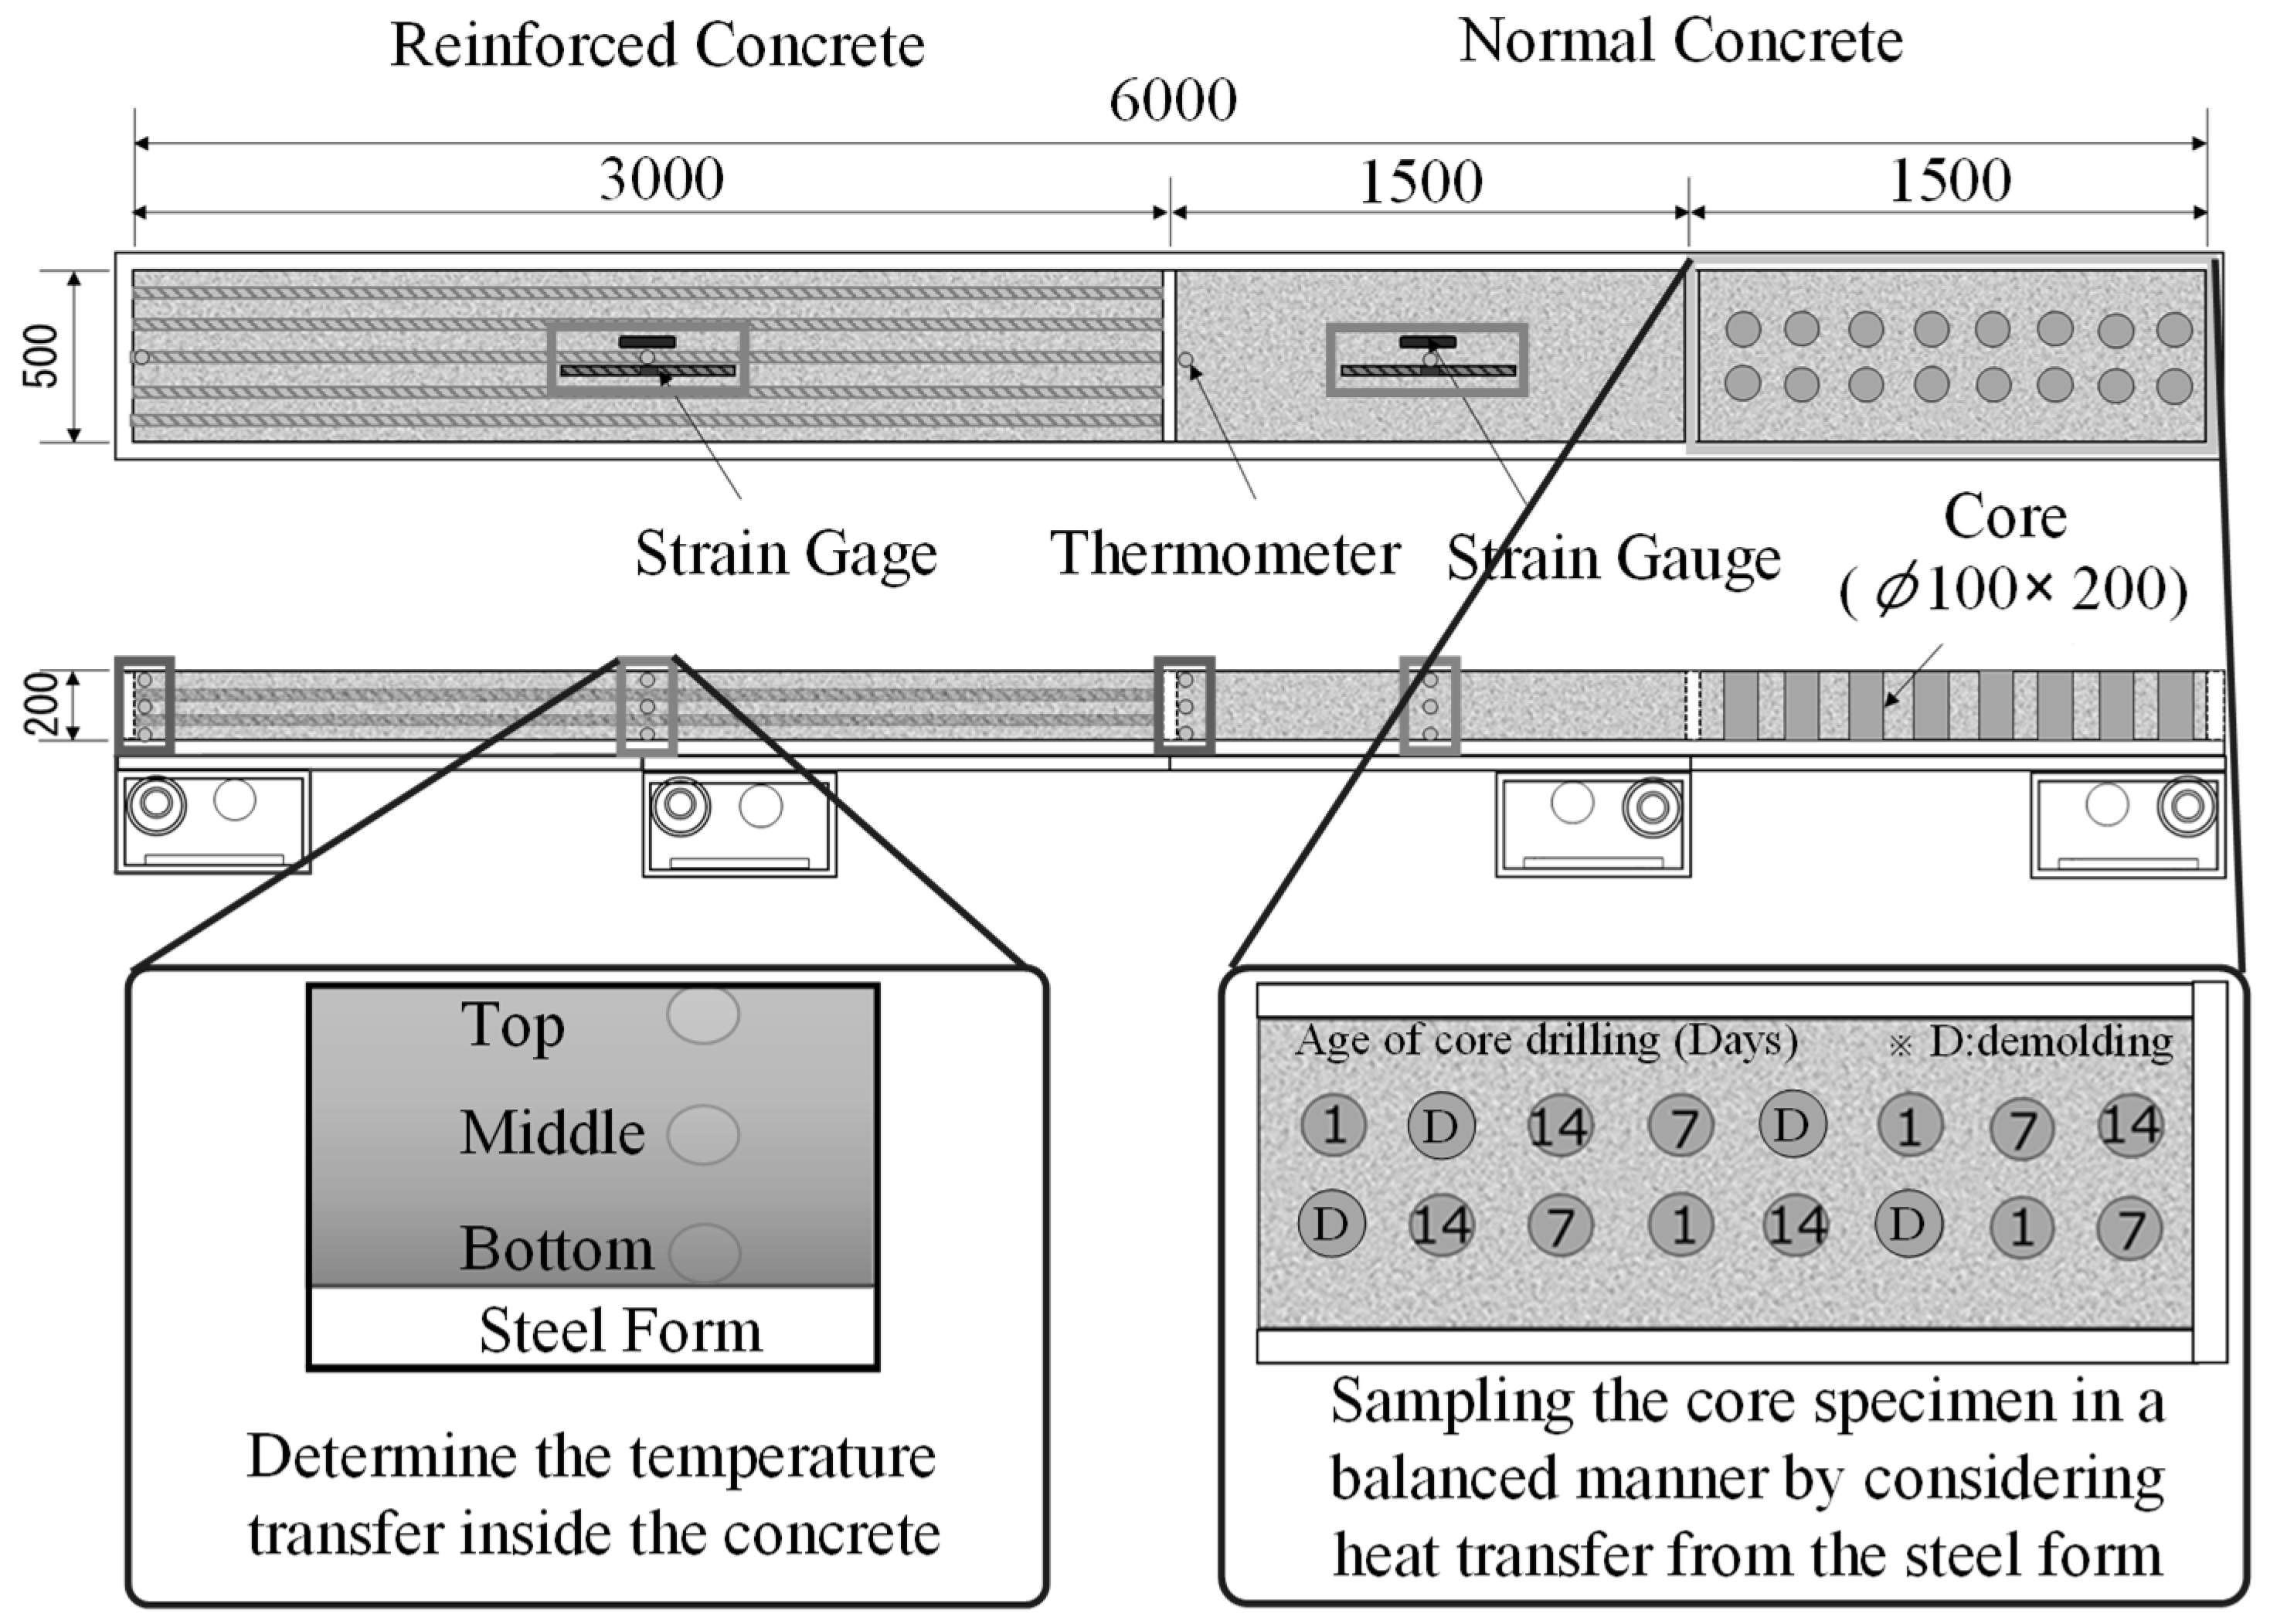
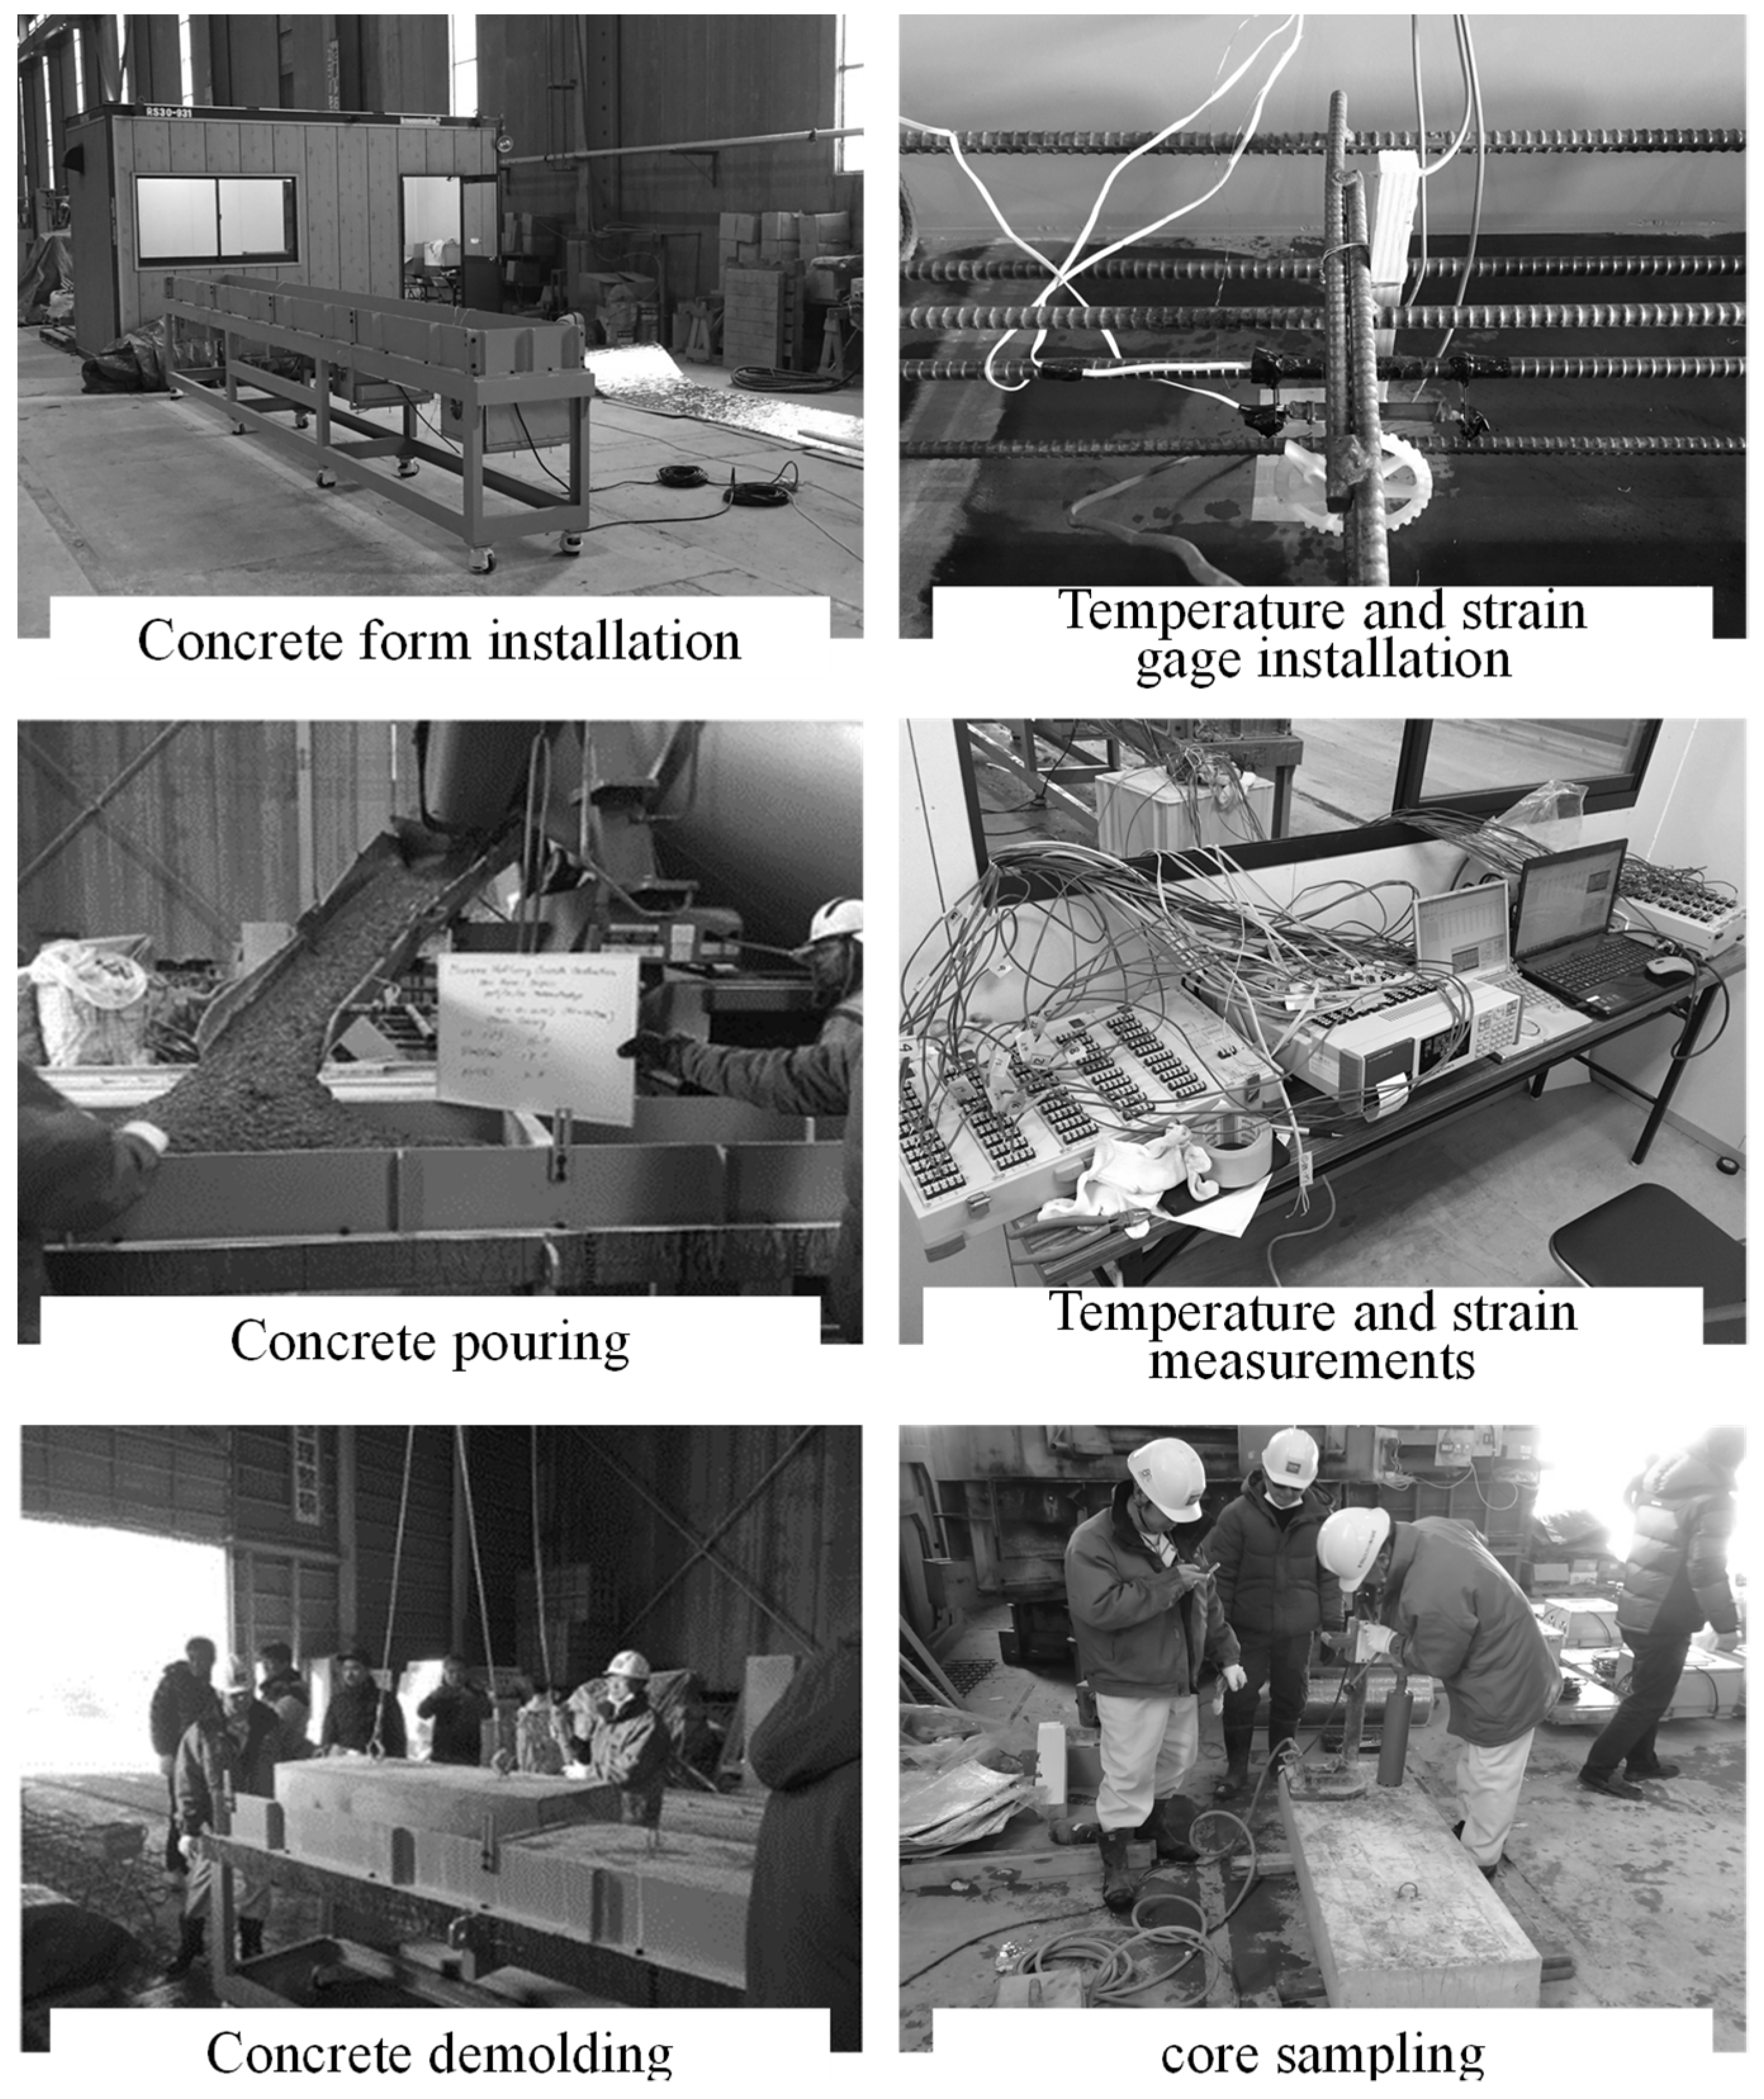
2.2.2. Performance Evaluation of Steam Curing and MW Heat Curing in a Mock-Up Sample
3. Experimental Results and Discussion
3.1. Basic Properties of Applied Concrete
3.2. Performance of Concrete Mock-Up Samples under Steam Curing and MW Heat Curing
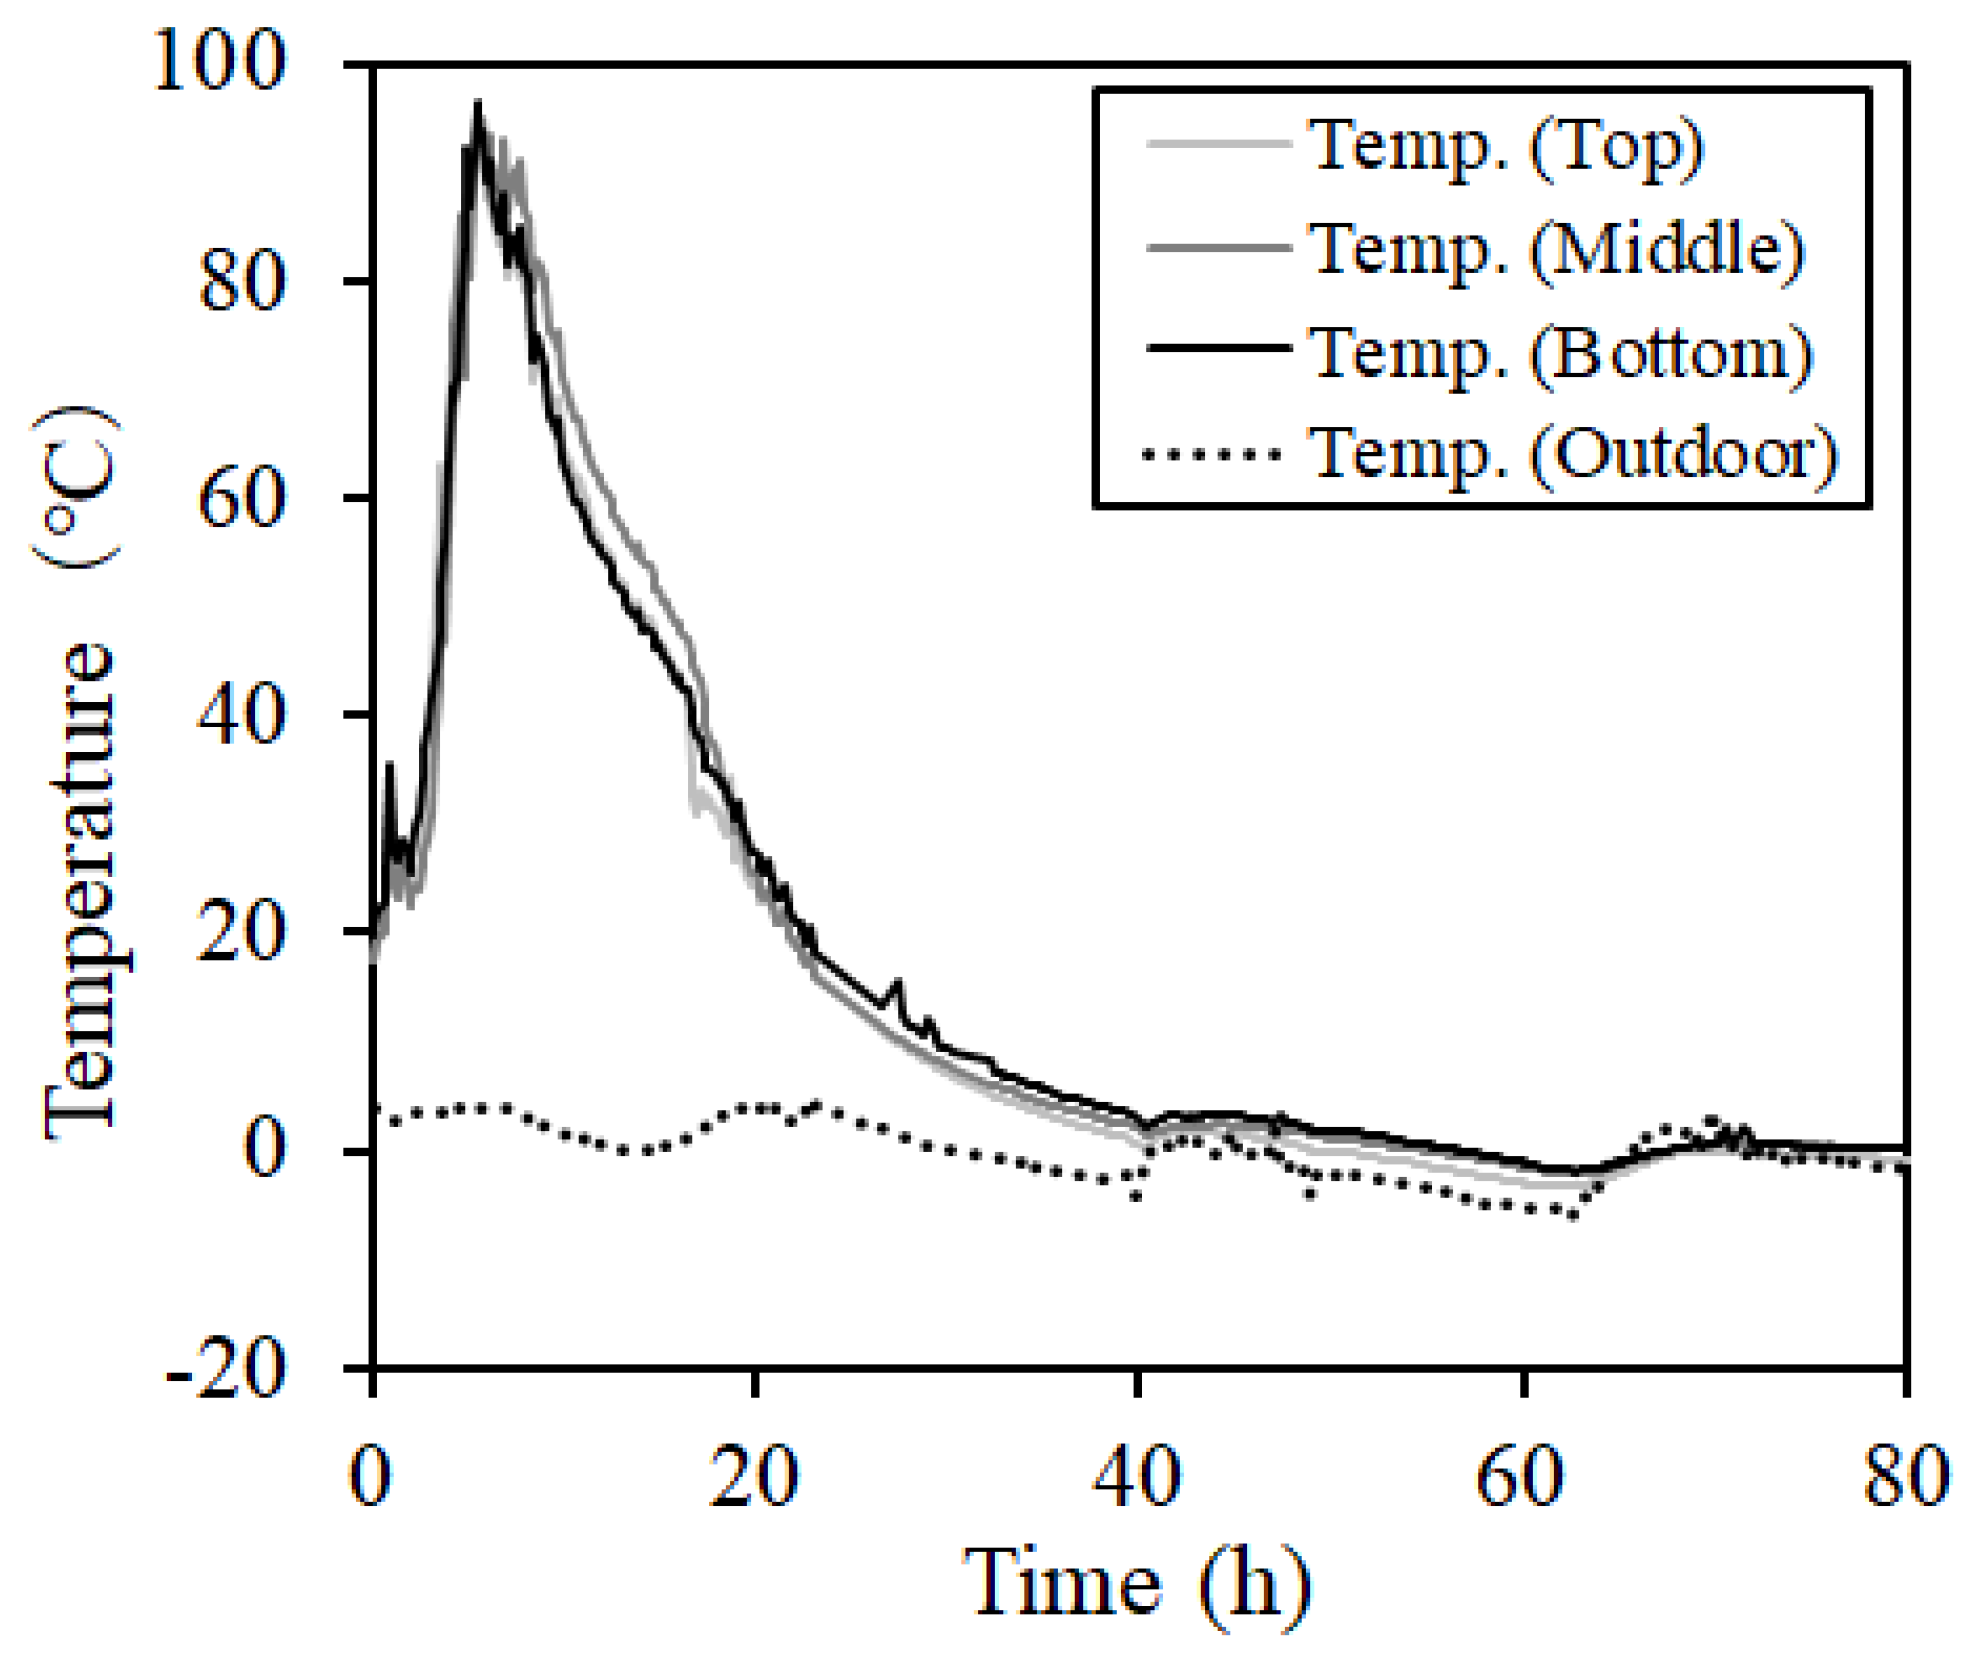
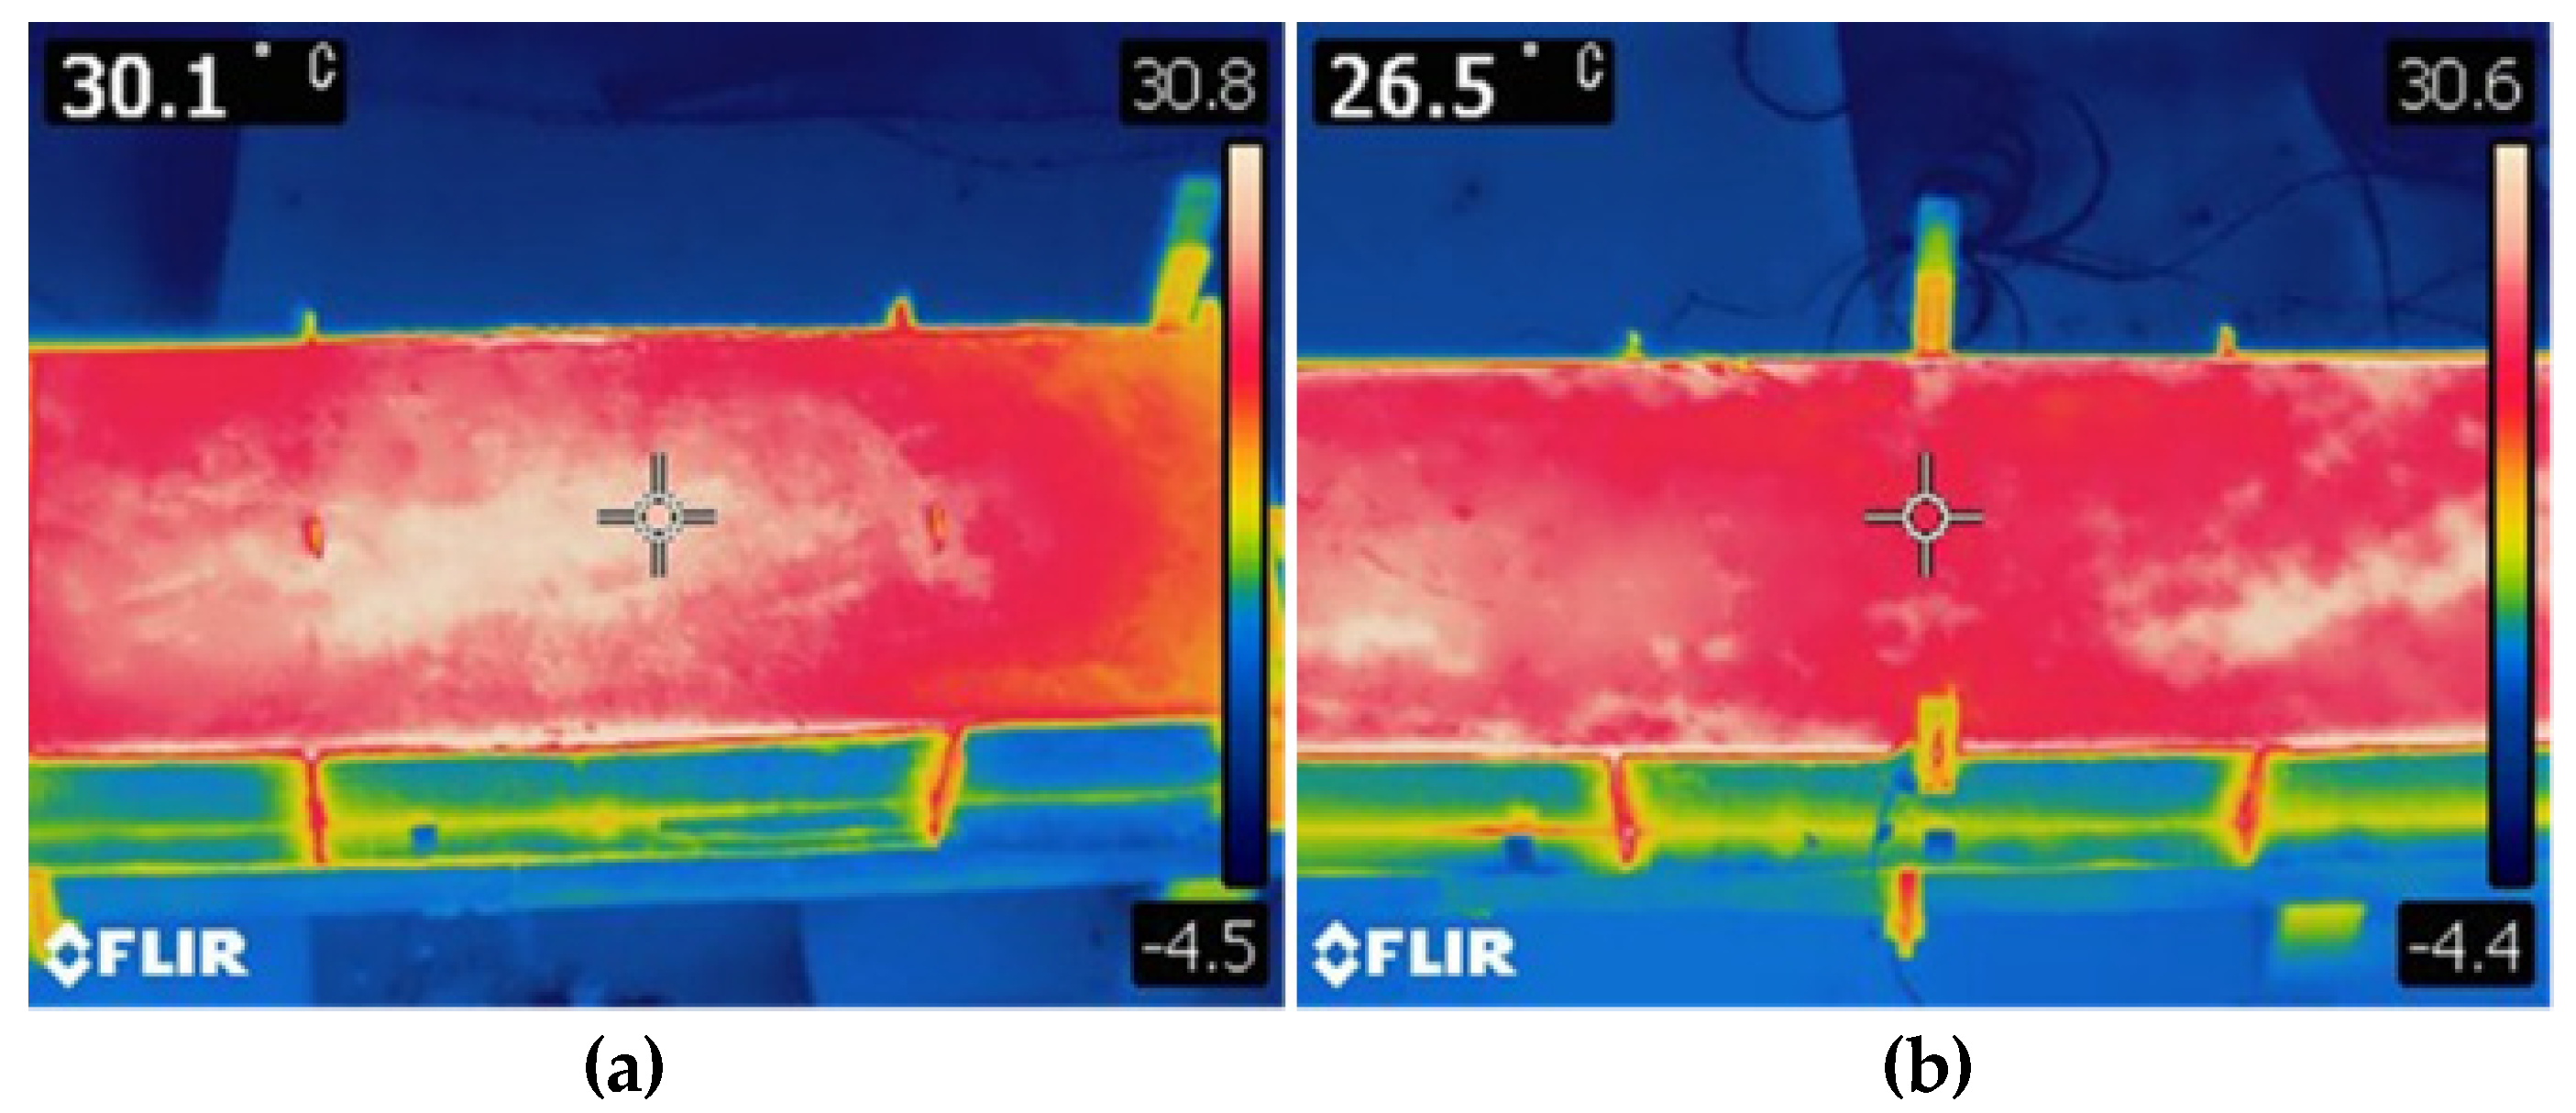
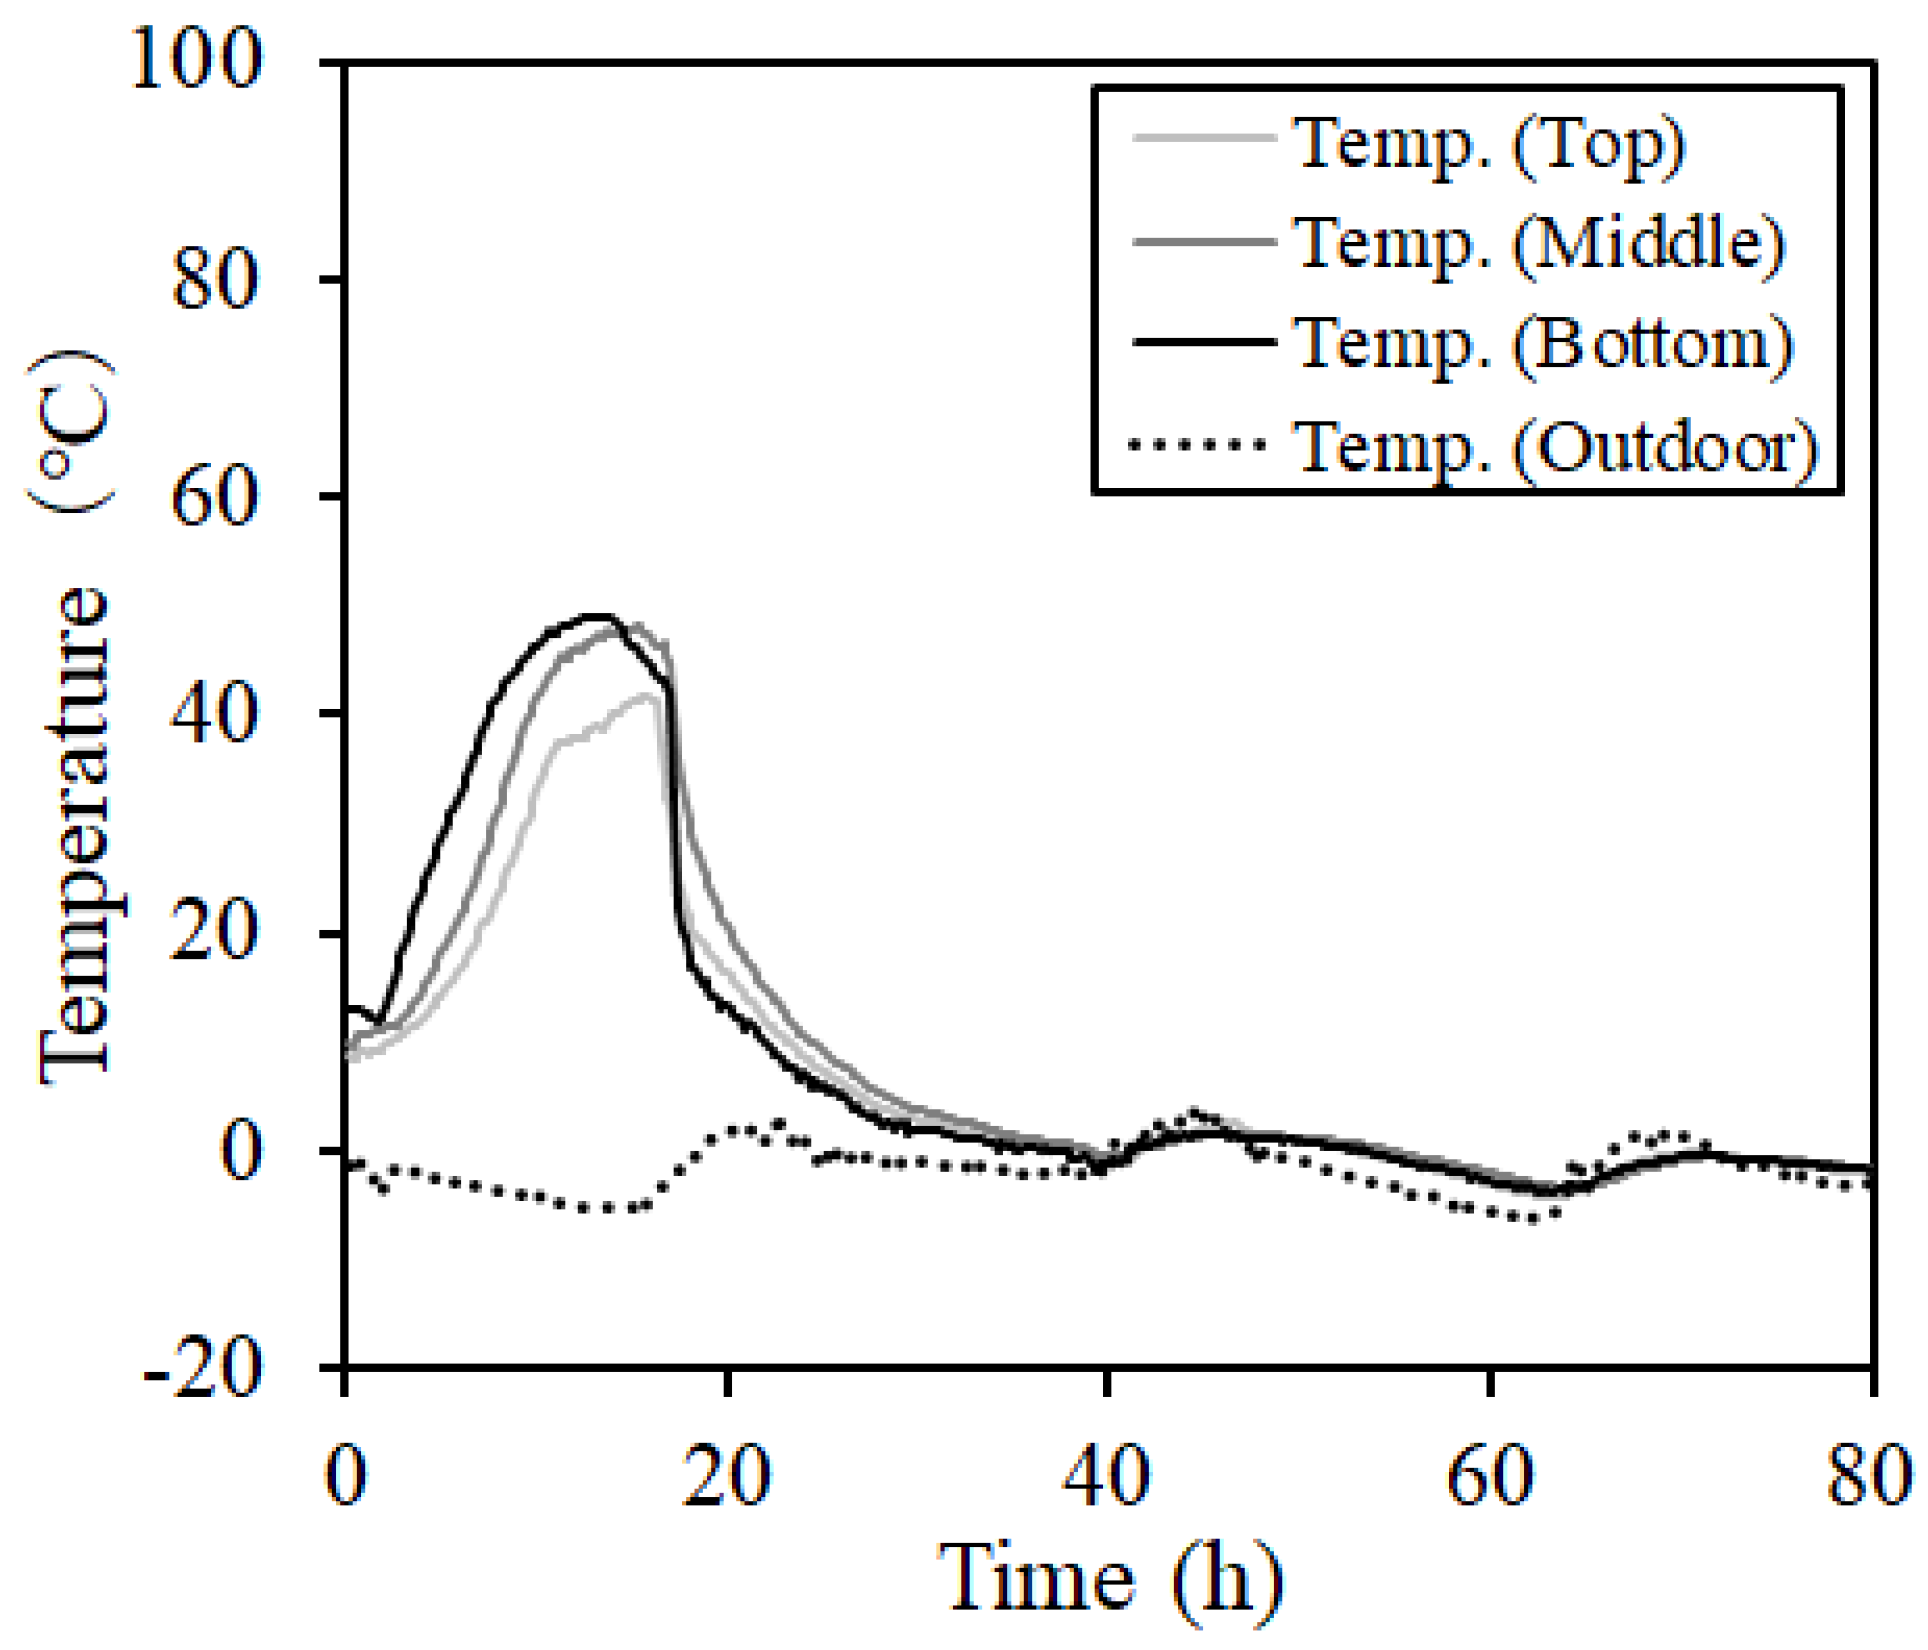
3.2.1. Temperature Distribution
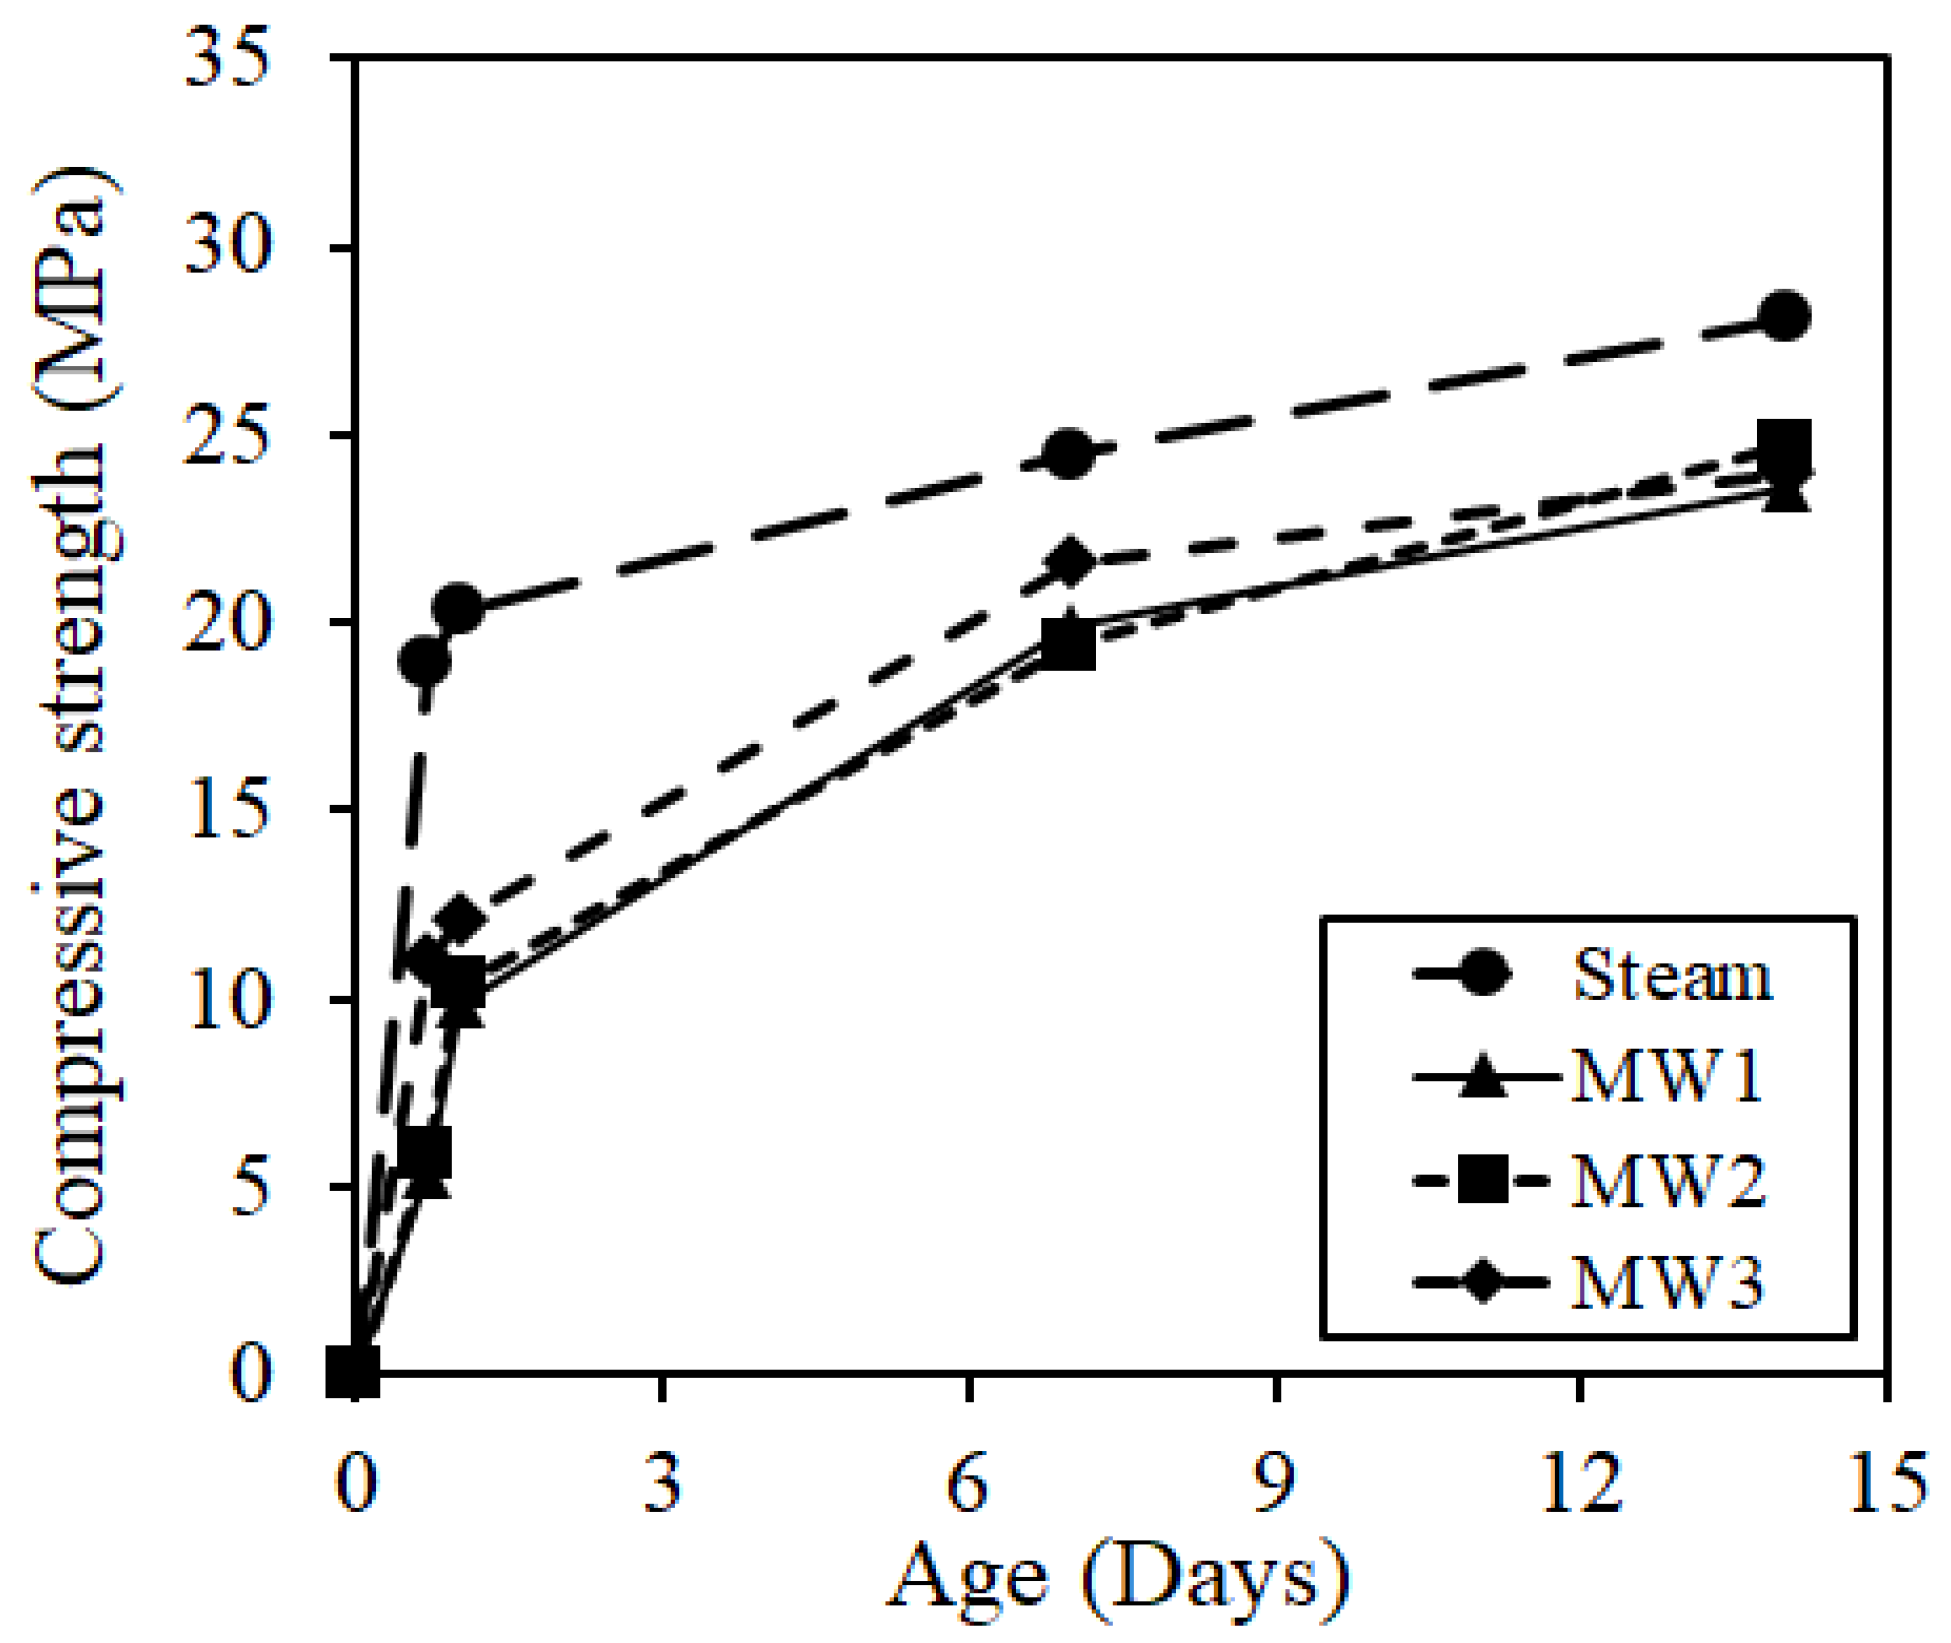
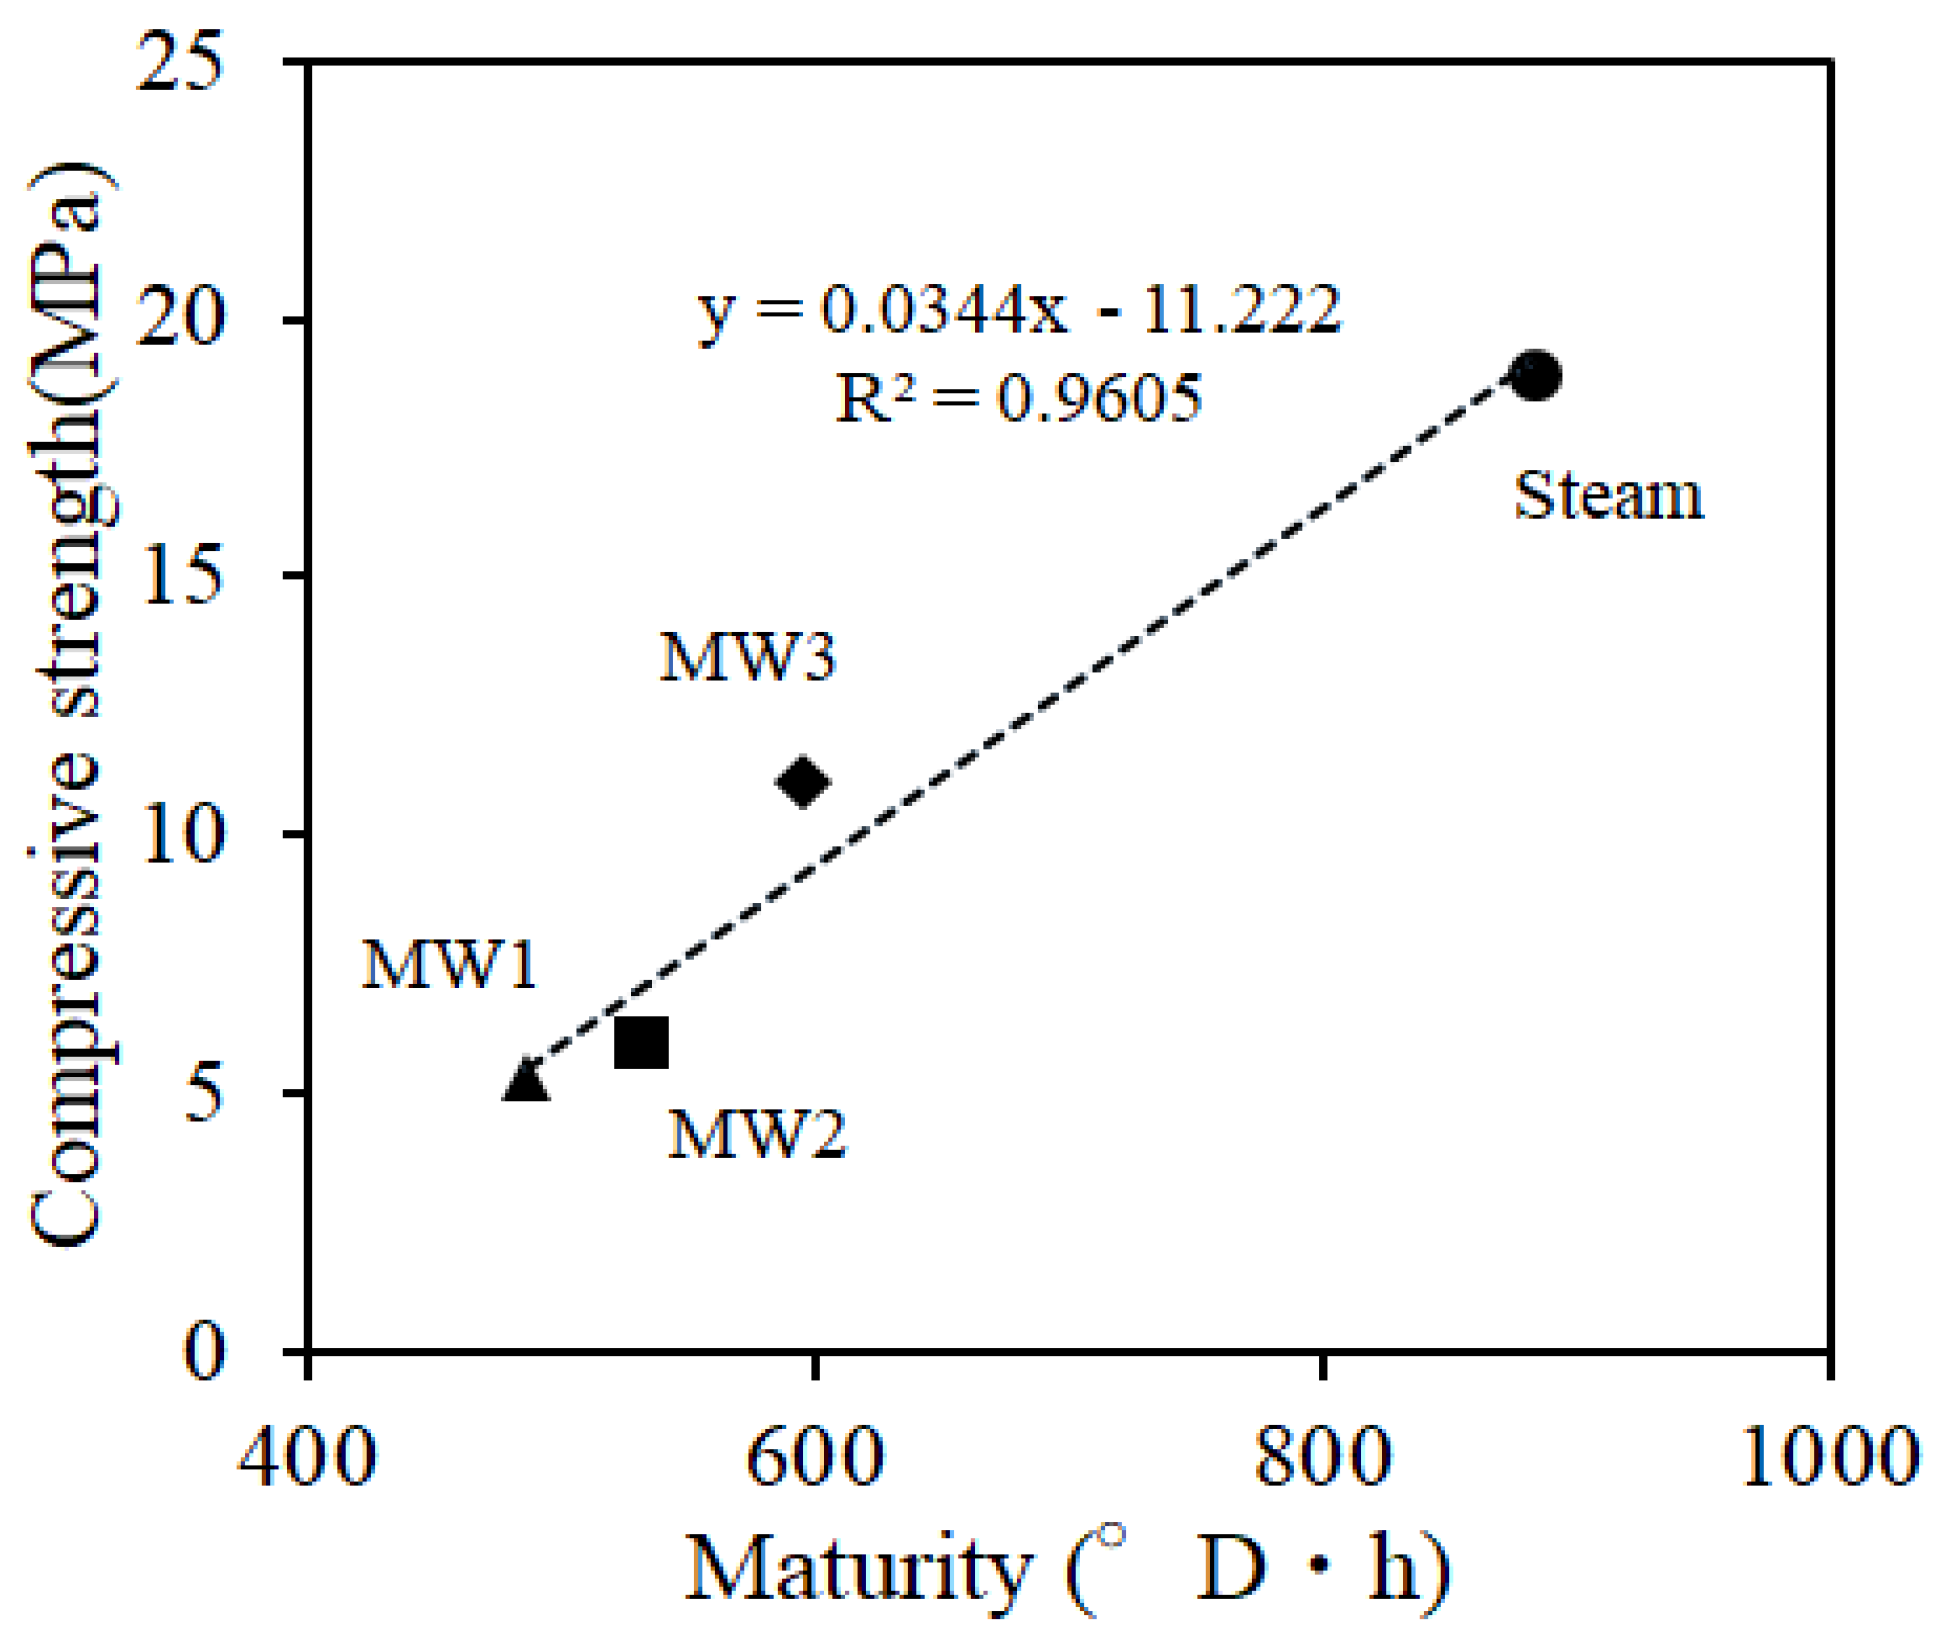
3.2.2. Strength Properties (Core Strength)
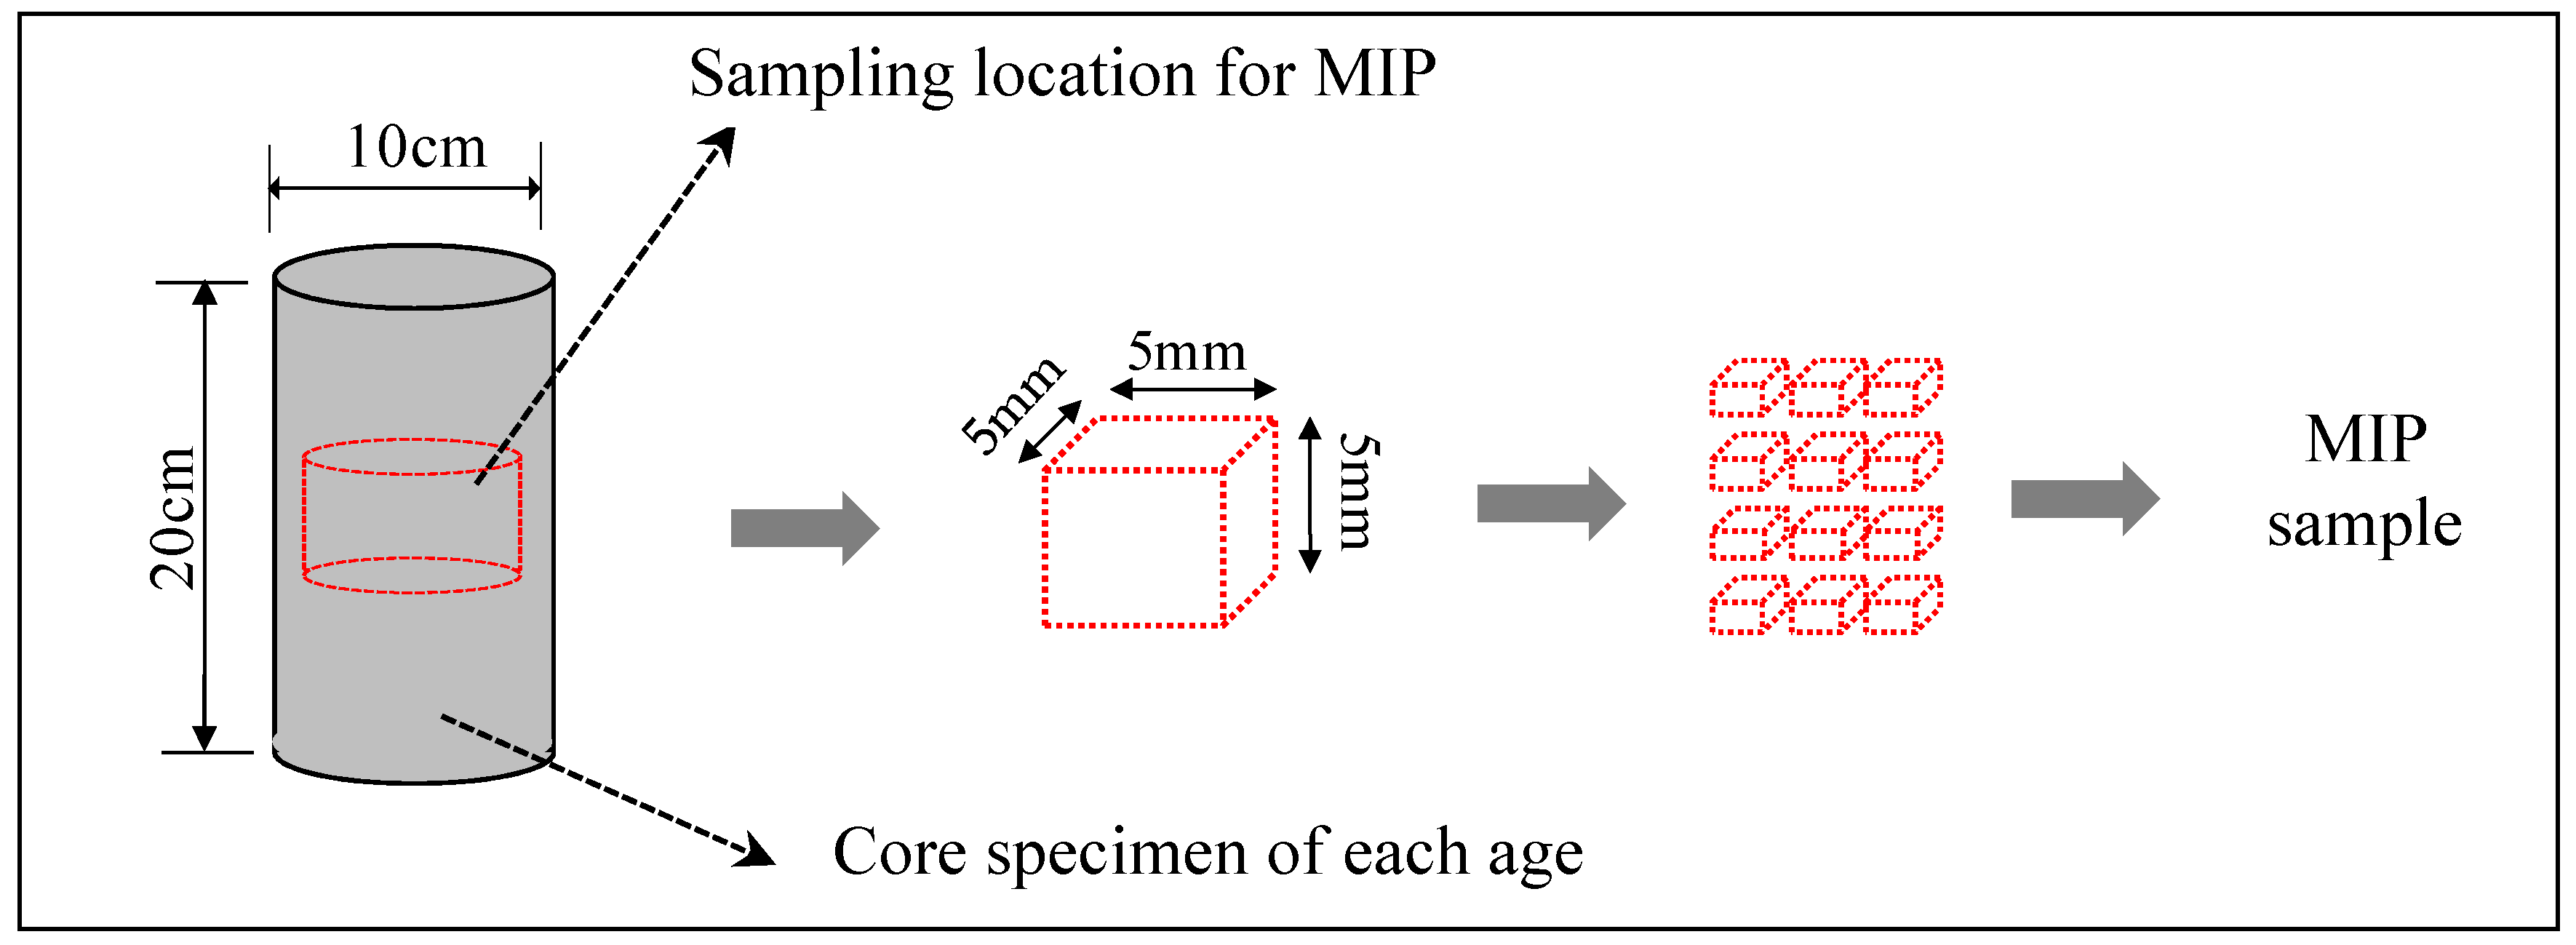
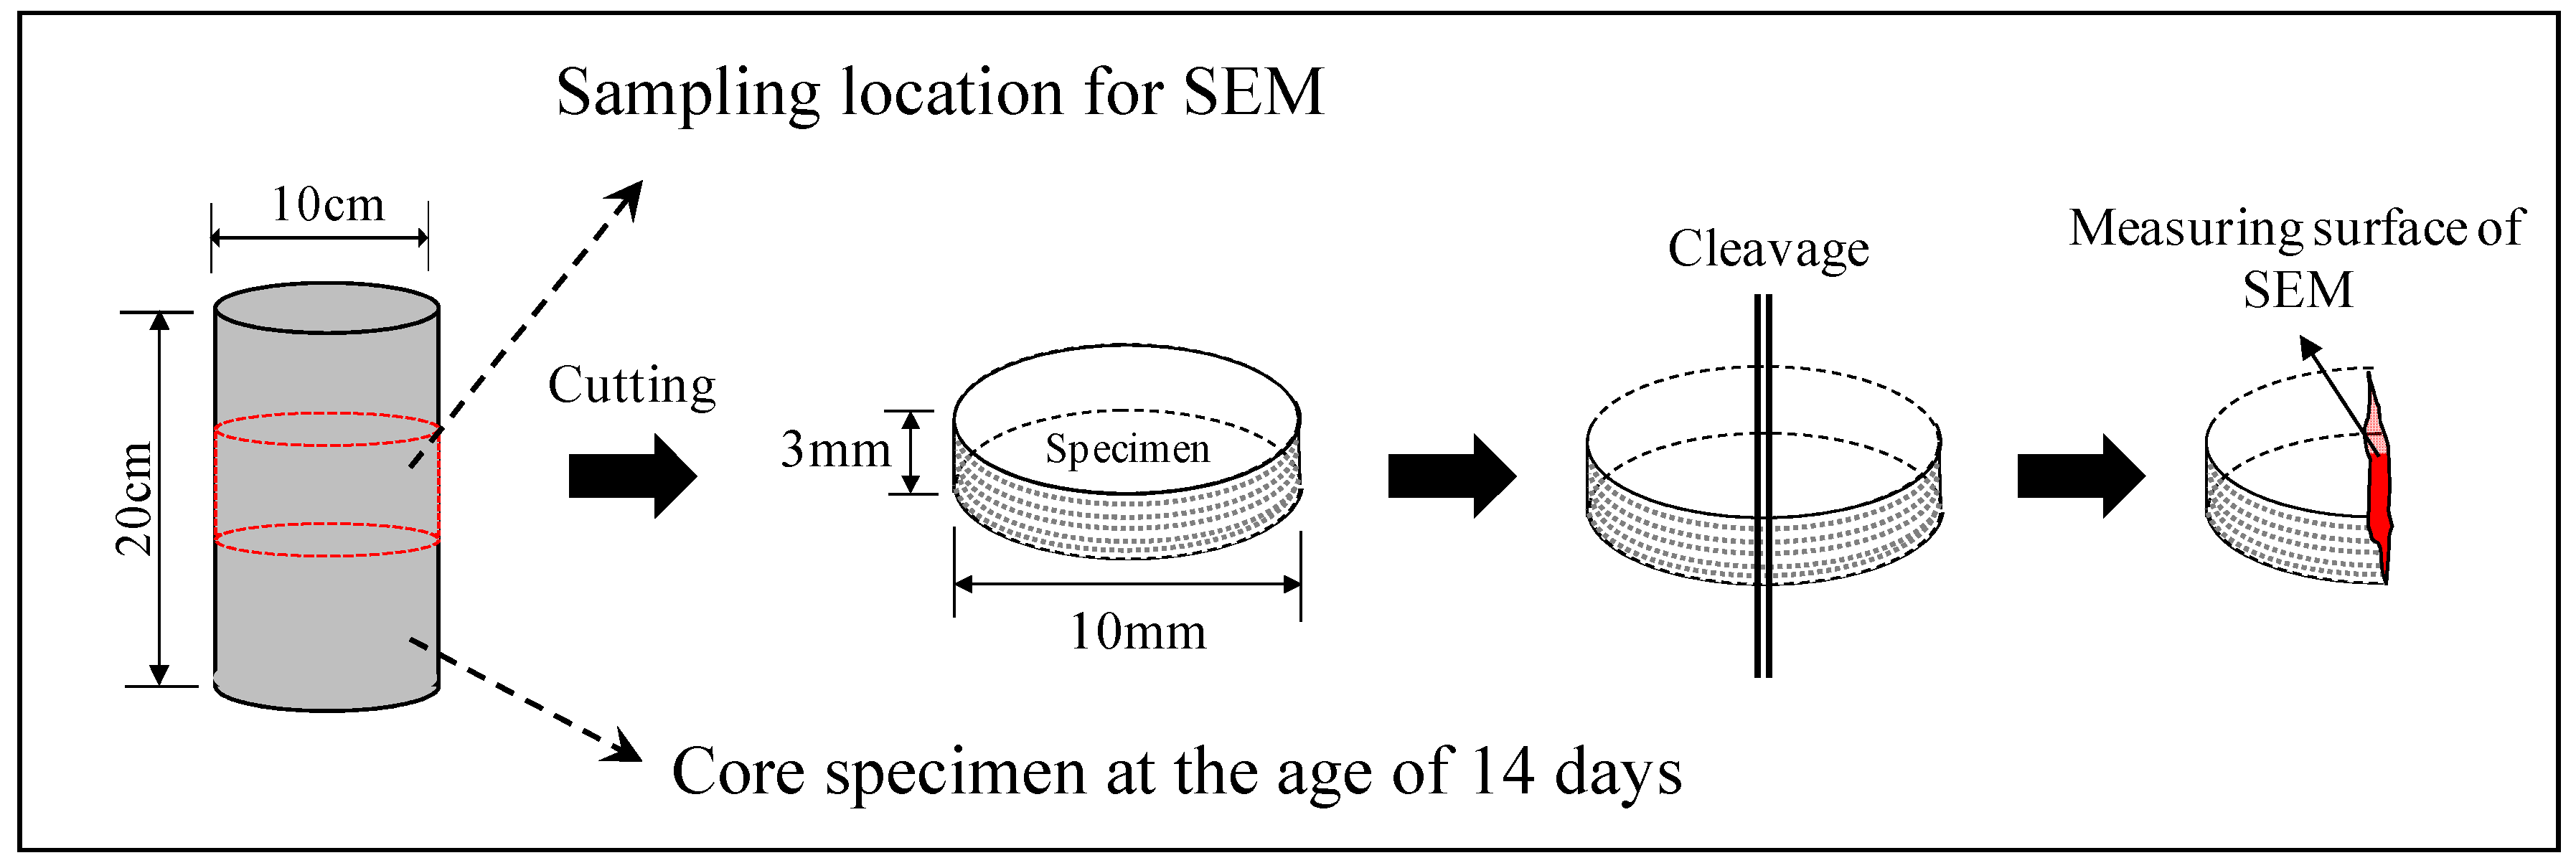
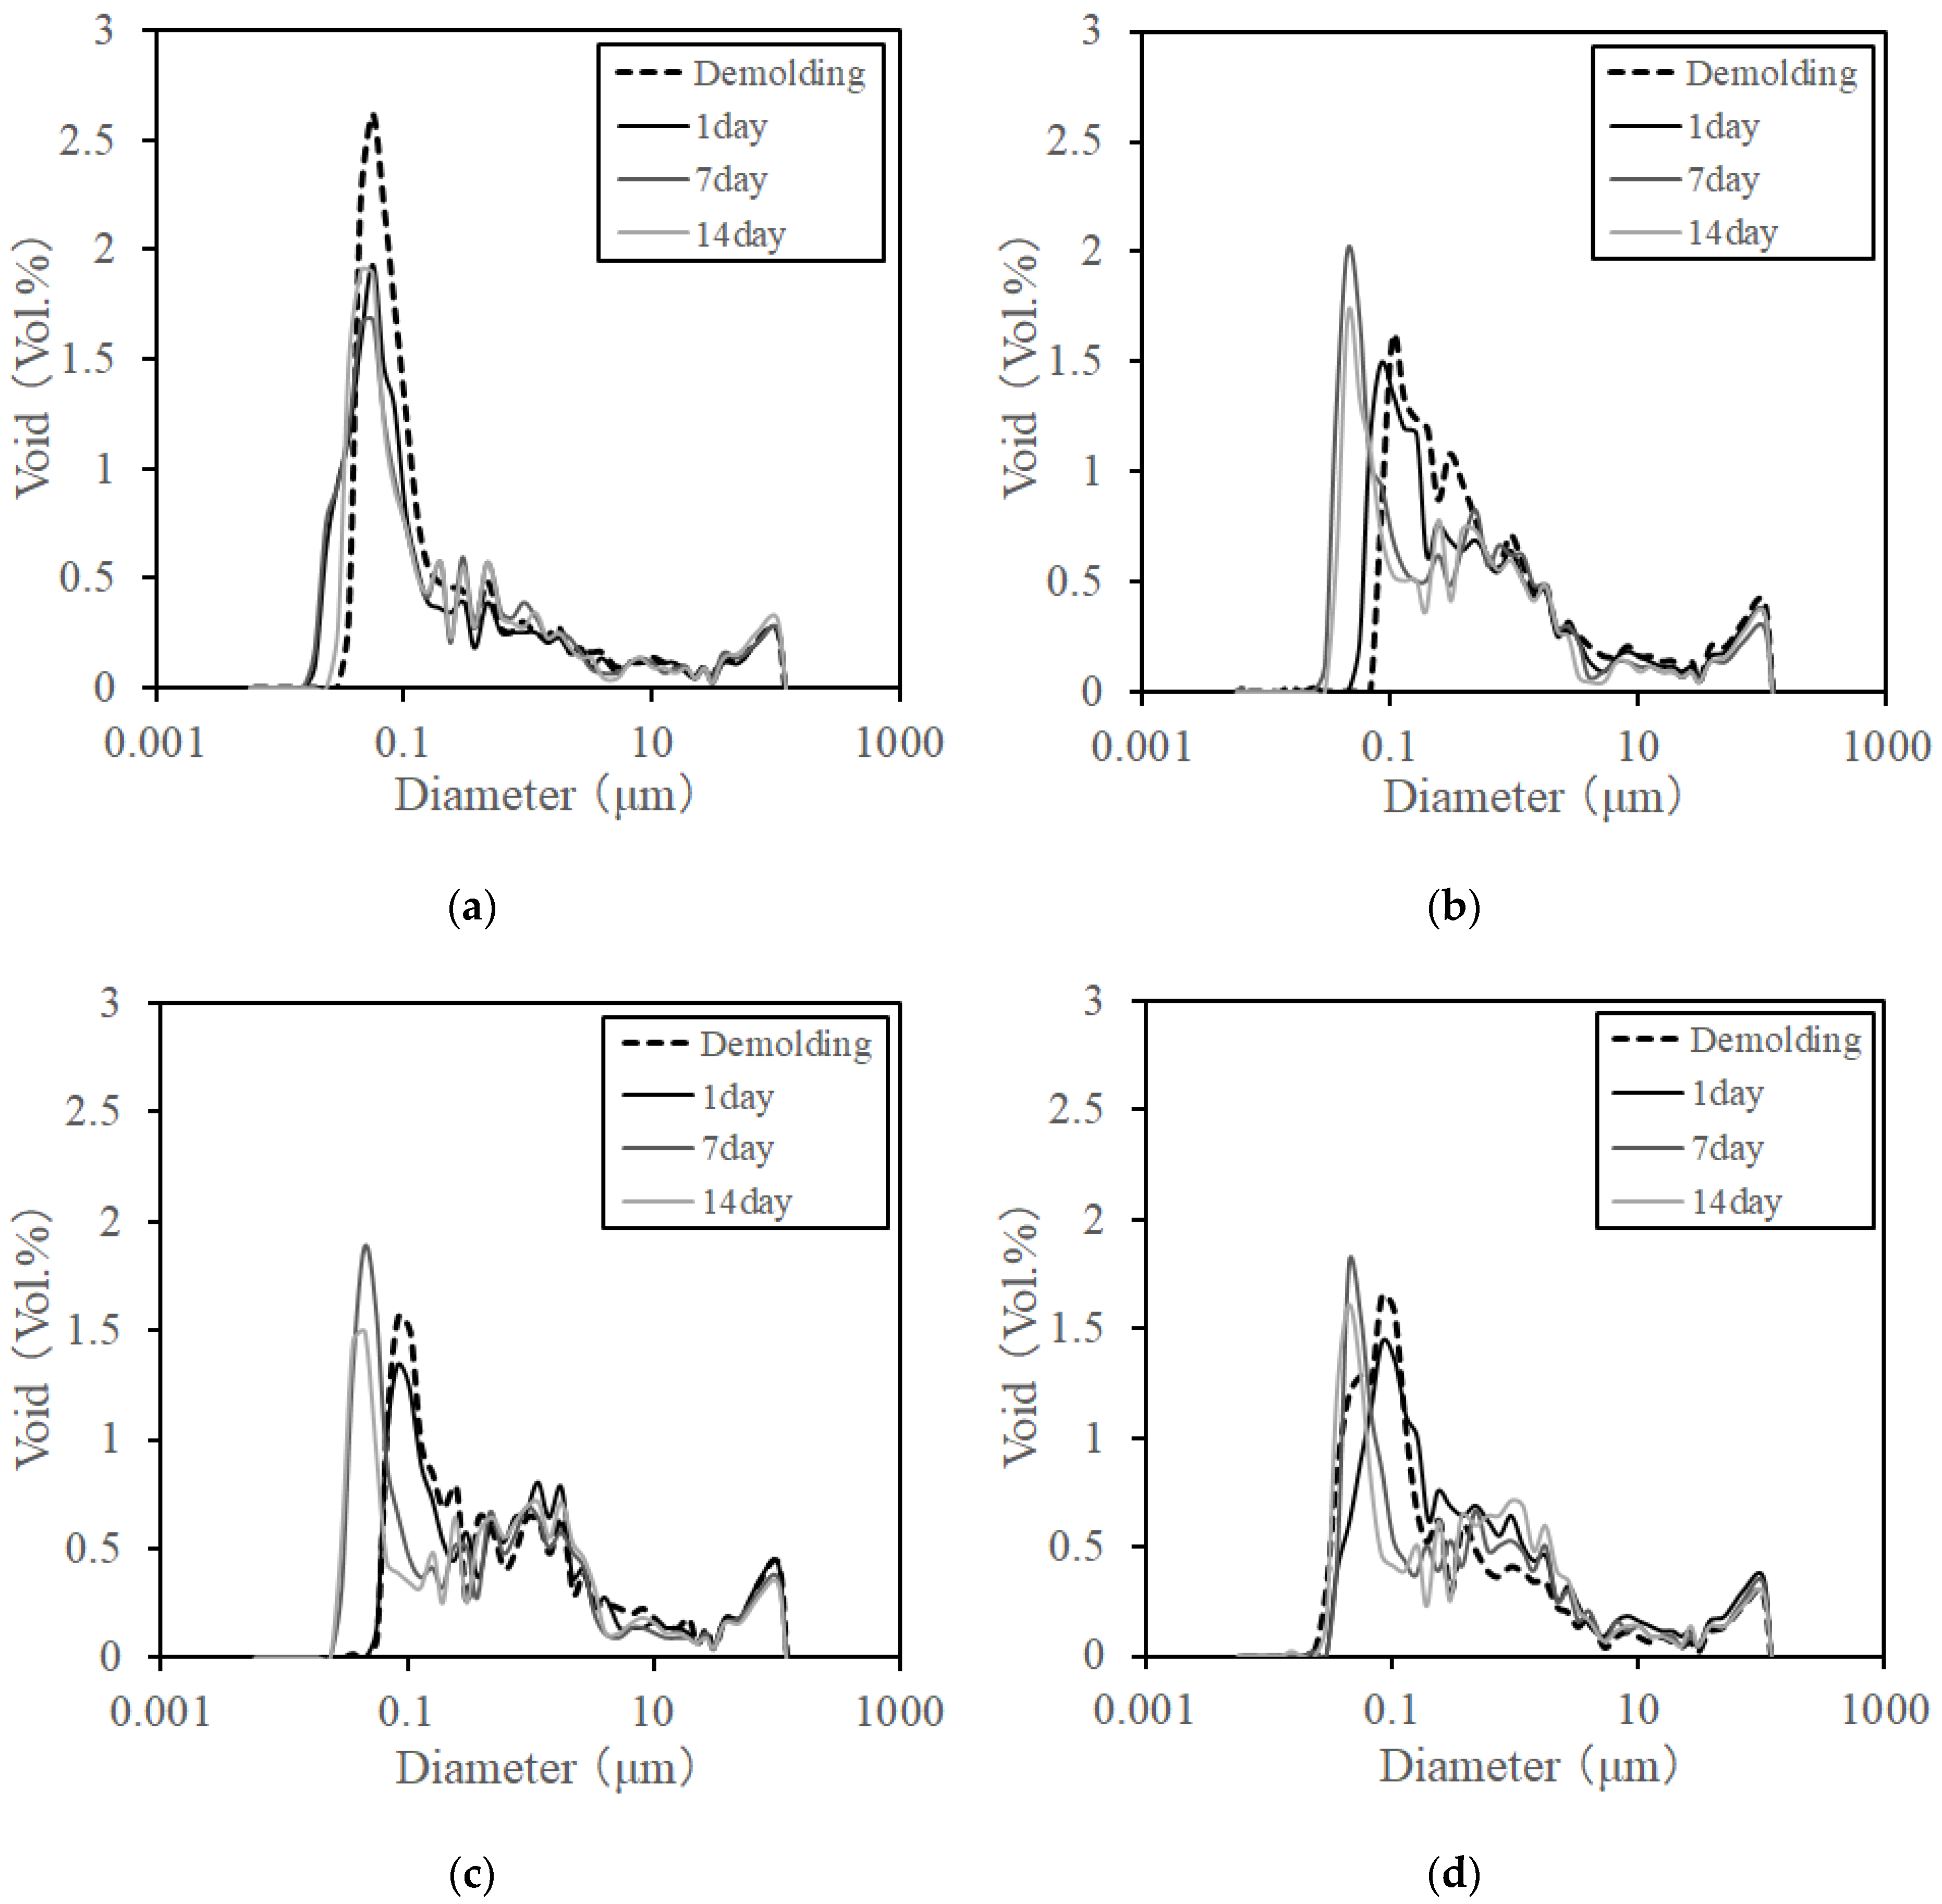
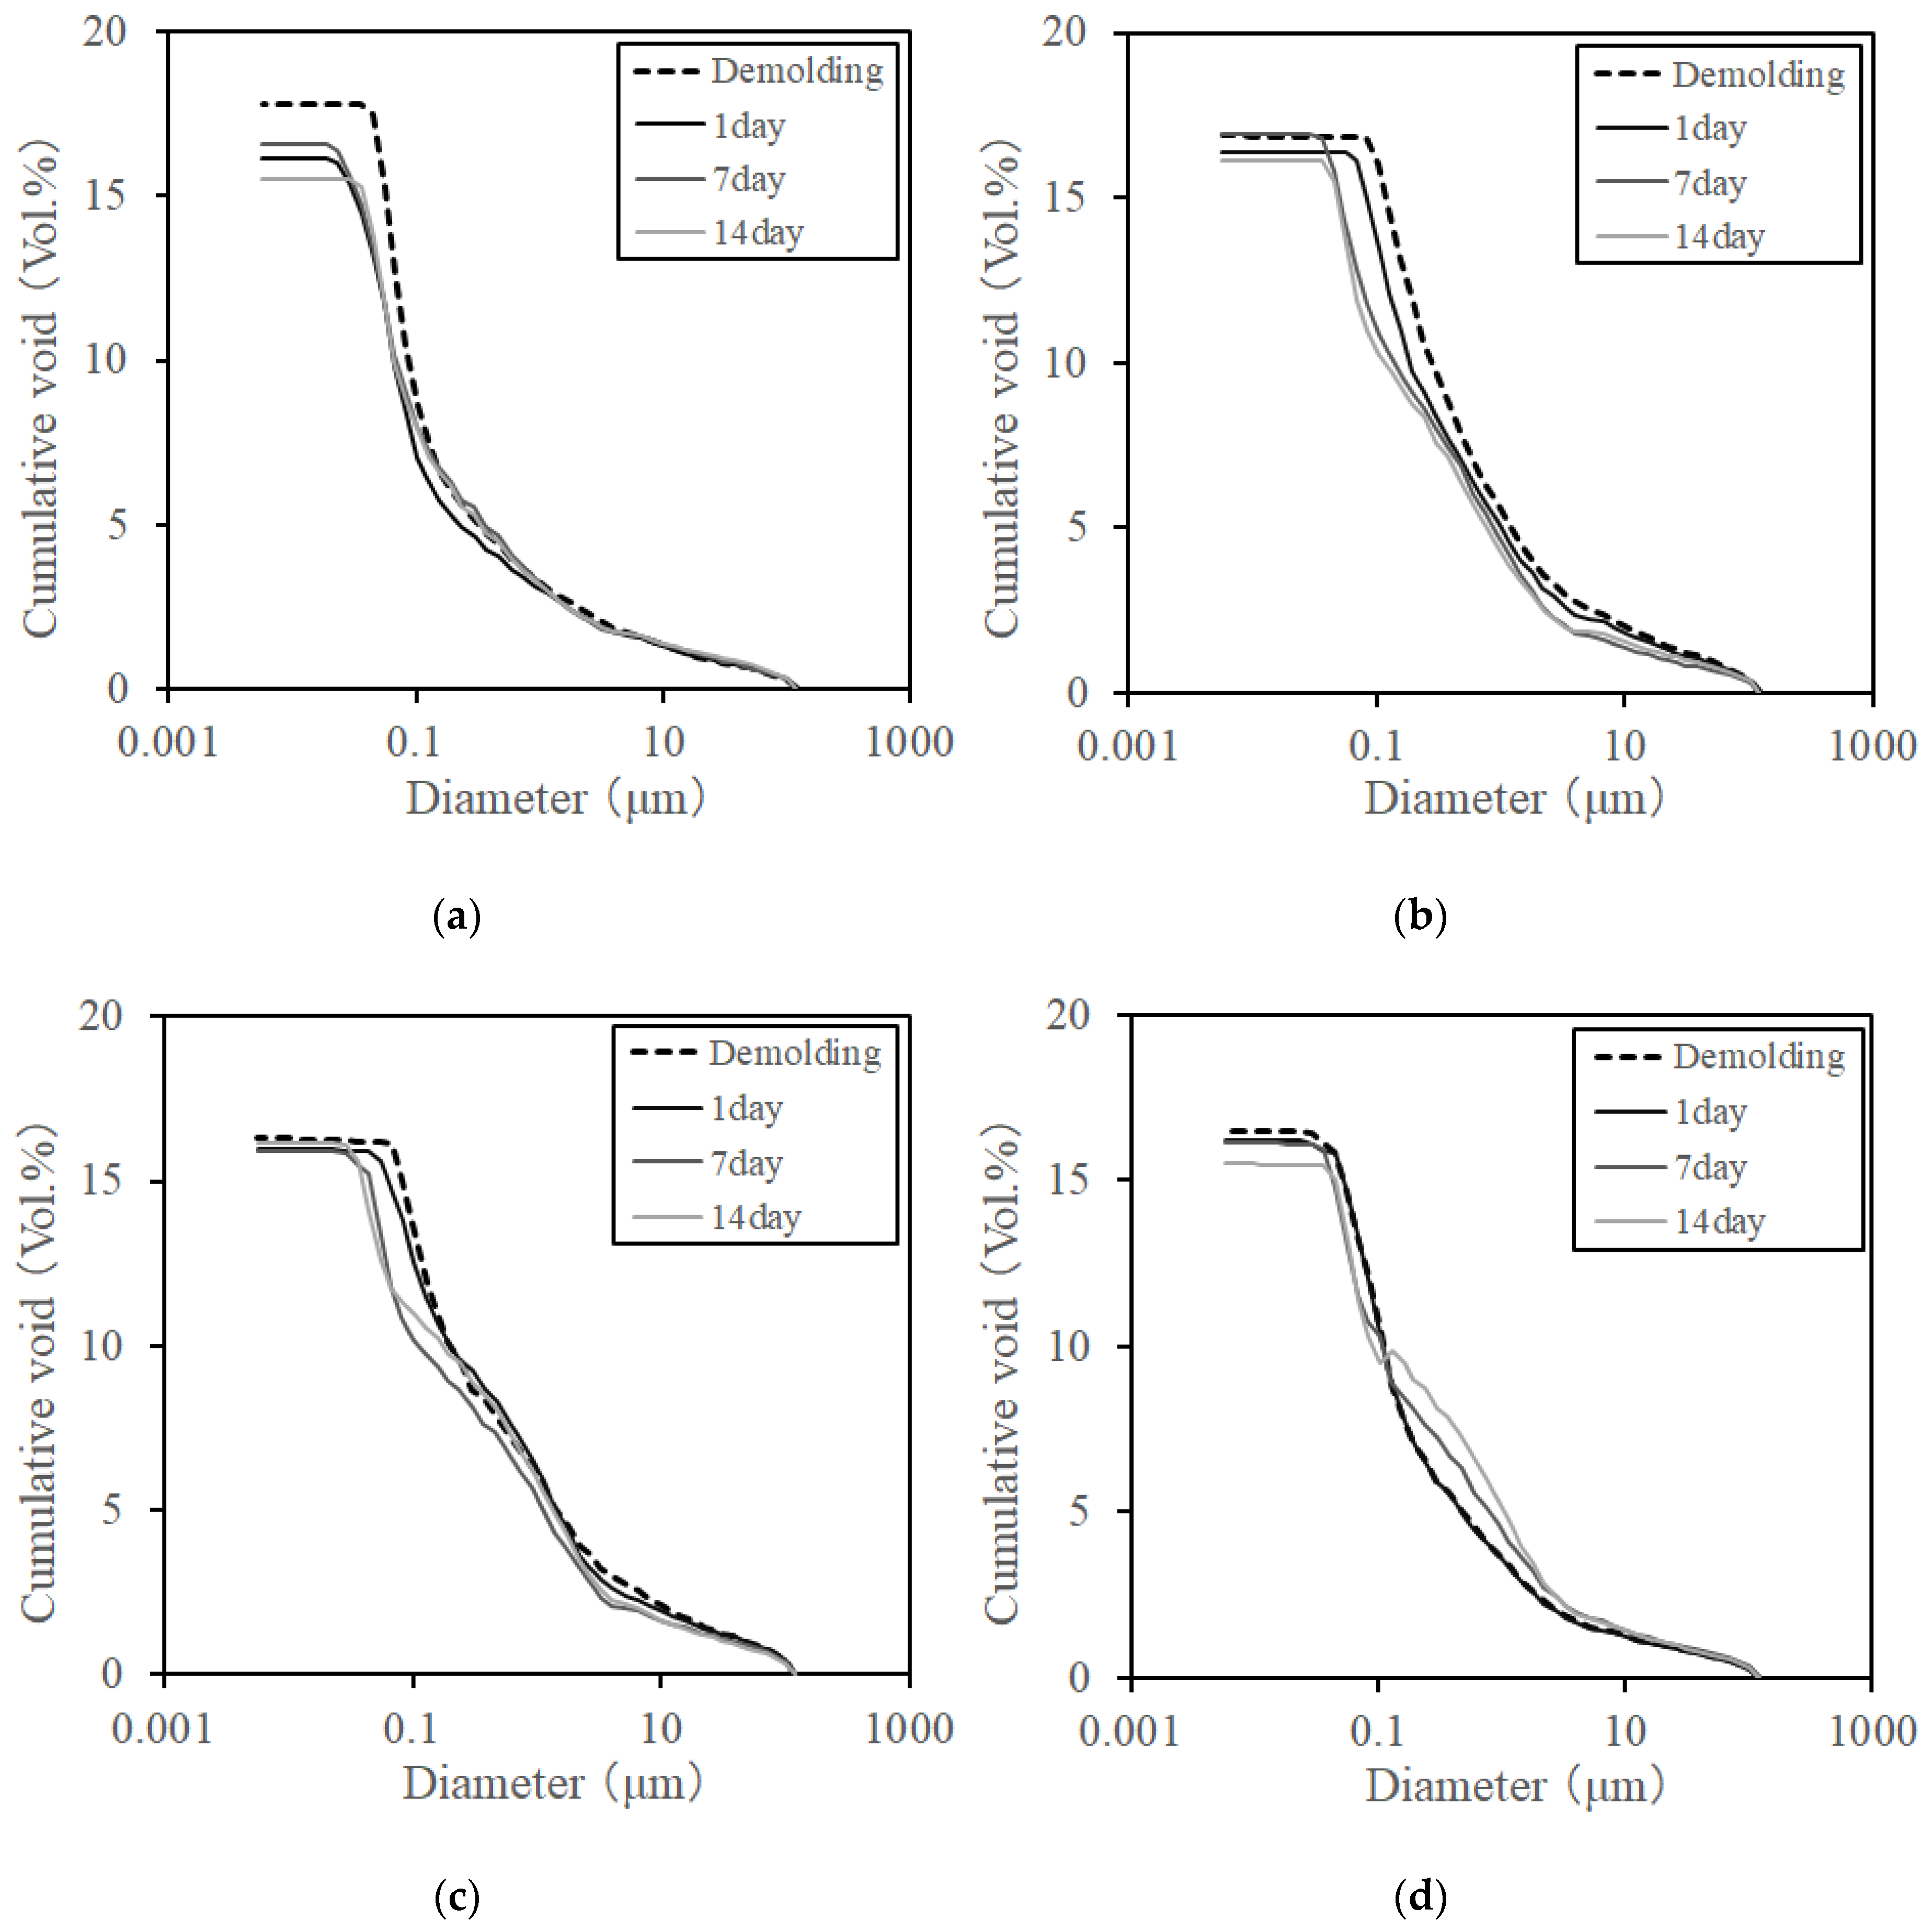
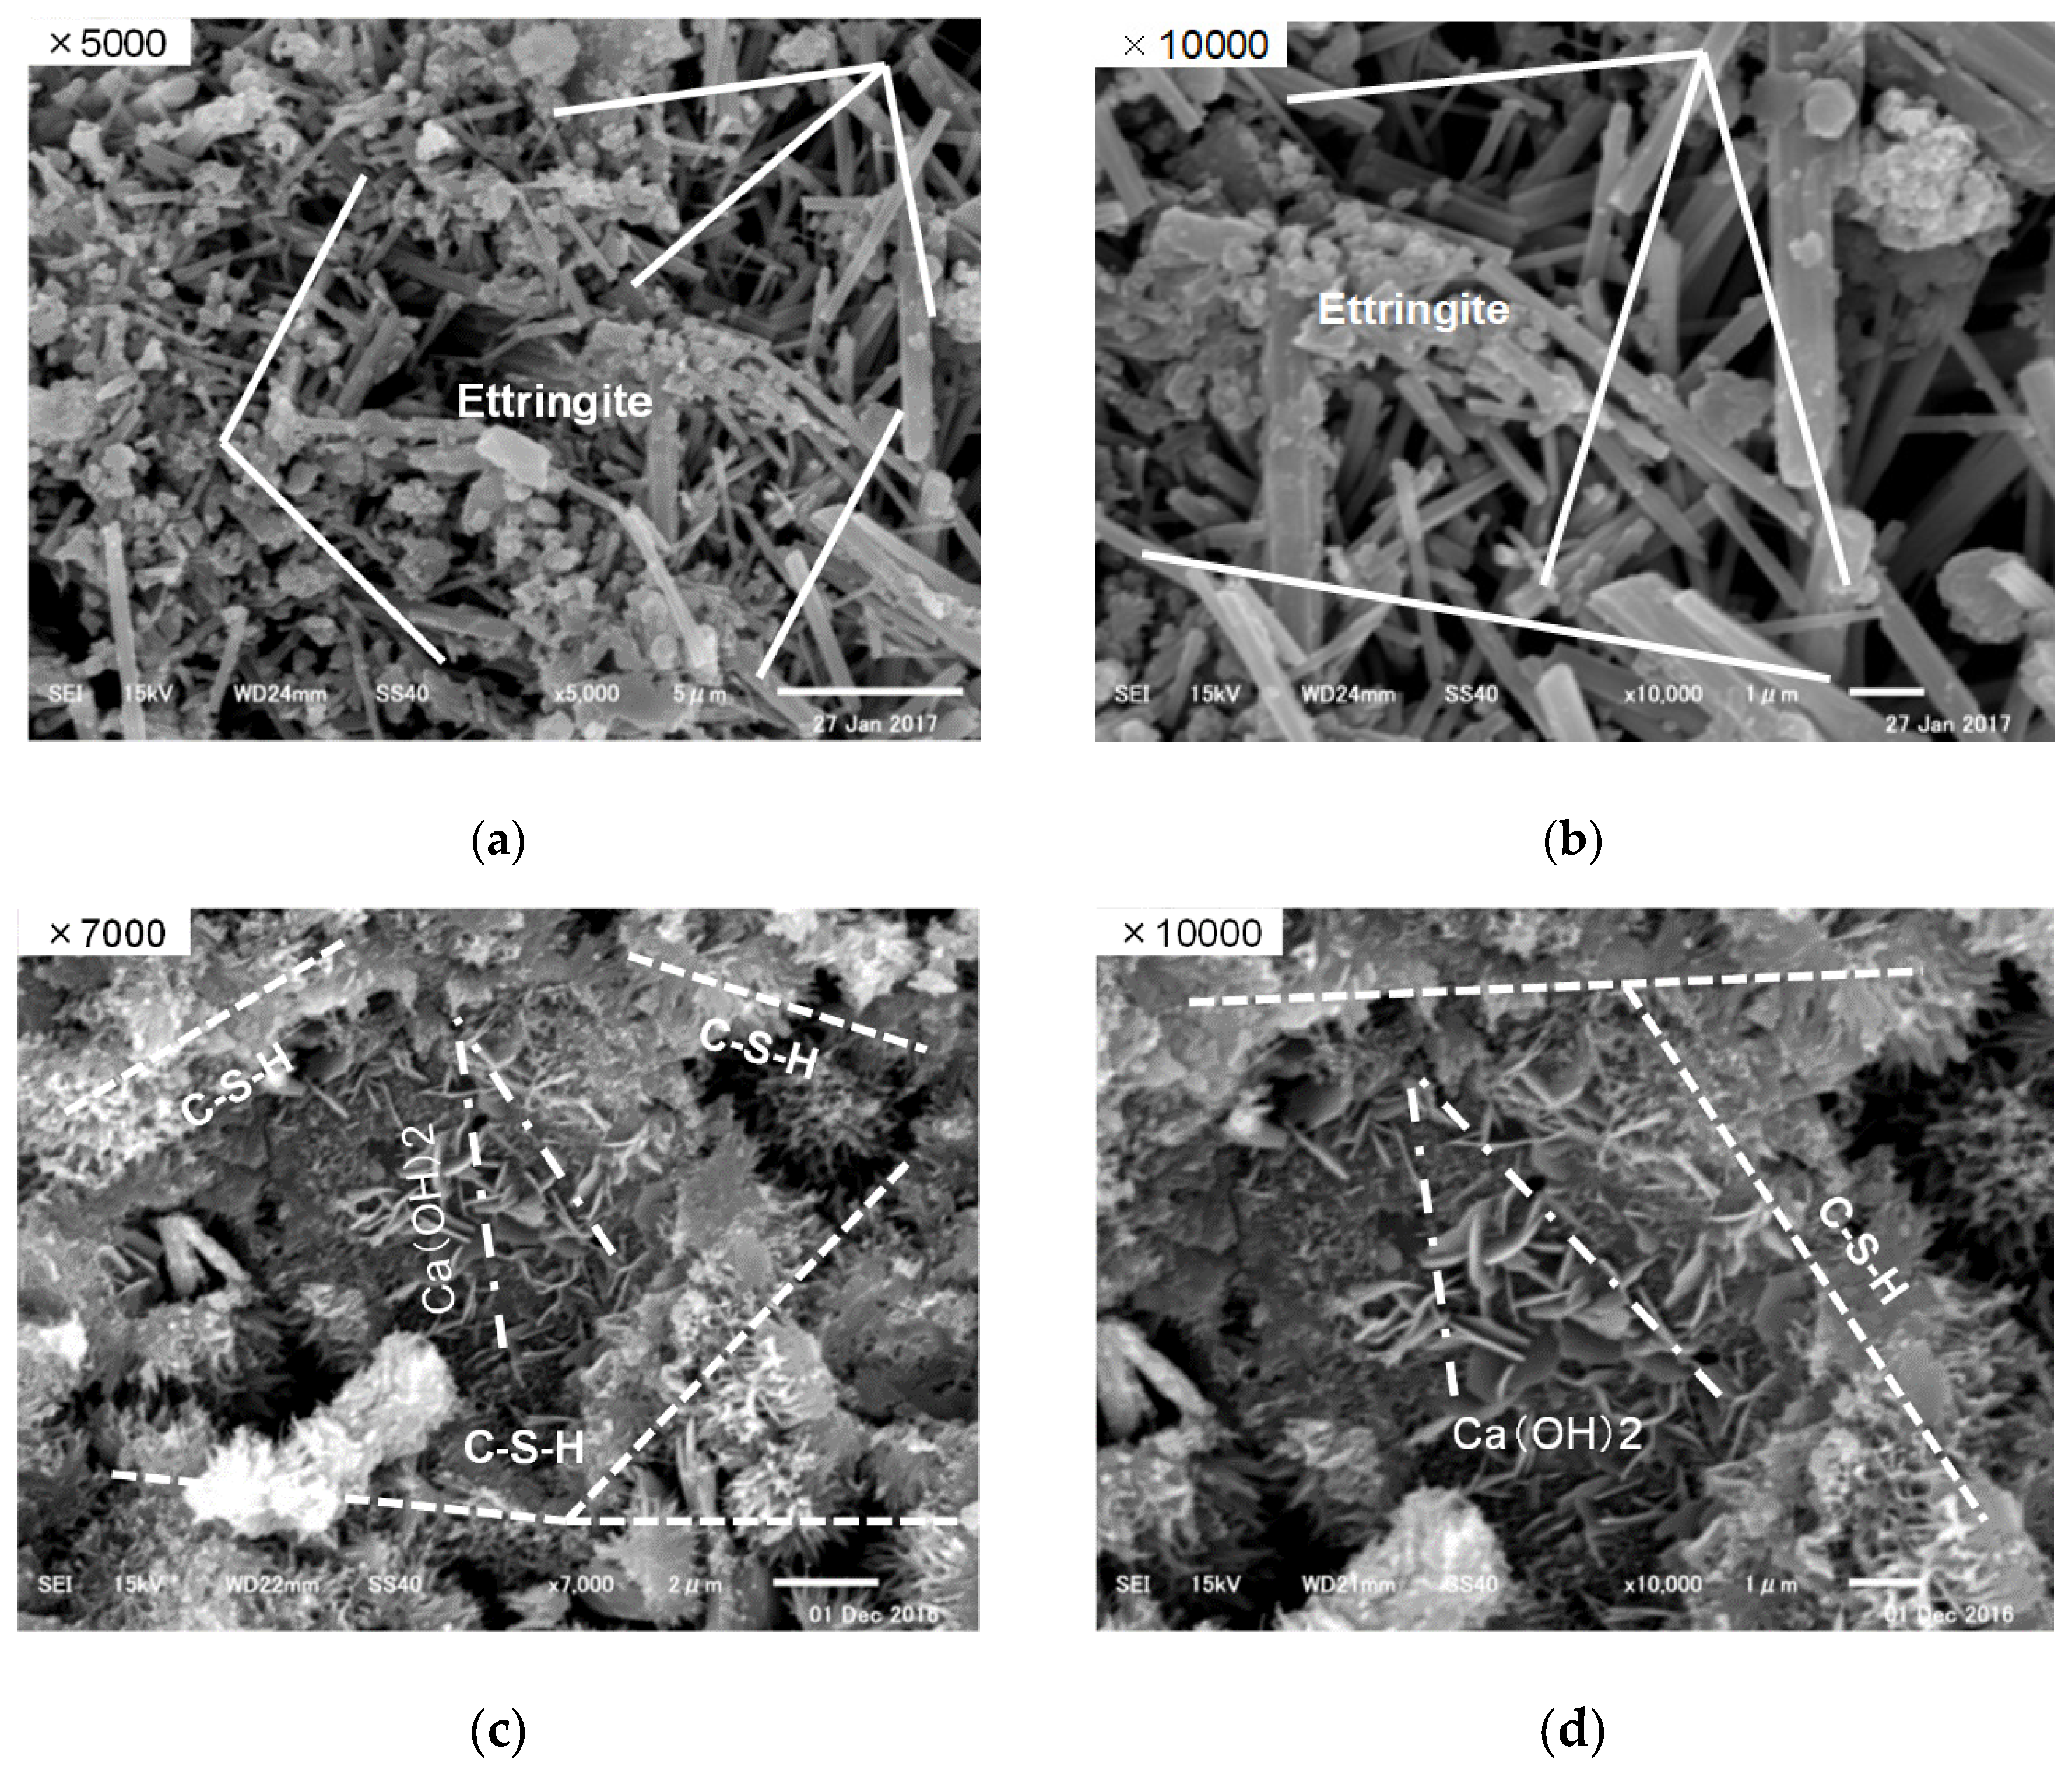
3.2.3. Porosity and SEM Observation
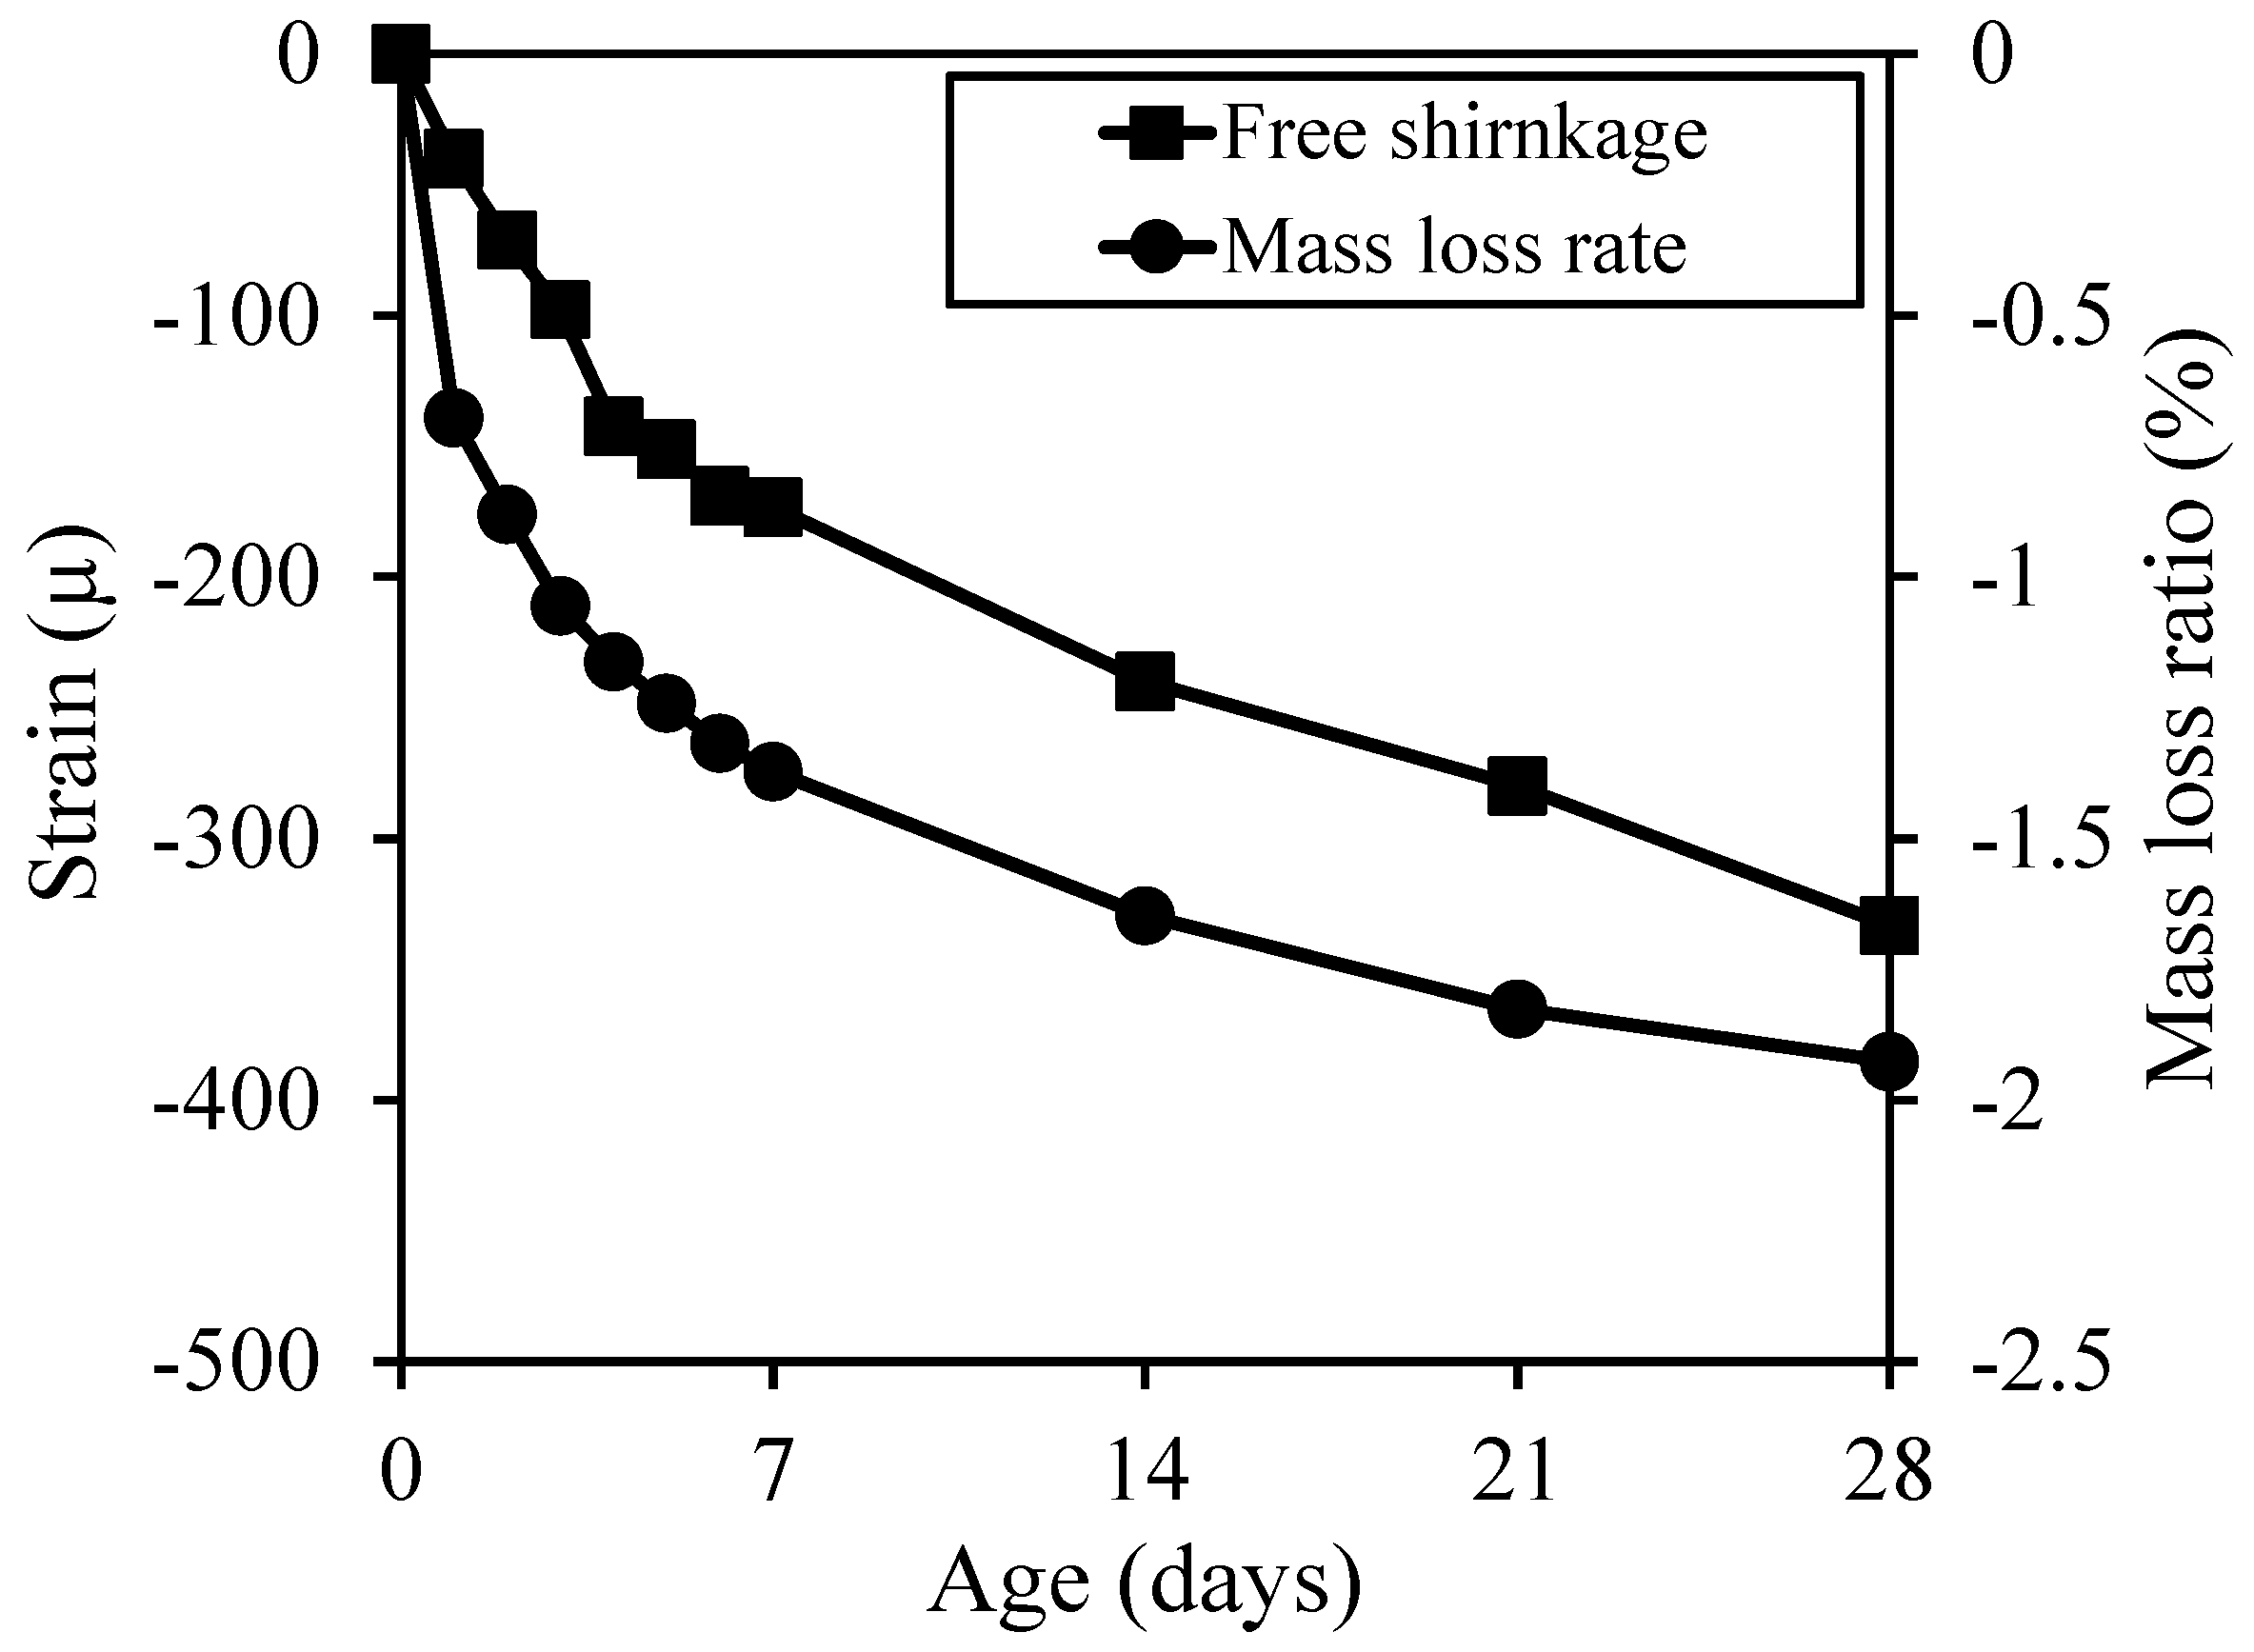
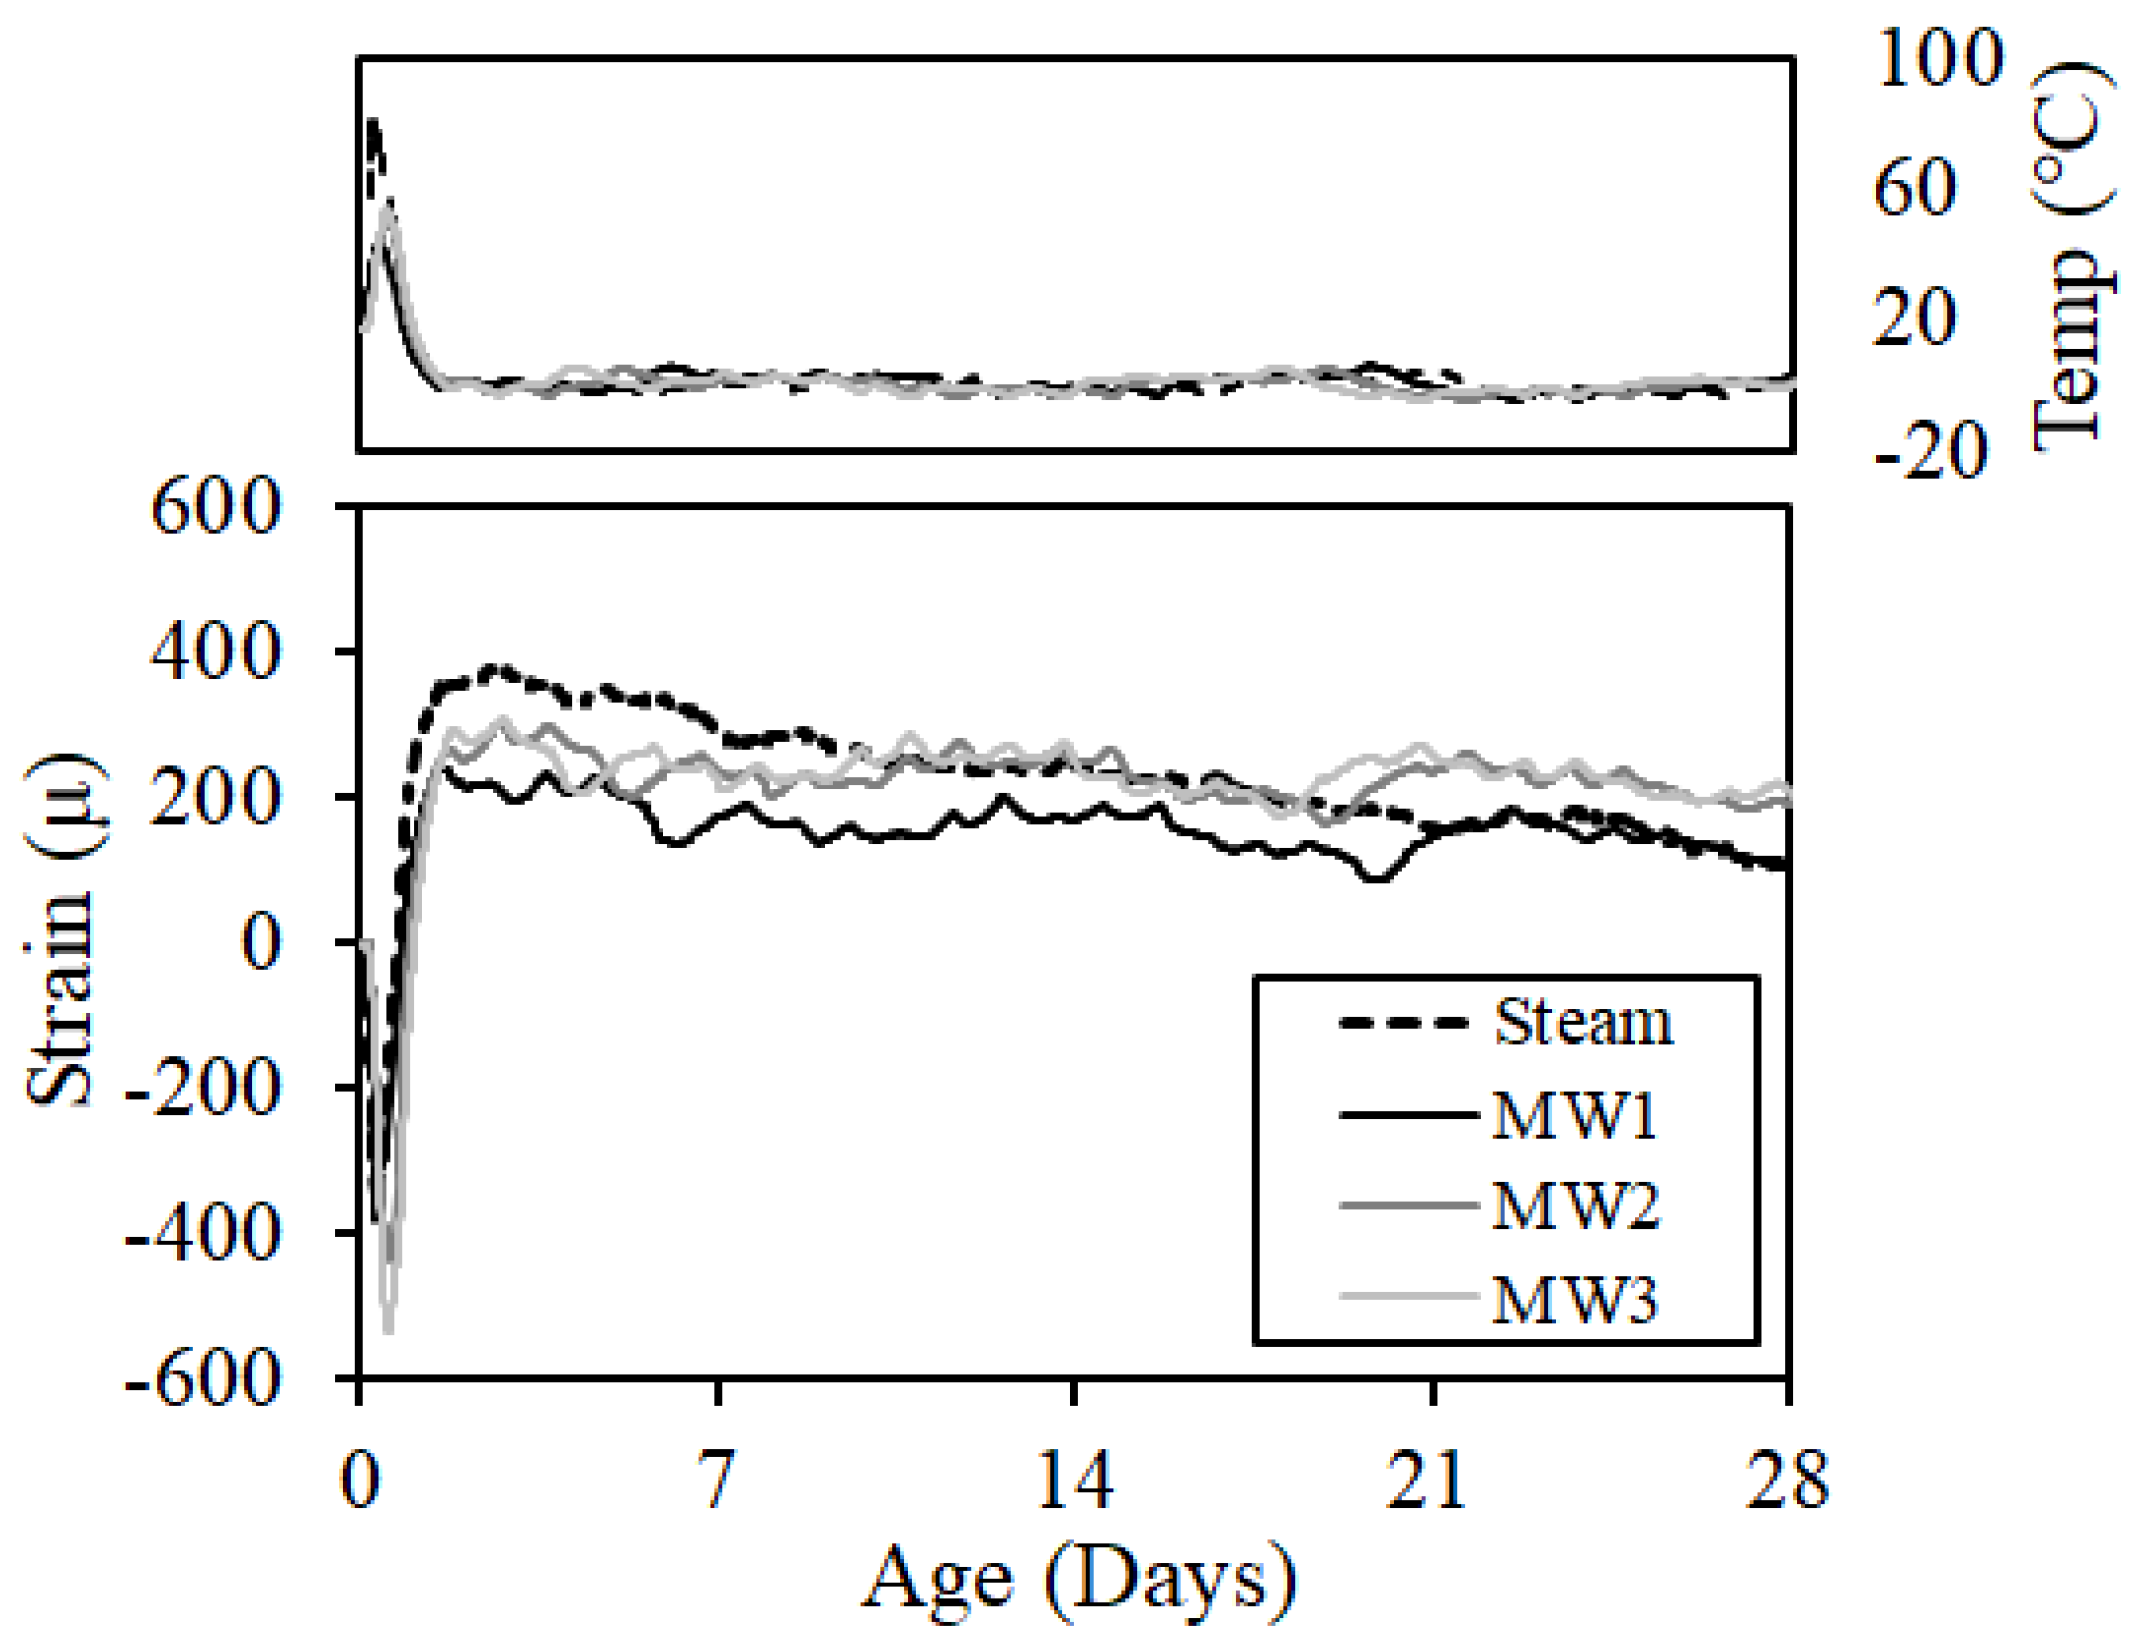
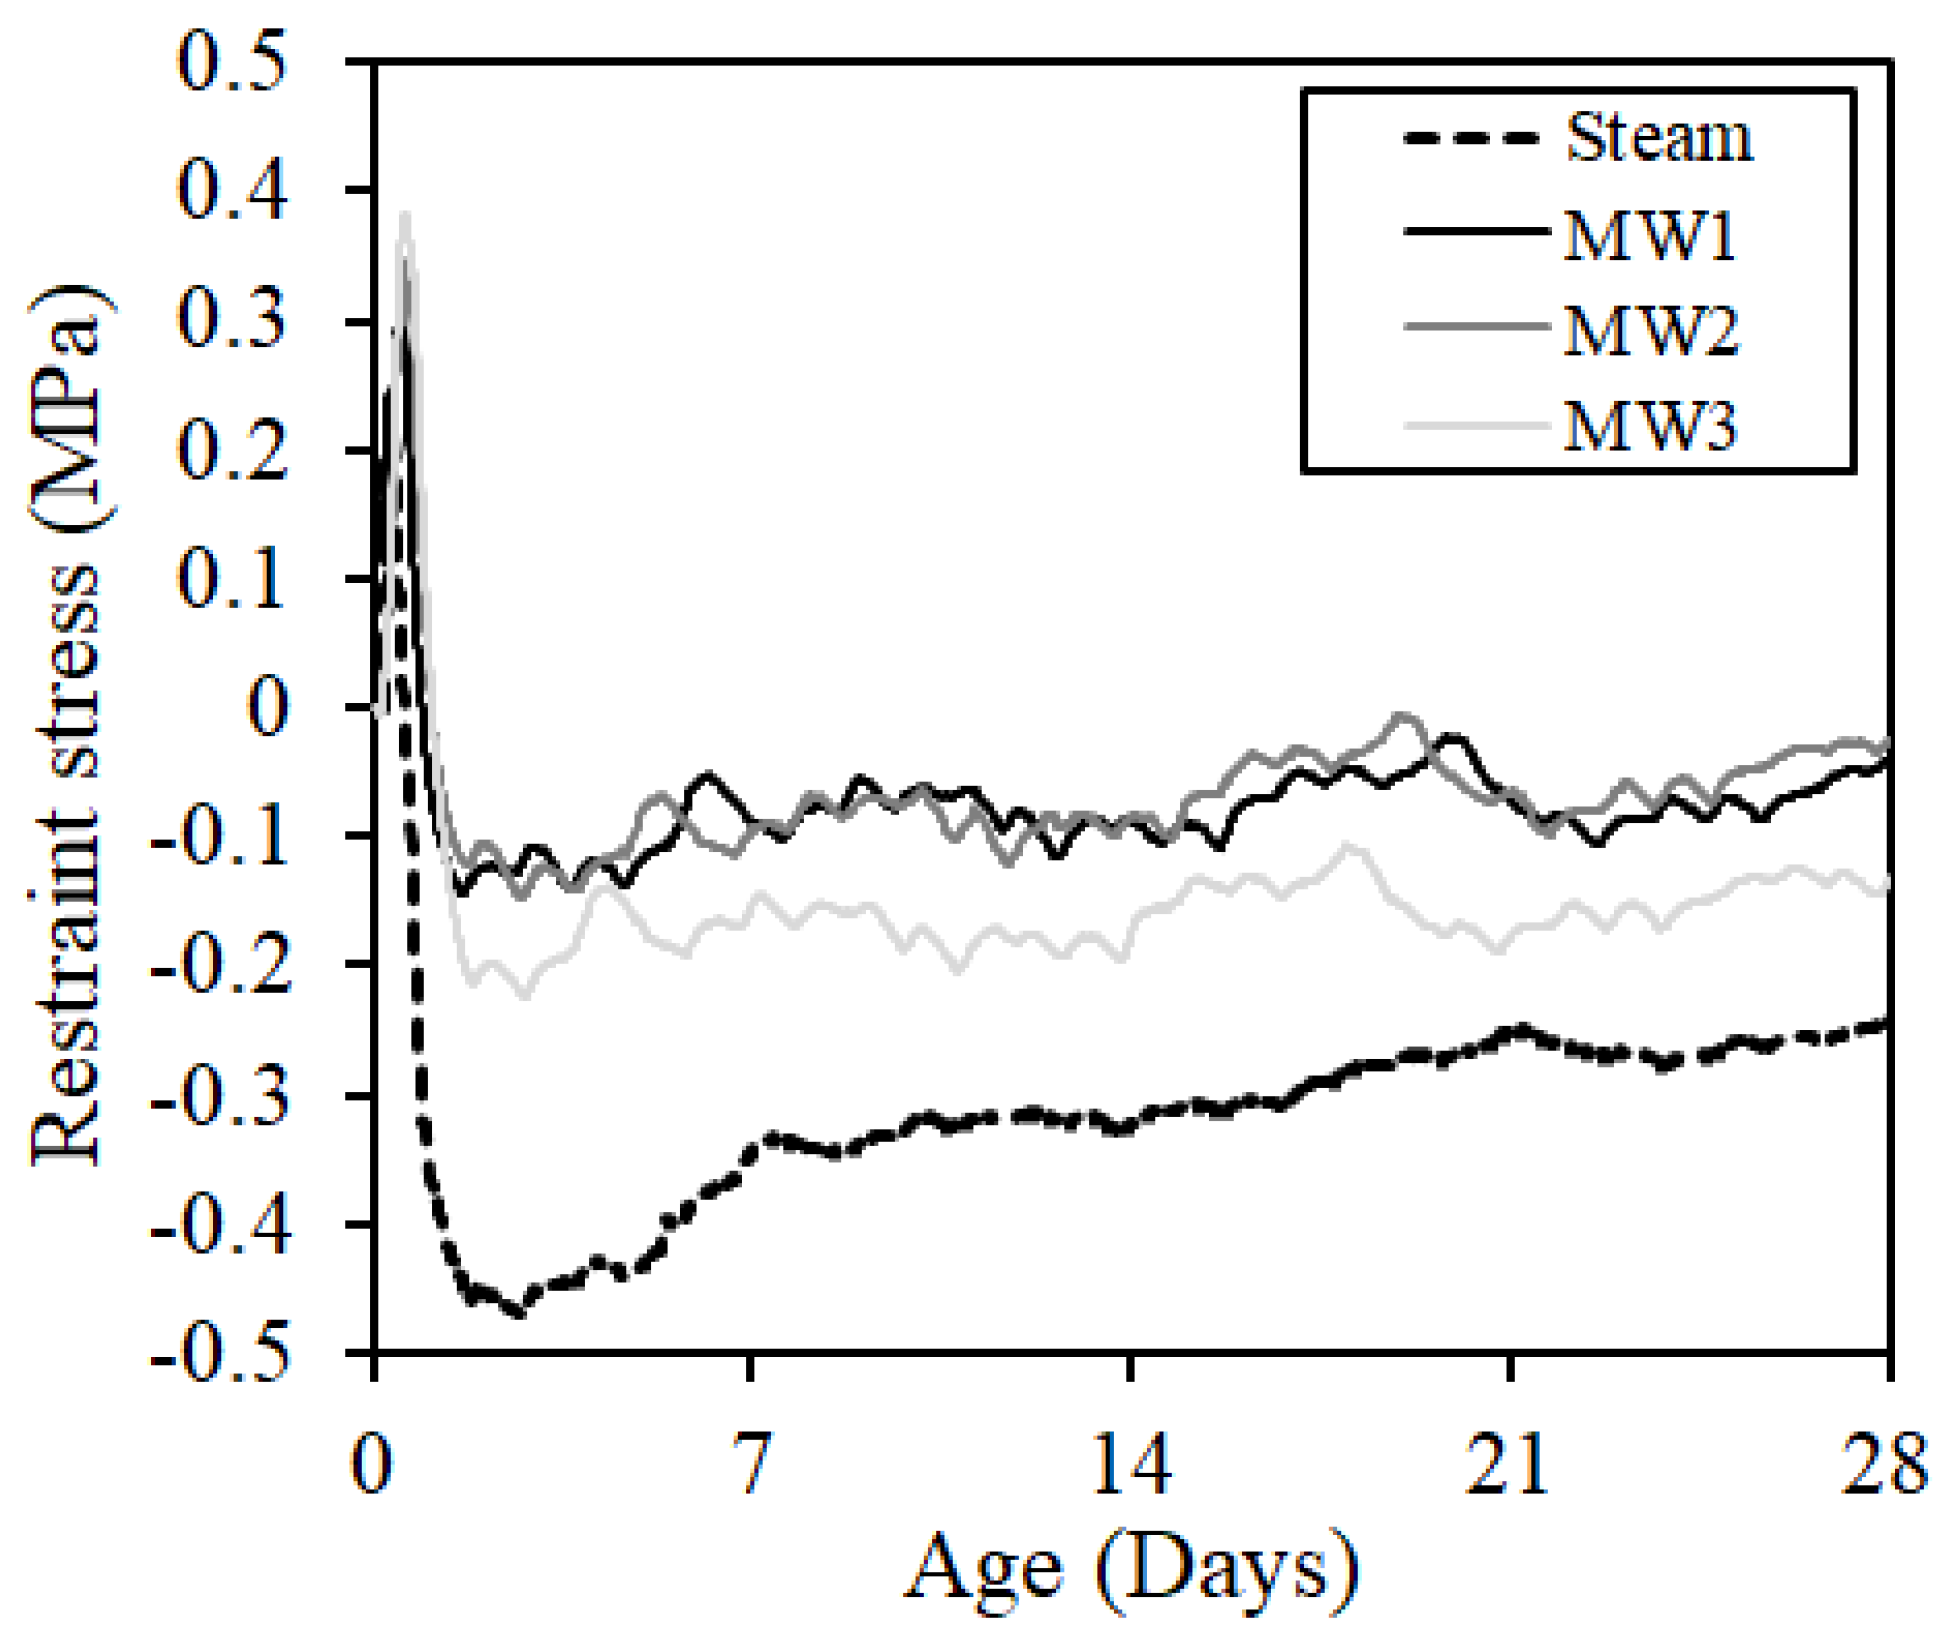
3.2.4. Shrinkage and Cracking Properties
3.2.5. Surface Condition Assessment
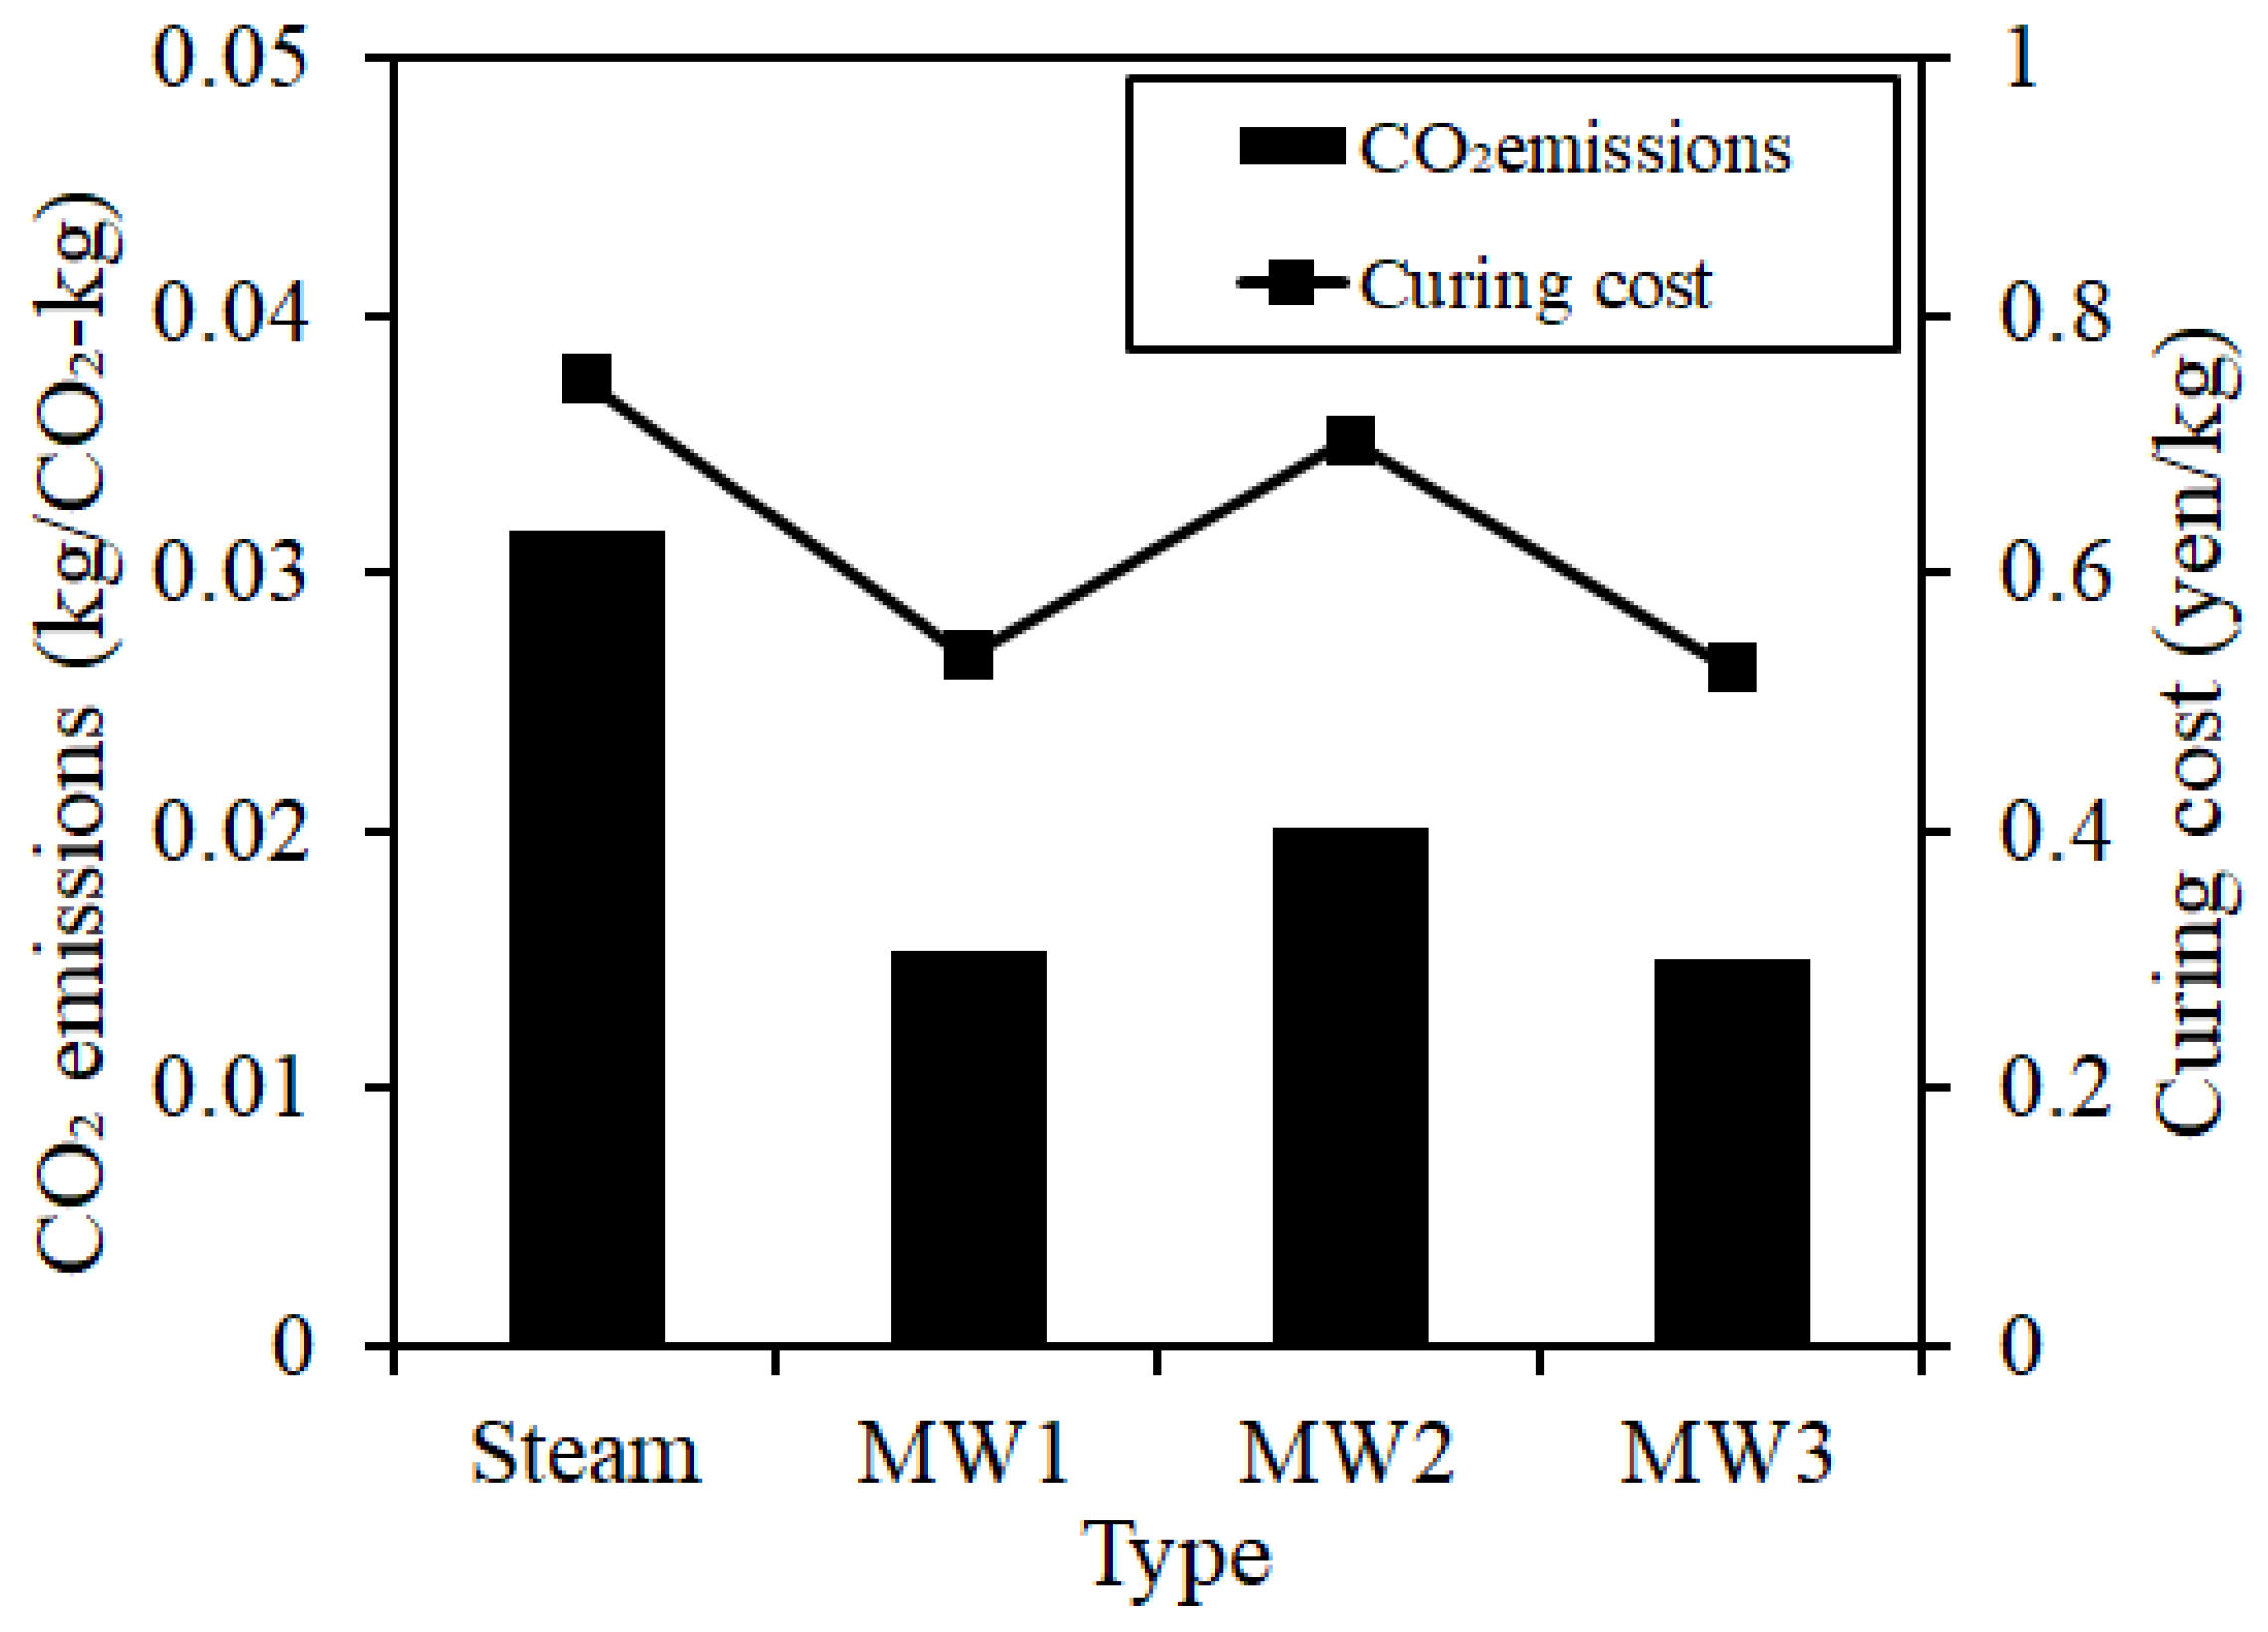
3.2.6. Environmental and Economic Evaluation
4. Conclusions
- MW heat curing can efficiently control the temperature of concrete within a range of ± 5 °C, and it can satisfy the demolding strength of concrete after curing by densification of the concrete matrix by decreasing the porosity.
- It is necessary to thoroughly control temperature to prevent DEF under a high-temperature environment, and it is considered that MW heat curing can efficiently control the temperature.
- When MW heat curing is applied, superior performance—such as cracking due to shrinkage, the prevention of bleeding of concrete after curing, and the prevention of surface separation—can be expected, unlike that with steam curing.
- MW heat curing can be expected to reduce CO2 emissions and curing energy cost compared with steam curing.
- To apply MW heat curing more efficiently as a substitute for steam curing, it is necessary to verify and supplement with actual data about the various sizes and shapes of steel form.
Author Contributions
Funding
Conflicts of Interest
References
- FIB. Seismic Design of Precast Concrete Building Structures; State-of-Art Report; FIB: Lausanne, Switzerland, 2004. [Google Scholar]
- Japan Concrete Institute. Research Committee Report for Design and Utilization of Precast Concrete Products; Japan Concrete Institute: Tokyo, Japan, 2009. [Google Scholar]
- Kawasaki, H.; Shoji, K.; Takahashi, K.; Sugihara, M. Construction of a RC high-rise condominium building with site-fabricated precast Concrete members. Concr. J. 1994, 32, 37–45. [Google Scholar] [CrossRef]
- Morishita, M.; Saitou, Y.; Hattori, Y.; Nonaka, Y. Construction of a factory building, using precast concrete members. Concr. J. 1993, 31, 31–41. [Google Scholar] [CrossRef]
- Nurse, R.W. Steam curing of concrete. Mag. Concr. Res. 1949, 1, 79–88. [Google Scholar] [CrossRef]
- Higginson, E.C. Effect of steam curing on the important properties of concrete. J. Proc. 1961, 58, 281–298. [Google Scholar]
- Koh, T.H.; Hwang, S.K.; Pyo, S.H.; Moon, D.Y.; Yoo, H.J.; Lee, D.G. Application of low-carbon ecofriendly microwave heat curing technology to concrete structures using general and multicomponent blended binder. J. Mater. Civ. Eng. 2019, 31, 04018385. [Google Scholar] [CrossRef]
- Koh, T.H.; Moon, D.Y.; Bae, J.M.; Yoo, Y.H. Compressive strength development model for concrete cured by microwave heating form. J. Korea Concr. Inst. 2015, 27, 669–676. [Google Scholar] [CrossRef]
- Koh, T.H.; Moon, D.Y.; Bae, J.M.; Yoo, Y.H. Evaluation of early strength for tunnel lining concrete by microwave heating form. Proc. Korea Concr. Inst. Conf.-Spring 2014, 26, 901–902. [Google Scholar]
- Japan Industrial Standards Committee. Method of test for Compressive Strength of Concrete; Japan Industrial Standards Committee: Tokyo, Japan, 2012. [Google Scholar]
- Japan Industrial Standards Committee. Methods of Measurement for Length Change of Mortar and Concrete—Part 3: Method with Dial Gauge; Japan Industrial Standards Committee: Tokyo, Japan, 2010. [Google Scholar]
- Ministry of the Environment. Guideline for Greenhouse Gas Emissions Calculation; Government of Japan: Tokyo, Japan, 2015.
- Ministry of the Environment. National Greenhouse Gas Inventory Report of JAPAN; Government of Japan: Tokyo, Japan, 2018.
- Architectural Institute of Japan. Recommendations for Practice of Crack Control in Reinforced Concrete Buildings (Design and Construction); Architectural Institute of Japan: Tokyo, Japan, 2006. [Google Scholar]
- Barbarulo, R.; Peycelon, H.; Prené, S.; Marchand, J. High temperature due to cement heat of hydration or late thermal cycle. Cem. Concr. Res. 2005, 35, 125–131. [Google Scholar] [CrossRef]
- Diamond, S. Delayed ettringite formation—Processes and problems. Cem. Concr. Compos. 1996, 18, 205–215. [Google Scholar] [CrossRef]
- Tsujino, M.; Yuasa, R.; Hashida, H. Method of test for restrained expansion of expansive concrete using a cylindrical mold. Concr. J. 2014, 52, 519–527. [Google Scholar] [CrossRef]
- Kobayashi, S.; Ozawa, M.; Suhara, K.; Morimoto, H. Expansion property and hydration products of expansive mortar at different temperatures. Cem. Sci. Concr. Technol. 2011, 65, 95–102. [Google Scholar] [CrossRef]
- Sato, S.; Shimomura, T. Stress-effective strain curve of uniaxial concrete specimen under restraint drying shrinkage. Proc. Jpn. Concr. Inst. 2005, 28, 509–514. [Google Scholar]
- Noguchi, T.; Tomosawa, F. Relationship between compressive strength and various mechanical properties of high strength concrete. J. Struct. Constr. Eng. 1995, 472, 11–16. [Google Scholar] [CrossRef]
- Choi, H.G.; Lim, M.K.; Kitagaki, R.; Noguchi, T.; Kim, G.Y. Restrained shrinkage behavior of expansive mortar at early ages. Constr. Build. Mater. 2015, 84, 468–476. [Google Scholar] [CrossRef]
- Torrent, R. Two-chamber vacuum cell for measuring the coefficient of permeability to air of the concrete cover on site. Mater. Struct. 1992, 25, 358–365. [Google Scholar] [CrossRef]
- Torrent, R.; Frenzer, G. A method for the rapid determination of the coefficient of permeability of the “covercrete”. In Proceedings of the International Symposium Non-Destructive Testing in Civil Engineering (NDT-CE), Berlin, Germany, 26–28 September 1995; pp. 985–992. [Google Scholar]


| Type | W/C 1 (%) | Slump (cm) | Air (%) | Curing Time 2 (h) | Maximum Temperature (°C) | Evaluation Items |
|---|---|---|---|---|---|---|
| Steam | 42.6 | 18.0 ± 2.5 | 4.5 ± 1.5 | 2, 6, 9 | 60 |
|
| MW1 | 2, 8, 7 | 50 | ||||
| MW2 | 2, 12, 3 | 55 | ||||
| MW3 | 2, 8, 7 | 65 |
| Materials | Type |
|---|---|
| Cement | Ordinary Portland cement, Density: 3.16 g/cm3 |
| Sand | Pit sand, Density: 2.67 g/cm3, Absorption ratio: 1.44% |
| Gravel | Limestone, Density: 2.71 g/cm3, Absorption ratio: 1.05% |
| Admixture | Air entraining and water reducing agent and Air entraining agent |
| Ordinary Portland cement | Chemical Composition (%) | ||||||||
| SiO2 | Al2O3 | Fe2O3 | CaO | MgO | SO3 | CaSO4 | Ig.loss | Alkali content | |
| 21.4 | 5.5 | 2.8 | 64.3 | 2.1 | 1.9 | - | 0.56 | 0.25 | |
| fck (MPa) | W/C (%) | s/a (%) | Unit Weight (kg/m3) | AE Reducing Agent (kg/m3) | AE Agent (kg/m3) | |||
|---|---|---|---|---|---|---|---|---|
| W | C | G | S | |||||
| 30 | 42.6 | 43.6 | 165 | 387 | 819 | 972 | 3.87 | 0.155 |
| Curing | Fresh Properties | Compressive Strength | |||||
|---|---|---|---|---|---|---|---|
| Slump (cm) | Air Content (%) | Temperature (°C) | 1 Day (MPa) | 7 Days (MPa) | 14 Days (MPa) | 28 Days (MPa) | |
| Steam | 18.0 | 4.8 | 16.0 | 7.3 | 33.2 | 37.9 | 40.8 |
| MW1 | 18.5 | 5.3 | 13.0 | ||||
| MW2 | 19.0 | 5.3 | 11.2 | ||||
| MW3 | 19.0 | 4.7 | 15.2 | ||||
| Type | Steam | MW1 |
| Shape of surface | 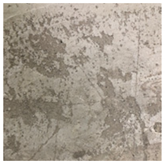 | 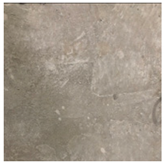 |
| Type | MW2 | MW3 |
| Shape of surface |  | 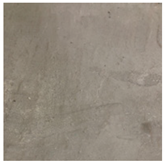 |
© 2019 by the authors. Licensee MDPI, Basel, Switzerland. This article is an open access article distributed under the terms and conditions of the Creative Commons Attribution (CC BY) license (http://creativecommons.org/licenses/by/4.0/).
Share and Cite
Choi, H.; Koh, T.; Choi, H.; Hama, Y. Performance Evaluation of Precast Concrete Using Microwave Heating Form. Materials 2019, 12, 1113. https://doi.org/10.3390/ma12071113
Choi H, Koh T, Choi H, Hama Y. Performance Evaluation of Precast Concrete Using Microwave Heating Form. Materials. 2019; 12(7):1113. https://doi.org/10.3390/ma12071113
Chicago/Turabian StyleChoi, Hyeonggil, Taehoon Koh, Heesup Choi, and Yukio Hama. 2019. "Performance Evaluation of Precast Concrete Using Microwave Heating Form" Materials 12, no. 7: 1113. https://doi.org/10.3390/ma12071113
APA StyleChoi, H., Koh, T., Choi, H., & Hama, Y. (2019). Performance Evaluation of Precast Concrete Using Microwave Heating Form. Materials, 12(7), 1113. https://doi.org/10.3390/ma12071113