Pitting Corrosion of Natural Aged Al–Mg–Si Extrusion Profile

 , ,
, ,  ,
, 
Abstract
:
1. Introduction
2. Methodology
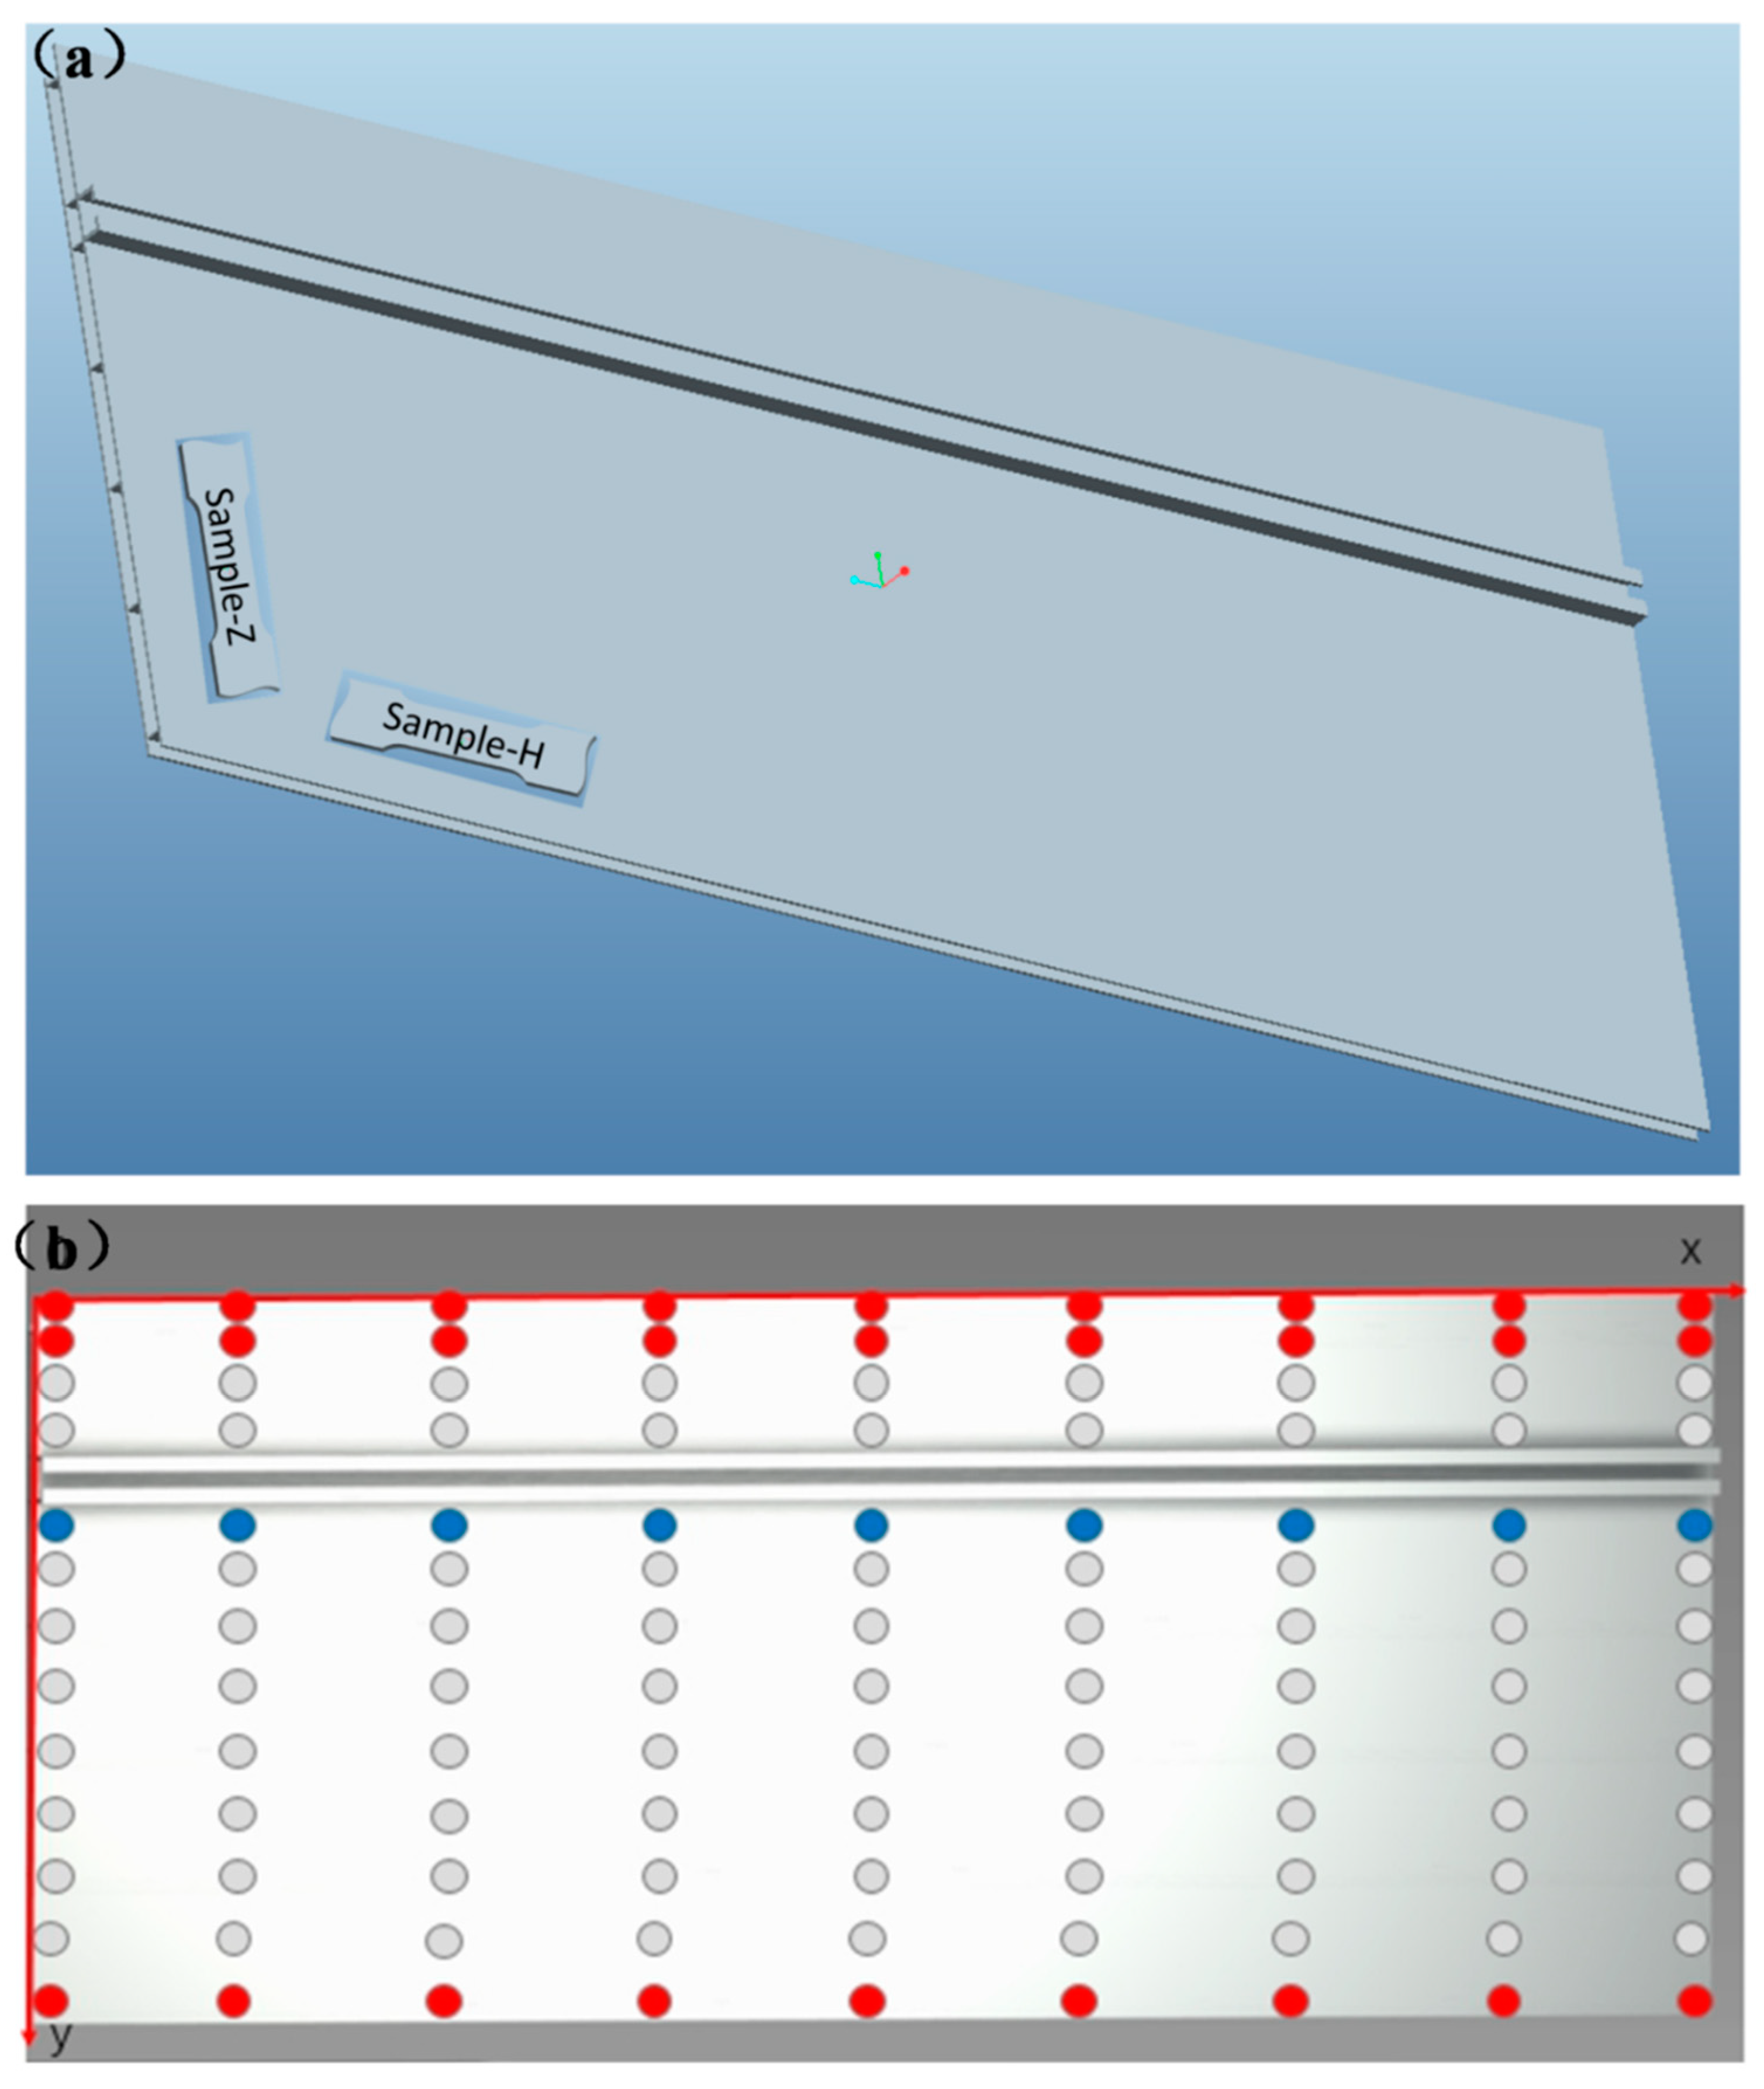
2.1. Materials and Sample Preparation
2.2. Surface Characterization and Pit Depth
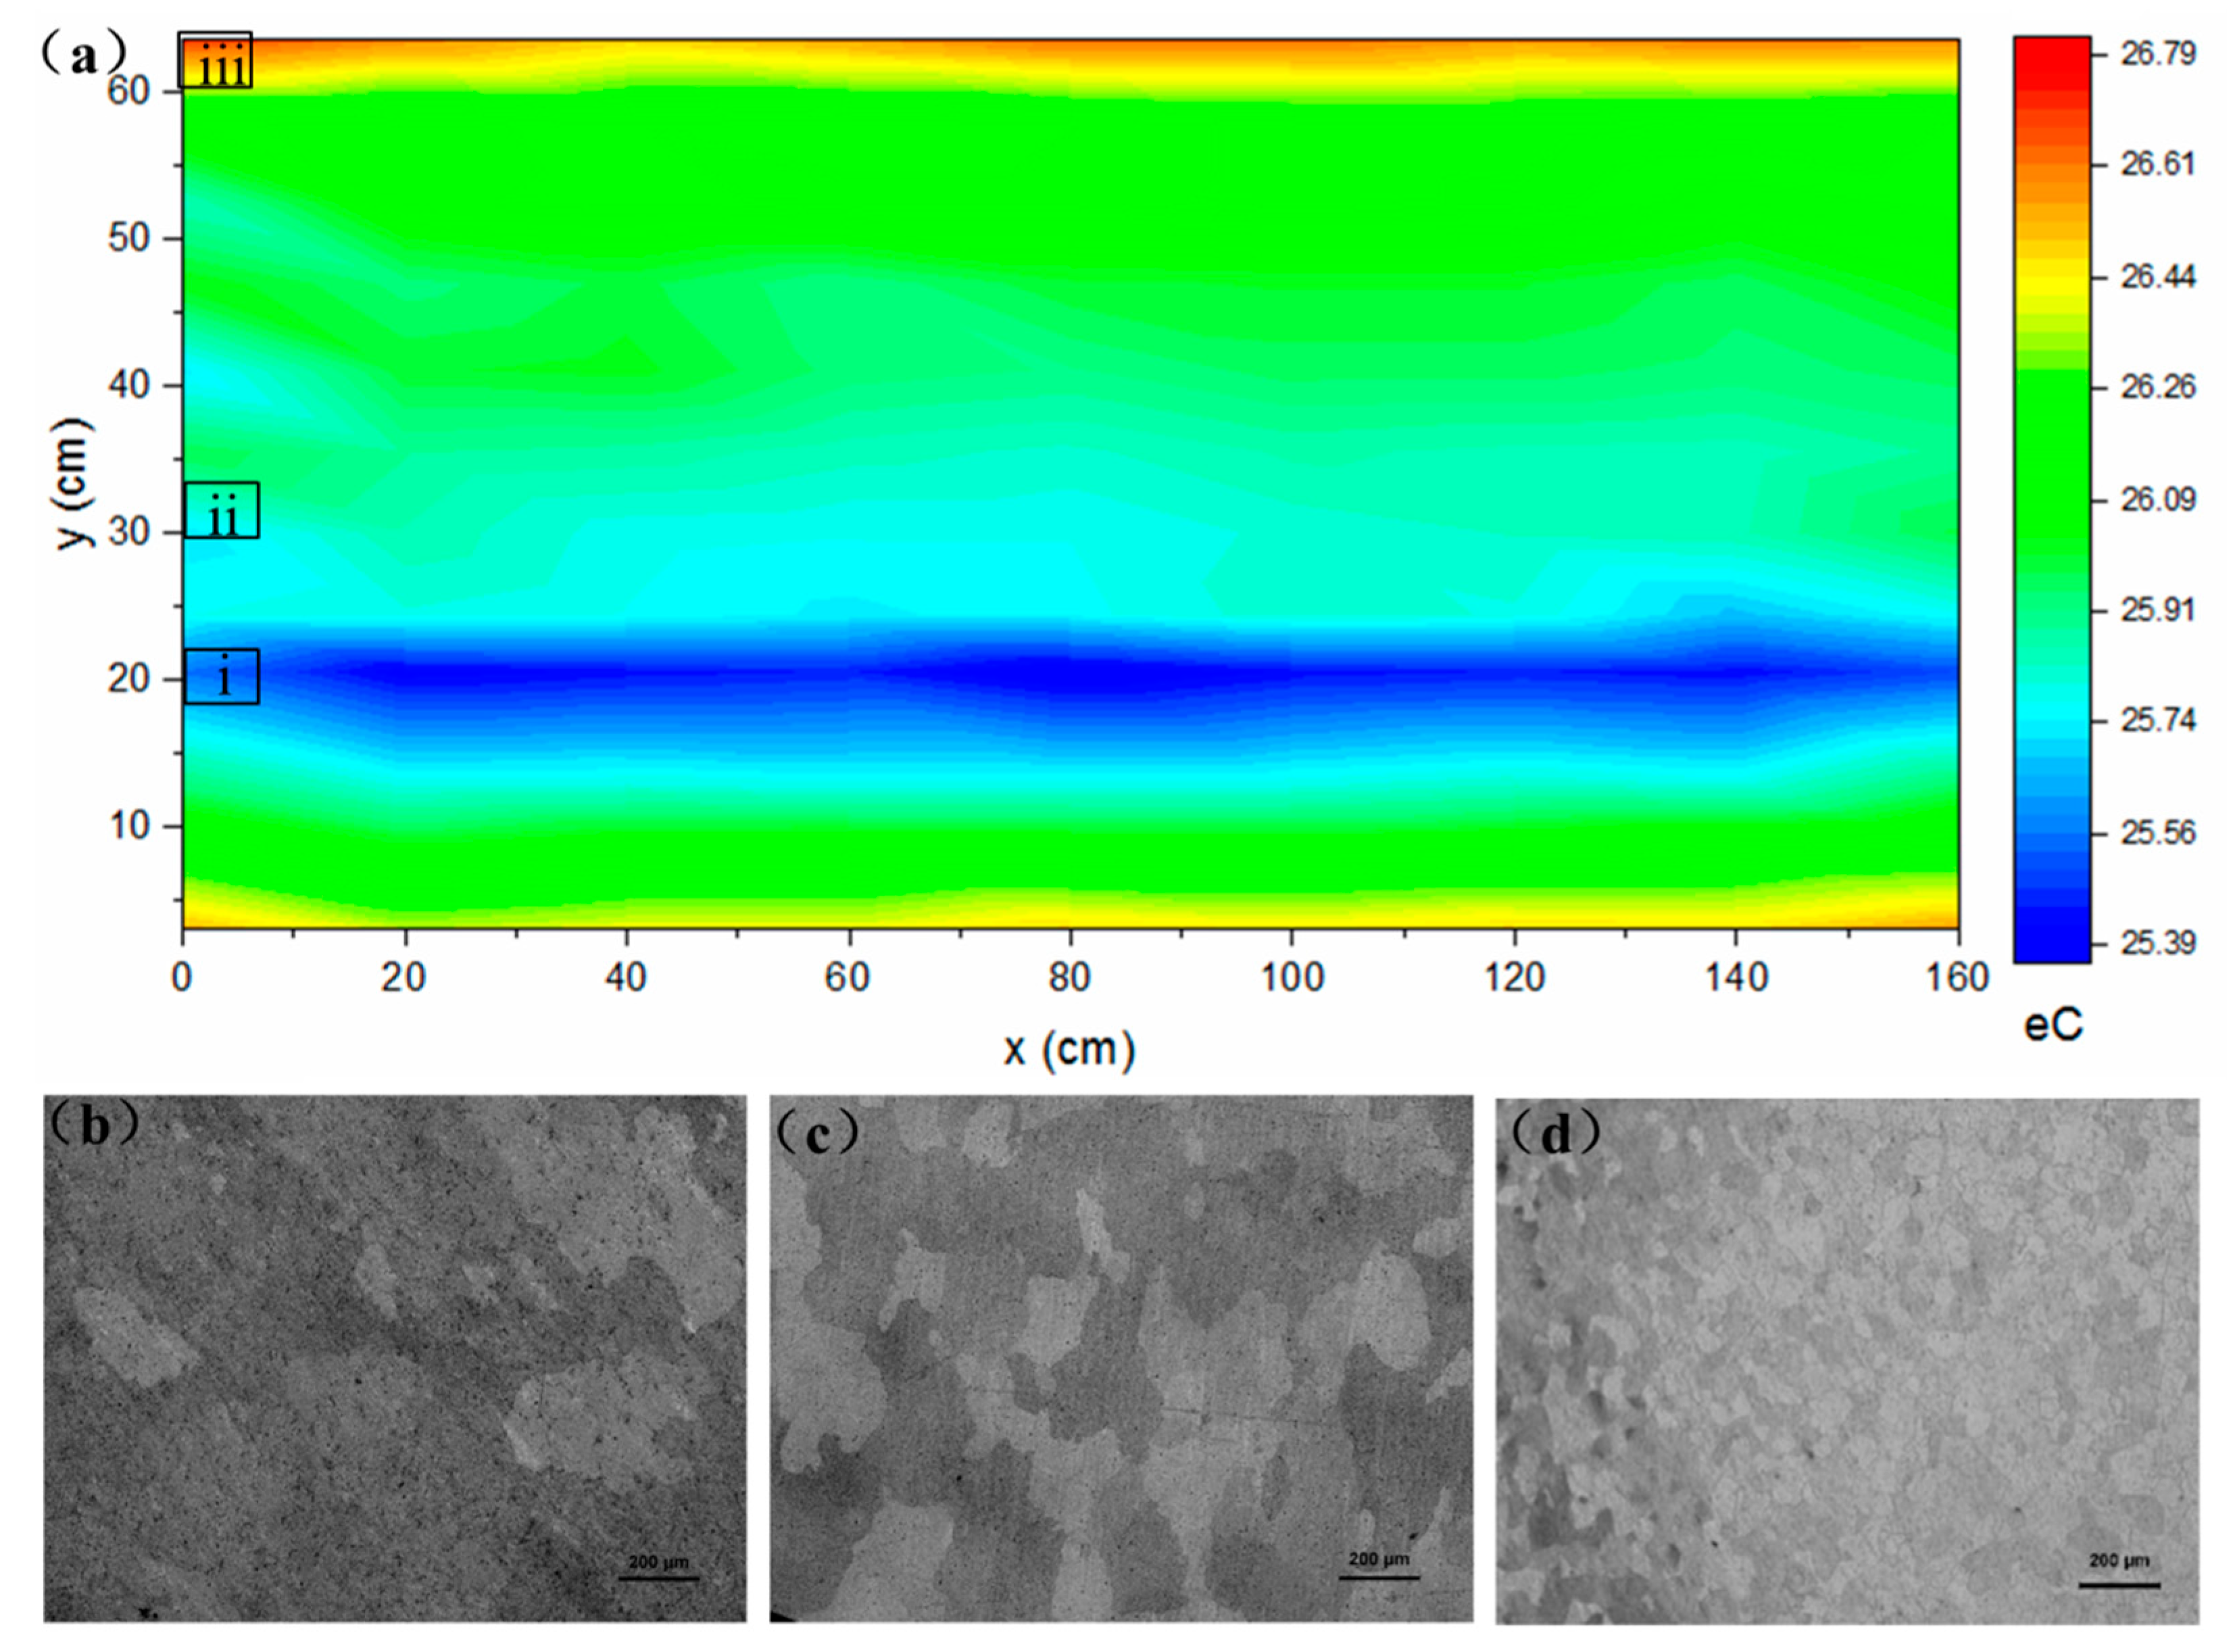
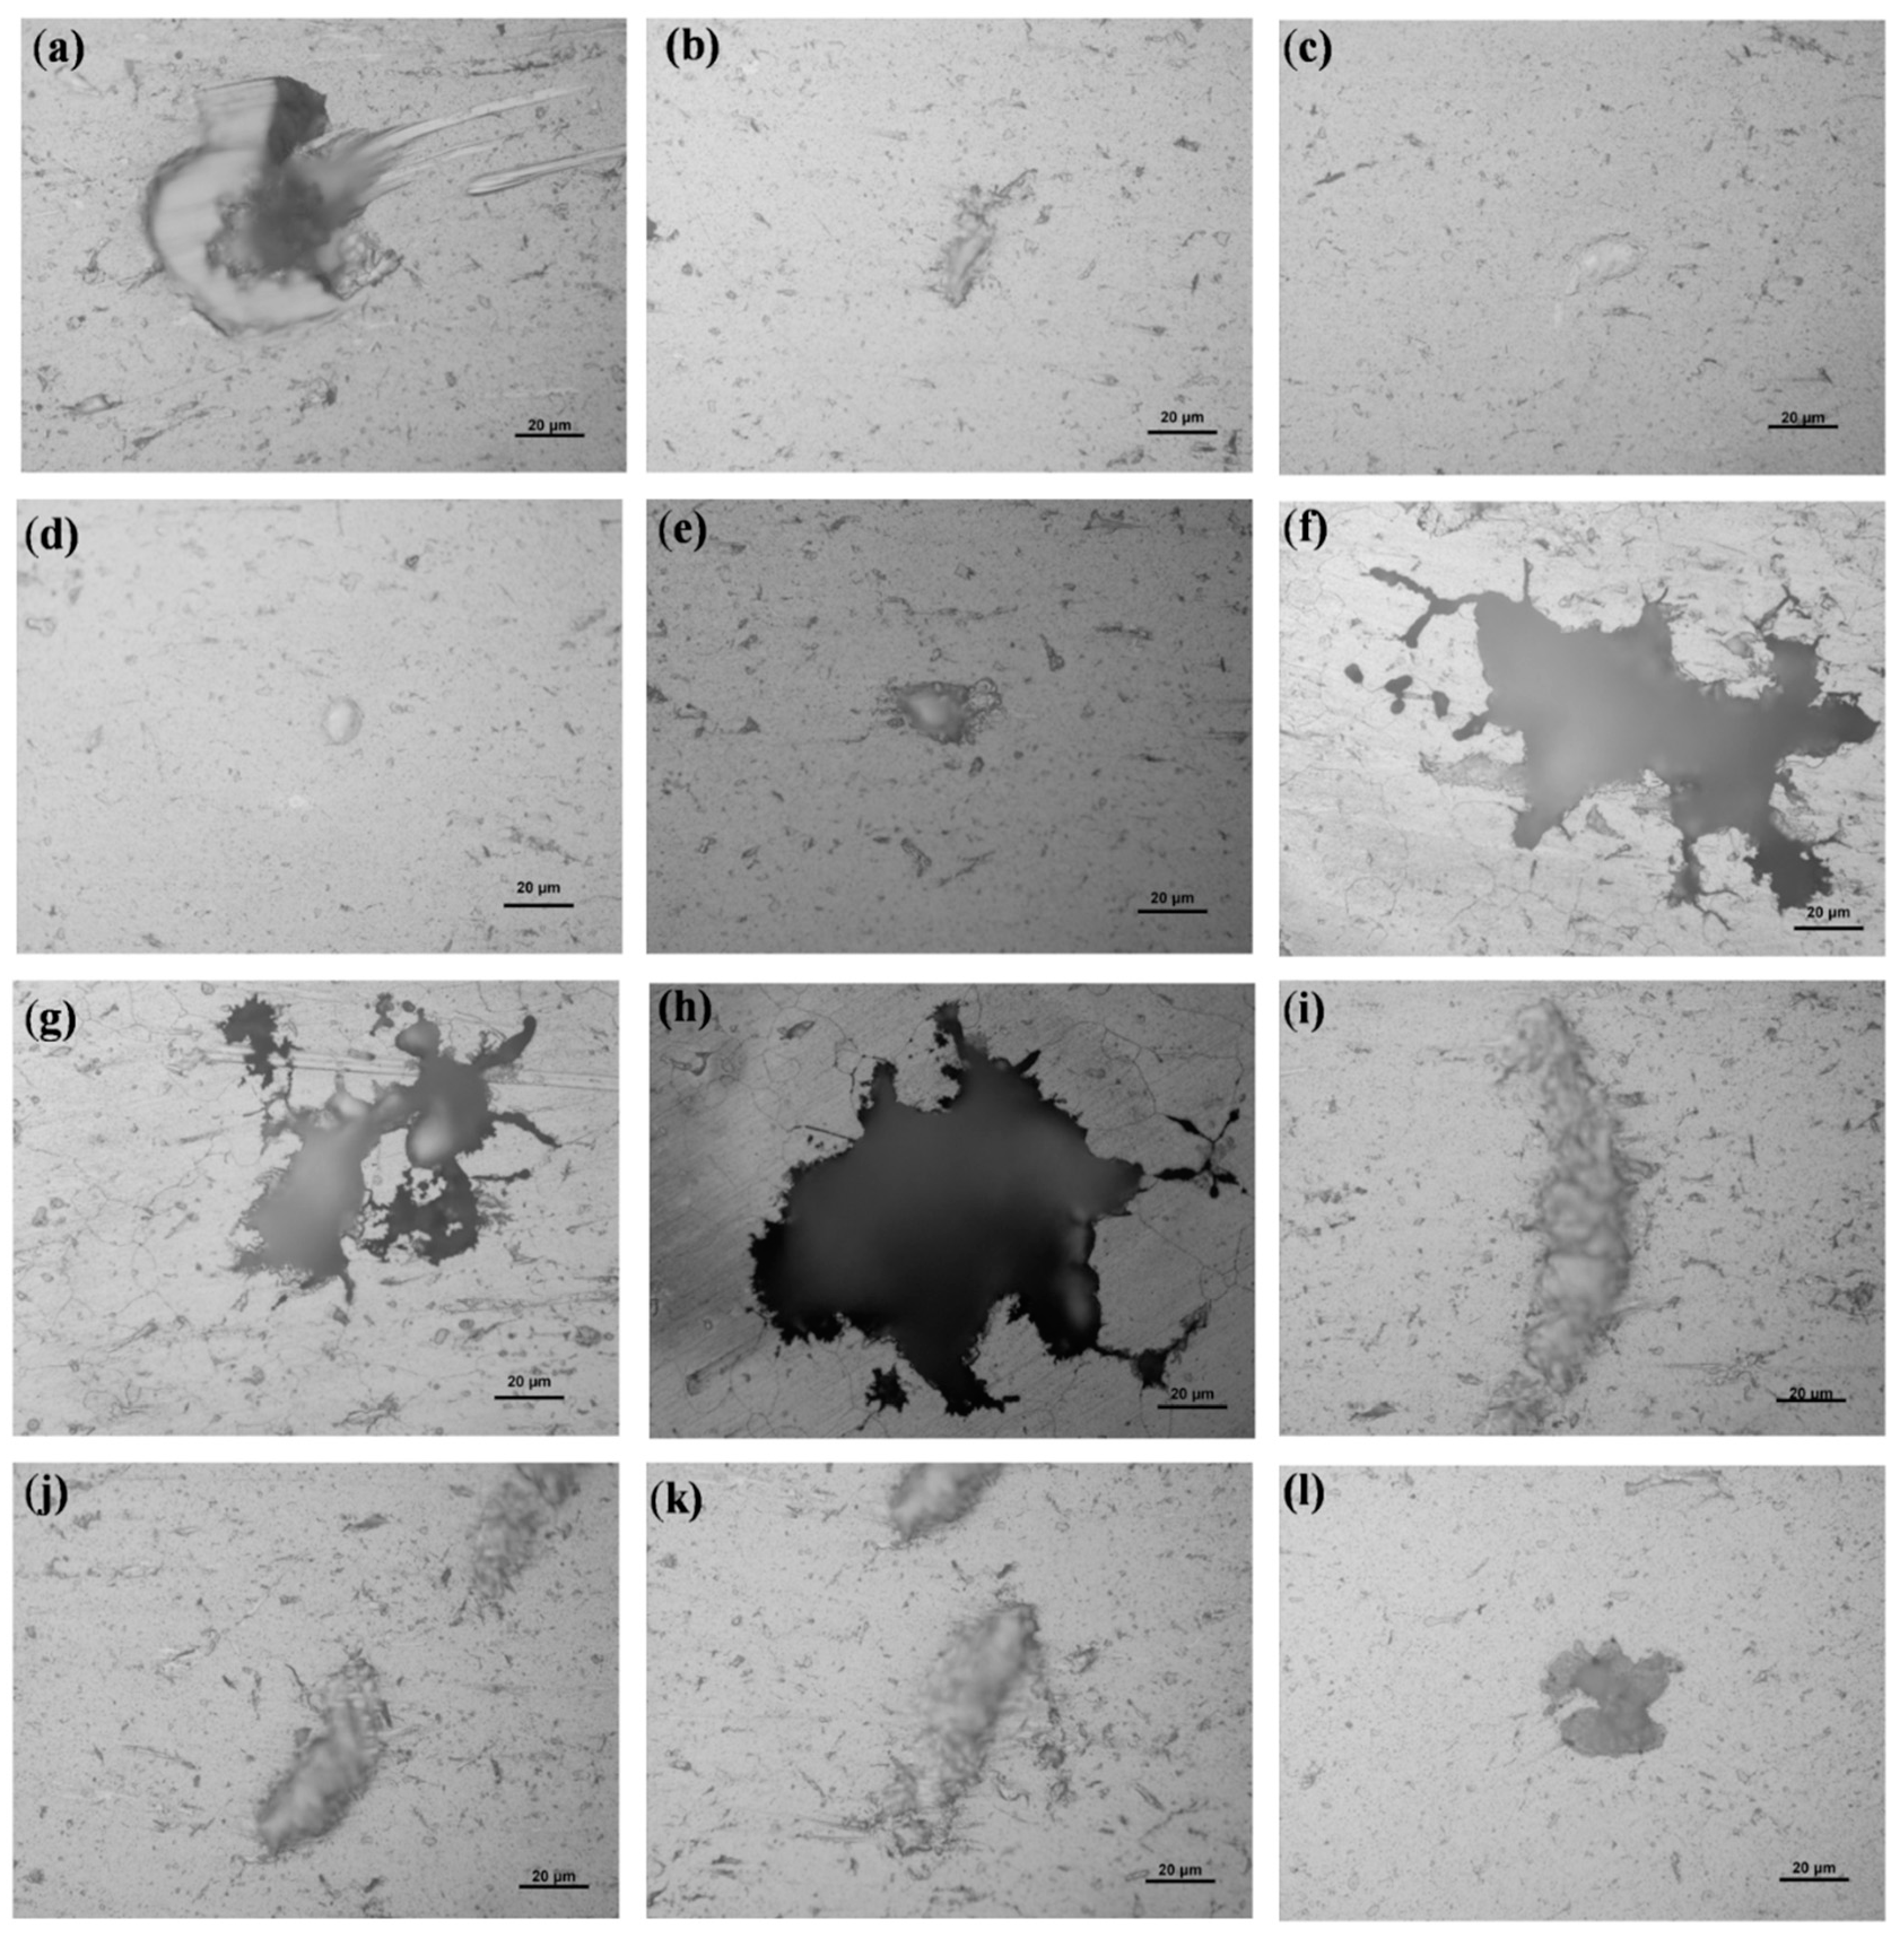
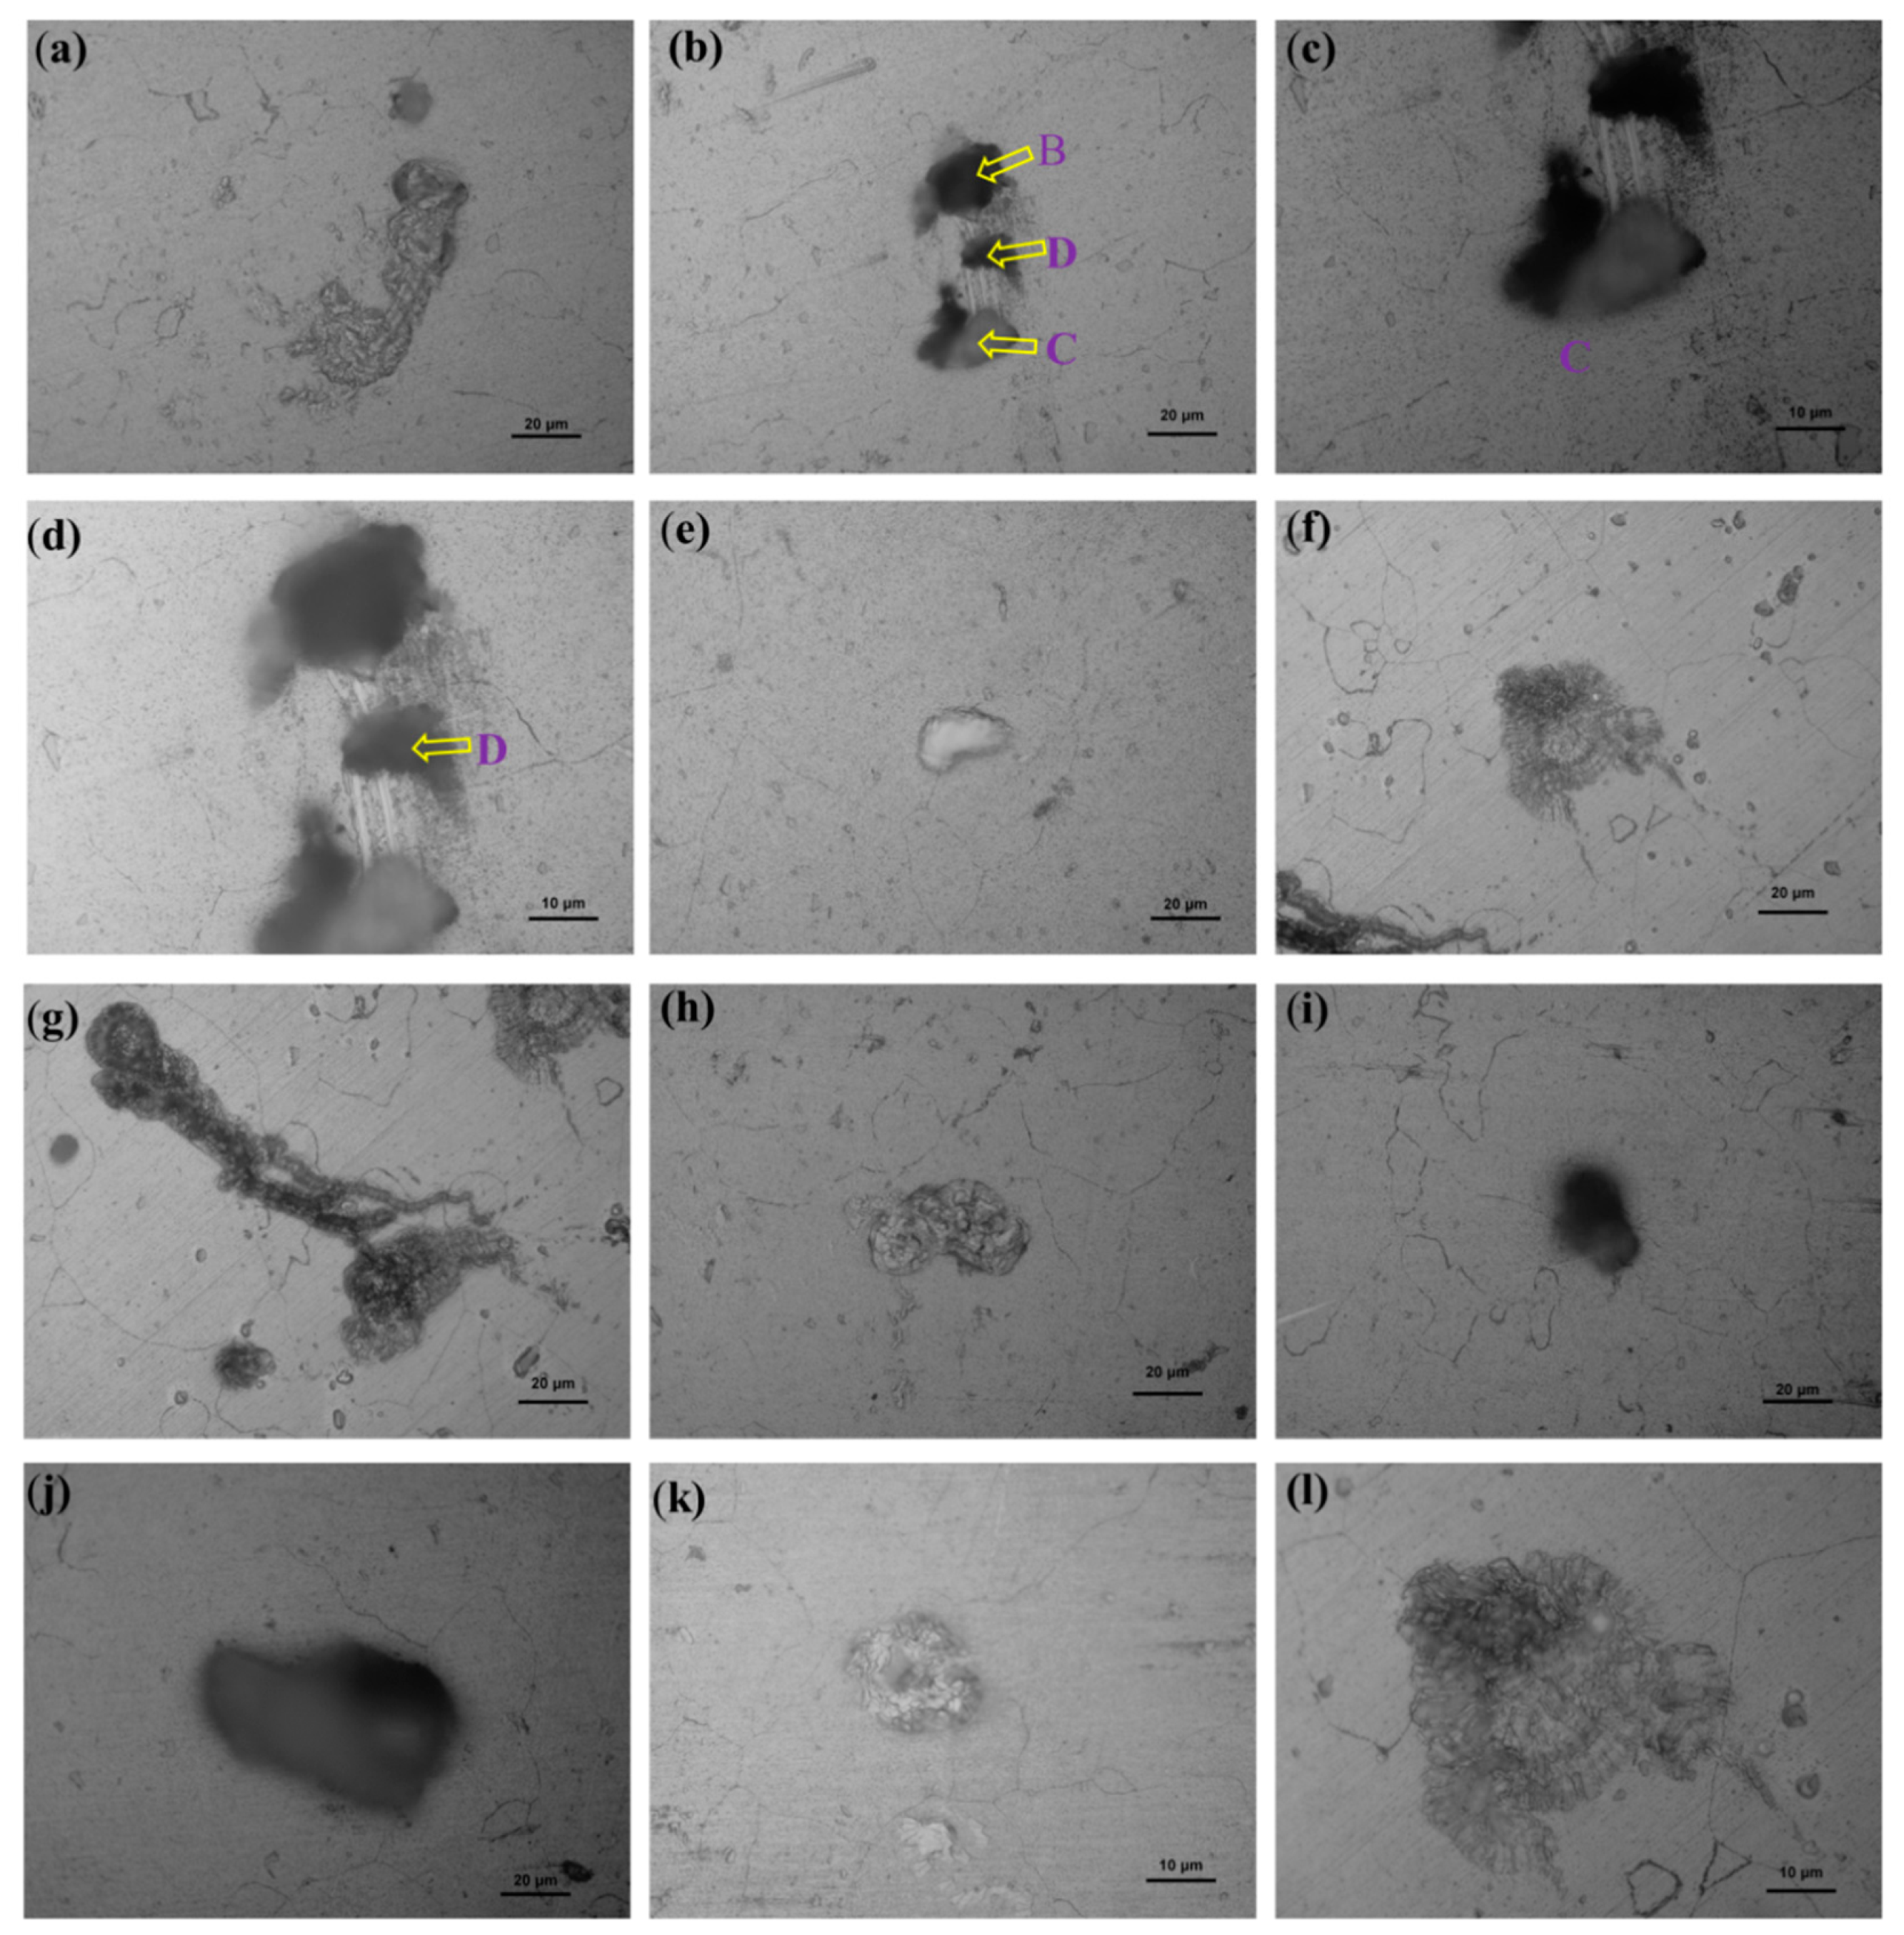
3. Results and Discussions
4. Conclusions
Author Contributions
Funding
Conflicts of Interest
References
- Sun, W.; Zhu, Y.; Marceau, R.; Wang, L.; Zhang, Q.; Gao, X.; Hutchinson, C. Precipitation strengthening of aluminum alloys by room-temperature cyclic plasticity. Science 2019, 363, 972–975. [Google Scholar] [CrossRef]
- Werinos, M.; Antrekowitsch, H.; Ebner, T.; Prillhofer, R.; Curtin, W.A.; Uggowitzer, P.J.; Pogatscher, S. Design strategy for controlled natural aging in Al-Mg-Si alloys. Acta Mater. 2016, 118, 296–305. [Google Scholar] [CrossRef]
- Martinsen, F.A.; Ehlers, F.J.H.; Torsæter, M.; Holmestad, R. Reversal of the negative natural aging effect in Al-Mg-Si alloys. Acta Mater. 2012, 60, 6091–6101. [Google Scholar] [CrossRef]
- Nandy, S.; Bakkar, M.A.; Das, D. Influence of Ageing on Mechanical Properties of 6063 Al Alloy. Mater. Today Proc. 2015, 2, 1234–1242. [Google Scholar] [CrossRef]
- Liu, C.H.; Lai, Y.X.; Chen, J.H.; Tao, G.H.; Liu, L.M.; Ma, P.P.; Wu, C.L. Natural-aging-induced reversal of the precipitation pathways in an Al-Mg-Si alloy. Scripta Mater. 2016, 115, 150–154. [Google Scholar] [CrossRef]
- Jin, S.; Ngai, T.; Li, L.; Lai, Y.; Chen, Z.; Wang, A. Influence of natural aging and pre-treatment on the precipitation and age-hardening behavior of Al-1.0Mg-0.65Si-0.24Cu alloy. J. Alloy. Compd. 2018, 742, 852–859. [Google Scholar] [CrossRef]
- Ding, L.; Jia, Z.; Zhang, Z.; Sanders, R.E.; Liu, Q.; Yang, G. The natural aging and precipitation hardening behaviour of Al-Mg-Si-Cu alloys with different Mg/Si ratios and Cu additions. Mater. Sci. Eng. A 2015, 627, 119–126. [Google Scholar] [CrossRef]
- Marquis, E.A.; Hyde, J.M. Applications of atom-probe tomography to the characterisation of solute behaviours. Mater. Sci. Eng. R 2010, 69, 37–62. [Google Scholar] [CrossRef]
- Marioara, C.D.; Andersen, S.J.; Stene, T.N.; Hasting, H.; Walmsley, J.; Van Helvoort, A.T.J.; Holmestad, R. The effect of Cu on precipitation in Al-Mg-Si alloys. Philos. Mag. 2007, 87, 3385–3413. [Google Scholar] [CrossRef]
- Man, J.; Jing, L.; Jie, S.G. The effects of Cu addition on the microstructure and thermal stability of an Al-Mg-Si alloy. J. Alloy. Compd. 2007, 437, 146–150. [Google Scholar] [CrossRef]
- Aruga, Y.; Kozuka, M.; Takaki, Y.; Sato, T. Effects of natural aging after pre-aging on clustering and bake-hardening behavior in an Al-Mg-Si alloy. Scripta Mater. 2016, 116, 82–86. [Google Scholar] [CrossRef]
- Tian, W.; Li, S.; Wang, B.; Liu, J.; Yu, M. Pitting corrosion of naturally aged AA 7075 aluminum alloys with bimodal grain size. Corros. Sci. 2016, 113, 1–16. [Google Scholar] [CrossRef]
- Wang, J.; Zhang, B.; Zhou, Y.T.; Ma, X.L. Multiple twins of a decagonal approximant embedded in S-Al2CuMg phase resulting in pitting initiation of a 2024Al alloy. Acta Mater. 2015, 82, 22–31. [Google Scholar] [CrossRef]
- Wang, J.; Zhang, B.; Wu, B.; Ma, X.L. Size-dependent role of S phase in pitting initiation of 2024Al alloy. Corros. Sci. 2016, 105, 183–189. [Google Scholar] [CrossRef]
- Starke, E.A.; Staley, J.T. Application of modern aluminum alloys to aircraft. Prog. Aerosp. Sci. 1996, 32, 131–172. [Google Scholar] [CrossRef]
- Donatus, U.; Thompson, G.E.; Omotoyinbo, J.A.; Alaneme, K.K.; Aribo, S.; Agbabiaka, O.G. Corrosion pathways in aluminium alloys. Trans. Nonferrous. Met. Soc. China 2017, 27, 55–62. [Google Scholar] [CrossRef]
- Stannard, T.J.; Williams, J.J.; Singh, S.S.; Sundaram Singaravelu, A.S.; Xiao, X.; Chawla, N. 3D time-resolved observations of corrosion and corrosion-fatigue crack initiation and growth in peak-aged Al 7075 using synchrotron X-ray tomography. Corros. Sci. 2018, 138, 340–352. [Google Scholar] [CrossRef]
- Ansari, T.Q.; Xiao, Z.; Hu, S.; Li, Y.; Luo, J.-L.; Shi, S.-Q. Phase-field model of pitting corrosion kinetics in metallic materials. npj Comput. Mater. 2018, 4, 38. [Google Scholar] [CrossRef]
- Turnbull, A.; Wright, L.; Crocker, L. New insight into the pit-to-crack transition from finite element analysis of the stress and strain distribution around a corrosion pit. Corros. Sci. 2010, 52, 1492–1498. [Google Scholar] [CrossRef]
- Turnbull, A.; Horner, D.A.; Connolly, B.J. Challenges in modelling the evolution of stress corrosion cracks from pits. Eng. Fract. Mech. 2009, 76, 633–640. [Google Scholar] [CrossRef]
- Ralston, K.D.; Birbilis, N.; Cavanaugh, M.K.; Weyland, M.; Muddle, B.C.; Marceau, R.K.W. Role of nanostructure in pitting of Al-Cu-Mg alloys. Electrochimica Acta 2010, 55, 7834–7842. [Google Scholar] [CrossRef]
- Wang, H.; Han, E.-H. Computational simulation of corrosion pit interactions under mechanochemical effects using a cellular automaton/finite element model. Corros. Sci. 2016, 103, 305–311. [Google Scholar] [CrossRef]
- Soltis, J. Passivity breakdown, pit initiation and propagation of pits in metallic materials—Review. Corros. Sci. 2015, 90, 5–22. [Google Scholar] [CrossRef]
- McCallum, K.; Zhao, J.; Workman, M.; Iannuzzi, M.; Kappes, M.; Payer, J.; Clemons, C.B.; Chawla, S.; Kreider, K.I.; Mimoto, N.; et al. Localized Corrosion Risk Assessment Using Markov Analysis. Corrosion 2014, 70, 1114–1127. [Google Scholar] [CrossRef]
- Li, Y.; Xu, J. Role of late transition metals on pitting resistance of Zr-Ti-(Cu, Ni, Co)-Al bulk metallic glasses in 0.6M NaCl aqueous solution. J. Mater. Sci. Technol. 2017, 33, 1278–1288. [Google Scholar] [CrossRef]
- Liu, L.; Li, Y.; Wang, F. Electrochemical Corrosion Behavior of Nanocrystalline Materials—A Review. J. Mater. Sci. Technol. 2010, 26, 1–14. [Google Scholar] [CrossRef]
- Ma, H.; Chen, X.-Q.; Li, R.; Wang, S.; Dong, J.; Ke, W. First-principles modeling of anisotropic anodic dissolution of metals and alloys in corrosive environments. Acta Materialia 2017, 130, 137–146. [Google Scholar] [CrossRef]
- Wu, X.Y.; Niu, F.J.; Lin, Z.J.; Luo, J.; Zheng, H.; Shao, Z.J. Delamination frost heave in embankment of high speed railway in high altitude and seasonal frozen region. Cold Reg. Sci. Technol. 2018, 153, 25–32. [Google Scholar] [CrossRef]
- Liu, Z.-K.; McDowell, D.L. The Penn State-Georgia Tech CCMD: ushering in the ICME Era. Int. Mater. Manuf. Innovat. 2014, 3, 28. [Google Scholar] [CrossRef]
- TB/T 3260.1-2011. Aluminium and Aluminium Alloys Used on EMU. Part 1: Basic Requirement; CSR Qishuyan Locomotive & Rolling Stock Technology Research Institute Co., Ltd.: Dalian, China, 2011. [Google Scholar]
- JB/T 7901-1999. Metals Materials—Uniform Corrosion—Methods of Laboratory Immersion Testing; Ministry of Machine-Building Industry: Beijing, China, 1999. [Google Scholar]
- Huang, I.W.; Hurley, B.L.; Yang, F.; Buchheit, R.G. Dependence on Temperature, pH, and Cl- in the Uniform Corrosion of Aluminum Alloys 2024-T3, 6061-T6, and 7075-T6. Electrochimica Acta 2016, 199, 242–253. [Google Scholar] [CrossRef]
- Gupta, R.K.; Sukiman, N.L.; Cavanaugh, M.K.; Hinton, B.R.W.; Hutchinson, C.R.; Birbilis, N. Metastable pitting characteristics of aluminium alloys measured using current transients during potentiostatic polarisation. Electrochimica Acta 2012, 66, 245–254. [Google Scholar] [CrossRef]
- Gupta, R.K.; Hinton, B.R.W.; Birbilis, N. The effect of chromate on the pitting susceptibility of AA7075-T651 studied using potentiostatic transients. Corros. Sci. 2014, 82, 197–207. [Google Scholar] [CrossRef]
- GB/T 3246.1-2000. Wrough Aluminium and Aluminium Alloys Products Inspection Method for Structure; China Non-ferrous metals industry standard Institute of Metrology and Quality: Beijing, China, 2000. [Google Scholar]
- GB/T 18590-2001. Corrosion of Metals and Alloys—Evaluation of Pitting Corrosion; General Administration of Quality Supervision, Inspection and Quarantine: Beijing, China, 2001. [Google Scholar]
- Lassance, D.; Fabregue, D.; Delannay, F.; Pardoen, T. Micromechanics of room and high temperature fracture in 6xxx Al alloys. Prog. Mater. Sci. 2007, 52, 62–129. [Google Scholar] [CrossRef]
- Kuijpers, N.C.W.; Tirel, J.; Hanlon, D.N.; van der Zwaag, S. Quantification of the evolution of the 3D intermetallic structure in a 6005A aluminium alloy during a homogenisation treatment. Mater. Charact. 2002, 48, 379–392. [Google Scholar] [CrossRef]
- Ralston, K.D.; Birbilis, N.; Weyland, M.; Hutchinson, C.R. The effect of precipitate size on the yield strength-pitting corrosion correlation in Al-Cu-Mg alloys. Acta Mater. 2010, 58, 5941–5948. [Google Scholar] [CrossRef]
- Pogatscher, S.; Kozeschnik, E.; Antrekowitsch, H.; Werinos, M.; Gerstl, S.S.A.; Loffler, J.F.; Uggowitzer, P.J. Process-controlled suppression of natural aging in an Al-Mg-Si alloy. Scripta Mater. 2014, 89, 53–56. [Google Scholar] [CrossRef]
- Guan, L.; Zhang, B.; Wang, J.Q.; Han, E.H.; Ke, W. The reliability of electrochemical noise and current transients characterizing metastable pitting of Al-Mg-Si microelectrodes. Corros. Sci. 2014, 80, 1–6. [Google Scholar] [CrossRef]
- Dong, C.F.; Sheng, H.; An, Y.H.; Li, X.G.; Xiao, K.; Cheng, Y.F. Corrosion of 7A04 aluminum alloy under defected epoxy coating studied by localized electrochemical impedance spectroscopy. Prog. Org. Coat. 2010, 67, 269–273. [Google Scholar] [CrossRef]
- Ding, X.F.; Sun, J.; Ying, J.; Zhang, W.D.; Ma, J.H.; Wang, L.C. Influences of aging temperature and time on microstructure and mechanical properties of 6005A aluminum alloy extrusions. Trans. Nonferrous. Met. Soc. China 2012, 22, s14–s20. [Google Scholar] [CrossRef]
- Alexopoulos, N.D.; Charalampidou, C.; Skarvelis, P.; Kourkoulis, S.K. Synergy of corrosion-induced micro-cracking and hydrogen embrittlement on the structural integrity of aluminium alloy (Al-Cu-Mg) 2024. Corros. Sci. 2017, 121, 32–42. [Google Scholar] [CrossRef]
- Gruenberg, K.M.; Craig, B.A.; Hillberry, B.M.; Bucci, R.J.; Hinkle, A.J. Predicting fatigue life of pre-corroded 2024-T3 aluminum from breaking load tests. Int. J. Fatigue 2004, 26, 615–627. [Google Scholar] [CrossRef]
- Dong, P.; Sun, D.; Li, H. Natural aging behaviour of friction stir welded 6005A-T6 aluminium alloy. Mater. Sci. Eng. A 2013, 576, 29–35. [Google Scholar] [CrossRef]
- Nejadseyfi, O.; Shokuhfar, A.; Dabiri, A.; Azimi, A. Combining equal-channel angular pressing and heat treatment to obtain enhanced corrosion resistance in 6061 aluminum alloy. J. Alloy. Compd. 2015, 648, 912–918. [Google Scholar] [CrossRef]

| Elements | Si | Fe | Cu | Mn | Mg | Cr | Zn | Ti | Al |
|---|---|---|---|---|---|---|---|---|---|
| Content | 0.5–0.9 | ≤0.35 | ≤0.30 | ≤0.30 | 0.40–0.7 | ≤0.30 | ≤0.20 | ≤0.10 | Bal. |
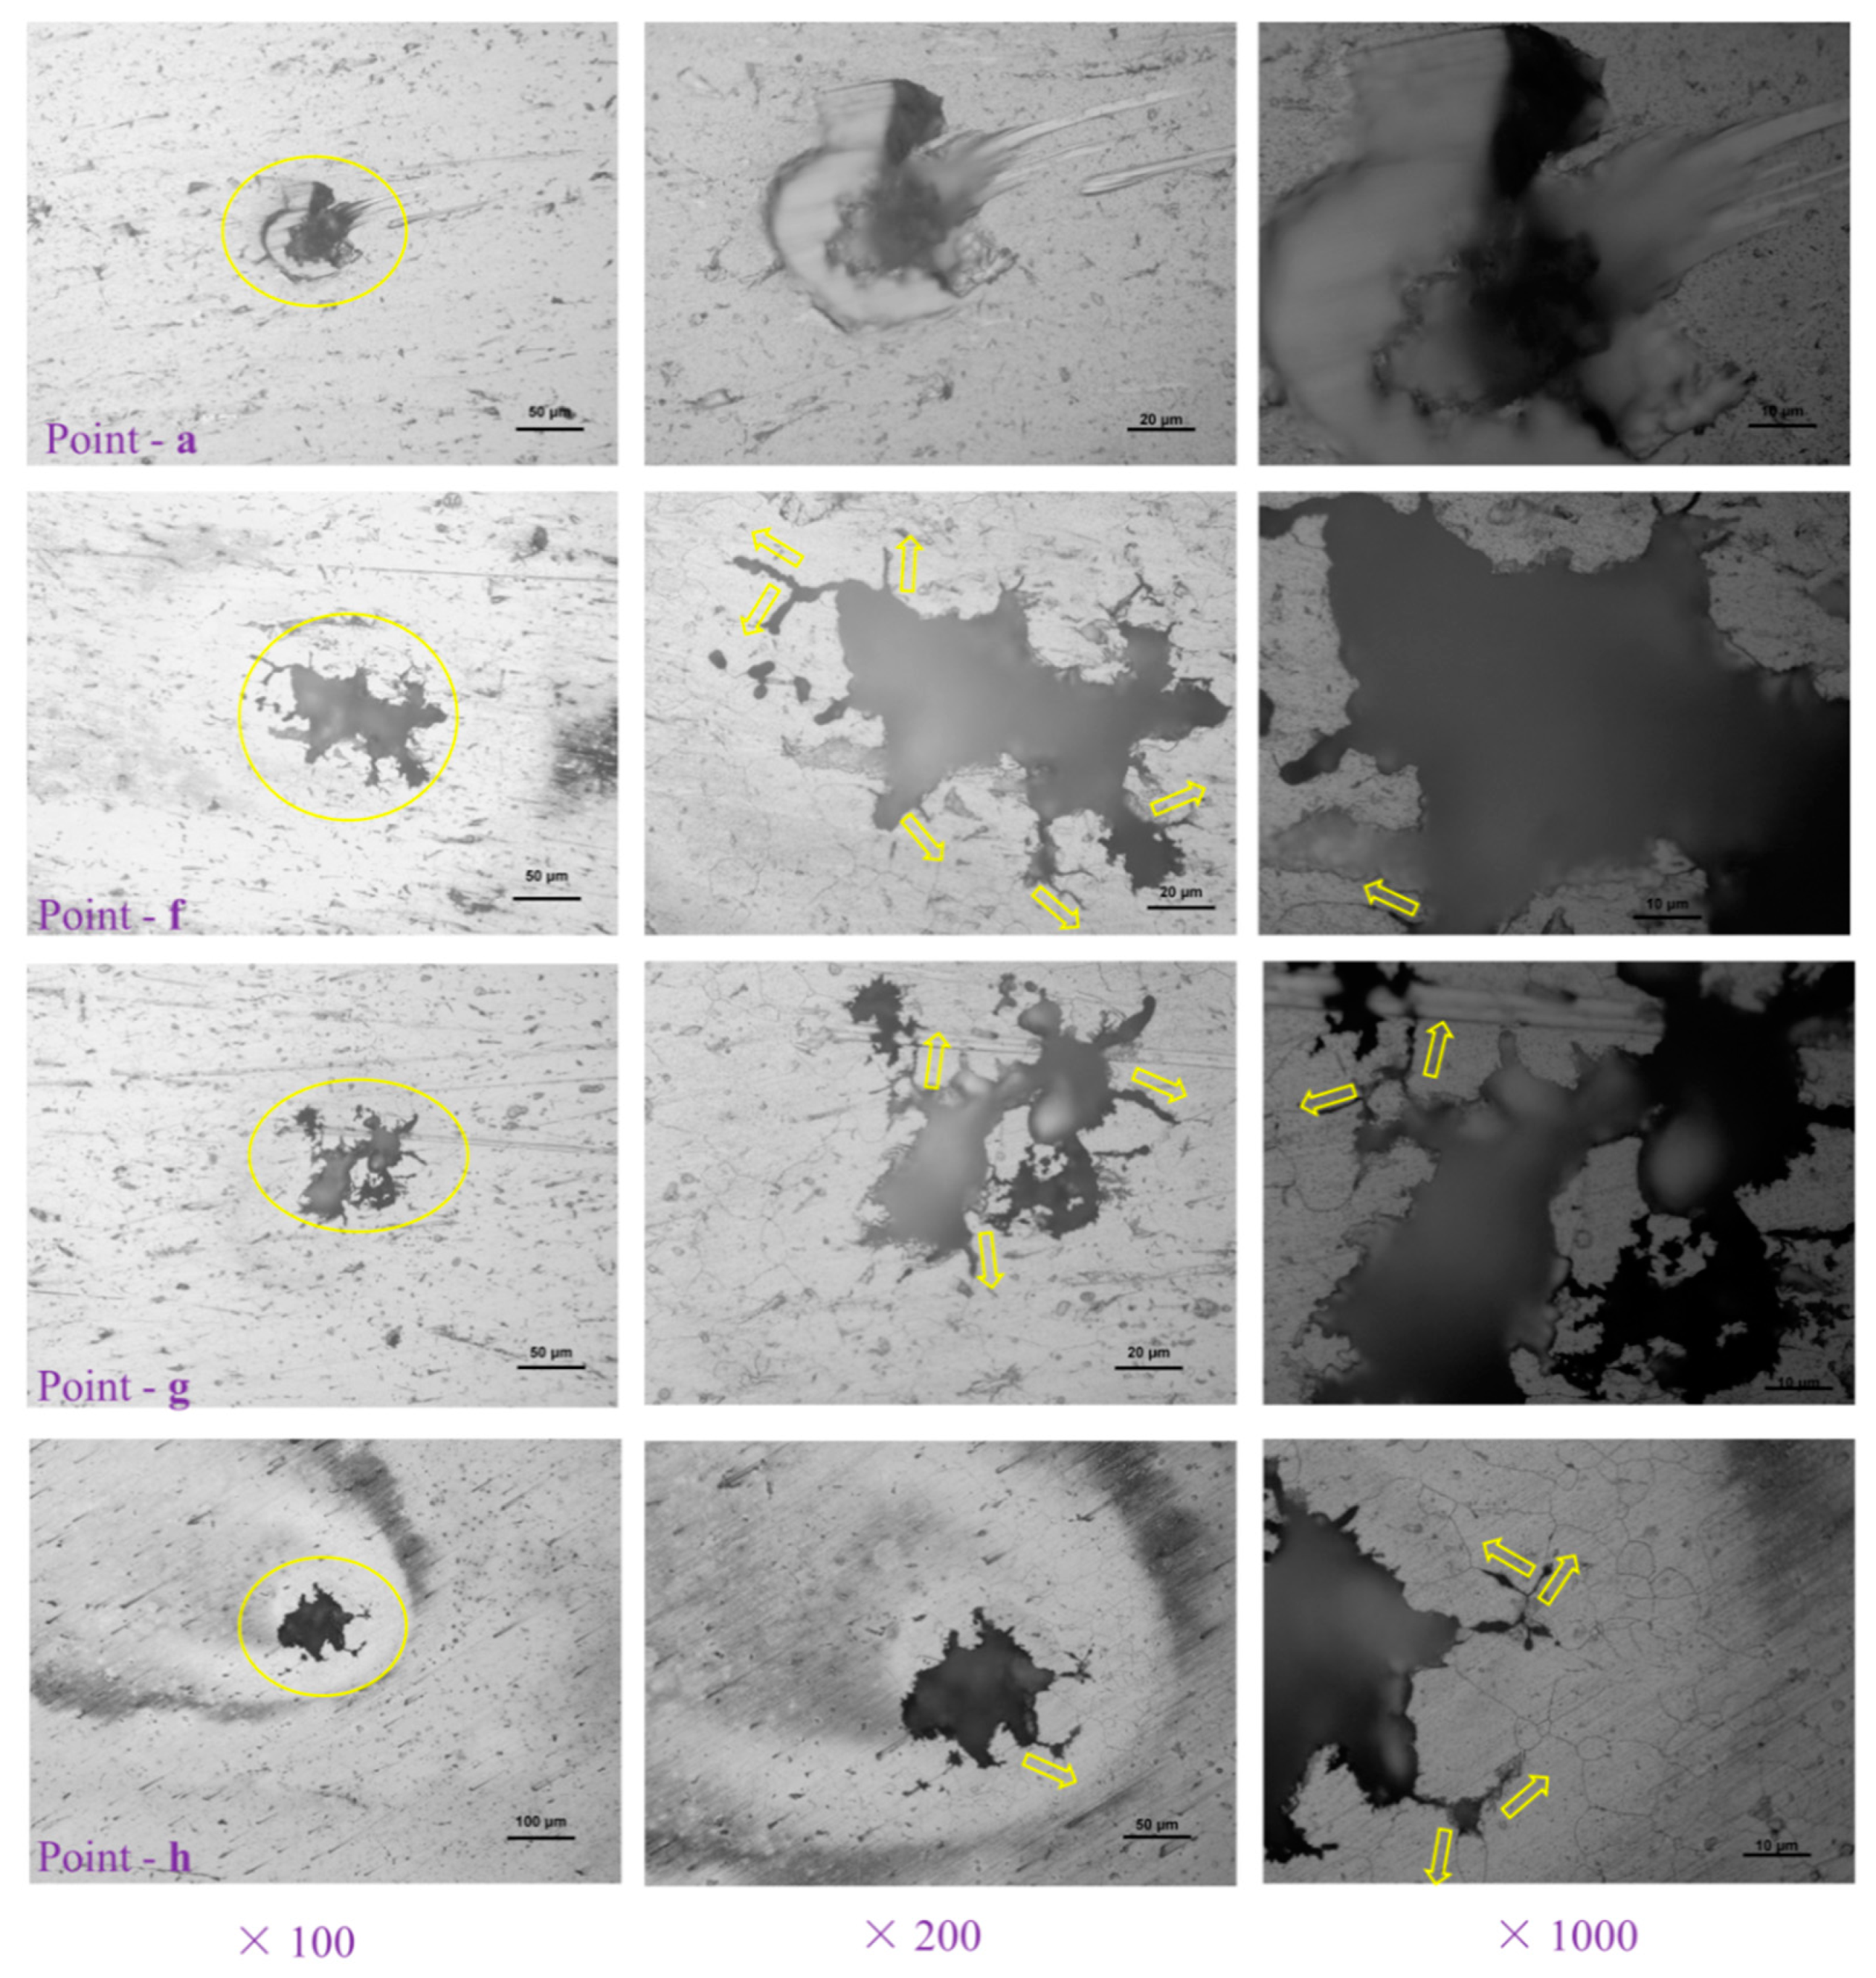
| Sample | Pit No. | The Depth of Pit at Magnitudes of Enlargement | Averaged Depth (μm) | |||
|---|---|---|---|---|---|---|
| ×1000 | ×500 | ×200 | ×100 | |||
| Sample-H | A | 18 | 20 | 17 | 18.3 | |
| B | 6 | 5 | 5 | 5.3 | ||
| C | 3 | 3 | 5 | 3.7 | ||
| D | 4 | 4 | 4 | 4.0 | ||
| E | 17 | 12 | 12 | 13.7 | ||
| F | 69 | 72 | 70 | 70.3 | ||
| G | 39 | 41 | 40 | 40.0 | ||
| H | 79 | 80 | 80 | 79.7 | ||
| I | 9 | 11 | 10 | 10.0 | ||
| J | 9 | 8 | 9 | 8.7 | ||
| K | 10 | 8 | 12 | 10.0 | ||
| L | 12 | 11 | 12 | 11.7 | ||
| M | 6 | 6 | 6 | 6.0 | ||
| Sample-Z | A | 4 | 5 | 5 | 4.7 | |
| B | 8 | 9 | 9 | 8.7 | ||
| C | 13 | 10 | 12 | 11.7 | ||
| D | 9 | 8 | 7 | 8.0 | ||
| E | 6 | 6 | 6 | 6.0 | ||
| F | 4 | 4 | 5 | 4.3 | ||
| G | 4 | 4 | 4 | 4.0 | ||
| H | 31 | 30 | 30 | 30.3 | ||
| I | 12 | 13 | 12 | 12.3 | ||
| J | 12 | 11 | 11 | 11.3 | ||
| K | 2 | 2 | 2 | 2.0 | ||
| L | 6 | 5 | 7 | 6.0 | ||
© 2019 by the authors. Licensee MDPI, Basel, Switzerland. This article is an open access article distributed under the terms and conditions of the Creative Commons Attribution (CC BY) license (http://creativecommons.org/licenses/by/4.0/).
Share and Cite
Guan, Q.; Sun, J.; Wang, W.Y.; Gao, J.; Zou, C.; Wang, J.; Tang, B.; Kou, H.; Wang, H.; Hou, J.; et al. Pitting Corrosion of Natural Aged Al–Mg–Si Extrusion Profile. Materials 2019, 12, 1081. https://doi.org/10.3390/ma12071081
Guan Q, Sun J, Wang WY, Gao J, Zou C, Wang J, Tang B, Kou H, Wang H, Hou J, et al. Pitting Corrosion of Natural Aged Al–Mg–Si Extrusion Profile. Materials. 2019; 12(7):1081. https://doi.org/10.3390/ma12071081
Chicago/Turabian StyleGuan, Quanmei, Jing Sun, William Yi Wang, Junfeng Gao, Chengxiong Zou, Jun Wang, Bin Tang, Hongchao Kou, Haisheng Wang, Jianying Hou, and et al. 2019. "Pitting Corrosion of Natural Aged Al–Mg–Si Extrusion Profile" Materials 12, no. 7: 1081. https://doi.org/10.3390/ma12071081
APA StyleGuan, Q., Sun, J., Wang, W. Y., Gao, J., Zou, C., Wang, J., Tang, B., Kou, H., Wang, H., Hou, J., Gao, J., Ma, J., & Li, J. (2019). Pitting Corrosion of Natural Aged Al–Mg–Si Extrusion Profile. Materials, 12(7), 1081. https://doi.org/10.3390/ma12071081