Hydrothermal Synthesis of Rare-Earth Modified Titania: Influence on Phase Composition, Optical Properties, and Photocatalytic Activity


 , ,
, , 
Abstract
1. Introduction
2. Materials and Methods
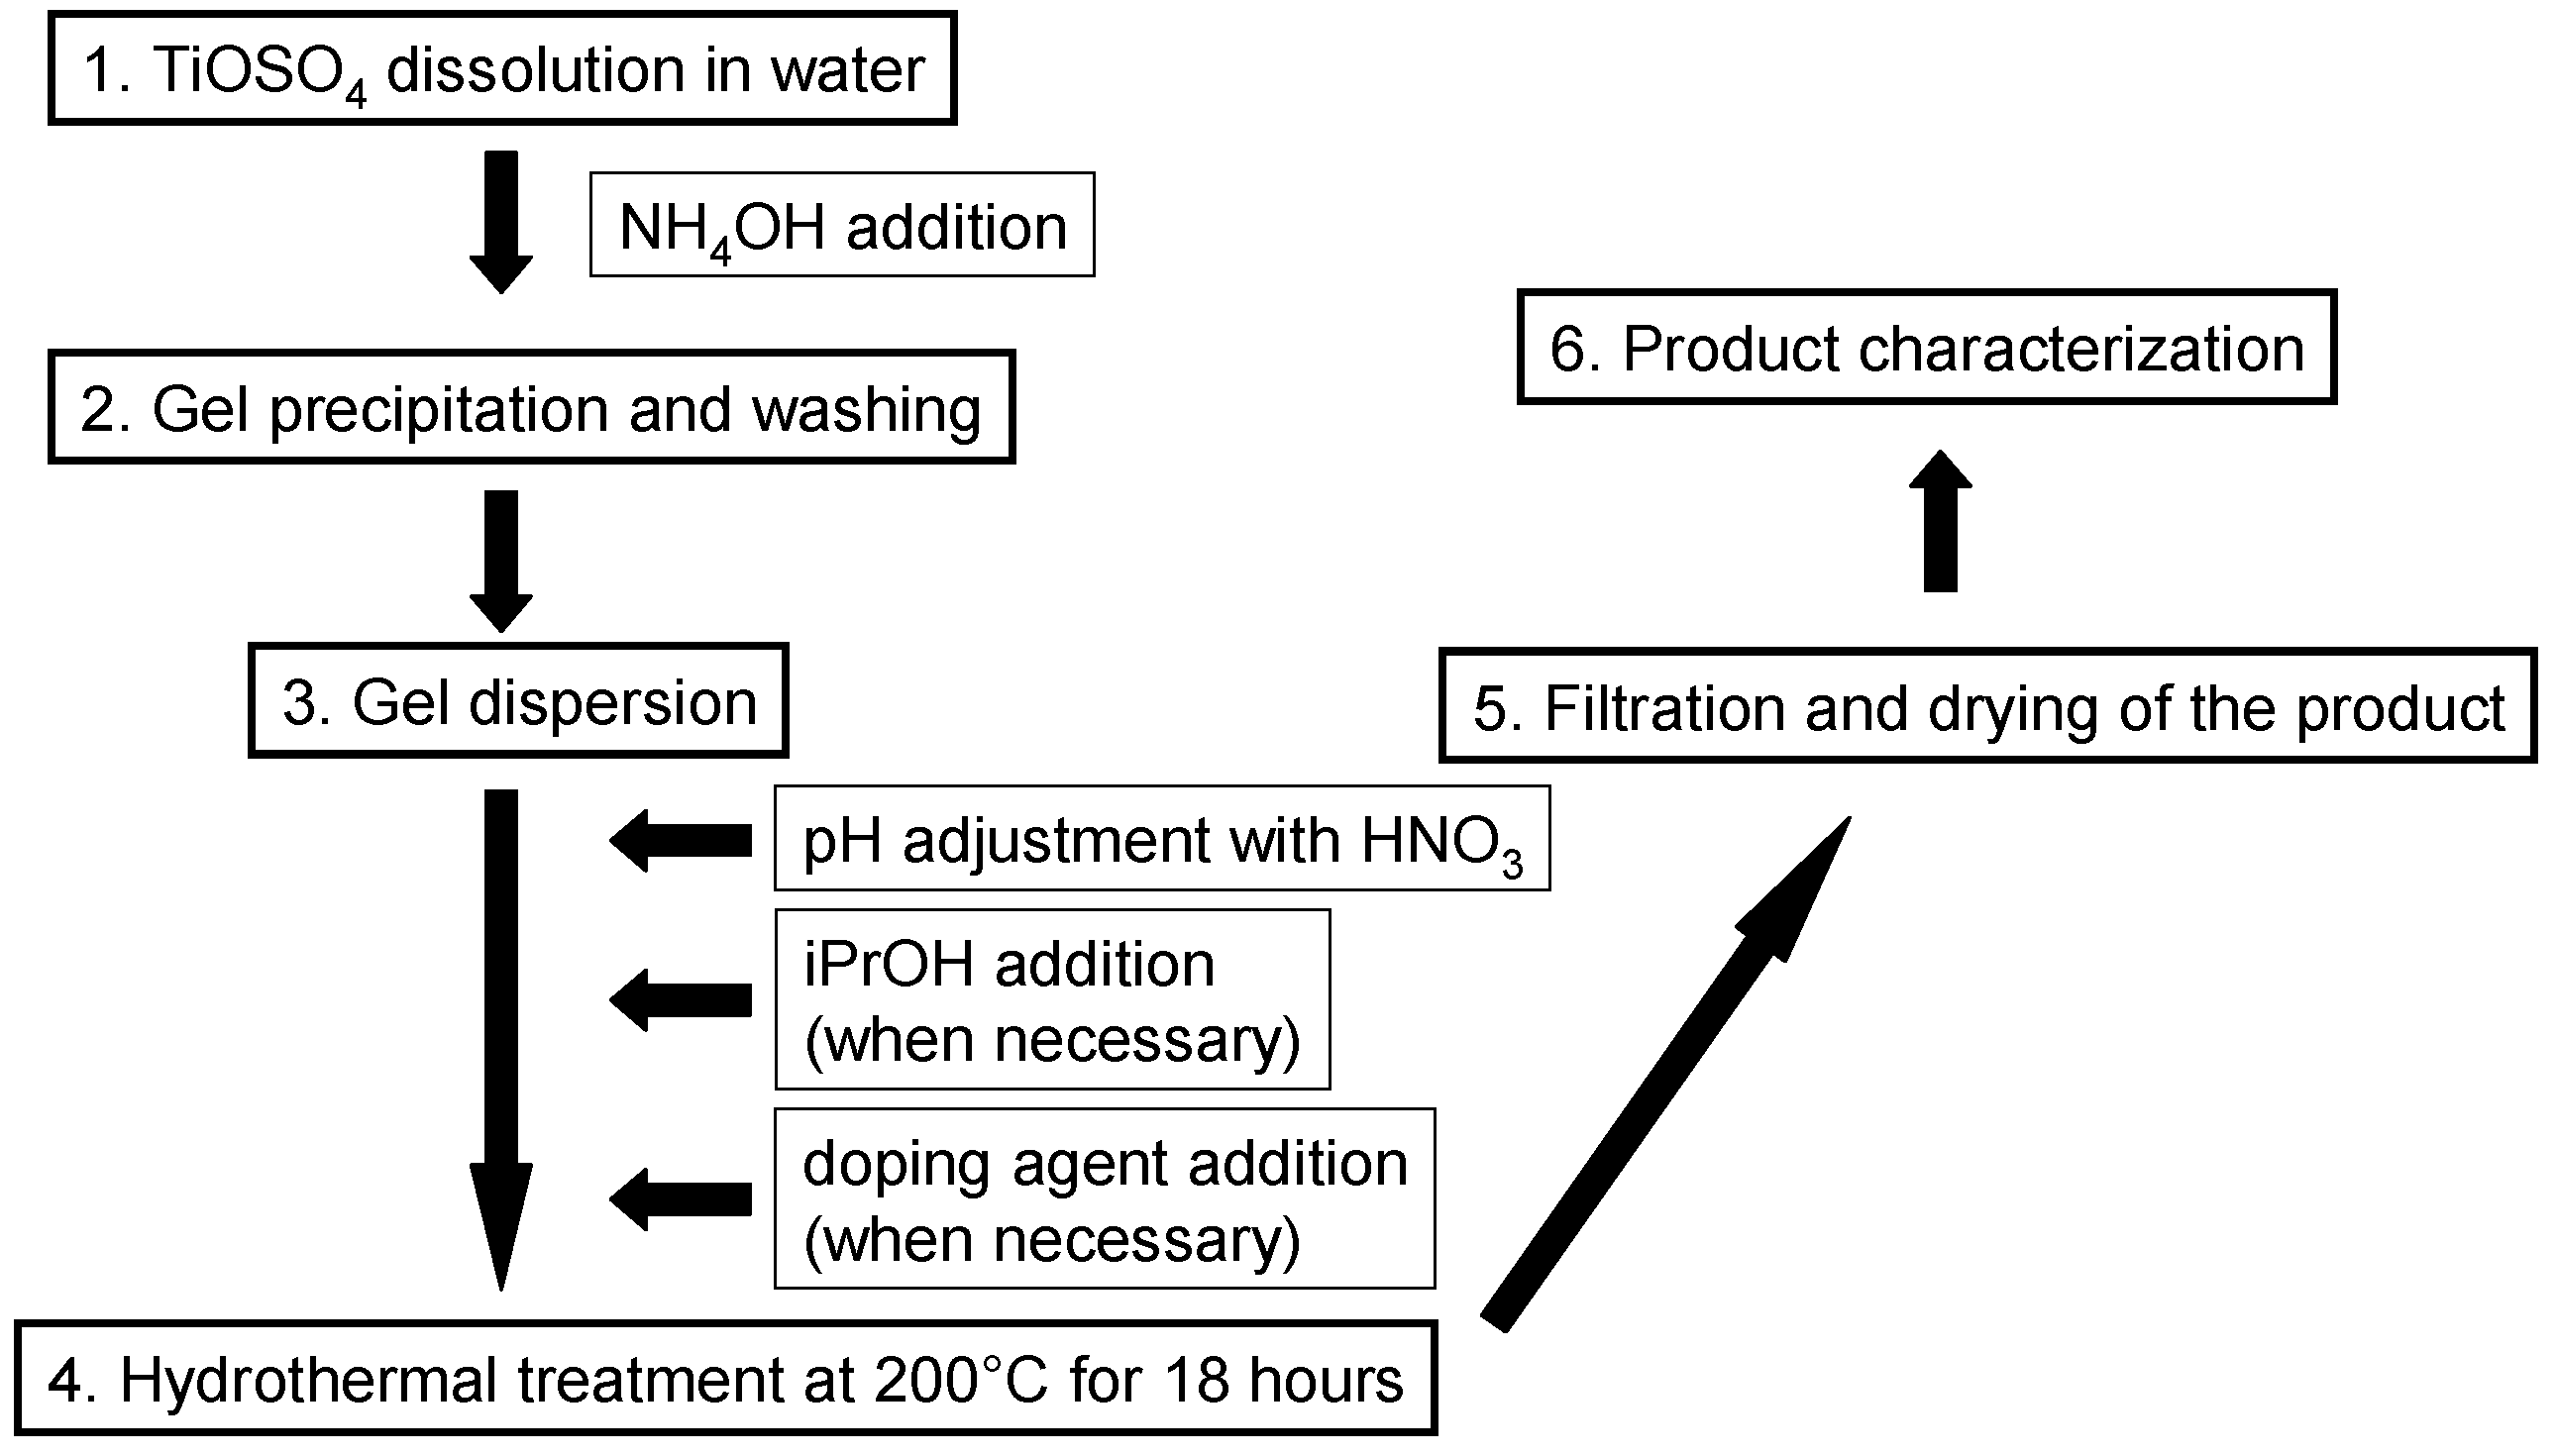
2.1. Sample Preparation
2.2. Sample Analysis
2.3. Photocatalytic Activity Measurement
2.3.1. Photocatalytic Activity of IPA Degradation
2.3.2. NOx Removal Measurement
2.3.3. Liquid-Solid Photocatalytic Removal of Methylene Blue (MB)
3. Results and Discussion
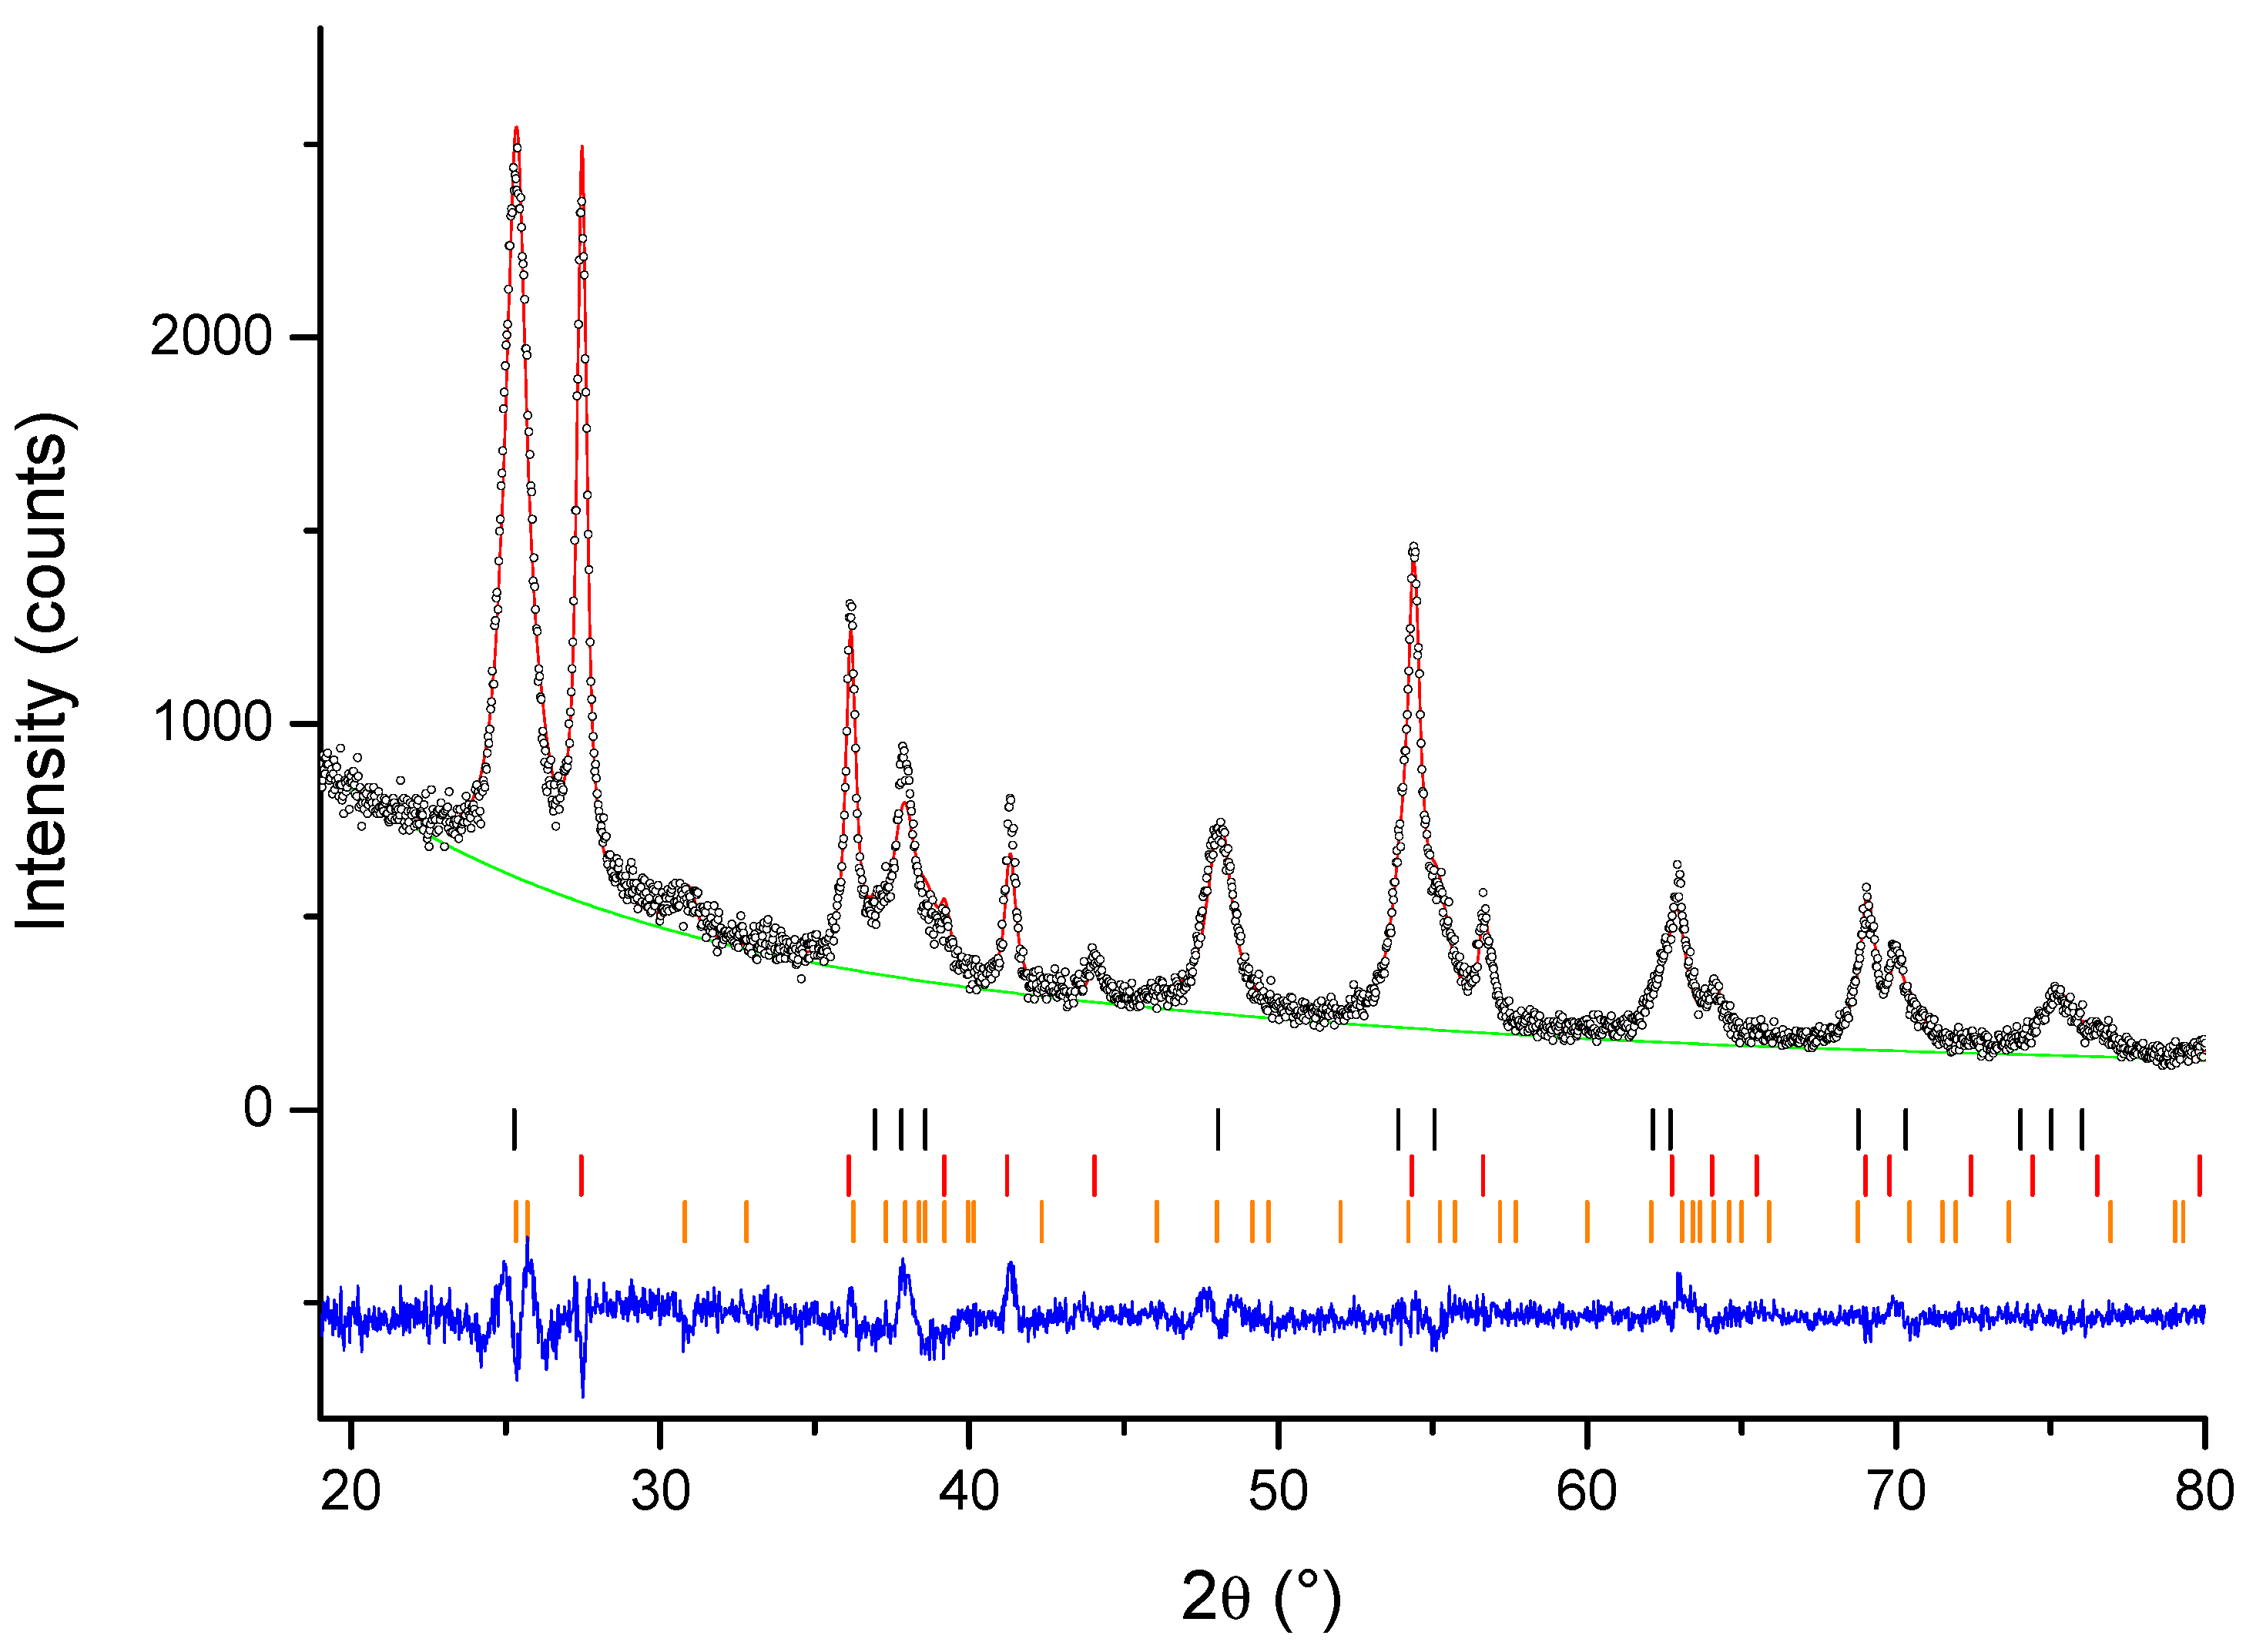
3.1. X-ray Powder Diffraction
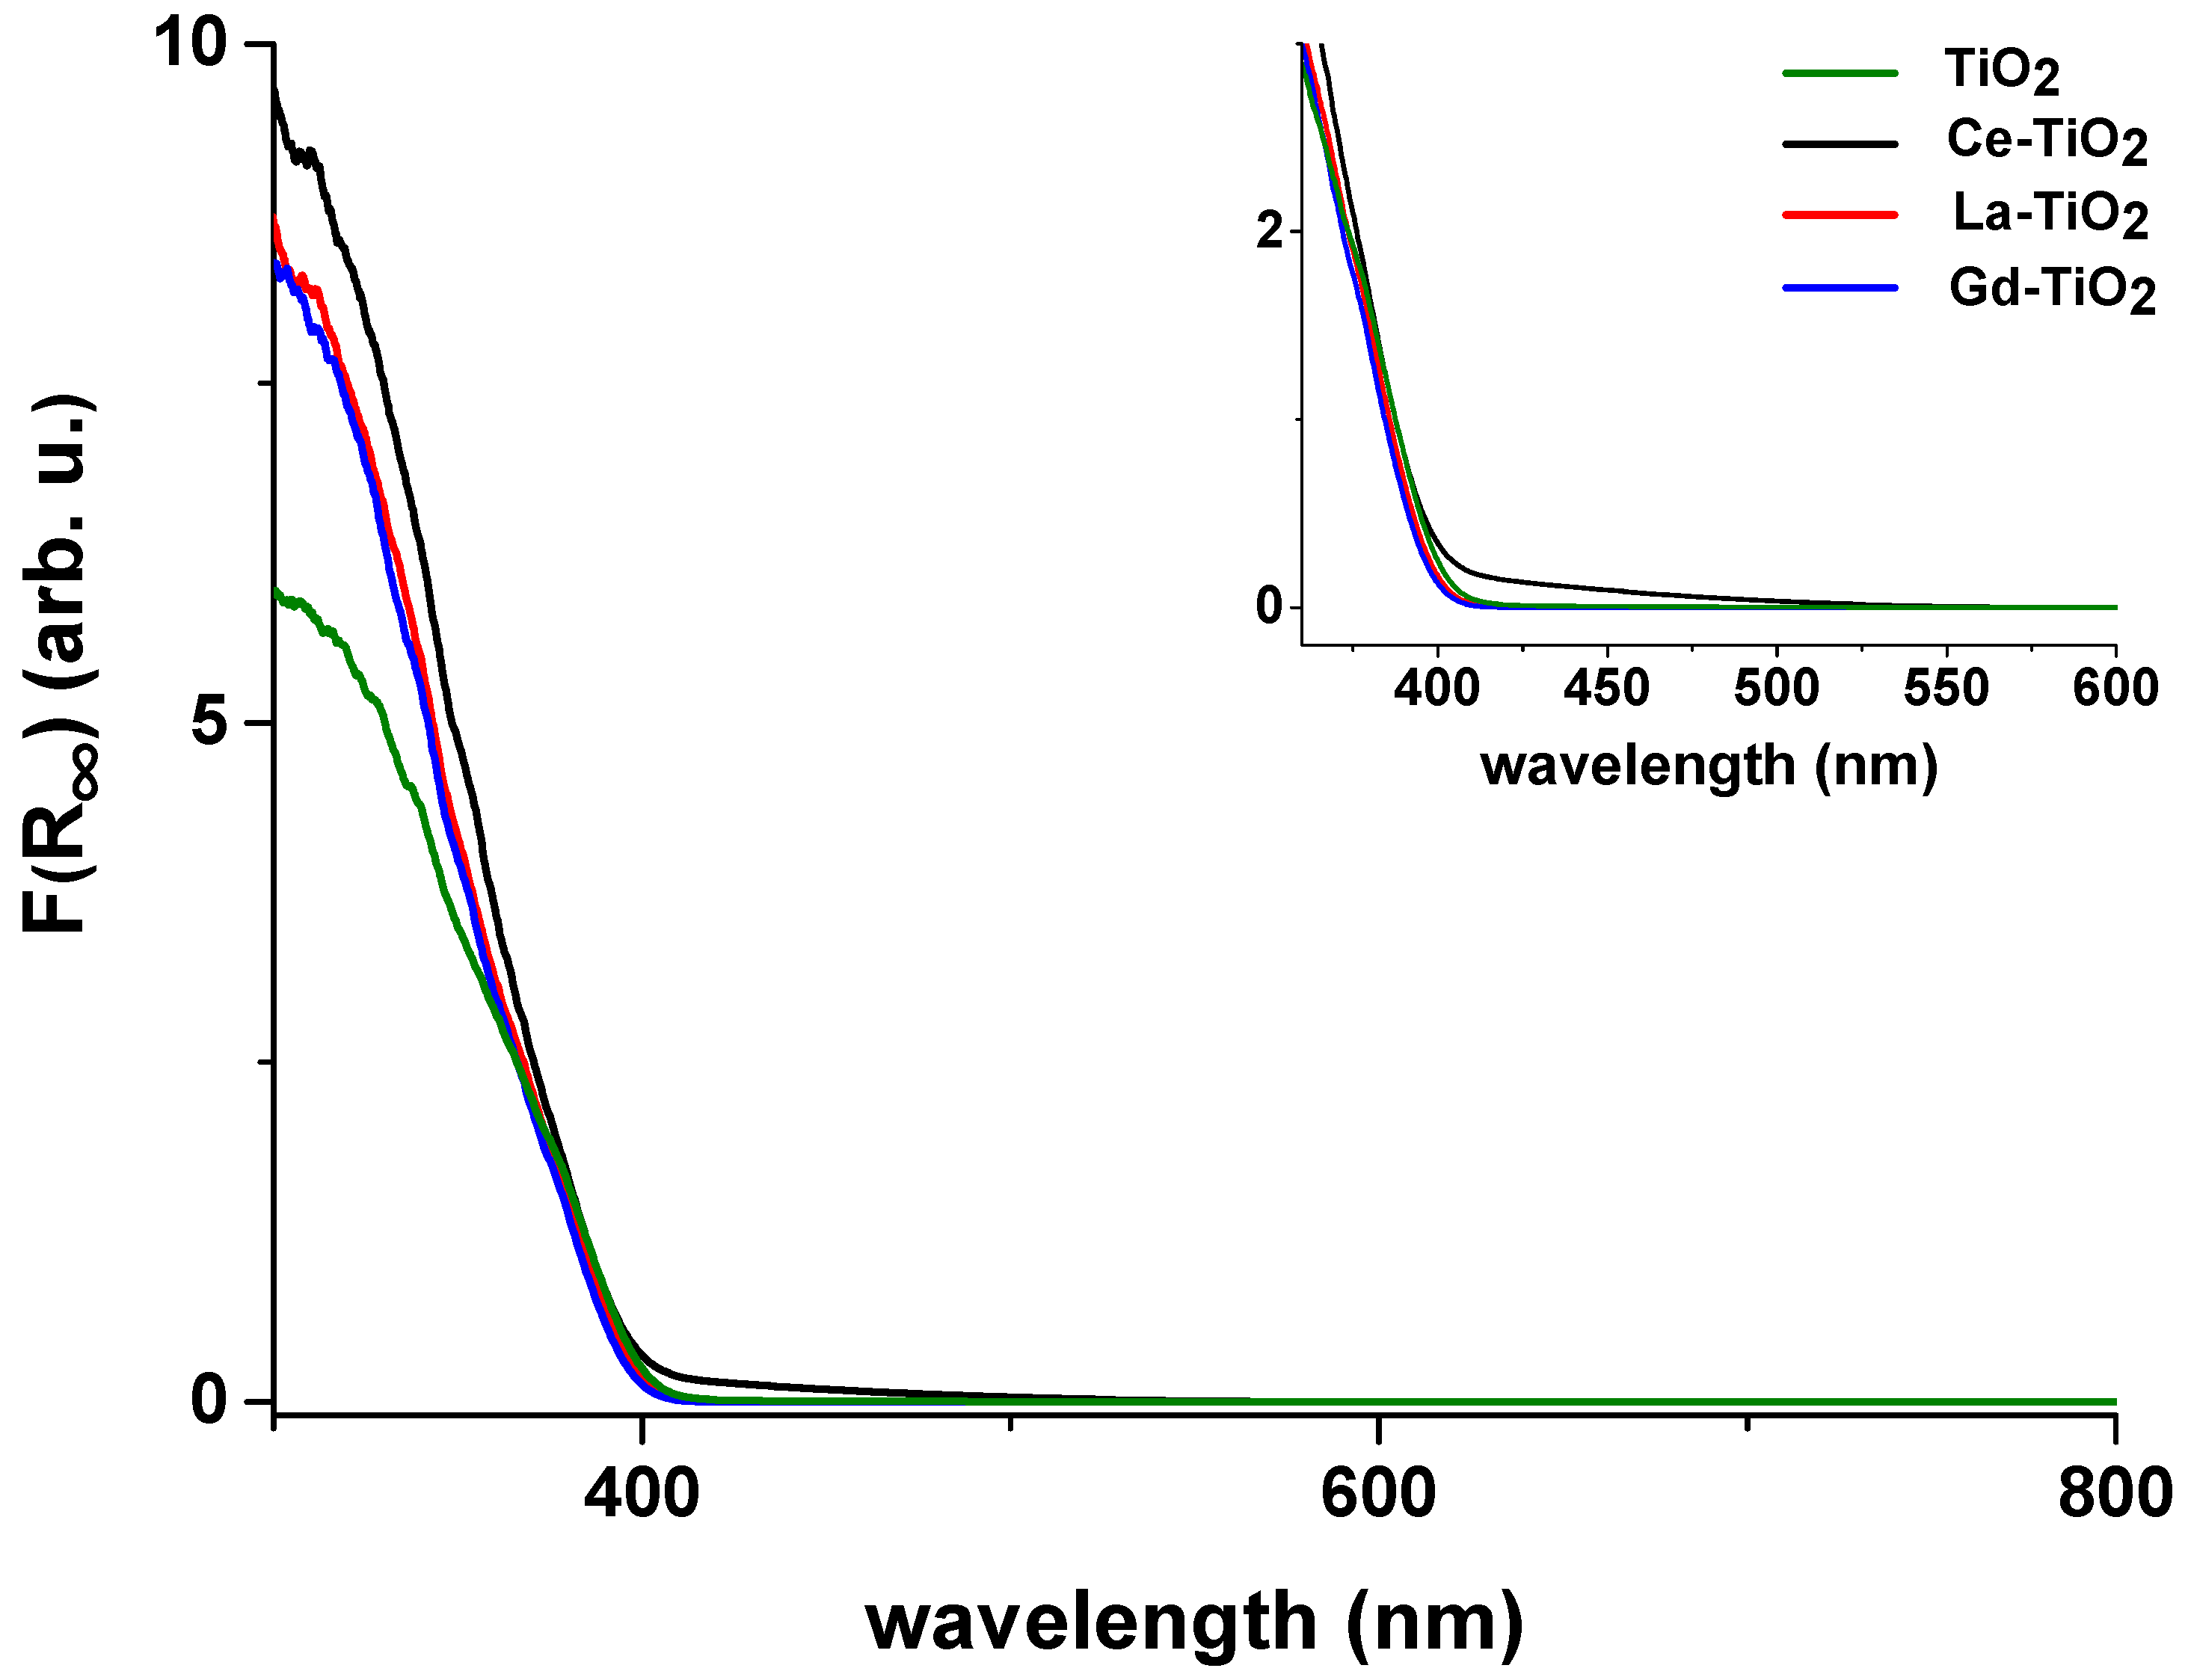
3.2. UV-Vis Spectroscopy
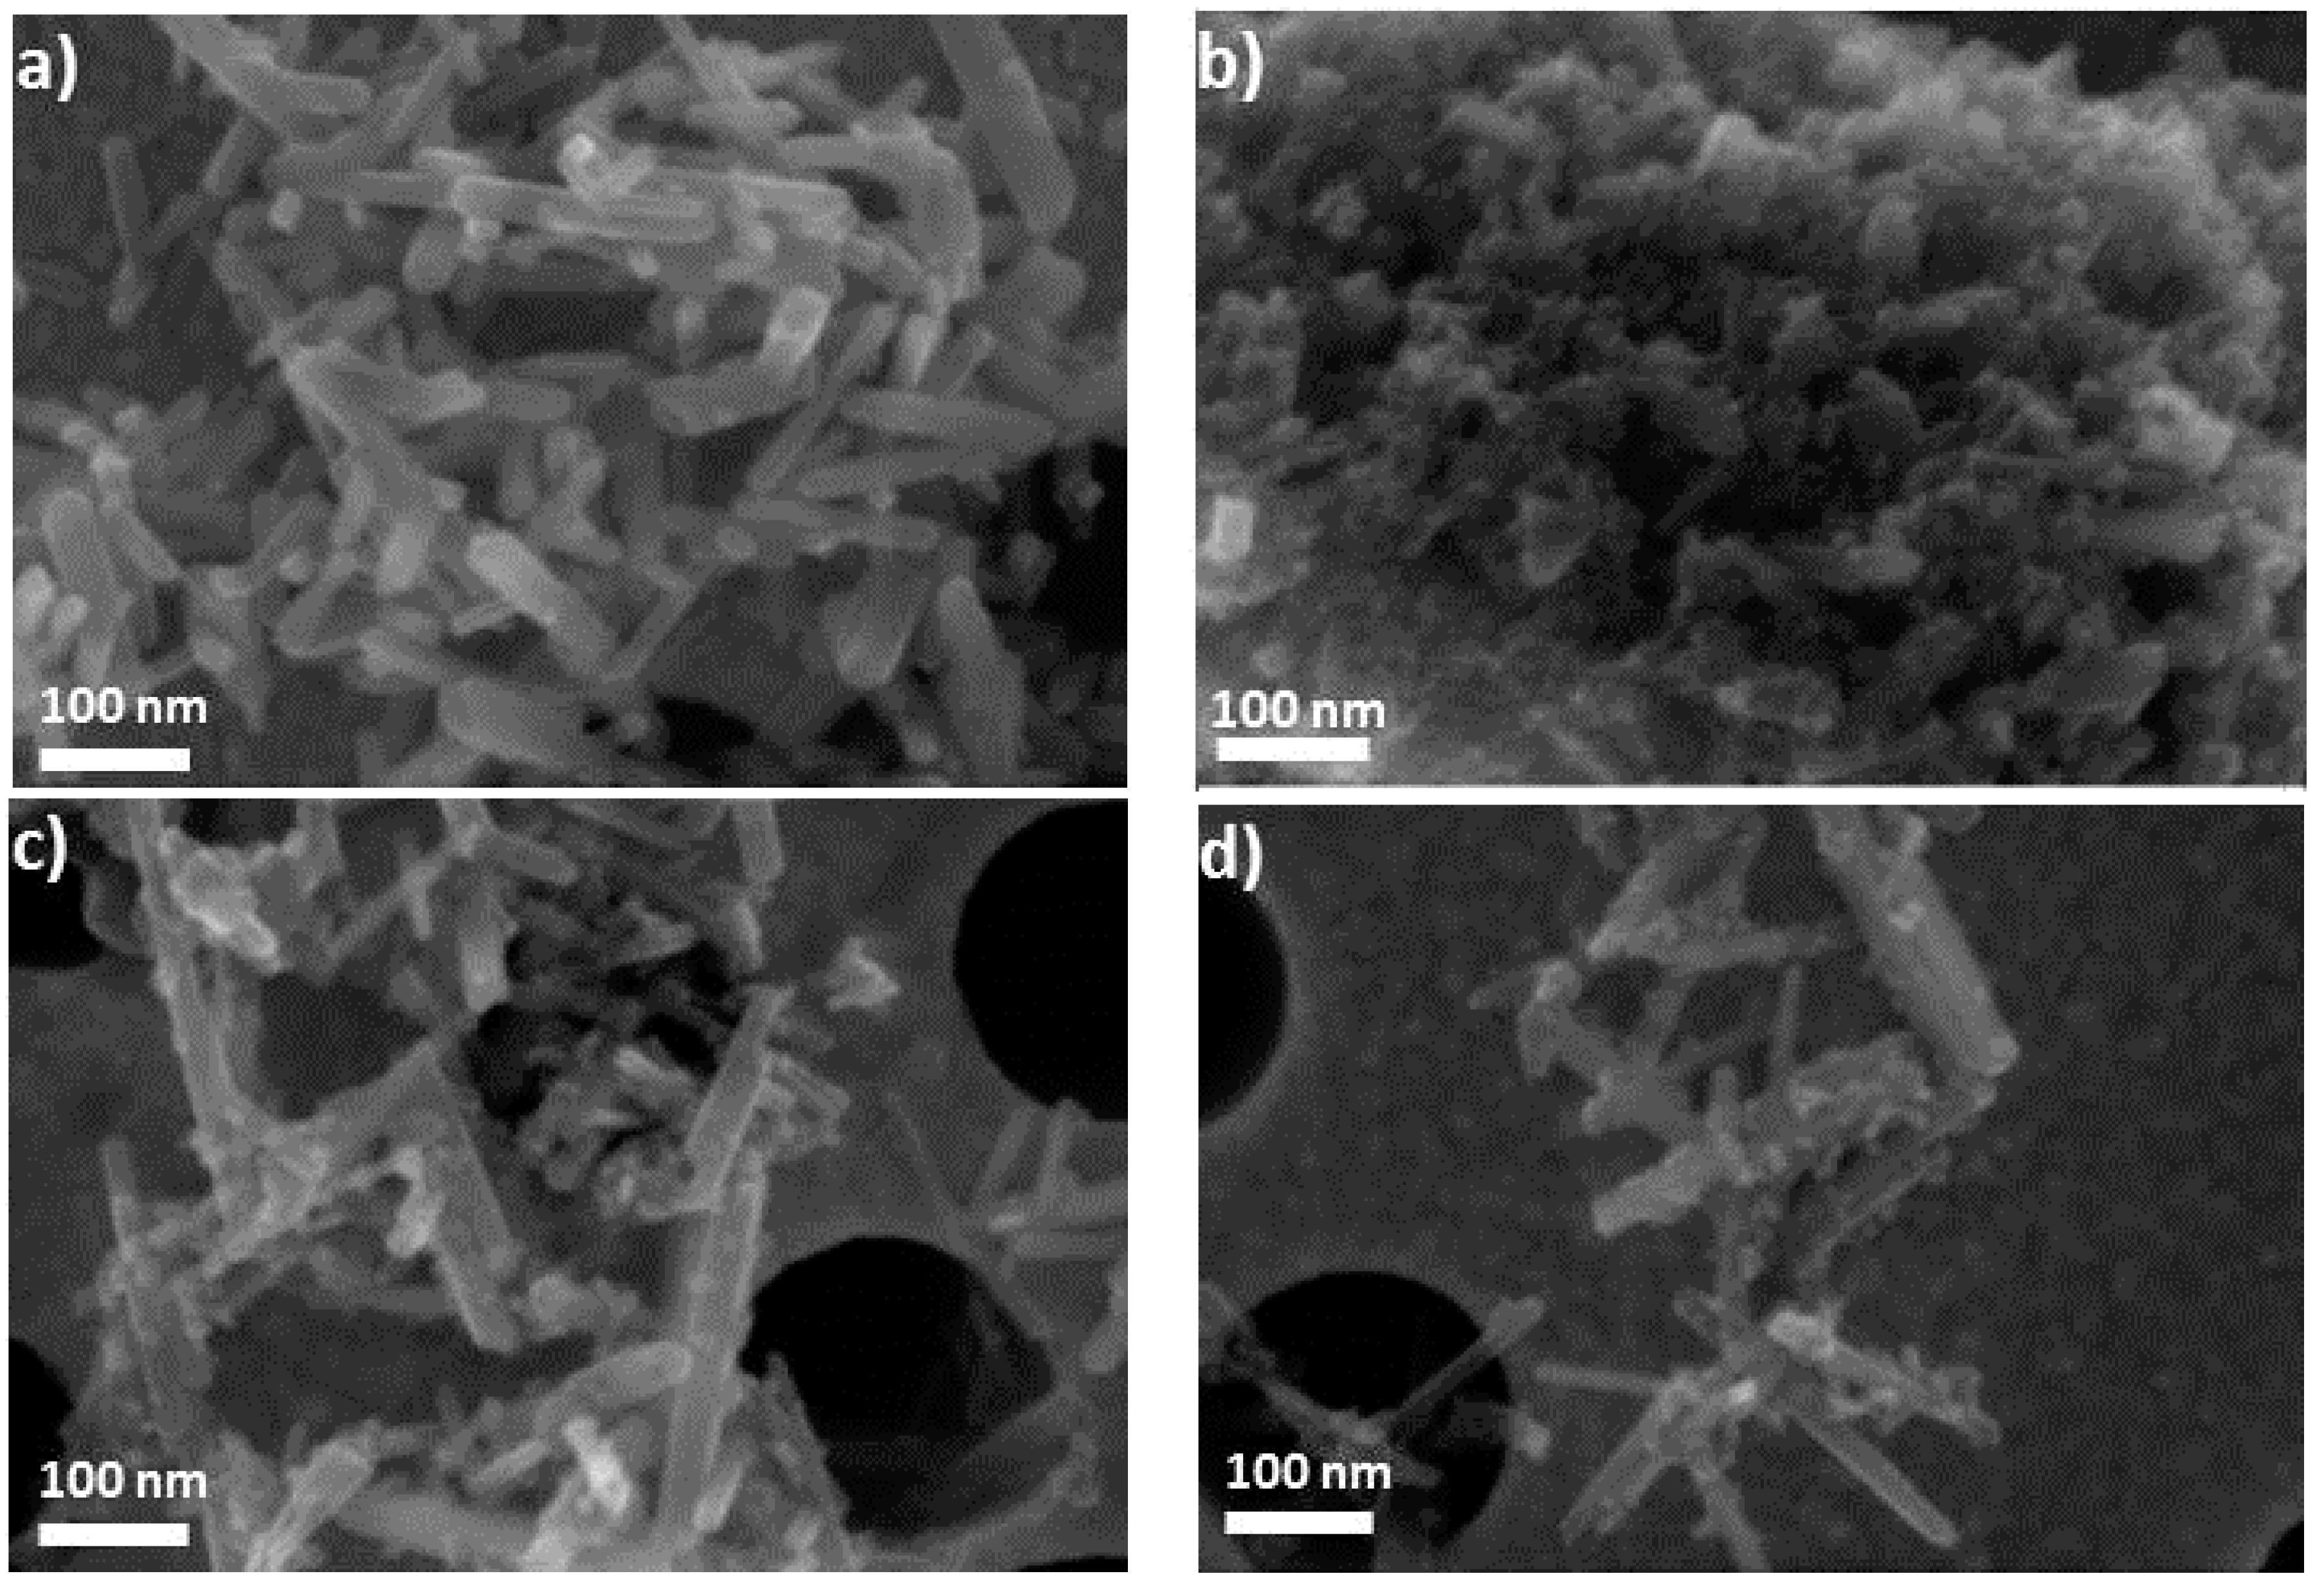
3.3. FE-SEM
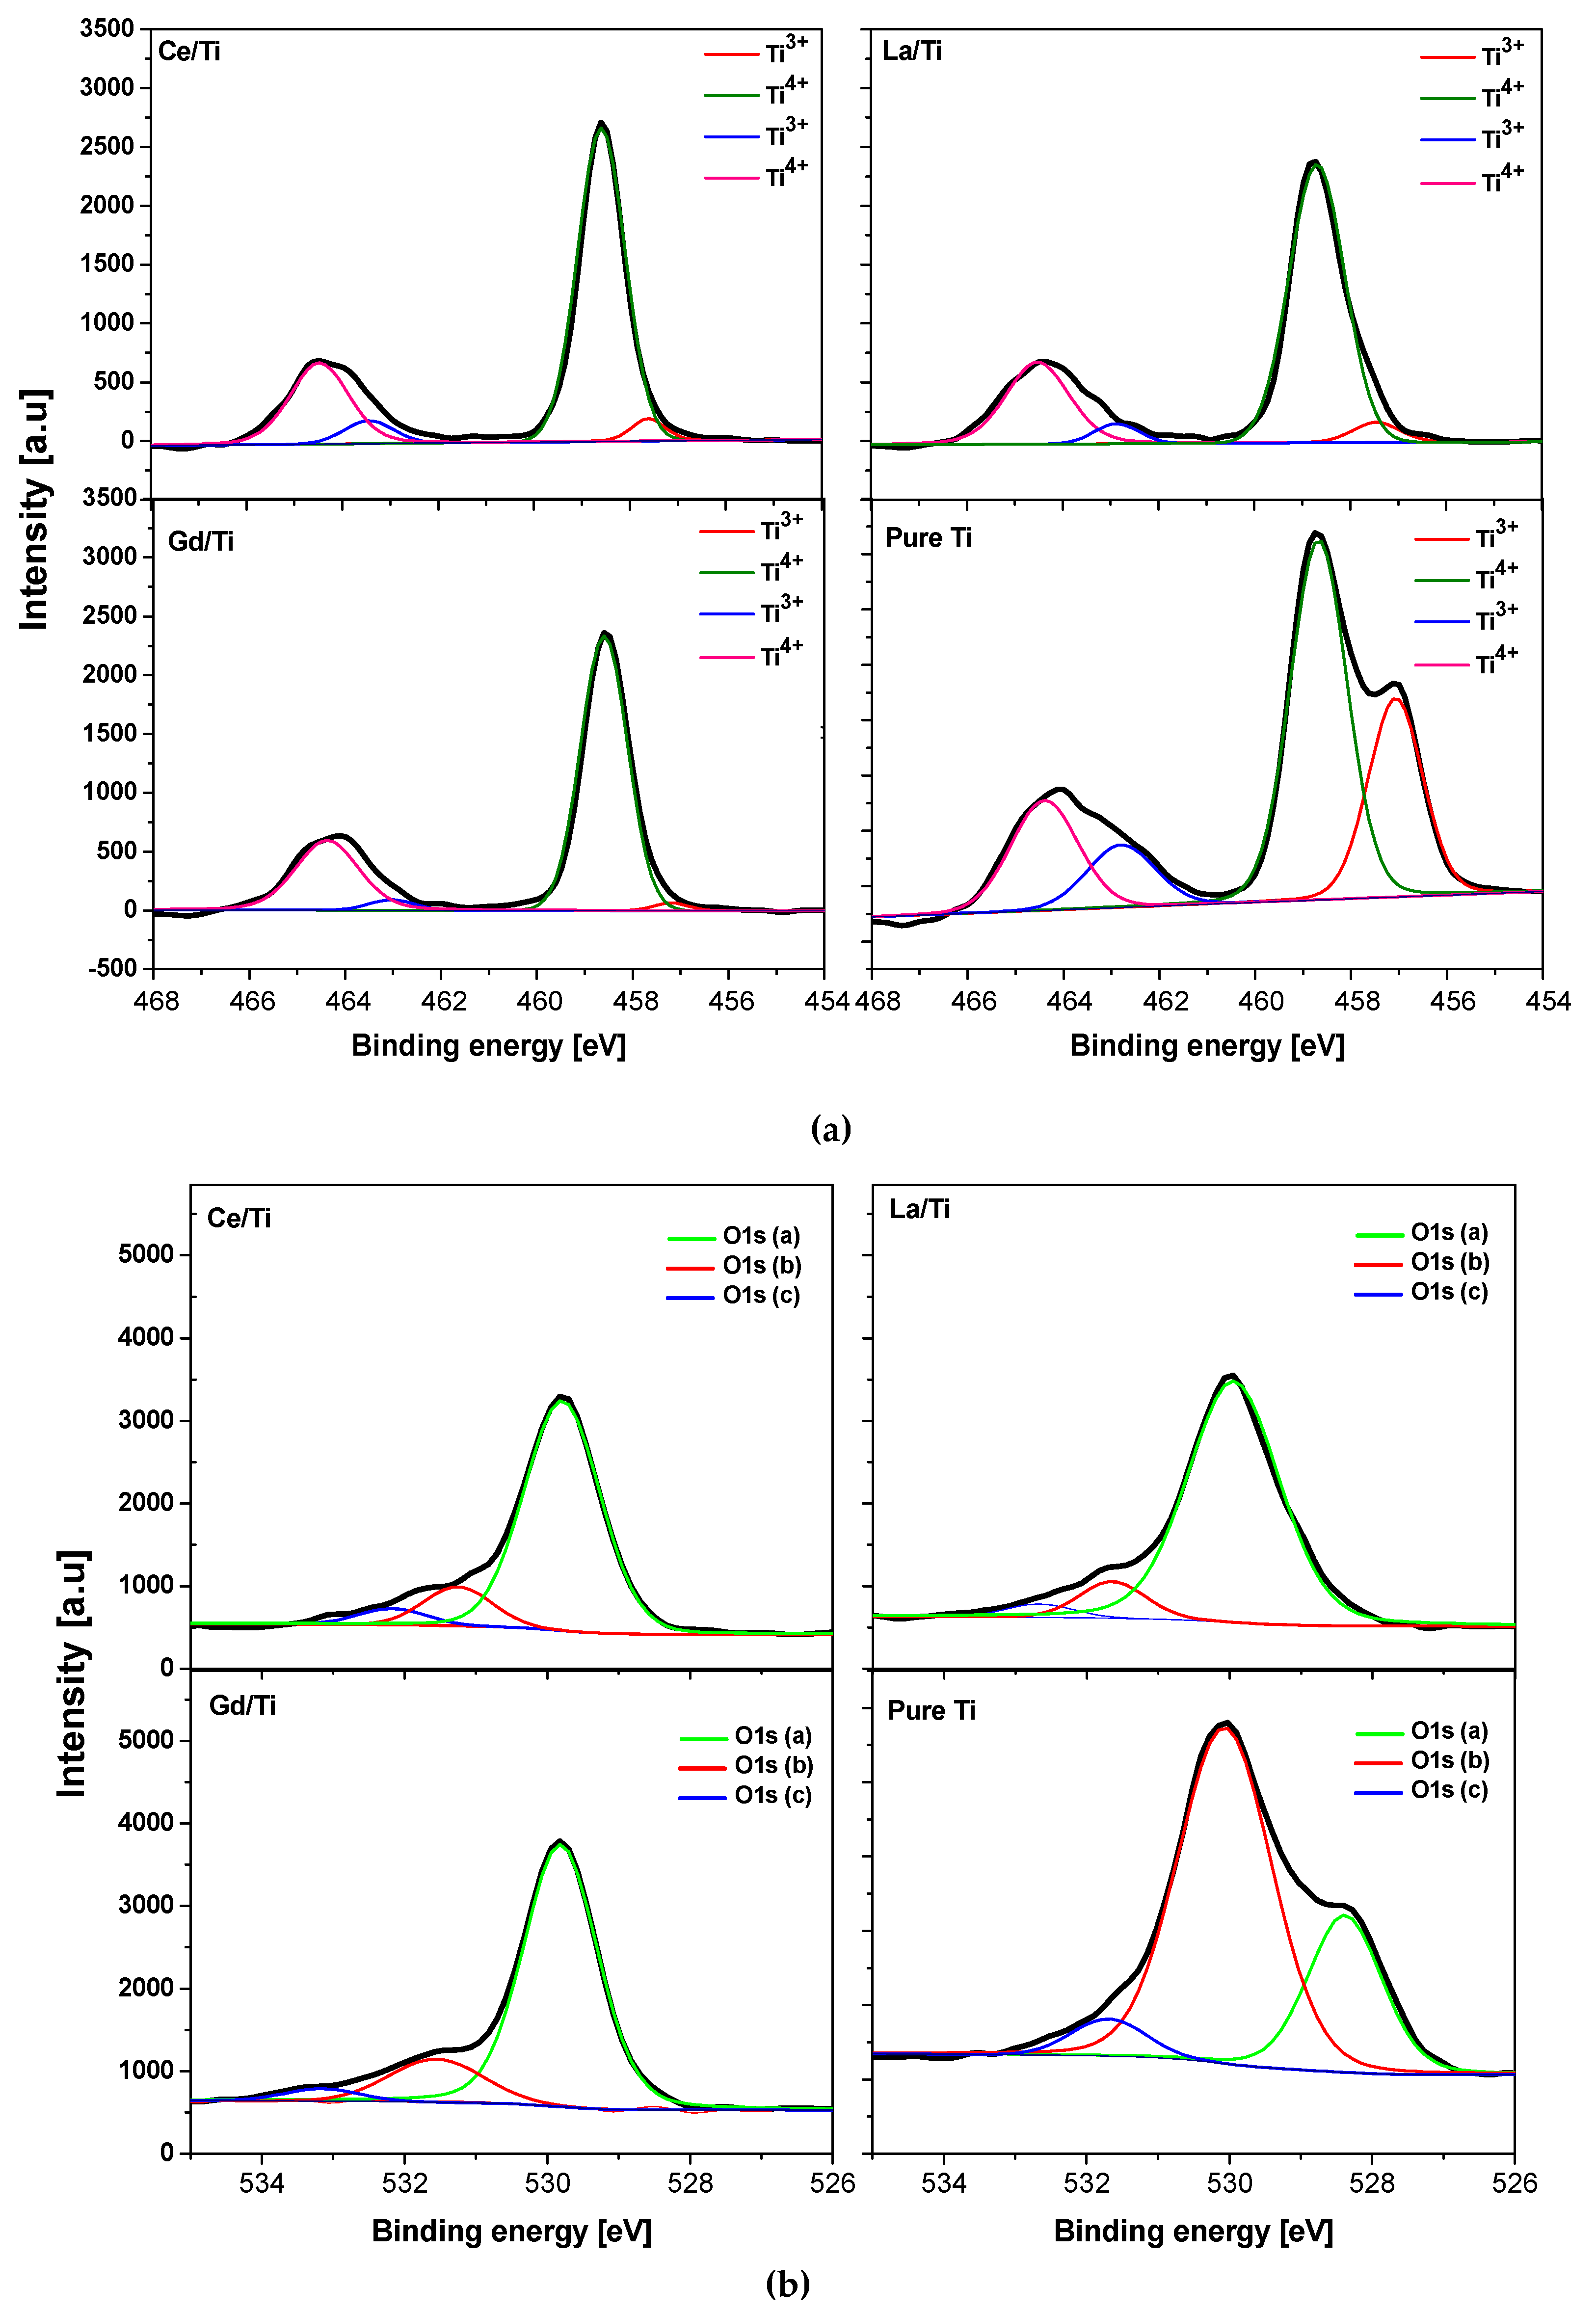
3.4. XPS Analysis
3.5. Photocatalytic Activity
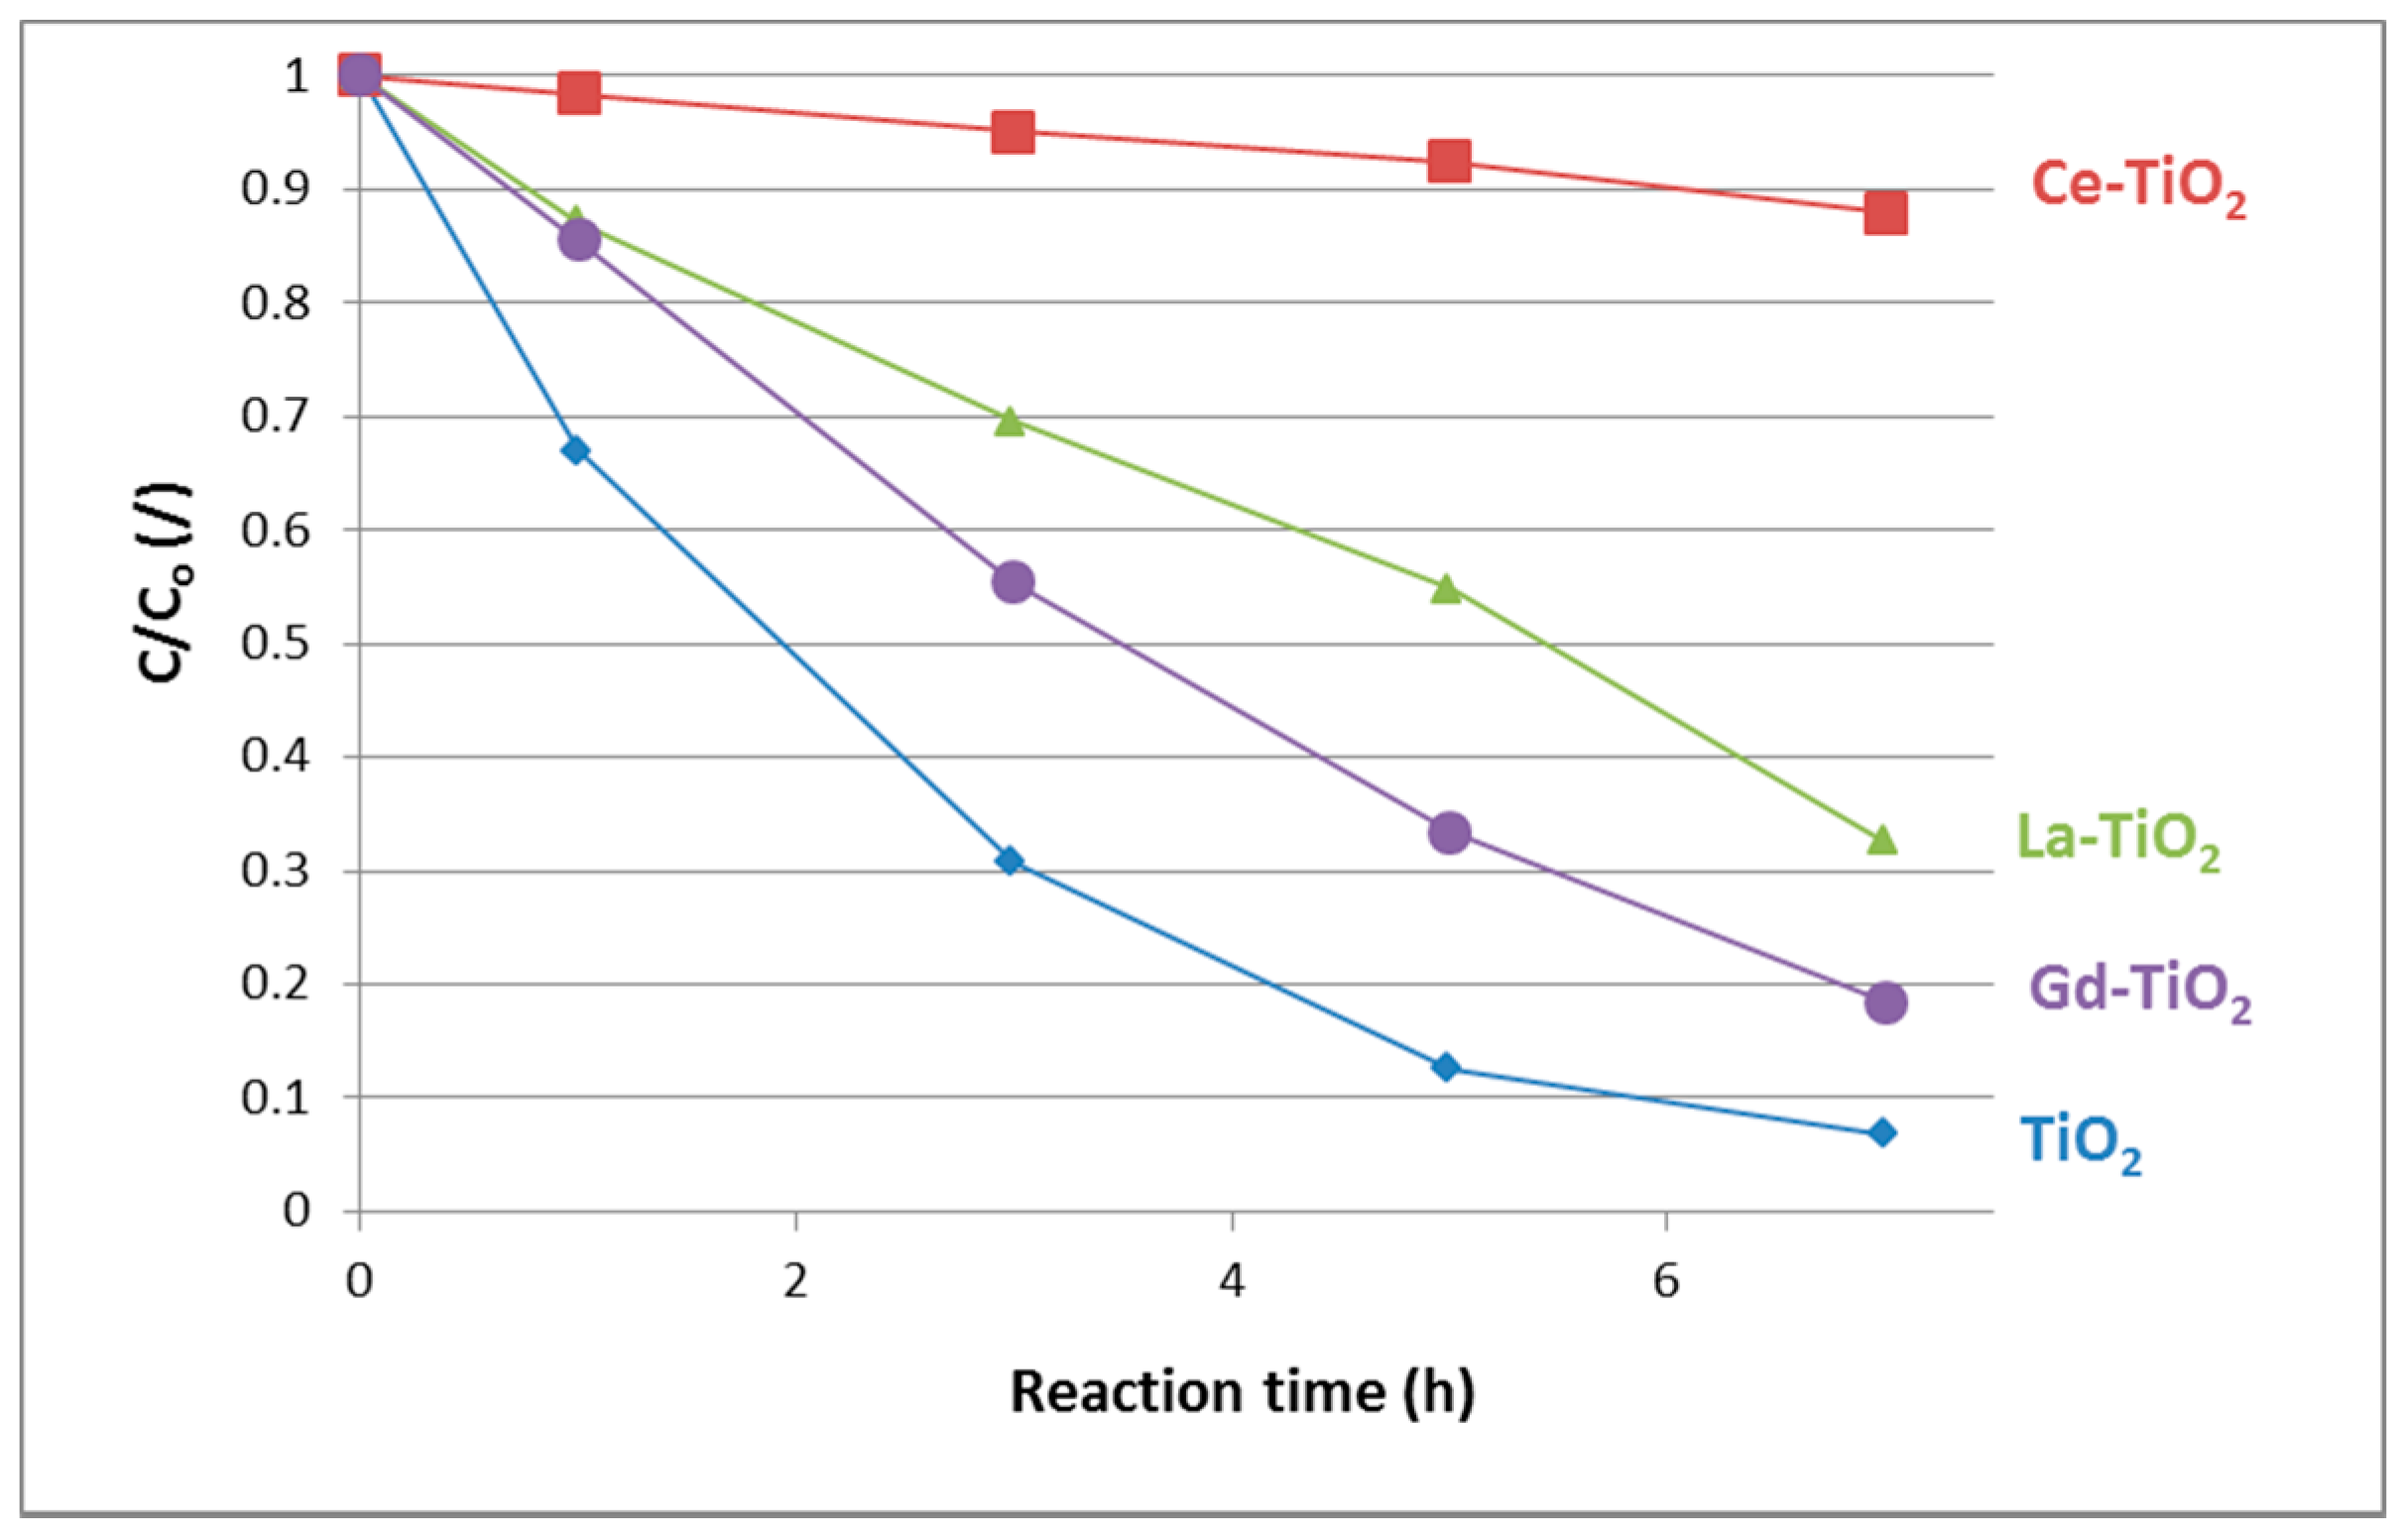
3.5.1. Liquid-Solid
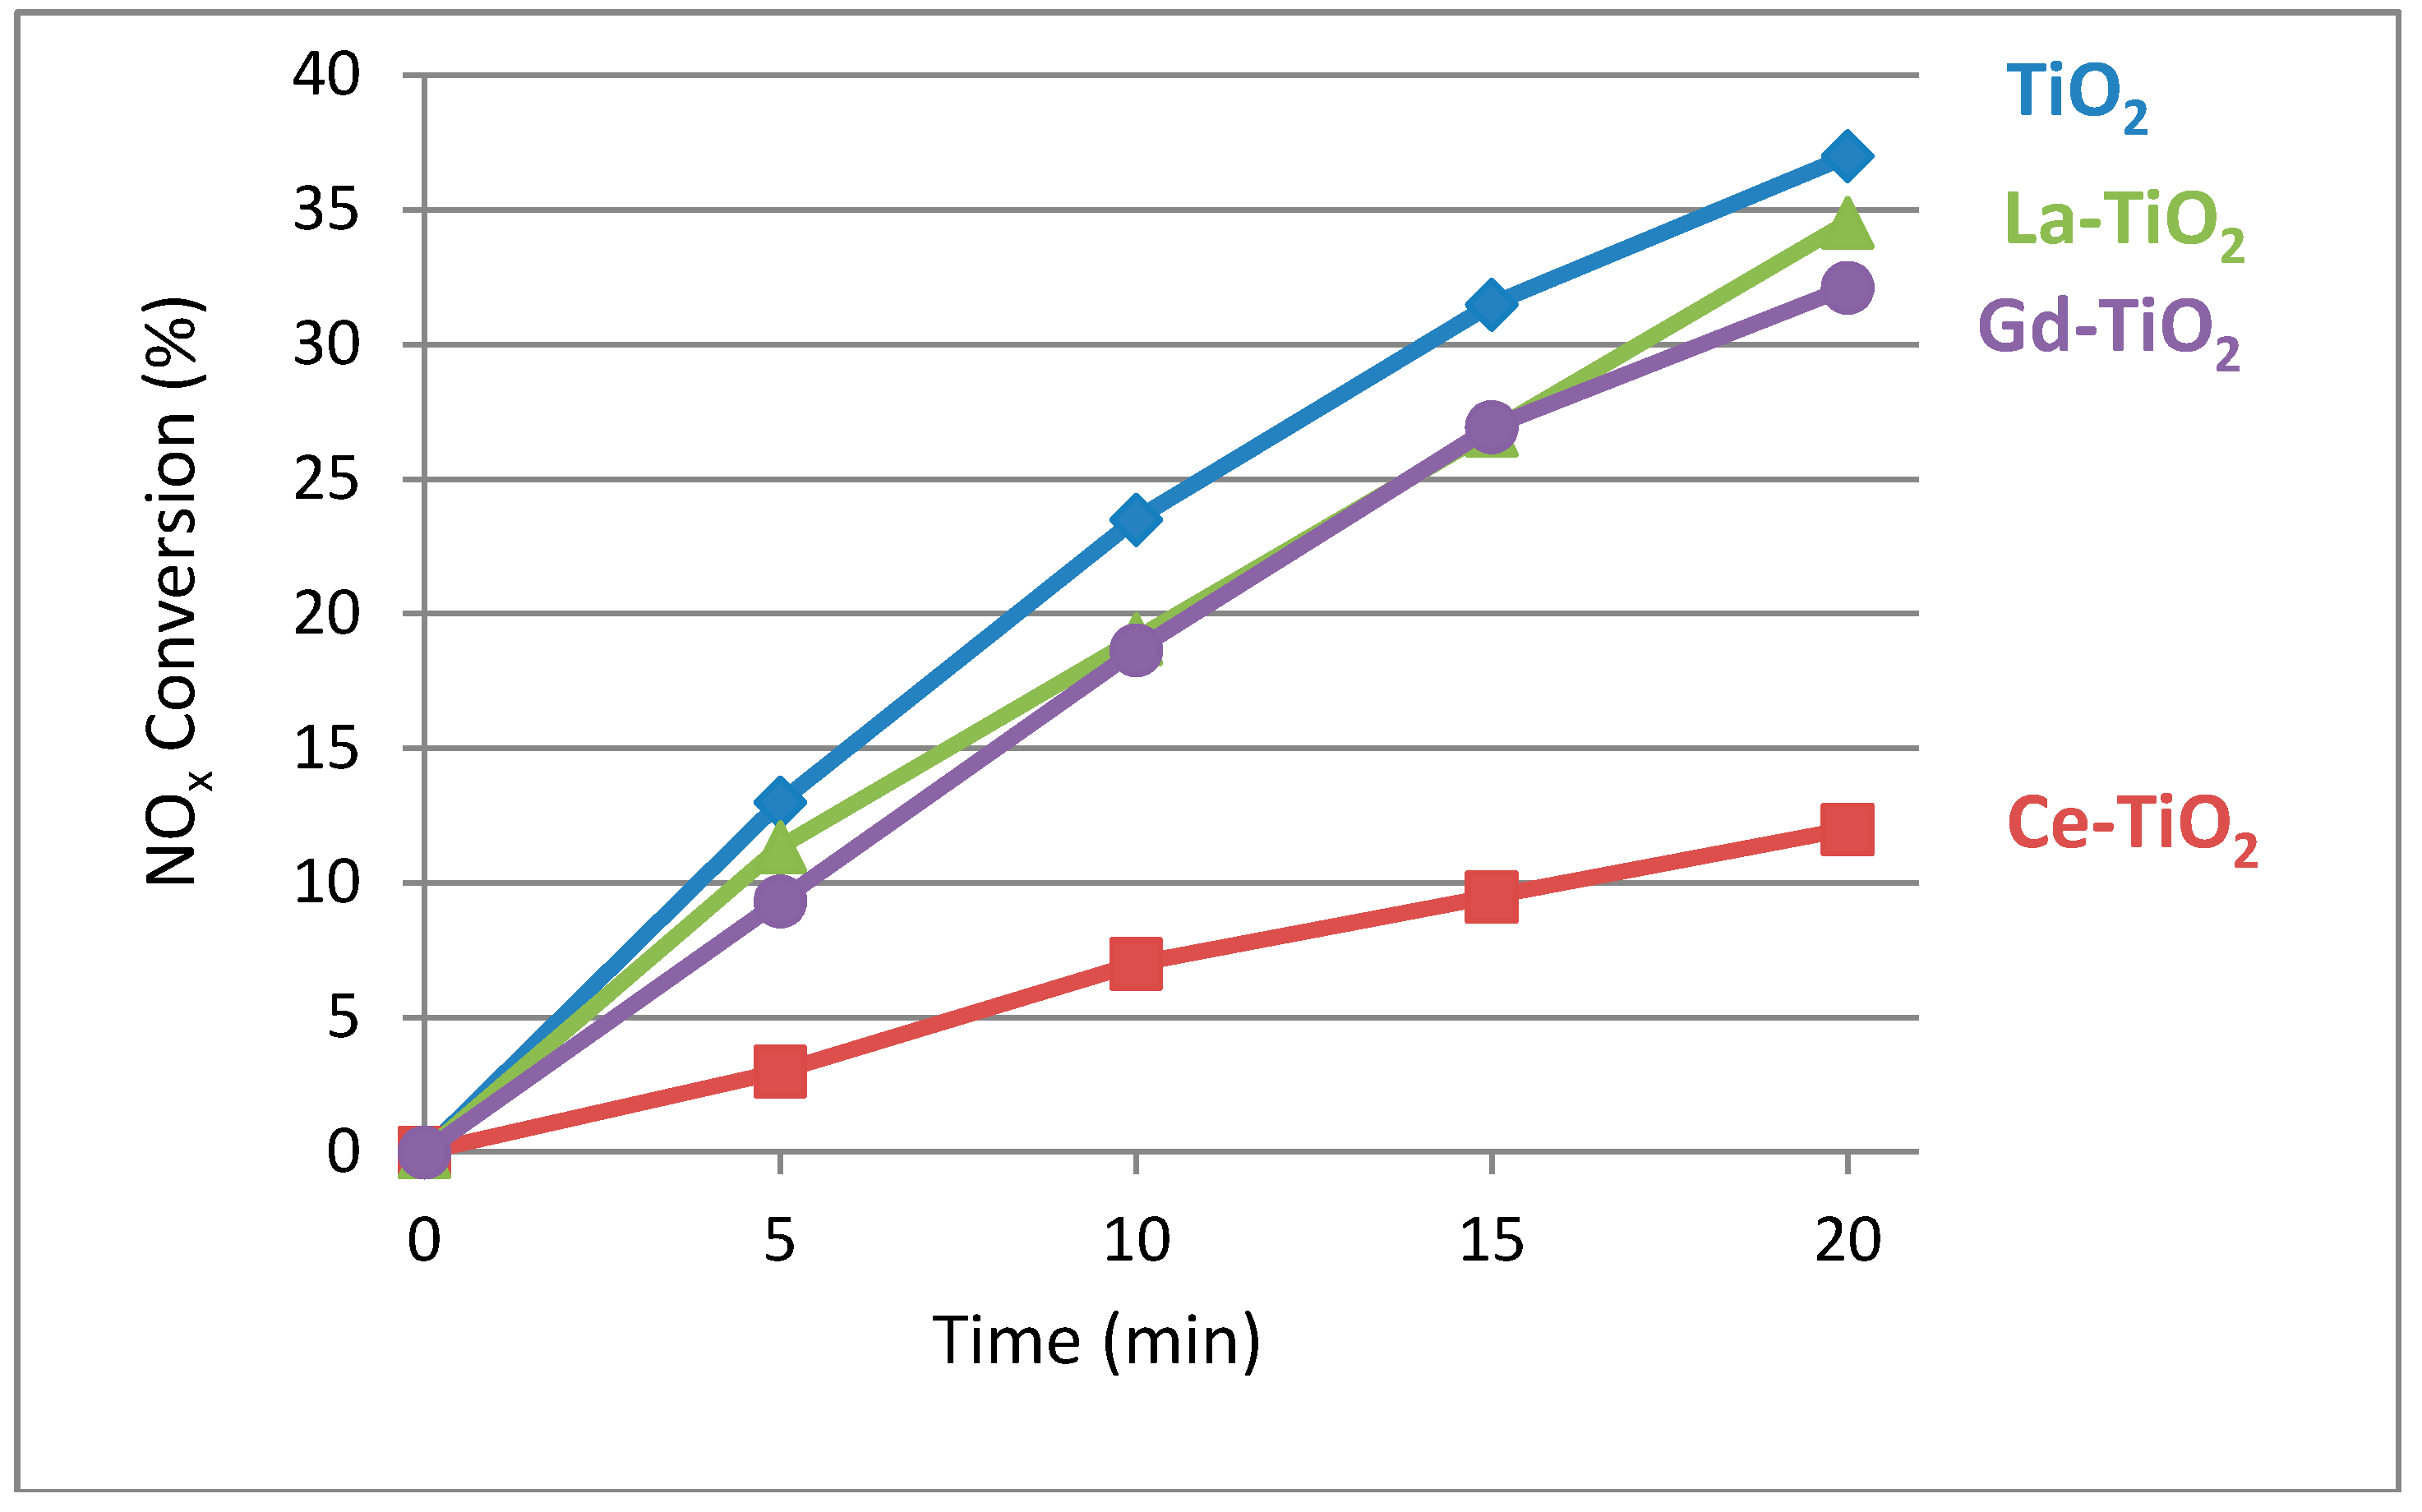
3.5.2. Gas-Solid NOx Removal
3.5.3. Gas-Solid VOC Removal
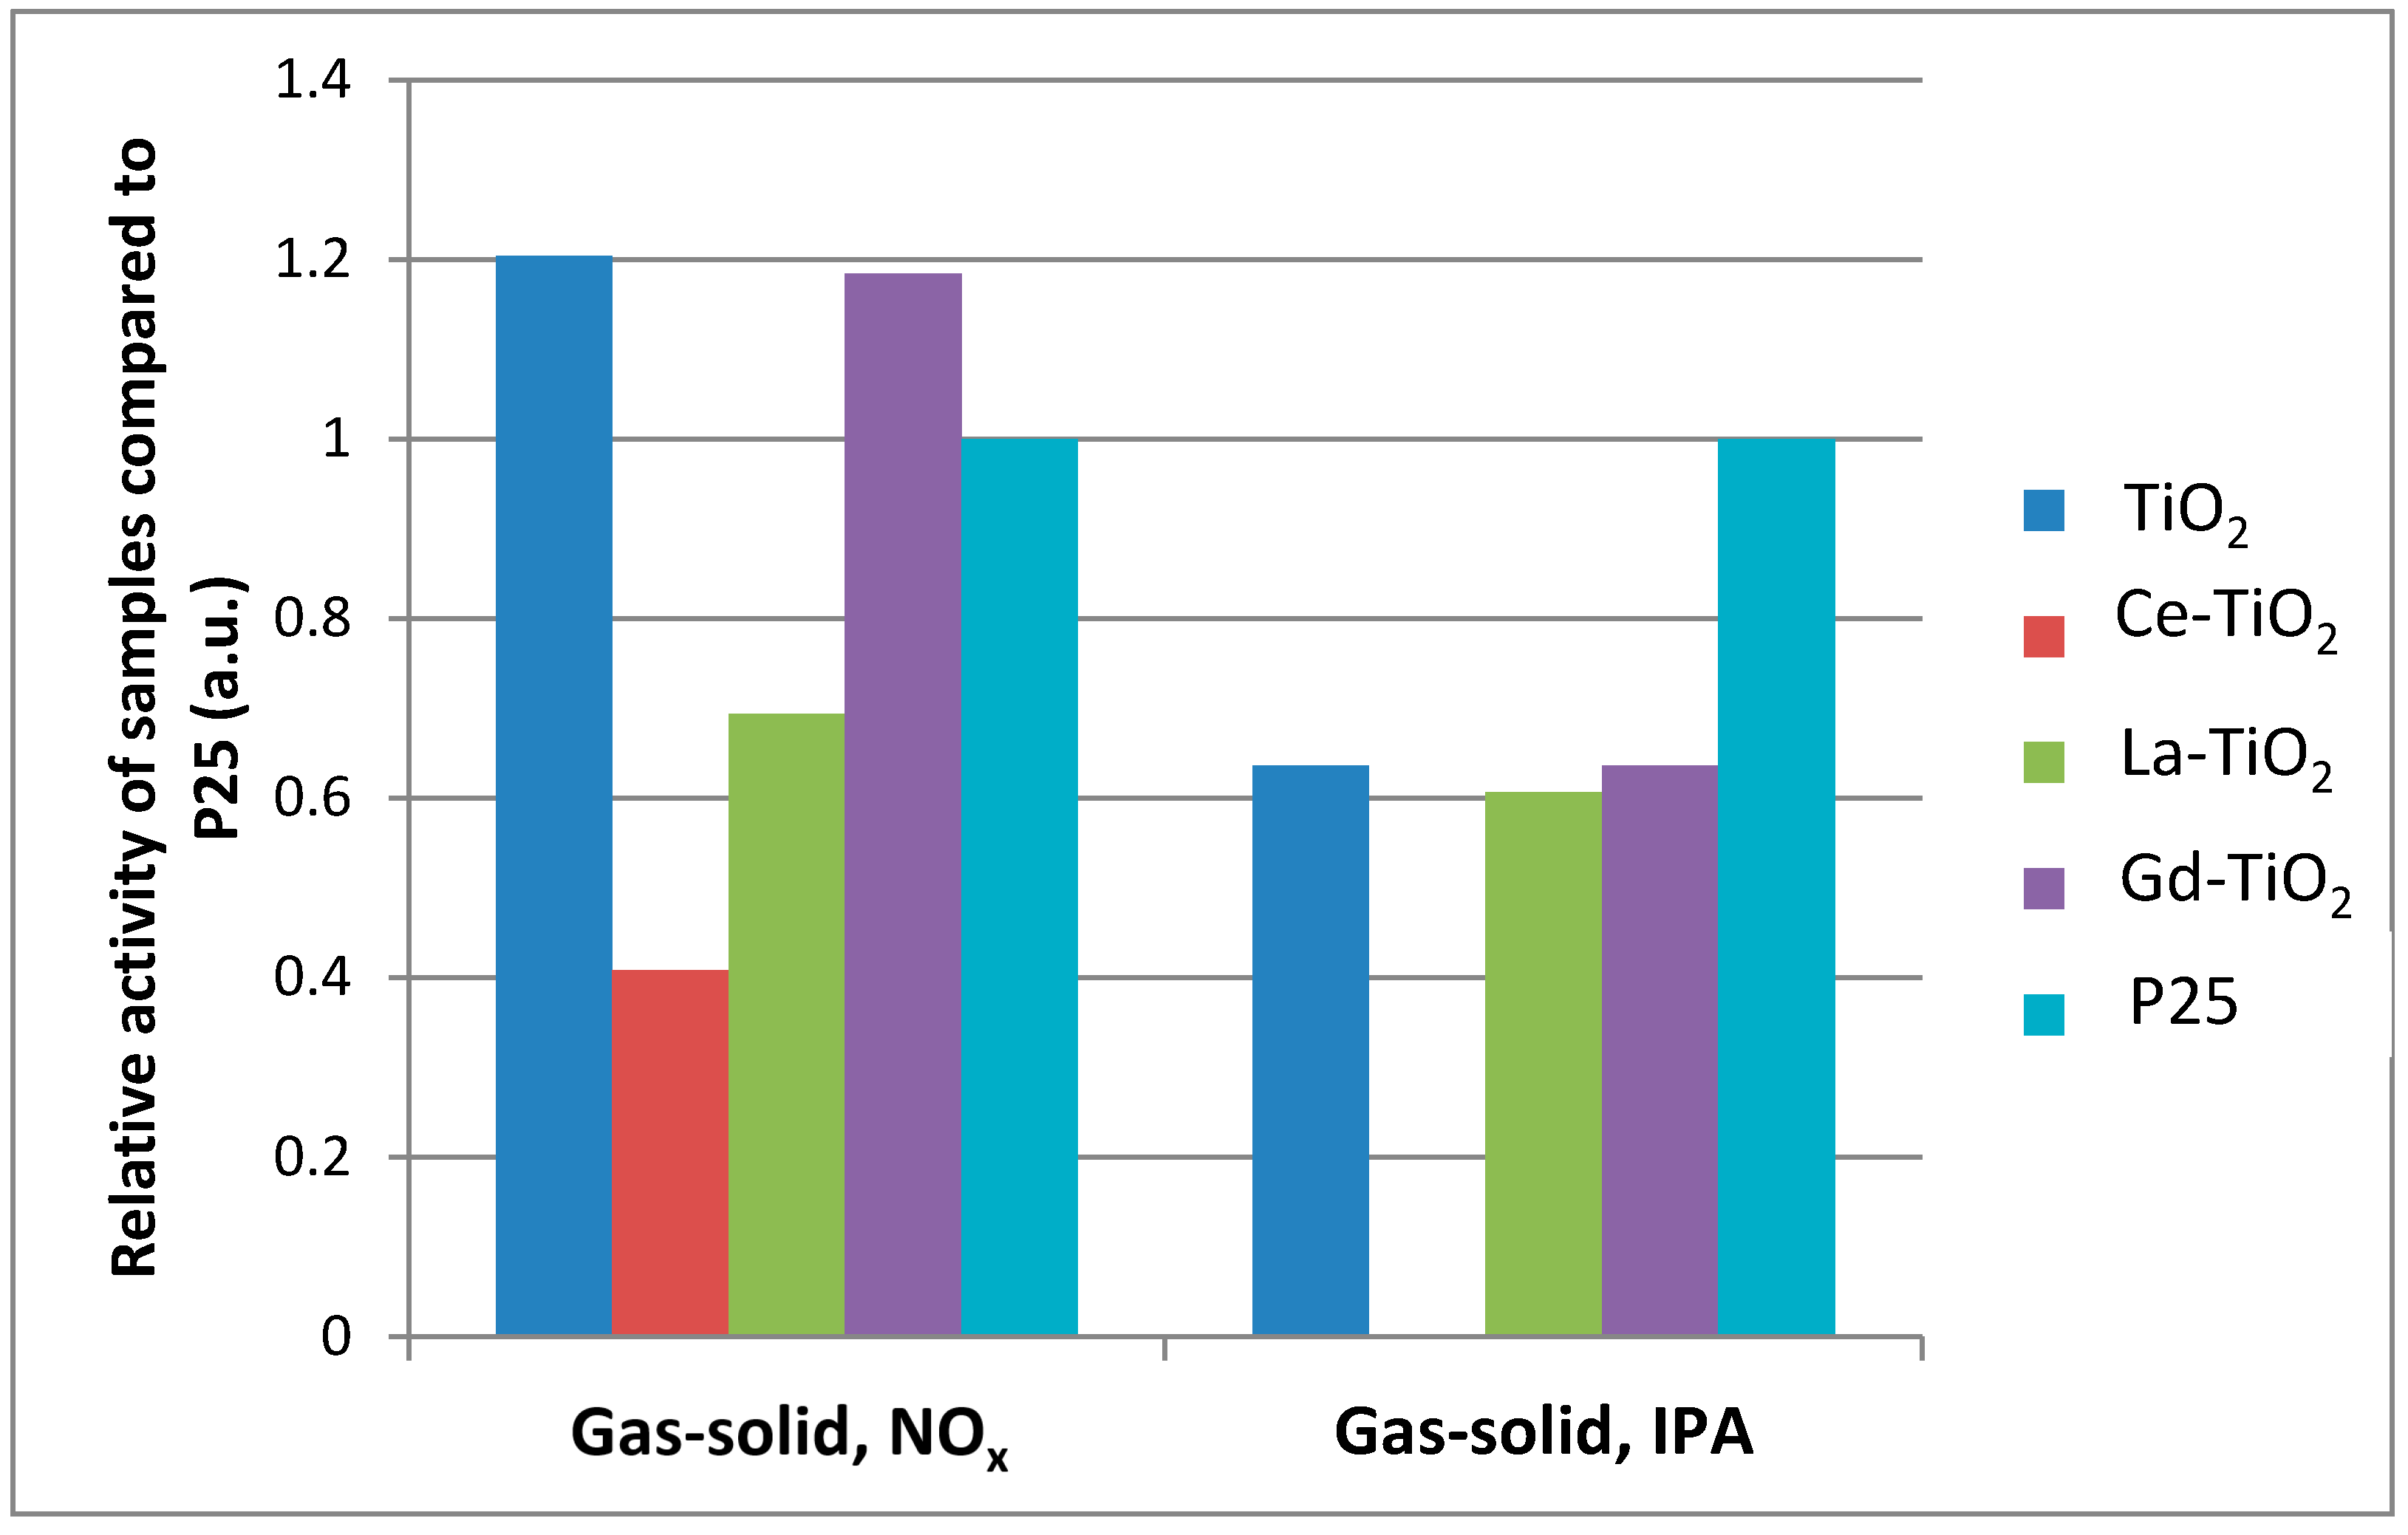
3.5.4. Comparison between Photocatalytic Activities of Samples in Different Environments
Activity under UV Irradiation or Simulated Solar Irradiation (UV + Vis)
Activity under Visible Light Irradiation
4. Conclusions
Author Contributions
Funding
Acknowledgments
Conflicts of Interest
References
- Schneider, J.; Matsuoka, M.; Takeuchi, M.; Zhang, J.L.; Horiuchi, Y.; Anpo, M.; Bahnemann, D.W. Understanding TiO2 Photocatalysis: Mechanisms and Materials. Chem. Rev. 2014, 114, 9919–9986. [Google Scholar] [CrossRef] [PubMed]
- Tobaldi, D.M.; Pullar, R.C.; Gualtieri, A.F.; Seabra, M.P.; Labrincha, J.A. Phase composition, crystal structure and microstructure of silver and tungsten doped TiO2 nanopowders with tuneable photochromic behaviour. Acta Mater. 2013, 61, 5571–5585. [Google Scholar] [CrossRef]
- Chong, M.N.; Jin, B.; Chow, C.W.K.; Saint, C. Recent developments in photocatalytic water treatment technology: A review. Water Res. 2010, 44, 2997–3027. [Google Scholar] [CrossRef] [PubMed]
- Lazar, M.A.; Varghese, S.; Nair, S.S. Photocatalytic water treatment by titanium dioxide: Recent updates. Catalysts 2012, 2, 572–601. [Google Scholar] [CrossRef]
- Maggos, T.; Bartzis, J.G.; Leva, P.; Kotzias, D. Application of photocatalytic technology for NOx removal. Appl. Phys. A-Mater. Sci. Process. 2007, 89, 81–84. [Google Scholar] [CrossRef]
- Mo, J.H.; Zhang, Y.P.; Xu, Q.J.; Lamson, J.J.; Zhao, R.Y. Photocatalytic purification of volatile organic compounds in indoor air: A literature review. Atmos. Environ. 2009, 43, 2229–2246. [Google Scholar] [CrossRef]
- Fujishima, A.; Honda, K. Electrochemical photolysis of water at a semiconductor electrode. Nature 1972, 238, 37. [Google Scholar] [CrossRef] [PubMed]
- Walter, M.G.; Warren, E.L.; McKone, J.R.; Boettcher, S.W.; Mi, Q.X.; Santori, E.A.; Lewis, N.S. Solar water splitting cells. Chem. Rev. 2010, 110, 6446–6473. [Google Scholar] [CrossRef] [PubMed]
- Bingham, S.; Daoud, W.A. Recent advances in making nano-sized TiO2 visible-light active through rare-earth metal doping. J. Mater. Chem. 2011, 21, 2041–2050. [Google Scholar] [CrossRef]
- Liu, G.; Yang, H.G.; Pan, J.; Yang, Y.Q.; Lu, G.Q.; Cheng, H.M. Titanium dioxide crystals with tailored facets. Chem. Rev. 2014, 114, 9559–9612. [Google Scholar] [CrossRef] [PubMed]
- Chen, X.; Mao, S.S. Titanium dioxide nanomaterials: synthesis, properties, modifications, and applications. Chem. Rev. 2007, 107, 2891–2959. [Google Scholar] [CrossRef] [PubMed]
- Serpone, N. Is the Band Gap of Pristine TiO2 Narrowed by Anion- and Cation-Doping of Titanium Dioxide in Second-Generation Photocatalysts? J. Phys. Chem. B 2006, 110, 24287–24293. [Google Scholar] [CrossRef] [PubMed]
- Anpo, M. Utilization of TiO2 photocatalysts in green chemistry. Pure Appl. Chem. 2000, 72, 1265–1270. [Google Scholar] [CrossRef]
- Wang, F.; Ma, Z.Z.; Ban, P.P.; Xu, X.H. C, N and S codoped rutile TiO2 nanorods for enhanced visible-light photocatalytic activity. Mater. Lett. 2017, 195, 143–146. [Google Scholar] [CrossRef]
- Fujishima, A.; Zhang, X.T.; Tryk, D.A. TiO2 photocatalysis and related surface phenomena. Surf. Sci. Rep. 2008, 63, 515–582. [Google Scholar] [CrossRef]
- Umebayashi, T.; Yamaki, T.; Itoh, H.; Asai, K. Analysis of electronic structures of 3d transition metal-doped TiO2 based on band calculations. J. Phys. Chem. Solids 2002, 63, 1909–1920. [Google Scholar] [CrossRef]
- Tobaldi, D.M.; Pullar, R.C.; Gualtieri, A.F.; Seabra, M.P.; Labrincha, J.A. Sol-gel synthesis, characterisation and photocatalytic activity of pure, W-, Ag-and W/Ag co-doped TiO2 nanopowders. Chem. Eng. J. 2013, 214, 364–375. [Google Scholar] [CrossRef]
- Colon, G.; Maicu, M.; Hidalgo, M.C.; Navio, J.A. Cu-doped TiO2 systems with improved photocatalytic activity. Appl. Catal. B-Environ. 2006, 67, 41–51. [Google Scholar] [CrossRef]
- Li, H.; Zhao, G.L.; Chen, Z.J.; Han, G.R.; Song, B. Low temperature synthesis of visible light-driven vanadium doped titania photocatalyst. J. Colloid Interface Sci. 2010, 344, 247–250. [Google Scholar] [CrossRef] [PubMed]
- Sun, S.; Ding, J.J.; Bao, J.; Gao, C.; Qi, Z.M.; Yang, X.Y.; He, B.; Li, C.X. Photocatalytic degradation of gaseous toluene on Fe-TiO2 under visible light irradiation: a study on the structure, activity and deactivation mechanism. Appl. Surf. Sci. 2012, 258, 5031–5037. [Google Scholar] [CrossRef]
- Lu, X.N.; Ma, Y.F.; Tian, B.Z.; Zhang, J.L. Preparation and characterization of Fe-TiO2 films with high visible photoactivity by autoclaved-sol method at low temperature. Solid State Sci. 2011, 13, 625–629. [Google Scholar] [CrossRef]
- Umar, K.; Haque, M.M.; Muneer, M.; Harada, T.; Matsumura, M. Mo, Mn and La doped TiO2: Synthesis, characterization and photocatalytic activity for the decolourization of three different chromophoric dyes. J. Alloys Compd. 2013, 578, 431–438. [Google Scholar] [CrossRef]
- Ranjitha, A.; Muthukumarasamy, N.; Thambidurai, M.; Velauthapillai, D.; Balasundaraprabhu, R.; Agilan, S. Fabrication of Ni-doped TiO2 thin film photoelectrode for solar cells. Sol. Energy 2014, 106, 159–165. [Google Scholar] [CrossRef]
- Di Valentin, C.; Finazzi, E.; Pacchioni, G.; Selloni, A.; Livraghi, S.; Paganini, M.C.; Giamello, E. N-doped TiO2: Theory and experiment. Chem. Phys. 2007, 339, 44–56. [Google Scholar] [CrossRef]
- Nolan, N.T.; Synnott, D.W.; Seery, M.K.; Hinder, S.J.; Van Wassenhoven, A.; Pillai, S.C. Effect of N-doping on the photocatalytic activity of sol–gel TiO2. J. Hazard. Mater. 2012, 211, 88–94. [Google Scholar] [CrossRef] [PubMed]
- Han, C.; Pelaez, M.; Likodimos, V.; Kontos, A.G.; Falaras, P.; O’Shea, K.; Dionysiou, D.D. Innovative visible light-activated sulfur doped TiO2 films for water treatment. Appl. Catal. B Environ. 2011, 107, 77–87. [Google Scholar] [CrossRef]
- Ren, W.J.; Ai, Z.H.; Jia, F.L.; Zhang, L.Z.; Fan, X.X.; Zou, Z.G. Low temperature preparation and visible light photocatalytic activity of mesoporous carbon-doped crystalline TiO2. Appl. Catal. B-Environ. 2007, 69, 138–144. [Google Scholar] [CrossRef]
- Wang, Y.Z.; Xue, X.X.; Yang, H. Preparation and characterization of carbon or/and boron-doped titania nano-materials with antibacterial activity. Ceram. Int. 2014, 40, 12533–12537. [Google Scholar] [CrossRef]
- Stengl, V.; Bakardjieva, S.; Murafa, N. Preparation and photocatalytic activity of rare earth doped TiO2 nanoparticles. Mater. Chem. Phys. 2009, 114, 217–226. [Google Scholar] [CrossRef]
- Tobaldi, D.M.; Pullar, R.C.; Skapin, A.S.; Seabra, M.P.; Labrincha, J.A. Visible light activated photocatalytic behaviour of rare earth modified commercial TiO2. Mater. Res. Bull. 2014, 50, 183–190. [Google Scholar] [CrossRef]
- Habibi, M.H.; Vosooghian, H. Photocatalytic degradation of some organic sulfides as environmental pollutants using titanium dioxide suspension. J. Photochem. Photobiol. A-Chem. 2005, 174, 45–52. [Google Scholar] [CrossRef]
- Ryu, J.; Choi, W. Substrate-Specific Photocatalytic Activities of TiO2 and Multiactivity Test for Water Treatment Application. Environ. Sci. Technol. 2007, 42, 294–300. [Google Scholar] [CrossRef]
- Wang, C.Y.; Pagel, R.; Dohrmann, J.K.; Bahnemann, D.W. Antenna mechanism and deaggregation concept: novel mechanistic principles for photocatalysis. Comptes Rendus Chim. 2006, 9, 761–773. [Google Scholar] [CrossRef]
- Kandiel, T.A.; Dillert, R.; Feldhoff, A.; Bahnemann, D.W. Direct Synthesis of Photocatalytically Active Rutile TiO2 Nanorods Partly Decorated with Anatase Nanoparticles. J. Phys. Chem. C 2010, 114, 4909–4915. [Google Scholar] [CrossRef]
- Rozman, N.; Skrlep, L.; Gaberscek, M.; Skapin, A.S. Tuning the Photocatalytic Activity of Nanocrystalline Titania by Phase Composition Control and Nitrogen Doping, Using Different Sources of Nitrogen. Acta Chim. Slov. 2014, 61, 506–516. [Google Scholar] [PubMed]
- Meagher, E.P.; Lager, G.A. Polyhedral thermal expansion in the TiO2 polymorphs; refinement of the crystal structures of rutile and brookite at high temperature. Can. Mineral. 1979, 17, 77–85. [Google Scholar]
- Howard, C.J.; Sabine, T.M.; Dickson, F. Structural and thermal parameters for rutile and anatase. Acta Crystallogr. Sect. B-Struct. Sci. 1991, 47, 462–468. [Google Scholar] [CrossRef]
- Marolt, T.; Skapin, A.S.; Bernard, J.; Zivec, P.; Gaberscek, M. Photocatalytic activity of anatase-containing facade coatings. Surf. Coat. Technol. 2011, 206, 1355–1361. [Google Scholar] [CrossRef]
- Tobaldi, D.M.; Piccirillo, C.; Pullar, R.C.; Gualtieri, A.F.; Seabra, M.P.; Castro, P.M.L.; Labrincha, J.A. Silver-modified nano-titania as an antibacterial agent and photocatalyst. J. Phys. Chem. C 2014, 118, 4751–4766. [Google Scholar] [CrossRef]
- Munuera, G.; Moreno, F.; Prieto, J.A. Temperature Programmed Desorption of Water Adsorbed on Anatase Surfaces. Zeitschrift Fur Physikalische Chemie-Frankfurt 1972, 78, 113. [Google Scholar] [CrossRef]
- Bickley, R.I.; Munuera, G.; Stone, F.S. Photoadsorption and photocatalysis at rutile surfaces: II. Photocatalytic oxidation of isopropanol. J. Catal. 1973, 31, 398–407. [Google Scholar] [CrossRef]
- Larson, S.A.; Widegren, J.A.; Falconer, J.L. Transient studies of 2-propanol photocatalytic oxidation on titania. J. Catal. 1995, 157, 611–625. [Google Scholar] [CrossRef]
- Lucas, S.S.; Ferreira, V.M.; de Aguiar, J.L.B. Incorporation of titanium dioxide nanoparticles in mortars—Influence of microstructure in the hardened state properties and photocatalytic activity. Cement Concr. Res. 2013, 43, 112–120. [Google Scholar] [CrossRef]
- Skapin, A.S.; Skrlep, L.; Suvorov, D.; Zunic, V.; Skapin, S.D. Photocatalytic activity of hierarchically structured, thermally stable, anatase particles. RSC Adv. 2015, 5, 26769–26776. [Google Scholar] [CrossRef]
- Burns, A.; Hayes, G.; Li, W.; Hirvonen, J.; Demaree, J.D.; Shah, S.I. Neodymium ion dopant effects on the phase transformation in sol–gel derived titania nanostructures. Mater. Sci. Eng. B-Solid State Mater. Adv. Technol. 2004, 111, 150–155. [Google Scholar] [CrossRef]
- Xu, Y.H.; Chen, H.R.; Zeng, Z.X.; Lei, B. Investigation on mechanism of photocatalytic activity enhancement of nanometer cerium-doped titania. Appl. Surf. Sci. 2006, 252, 8565–8570. [Google Scholar] [CrossRef]
- Hawthorne, F.C.A.; Brown, G.E.A.; Mineralogical Society of America. Spectroscopic Methods in Mineralogy and Geology; Mineralogical Society of America: Chantilly, VA, USA, 1988. [Google Scholar]
- Galindo-Hernandez, F.; Gomez, R. Degradation of the herbicide 2,4-dichlorophenoxyacetic acid over TiO2-CeO2 sol-gel photocatalysts: effect of the annealing temperature on the photoactivity. J. Photochem. Photobiol. A-Chem. 2011, 217, 383–388. [Google Scholar] [CrossRef]
- Nguyen-Phan, T.D.; Song, M.B.; Kim, E.J.; Shin, E.W. The role of rare earth metals in lanthanide-incorporated mesoporous titania. Microporous Mesoporous Mater. 2009, 119, 290–298. [Google Scholar] [CrossRef]
- Zhang, J.Y.; Zhao, Z.Y.; Wang, X.Y.; Yu, T.; Guan, J.; Yu, Z.T.; Li, Z.S.; Zou, Z.G. Increasing the Oxygen Vacancy Density on the TiO2 Surface by La-Doping for Dye-Sensitized Solar Cells. J. Phys. Chem. C 2010, 114, 18396–18400. [Google Scholar] [CrossRef]
- Li, J.H.; Yang, X.; Yu, X.D.; Xu, L.L.; Kang, W.L.; Yan, W.H.; Gao, H.F.; Liu, Z.H.; Guo, Y.H. Rare earth oxide-doped titania nanocomposites with enhanced photocatalytic activity towards the degradation of partially hydrolysis polyacrylamide. Appl. Surf. Sci. 2009, 255, 3731–3738. [Google Scholar] [CrossRef]
- Lin, J.; Jimmy, C.Y. An investigation on photocatalytic activities of mixed TiO2-rare earth oxides for the oxidation of acetone in air. J. Photochem. Photobiol. A-Chem. 1998, 116, 63–67. [Google Scholar] [CrossRef]
- Tobaldi, D.M.; Pullar, R.C.; Seabra, M.P.; Labrincha, J.A. Fully quantitative X-ray characterisation of Evonik Aeroxide TiO2 P25®. Mater. Lett. 2014, 122, 345–347. [Google Scholar] [CrossRef]
- Hurum, D.C.; Agrios, A.G.; Gray, K.A.; Rajh, T.; Thurnauer, M.C. Explaining the Enhanced Photocatalytic Activity of Degussa P25 Mixed-Phase TiO2 Using EPR. J. Phys. Chem. B 2003, 107, 4545–4549. [Google Scholar] [CrossRef]
- Zalas, M. Gadolinium-modified titanium oxide materials for photoenergy applications: A review. J. Rare Earths 2014, 32, 487–495. [Google Scholar] [CrossRef]
- Bao, R.Y.; Yu, Y.M.; Chen, H.Y.; Wang, W.Z.; Xia, J.X.; Li, H. Effects of Rare Earth Elements and Nitrogen Co-Doped on the Photocatalytic Performance of TiO2. Cryst. Res. Technol. 2018, 53, 8. [Google Scholar] [CrossRef]
- Lee, H.; Park, I.S.; Bang, H.J.; Park, Y.K.; Kim, H.; Ha, H.H.; Kim, B.J.; Jung, S.C. Fabrication of Gd-La codoped TiO2 composite via a liquid phase plasma method and its application as visible-light photocatalysts. Appl. Surf. Sci. 2019, 471, 893–899. [Google Scholar] [CrossRef]
- Karmaoui, M.; Tobaldi, D.M.; Skapin, A.S.; Pullar, R.C.; Seabra, M.P.; Labrincha, J.A.; Amaral, V.S. Non-aqueous sol-gel synthesis through a low-temperature solvothermal process of anatase showing visible-light photocatalytic activity. RSC Adv. 2014, 4, 46762–46770. [Google Scholar] [CrossRef]


| Sample No. of Variables | Agreement Factors | Phase Composition | |||||
|---|---|---|---|---|---|---|---|
| Rf2 (%) | Rwp (%) | χ2 | Anatase (wt.%) | Rutile (wt.%) | Brookite (wt.%) | ||
| TiO2 | 12 | 5.68 | 8.59 | 2.117 | / | 100 | / |
| Ce-TiO2 | 22 | 5.83 | 5.95 | 1.999 | 56.1 ± 0.3 | 35.6 ± 0.2 | 8.3 ± 0.7 |
| La-TiO2 | 15 | 5.49 | 7.27 | 2.389 | 26.0 ± 0.4 | 74.0 ± 0.1 | / |
| Gd-TiO2 | 19 | 4.66 | 7.29 | 2.427 | 25.4 ± 0.5 | 74.6 ± 0.1 | / |
| Sample | 1st Derivative Maximum | |
|---|---|---|
| Wavelength (nm) | Eg (eV) | |
| TiO2 | 401 | 3.09 |
| Ce-TiO2 | 395 | 3.14 |
| La-TiO2 | 400 | 3.10 |
| Gd-TiO2 | 399 | 3.11 |
| Sample | k′app (h−1) |
|---|---|
| TiO2 | 0.390 |
| Ce-TiO2 | 0.018 |
| La-TiO2 | 0.238 |
| Gd-TiO2 | 0.242 |
| P25 | 1.17 |
| Sample | Photocatalytic Activity | |
|---|---|---|
| k′app Solar (min−1) | k′app VIS (min−1) | |
| TiO2 | 0.0244 | 0.0042 |
| Ce-TiO2 | 0.0066 | 0.0000 |
| La-TiO2 | 0.0212 | 0.0040 |
| Gd-TiO2 | 0.0200 | 0.0042 |
| P25 | 0.04427 | 0.0066 |
| Sample | Photocatalytic Activity | |
|---|---|---|
| Vis (ppm/h) | UV + Vis (ppm/h) | |
| TiO2 | 59 | 885 |
| Ce-TiO2 | 20 | 105 |
| La-TiO2 | 34 | 520 |
| Gd-TiO2 | 58 | 735 |
| P25 | 49 | 825 |
© 2019 by the authors. Licensee MDPI, Basel, Switzerland. This article is an open access article distributed under the terms and conditions of the Creative Commons Attribution (CC BY) license (http://creativecommons.org/licenses/by/4.0/).
Share and Cite
Rozman, N.; Tobaldi, D.M.; Cvelbar, U.; Puliyalil, H.; Labrincha, J.A.; Legat, A.; Sever Škapin, A. Hydrothermal Synthesis of Rare-Earth Modified Titania: Influence on Phase Composition, Optical Properties, and Photocatalytic Activity. Materials 2019, 12, 713. https://doi.org/10.3390/ma12050713
Rozman N, Tobaldi DM, Cvelbar U, Puliyalil H, Labrincha JA, Legat A, Sever Škapin A. Hydrothermal Synthesis of Rare-Earth Modified Titania: Influence on Phase Composition, Optical Properties, and Photocatalytic Activity. Materials. 2019; 12(5):713. https://doi.org/10.3390/ma12050713
Chicago/Turabian StyleRozman, Nejc, David M. Tobaldi, Uroš Cvelbar, Harinarayanan Puliyalil, João A. Labrincha, Andraž Legat, and Andrijana Sever Škapin. 2019. "Hydrothermal Synthesis of Rare-Earth Modified Titania: Influence on Phase Composition, Optical Properties, and Photocatalytic Activity" Materials 12, no. 5: 713. https://doi.org/10.3390/ma12050713
APA StyleRozman, N., Tobaldi, D. M., Cvelbar, U., Puliyalil, H., Labrincha, J. A., Legat, A., & Sever Škapin, A. (2019). Hydrothermal Synthesis of Rare-Earth Modified Titania: Influence on Phase Composition, Optical Properties, and Photocatalytic Activity. Materials, 12(5), 713. https://doi.org/10.3390/ma12050713