Differences of Curing Effects between a Human and Veterinary Bone Cement

 , ,
, ,
Abstract
1. Introduction
2. Materials and Methods
2.1. Materials
2.2. Experimental Design
2.3. Sample Preparation and Experiment
2.3.1. Exothermic Temperature and Curing Time
2.3.2. Three-Point Bend Test
2.3.3. Hardness Test
2.3.4. Pull-Out Tension Test
2.3.5. Pull-Out Cyclic Test
2.4. Statistical Analysis
3. Results
3.1. Exothermic Temperature
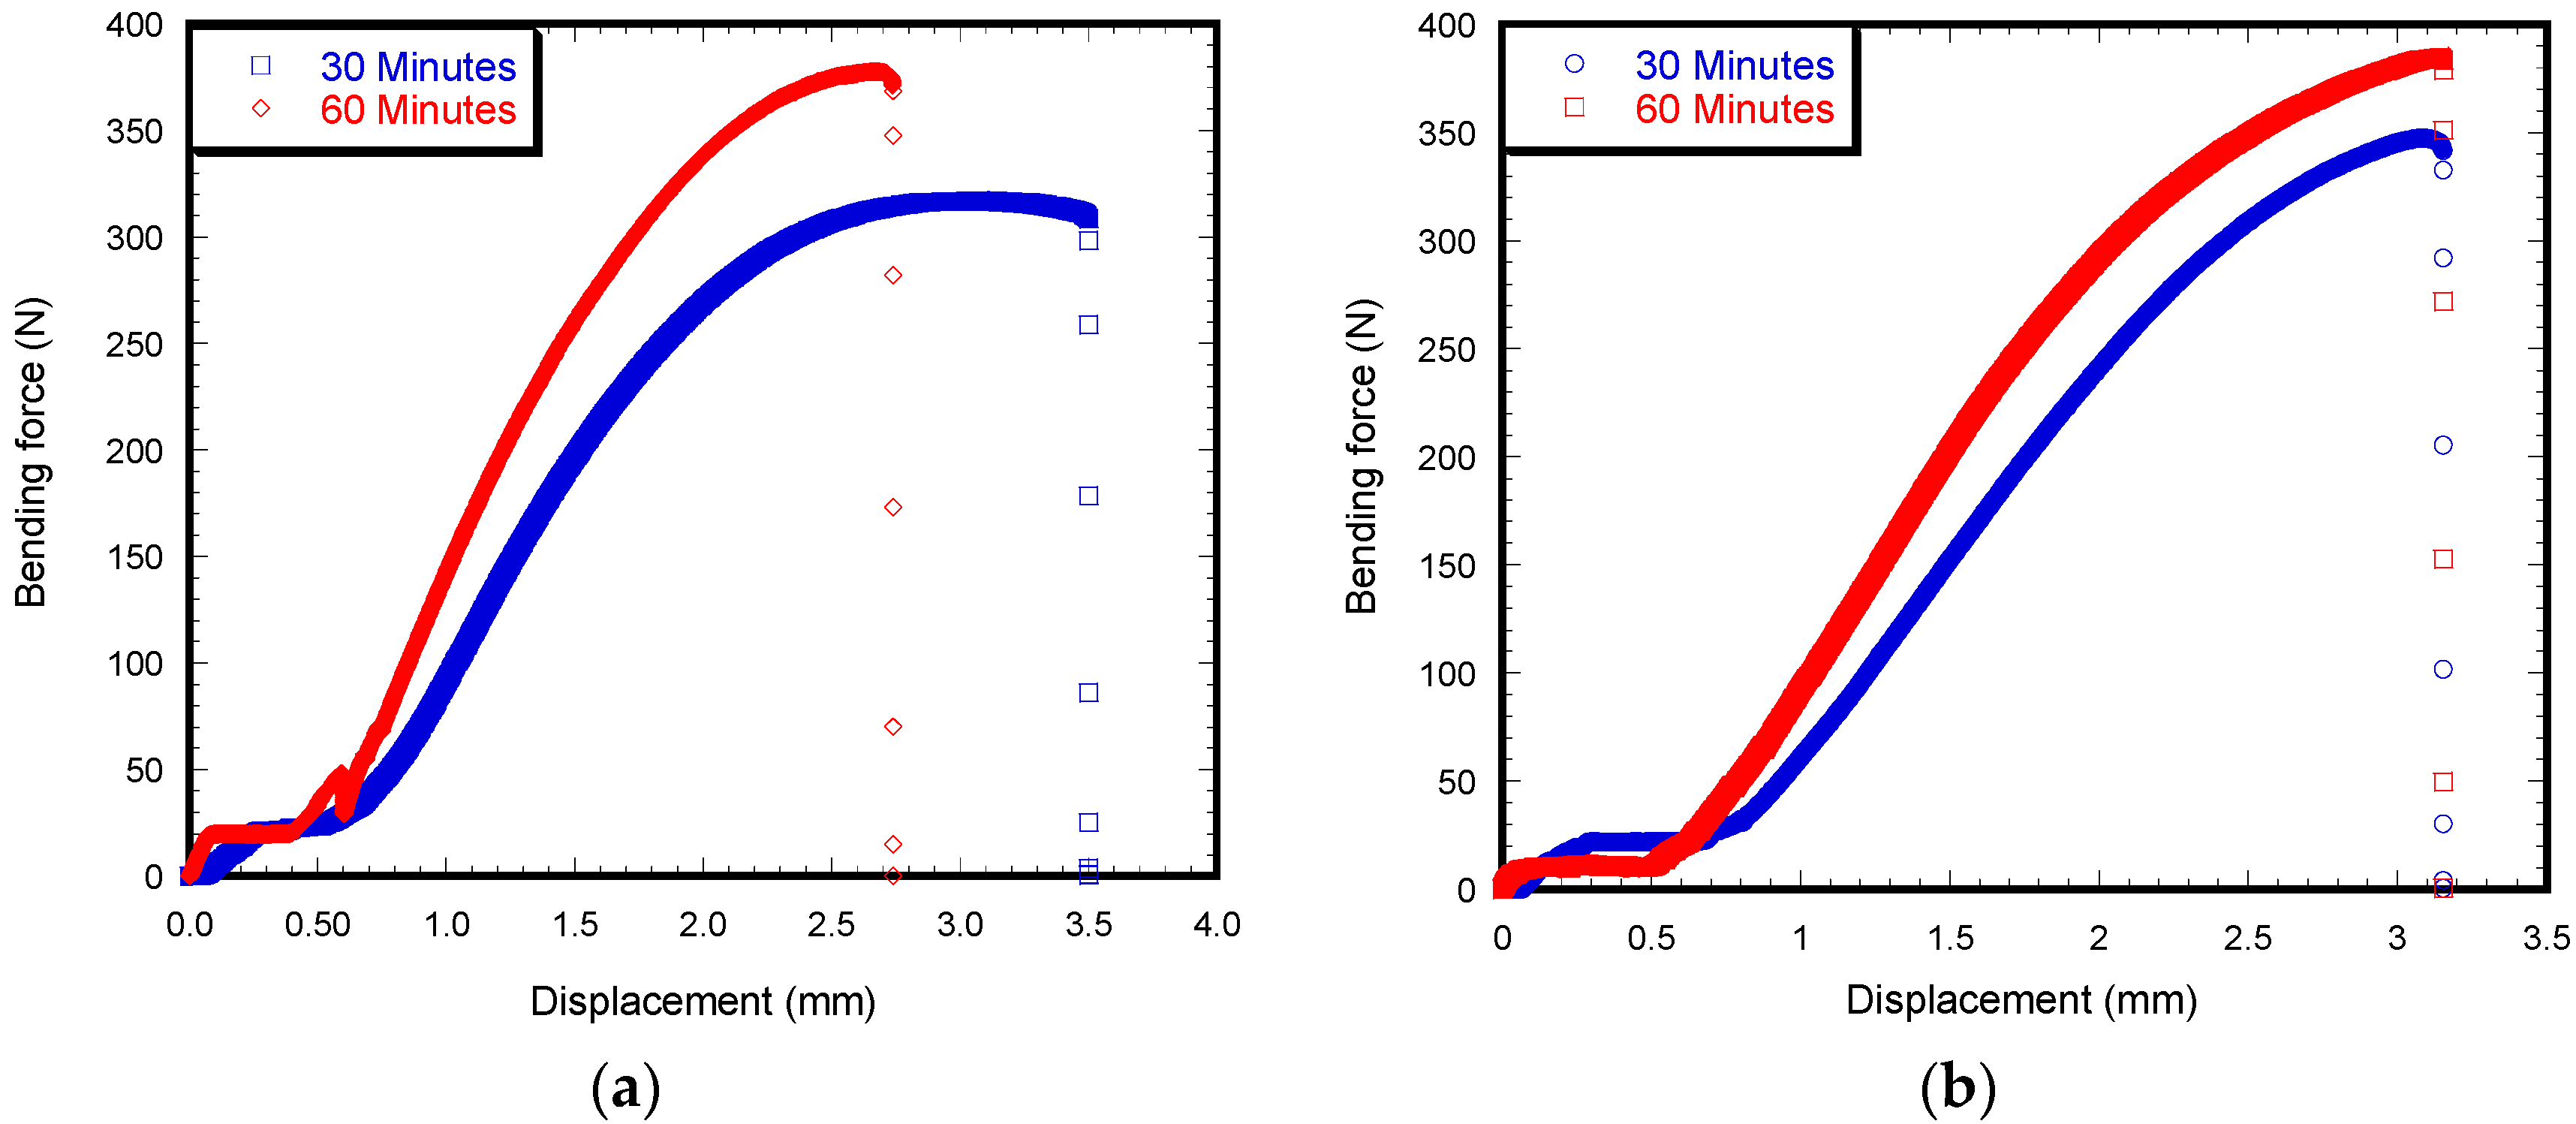
3.2. Flexural Tests
3.3. Hardness Test
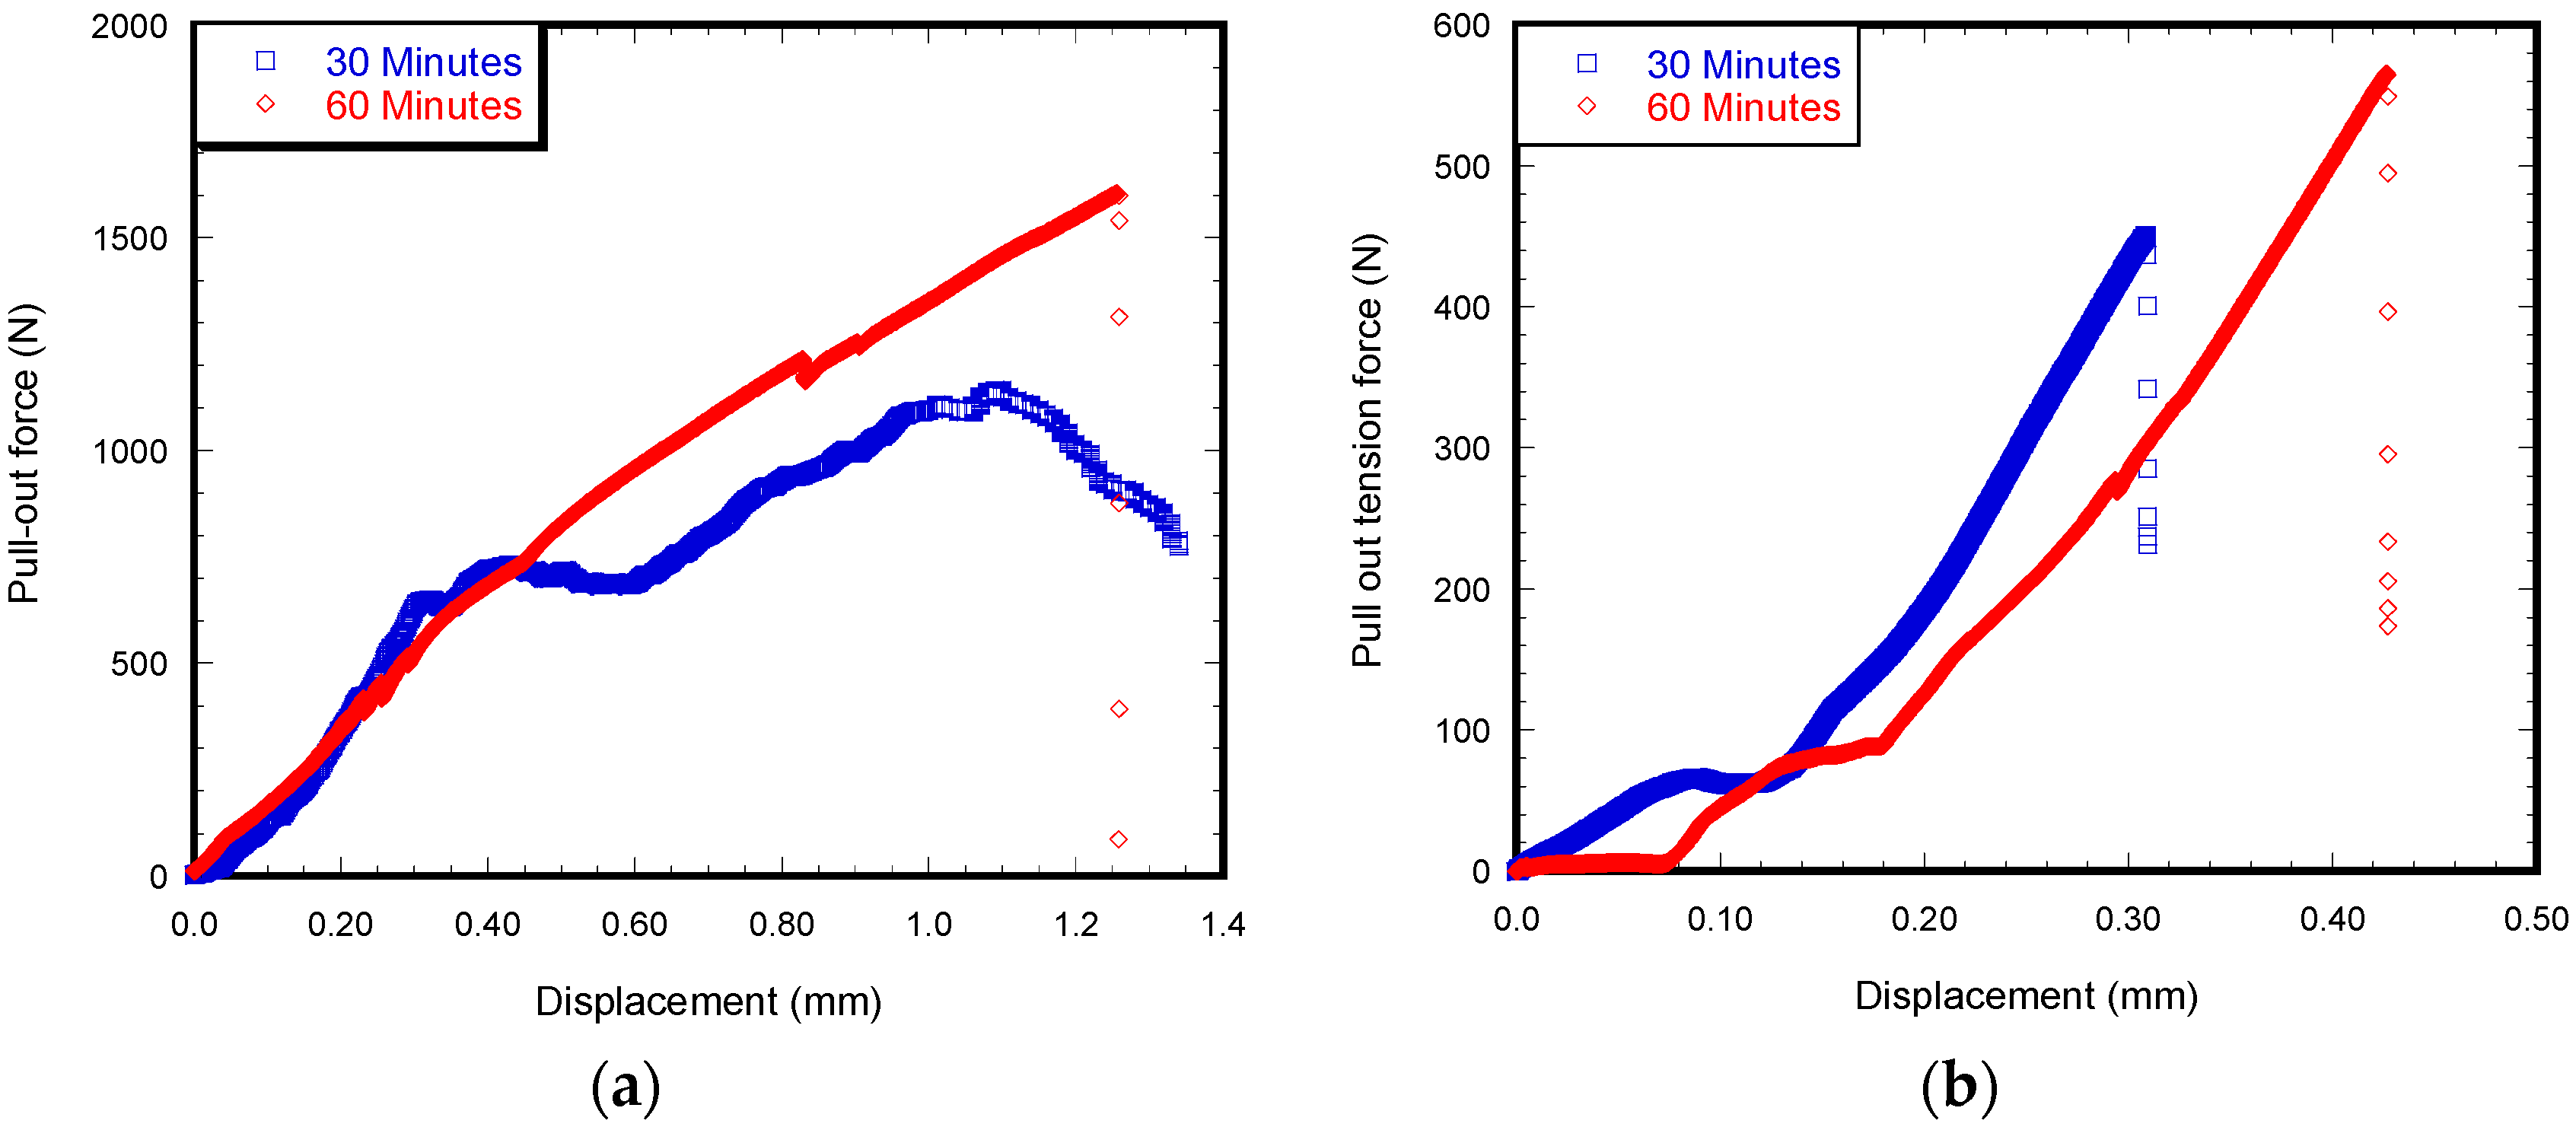
3.4. Pull-Out Tension Test on Ti/Cement Samples
3.5. Pull-Out Cyclic Test on Ti/Cement Samples
4. Discussion
5. Conclusions
- There exists a difference in internal morphology between HBC and VBC. In addition, there exist a difference of surface roughness of HBC and VBC along the interface of Ti/HBC and Ti/VBC. However, this study did not find any significant difference in the internal morphological characteristics due to the difference of curing time of HBC and VBC.
- There exists a difference of curing time and exothermic temperature between HBC and VBC samples, which affected the flexural strength, hardness, and maximum exothermic temperature values between HBC and VBC samples.
- There exists a difference of build-up residual load between Ti/HBC and Ti/VBC samples during the curing of each cement, which might affect the shear strength values under static and cyclic loading between Ti/HBC and Ti/VBC samples.
Author Contributions
Funding
Acknowledgments
Conflicts of Interest
References
- Biomet, I. Cobalt™ HV Bone Cement. 2010. Available online: http://www.biomet.com/orthopedics/productDetail.cfm?category=7&product=250 (accessed on 5 January 2018).
- Mousa, W.F.; Kobayashi, M.; Shinzato, S.; Kamimura, M.; Neo, M.; Yoshihara, S.; Nakamura, T. Biological and mechanical properties of PMMA-based bioactive bone cements. Biomaterials 2000, 21, 2137–2146. [Google Scholar] [CrossRef]
- Tunney, M.M.; Brady, A.J.; Buchanan, F.; Newe, C.; Dunne, N.J. Incorporation of chitosan in acrylic bone cement: Effect on antibiotic release, bacterial biofilm formation and mechanical properties. J. Mater. Sci. Mater. Med. 2008, 19, 1609–1615. [Google Scholar] [CrossRef] [PubMed]
- BioMedtrix Inc. The Total Hip Replacement. 2017. Available online: https://biomedtrix.com/ (accessed on 20 January 2018).
- Jorgensen Labs Inc. Jorgensen Bone Cement. 2018. Available online: https://www.jorvet.com/ (accessed on 20 January 2018).
- Liu-Snyder, P.; Webster, T.J. Developing a New Generation of Bone Cements with Nanotechnology. Curr. Nanosci. 2008, 4, 111–118. [Google Scholar] [CrossRef]
- Hingston, J.A.; Dunne, N.J.; Looney, L.; McGuinness, G.B. Effect of curing characteristics on residual stress generation in polymethyl methacrylate bone cements. Proc. Inst. Mech. Eng. Part H J. Eng. Med. 2008, 222, 933–945. [Google Scholar] [CrossRef] [PubMed]
- Banks-Sills, L.; Yang, Y.Y.; Munz, D. An influence function for stress intensity factors of bimaterial notched bodies. Int. J. Fract. 1997, 85, 333–350. [Google Scholar] [CrossRef]
- Reedy, E.D. Free-Edge stress intensity factor for a bonded ductile layer subjected to shear. Appl. Mech. Rev. 1993, 60, 715–720. [Google Scholar] [CrossRef]
- Akisanya, A.R.; Fleck, N.A. Interfacial cracking from the free-edge of a long bi-material strip. Int. J. Solids Struct. 1997, 34, 1645–1665. [Google Scholar] [CrossRef]
- Gleich, D.M.; Van Tooren, M.J.; Beukers, A. A stress singularity approach to failure initiation in a bonded joint with varying bondline thickness. J. Adhes. Sci. Technol. 2001, 15, 1247–1259. [Google Scholar] [CrossRef]
- Zor, M.; Küçük, M.; Aksoy, S. Residual stress effects on fracture energies of cement–bone and cement–implant interfaces. Biomaterials 2002, 23, 1595–1601. [Google Scholar] [CrossRef]
- Moiduddin, K.; Darwish, S.; Al-Ahmari, A.; ElWatidy, S.; Mohammad, A.; Ameen, W. Structural and mechanical characterization of custom design cranial implant created using additive manufacturing. Electron. J. Biotechnol. 2017, 29, 22–31. [Google Scholar] [CrossRef]
- Ritchie, R.O.; Koester, K.J.; Ionova, S.; Yao, W.; Lane, N.E.; Ager Iii, J.W. Measurement of the toughness of bone: A tutorial with special reference to small animal studies. Bone 2008, 43, 798–812. [Google Scholar] [CrossRef] [PubMed]
- Filmetrics Inc-USA. Available online: https://www.filmetrics.com/opticalprofilers/profilm3d (accessed on 14 January 2018).
- Khandaker, M.; Vaughan, M.B.; Morris, T.L.; White, J.J.; Meng, Z. Effect of additives particles on mechanical, thermal and cell functions properties of poly (methyl methacrylate) cement. Int. J. Nanomed. 2014, 9, 2699. [Google Scholar] [CrossRef] [PubMed]
- Khandaker, M.; Vaughan, M.B.; Morris, T.L.; White, J.J.; Meng, Z. The Effect of Nanoparticles and Alternative Monomer on the Exothermic Temperature of PMMA Bone Cement. Procedia Eng. 2015, 105, 946–952. [Google Scholar] [CrossRef] [PubMed]


| Experimental Parameters | Sample Type | Curing Time | |
|---|---|---|---|
| 30 min | 60 min | ||
| Flexural strength (MPa) | HBC | 56.24 ± 2.55 (n = 6) | 70.05 ± 1.90 (n = 6) |
| VBC | 61.60 ± 0.86 (n = 6) | 65.90 ± 0.47 (n = 5) | |
| Hardness (Rockwell R hardness number) | HBC | 64 (n = 3) | 79 (n = 3) |
| VBC | 42 (n = 3) | 71 (n = 3) | |
| Interface shear strength (MPa) | HBC | 1.71 ± 0.09 (n = 5) | 3.08 ± 0.07 (n = 4) |
| VBC | 0.85 ± 0.04 (n = 3) | 1.08 ± 0.03 (n = 3) | |
| Experimental Parameters | Sample Type | Curing Time | |
|---|---|---|---|
| 30 min | 60 min | ||
| Arithmetic mean height (µm) | HBC | 0.16 ± 0.01 (n = 3) | 0.18 ± 0.03 (n = 3) |
| VBC | 0.11 ± 0.00 (n = 3) | 0.13 ± 0.01 (n = 3) | |
| Root mean square height (µm) | HBC | 0.23 ± 0.01 (n = 3) | 0.24 ± 0.03 (n = 3) |
| VBC | 0.13 ± 0.01 (n = 3) | 0.17 ± 0.01 (n = 3) | |
© 2019 by the authors. Licensee MDPI, Basel, Switzerland. This article is an open access article distributed under the terms and conditions of the Creative Commons Attribution (CC BY) license (http://creativecommons.org/licenses/by/4.0/).
Share and Cite
Kallol, K.M.Z.; Motalab, M.; Parvej, M.S.; Konari, P.R.; Barghouthi, H.; Khandaker, M. Differences of Curing Effects between a Human and Veterinary Bone Cement. Materials 2019, 12, 470. https://doi.org/10.3390/ma12030470
Kallol KMZ, Motalab M, Parvej MS, Konari PR, Barghouthi H, Khandaker M. Differences of Curing Effects between a Human and Veterinary Bone Cement. Materials. 2019; 12(3):470. https://doi.org/10.3390/ma12030470
Chicago/Turabian StyleKallol, K. M. Z., M. Motalab, M. S. Parvej, P. R. Konari, H. Barghouthi, and M. Khandaker. 2019. "Differences of Curing Effects between a Human and Veterinary Bone Cement" Materials 12, no. 3: 470. https://doi.org/10.3390/ma12030470
APA StyleKallol, K. M. Z., Motalab, M., Parvej, M. S., Konari, P. R., Barghouthi, H., & Khandaker, M. (2019). Differences of Curing Effects between a Human and Veterinary Bone Cement. Materials, 12(3), 470. https://doi.org/10.3390/ma12030470