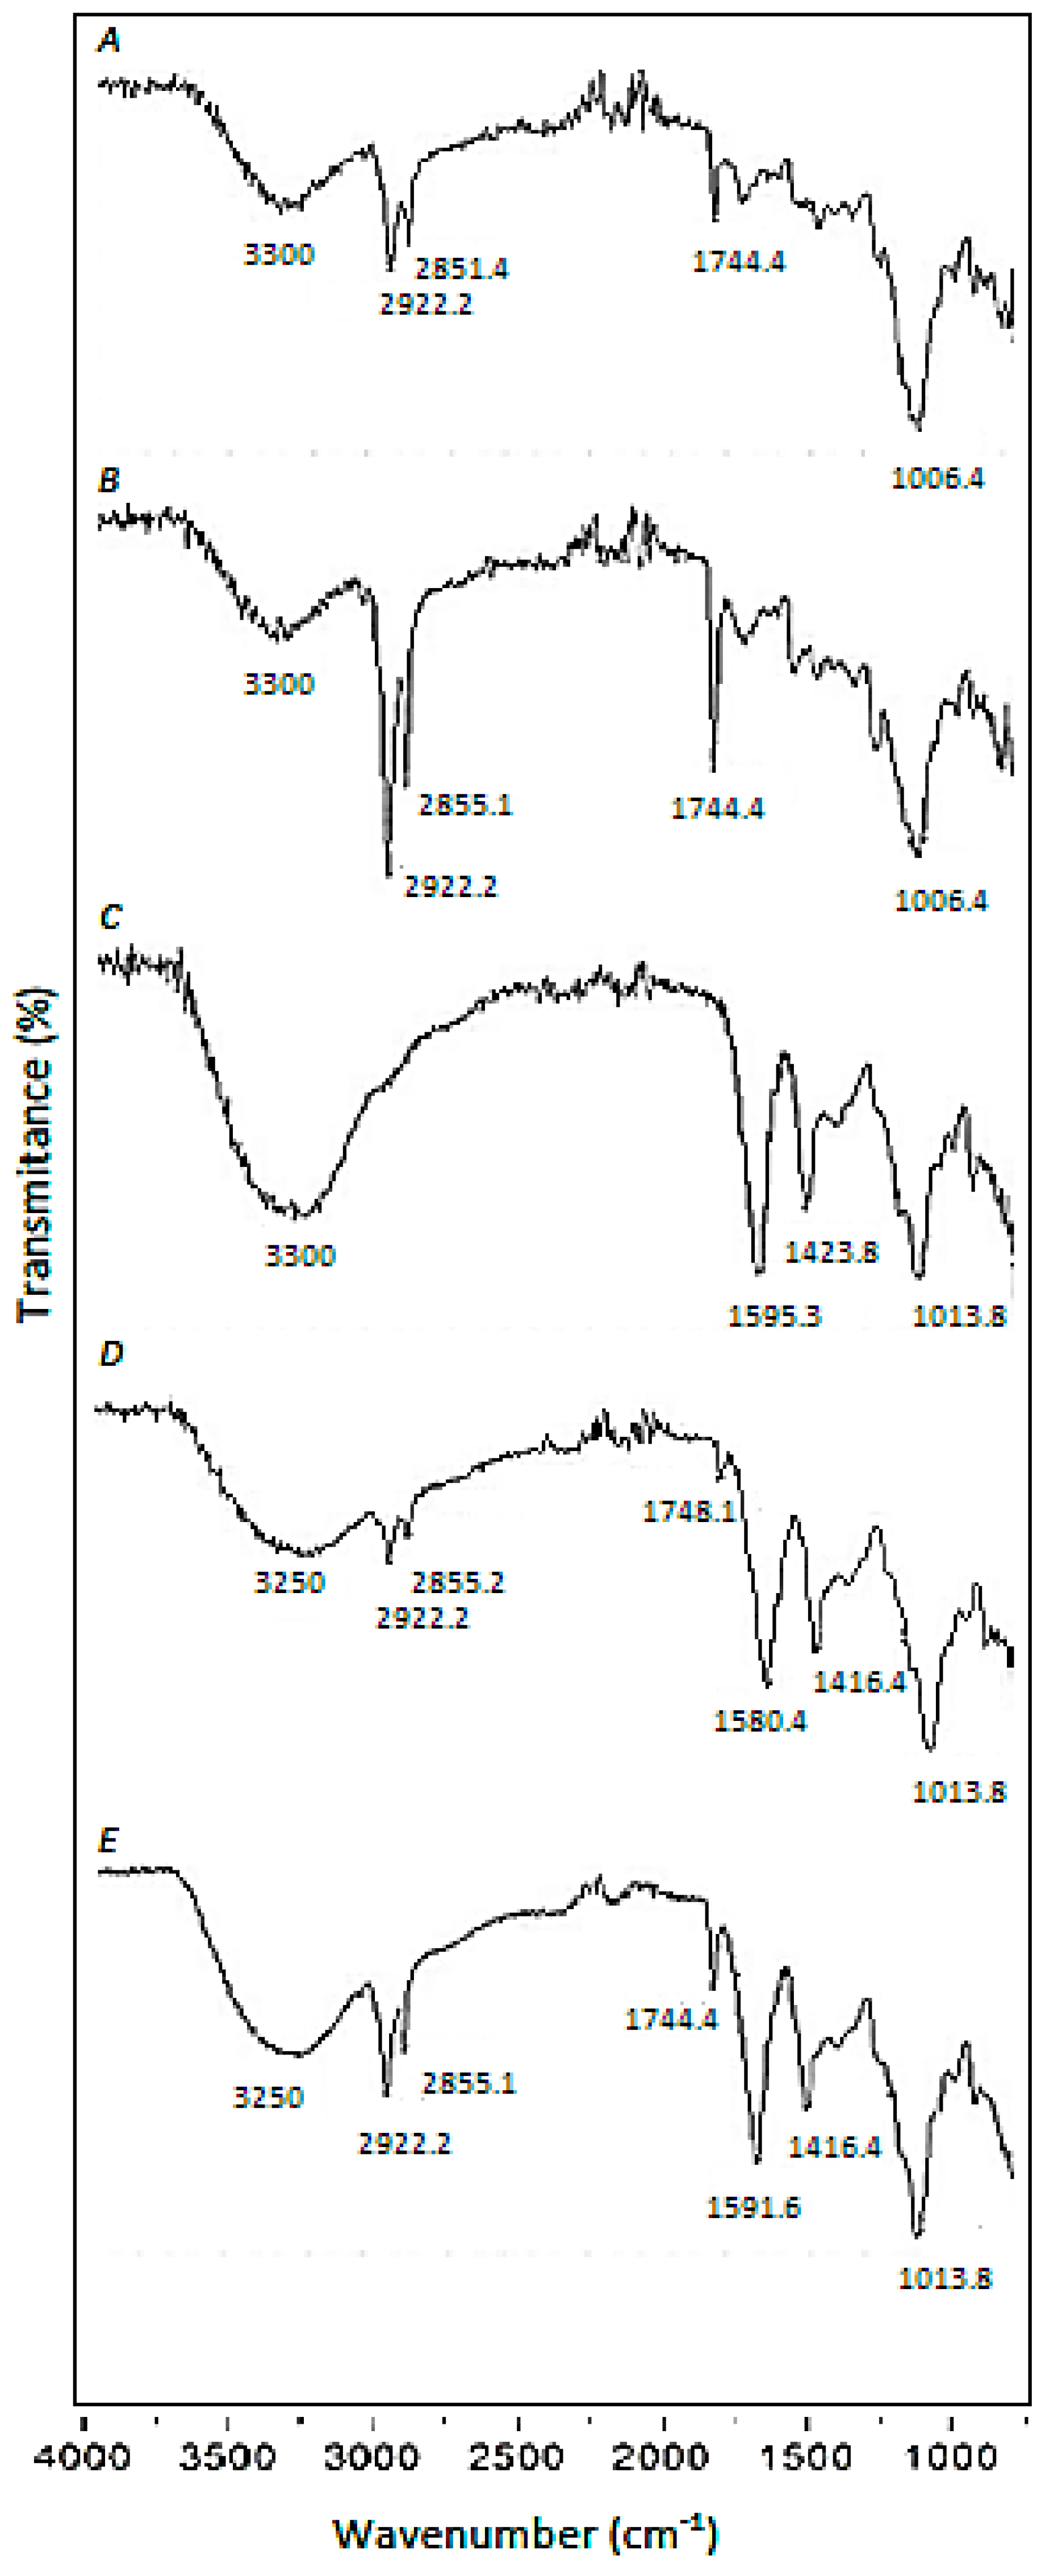
3.1. Characterization of CA Beads, CA-SCGs Beads, Pre-treated SCGs and Raw SCGs
The broadband approximately at 3300 cm
−1, which appears in all the spectra shown (
Figure 1A–E), is mainly attributed to the presence of –OH groups in SCGs and CA, but in the case of SCGs (
Figure 1A,B), it can include a minor contribution of –NH functional groups [
24].
Three sharp bands at 2922 cm
−1, 2855 cm
−1, and 1744 cm
−1 are characteristic of the SCGs (
Figure 1A,B). They also appear in CA-SCGs (3:3) beads and CA-SCGs (3:10) beads (
Figure 1D,E). The bands at 2922 cm
−1 and 2855 cm
−1 are attributed to asymmetric and symmetric stretching of C–H bonds in aliphatic chains and can be attributed to lipids that are present in large amounts in the SCGs [
25]. The sharp band at 1744 cm
−1 can be attributed to a carbonyl vibration (C=O) in aliphatic esters or in triglycerides, for this reason, this band is also attributed to lipids [
25].
The CA beads have characteristic sharp bands at 1595 cm
−1 and 1423 cm
−1, which can be attributed to –COO
− (asymmetric stretching) and –CH
2 (bending) [
19]. These bands appear in CA-beads (
Figure 1C), CA-SCGs (3:3) beads (
Figure 1D), and CA-SCGs (3:10) beads (
Figure 1E). The band related to
–COO− (1595 cm−1) also appears in SCGs, but with very low intensity.
Another sharp band is at 1013 cm
−1; this band also appears in all the spectra that contain CA, SCGs or both (
Figure 1A–E). This band at 1013 cm
−1 can be attributed to C–O–C (stretching) vibrations [
19,
25].
The presence of –NH functional groups and lipids in the CA-SCGs beads can support the idea of a more heterogenous surface for adsorption by the CA-SCGs beads in comparison to the CA beads. This is because CA is a polysaccharide without lipids or amino groups.
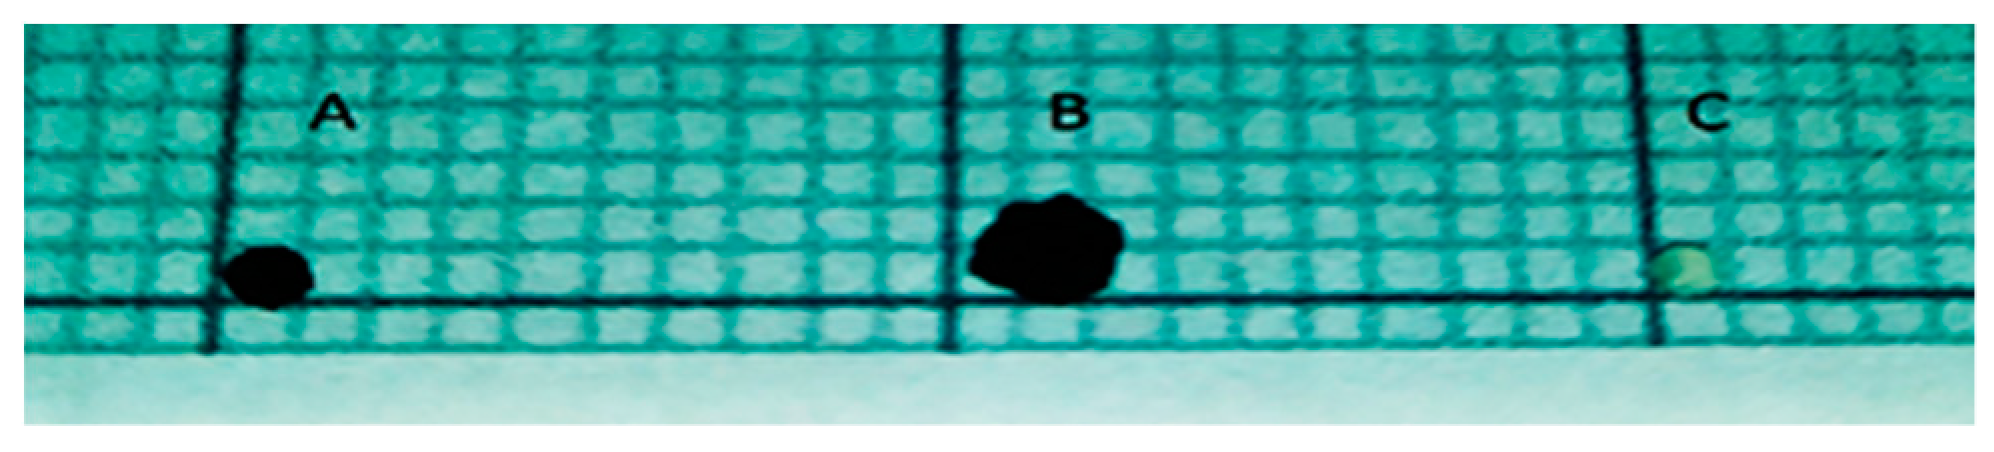
The
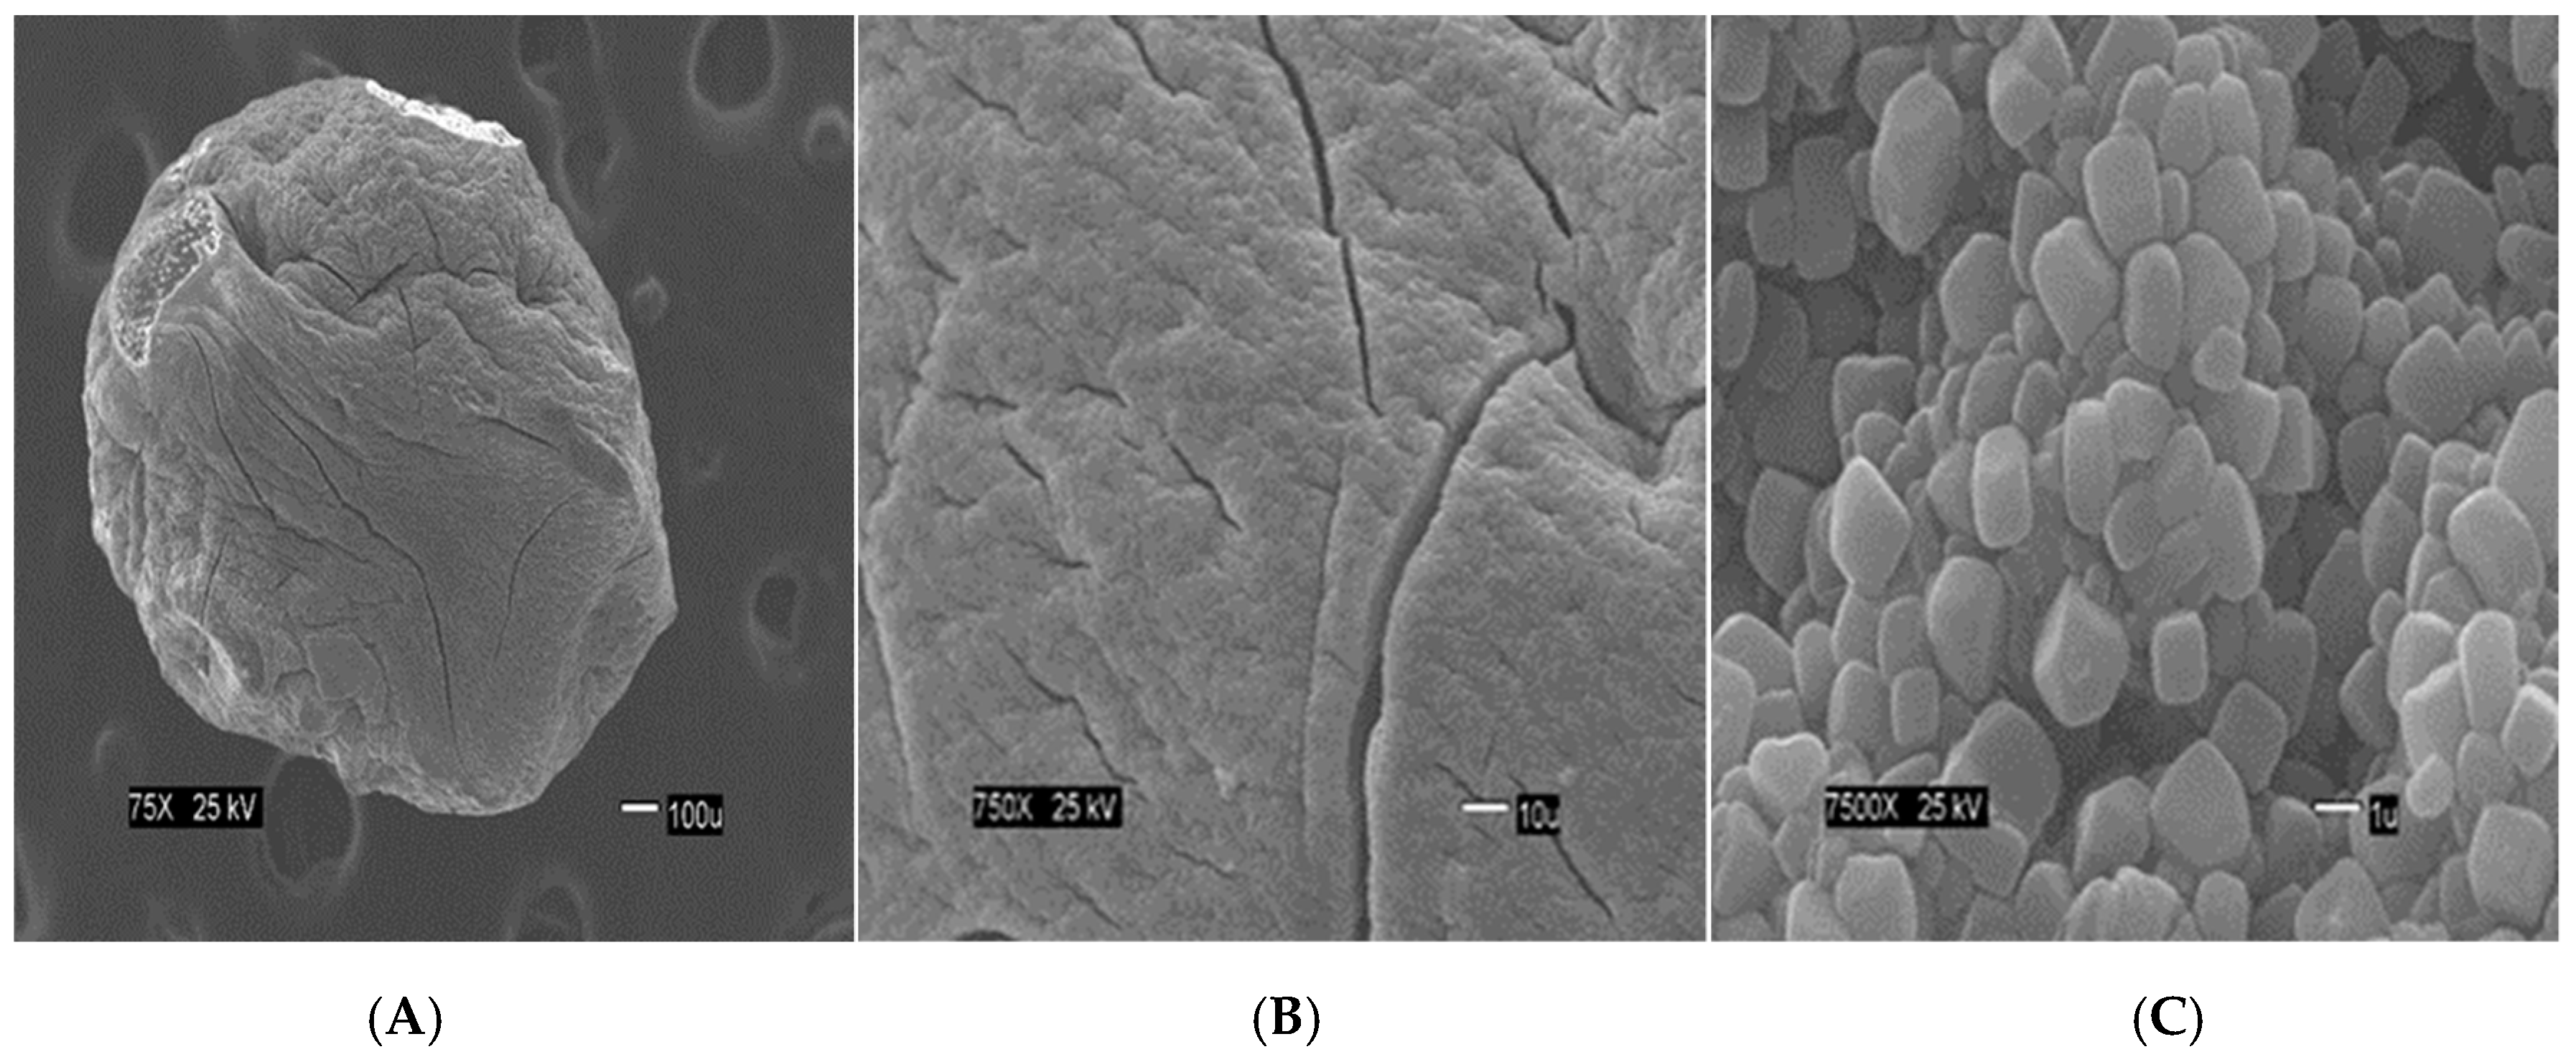
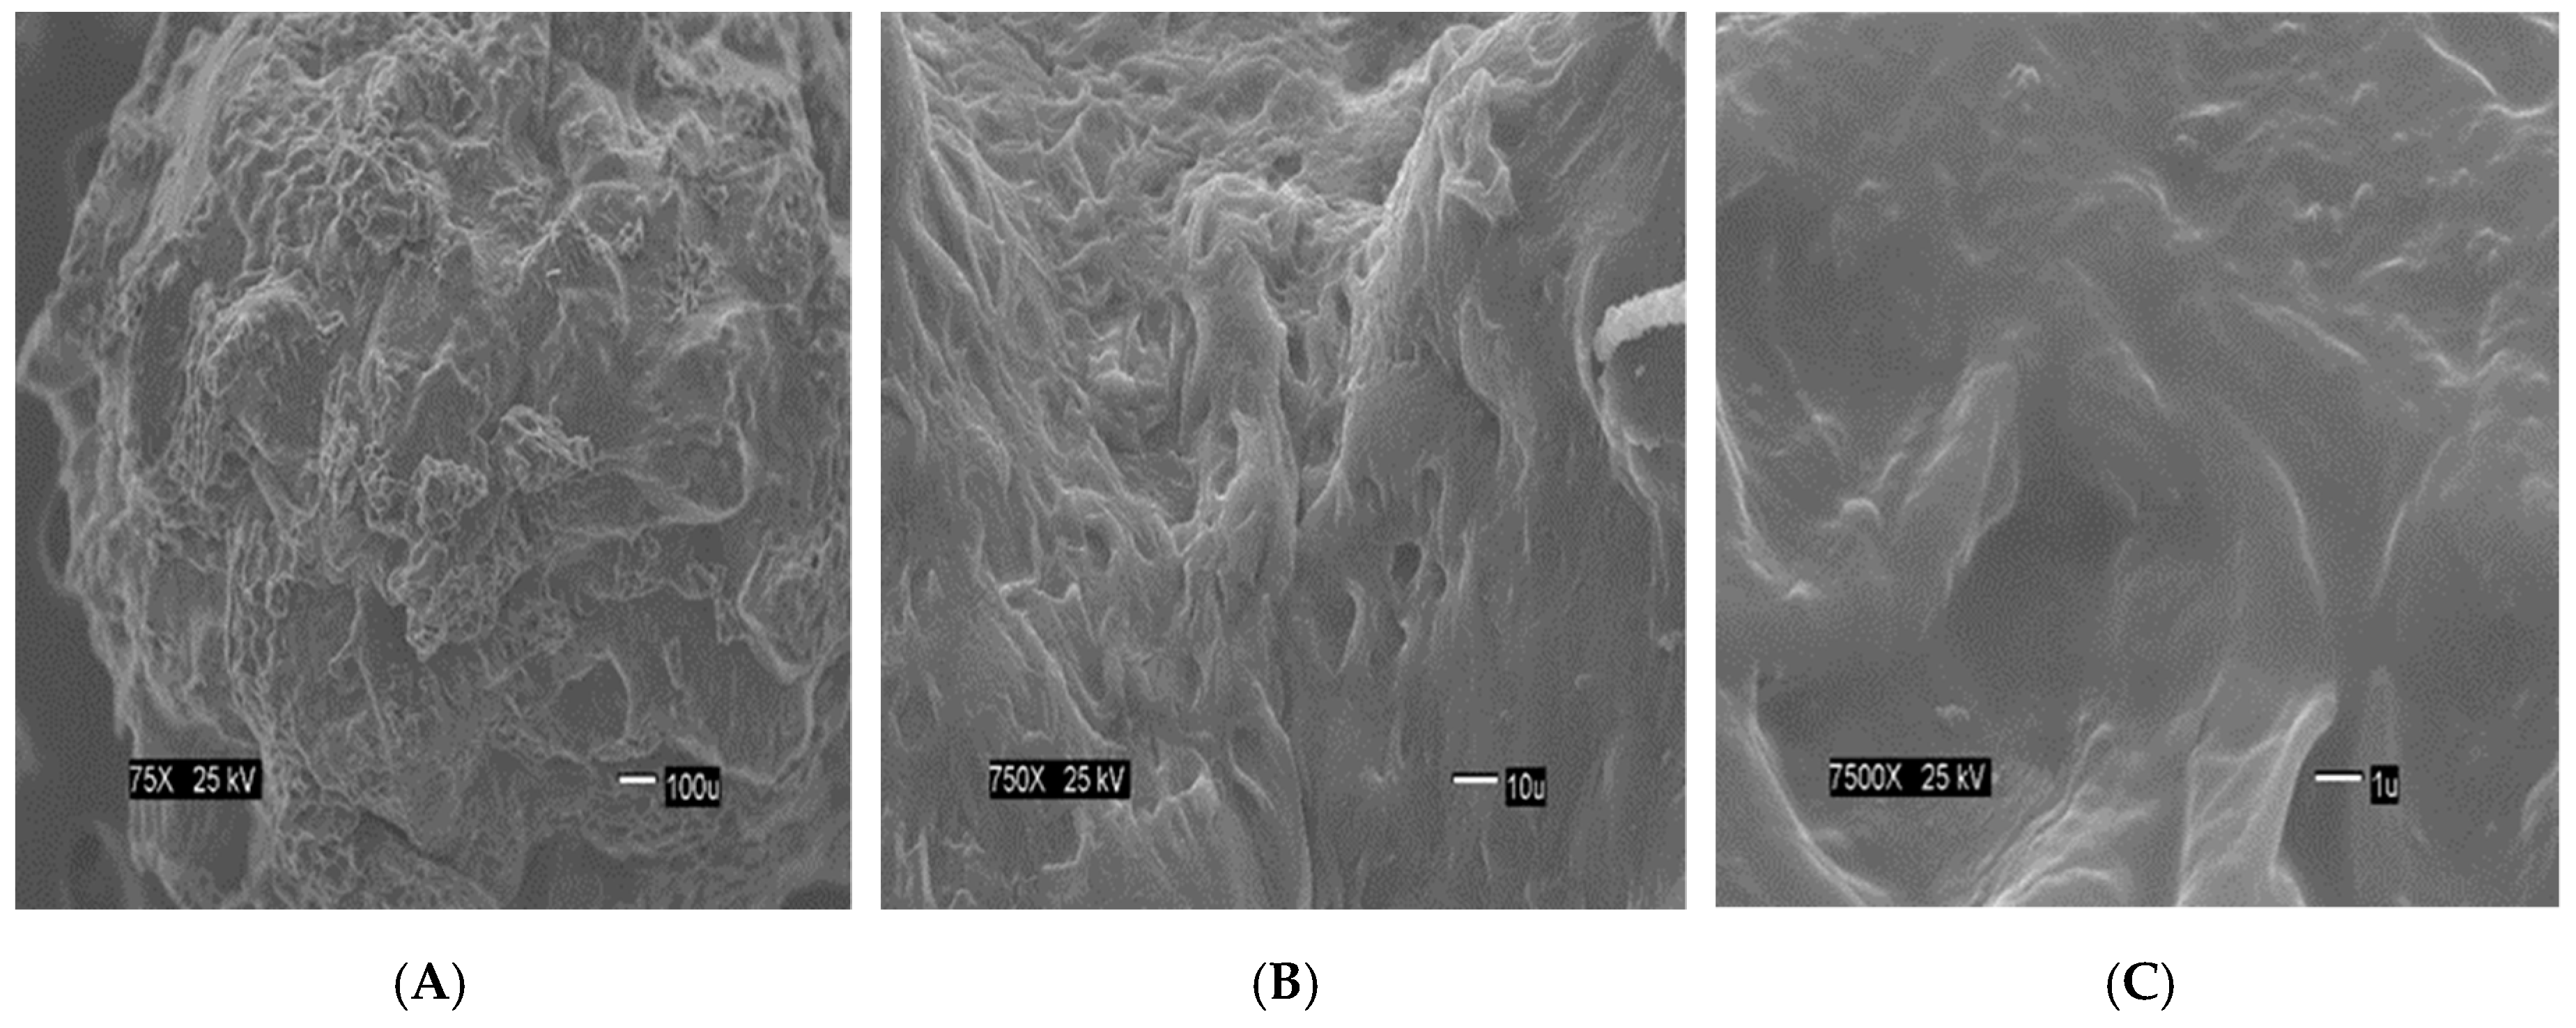
Figure 2 show the size of the beads. The SEM images show differences in the surface morphology of the beads. At the lowest magnification (75×), the surface of the CA beads (
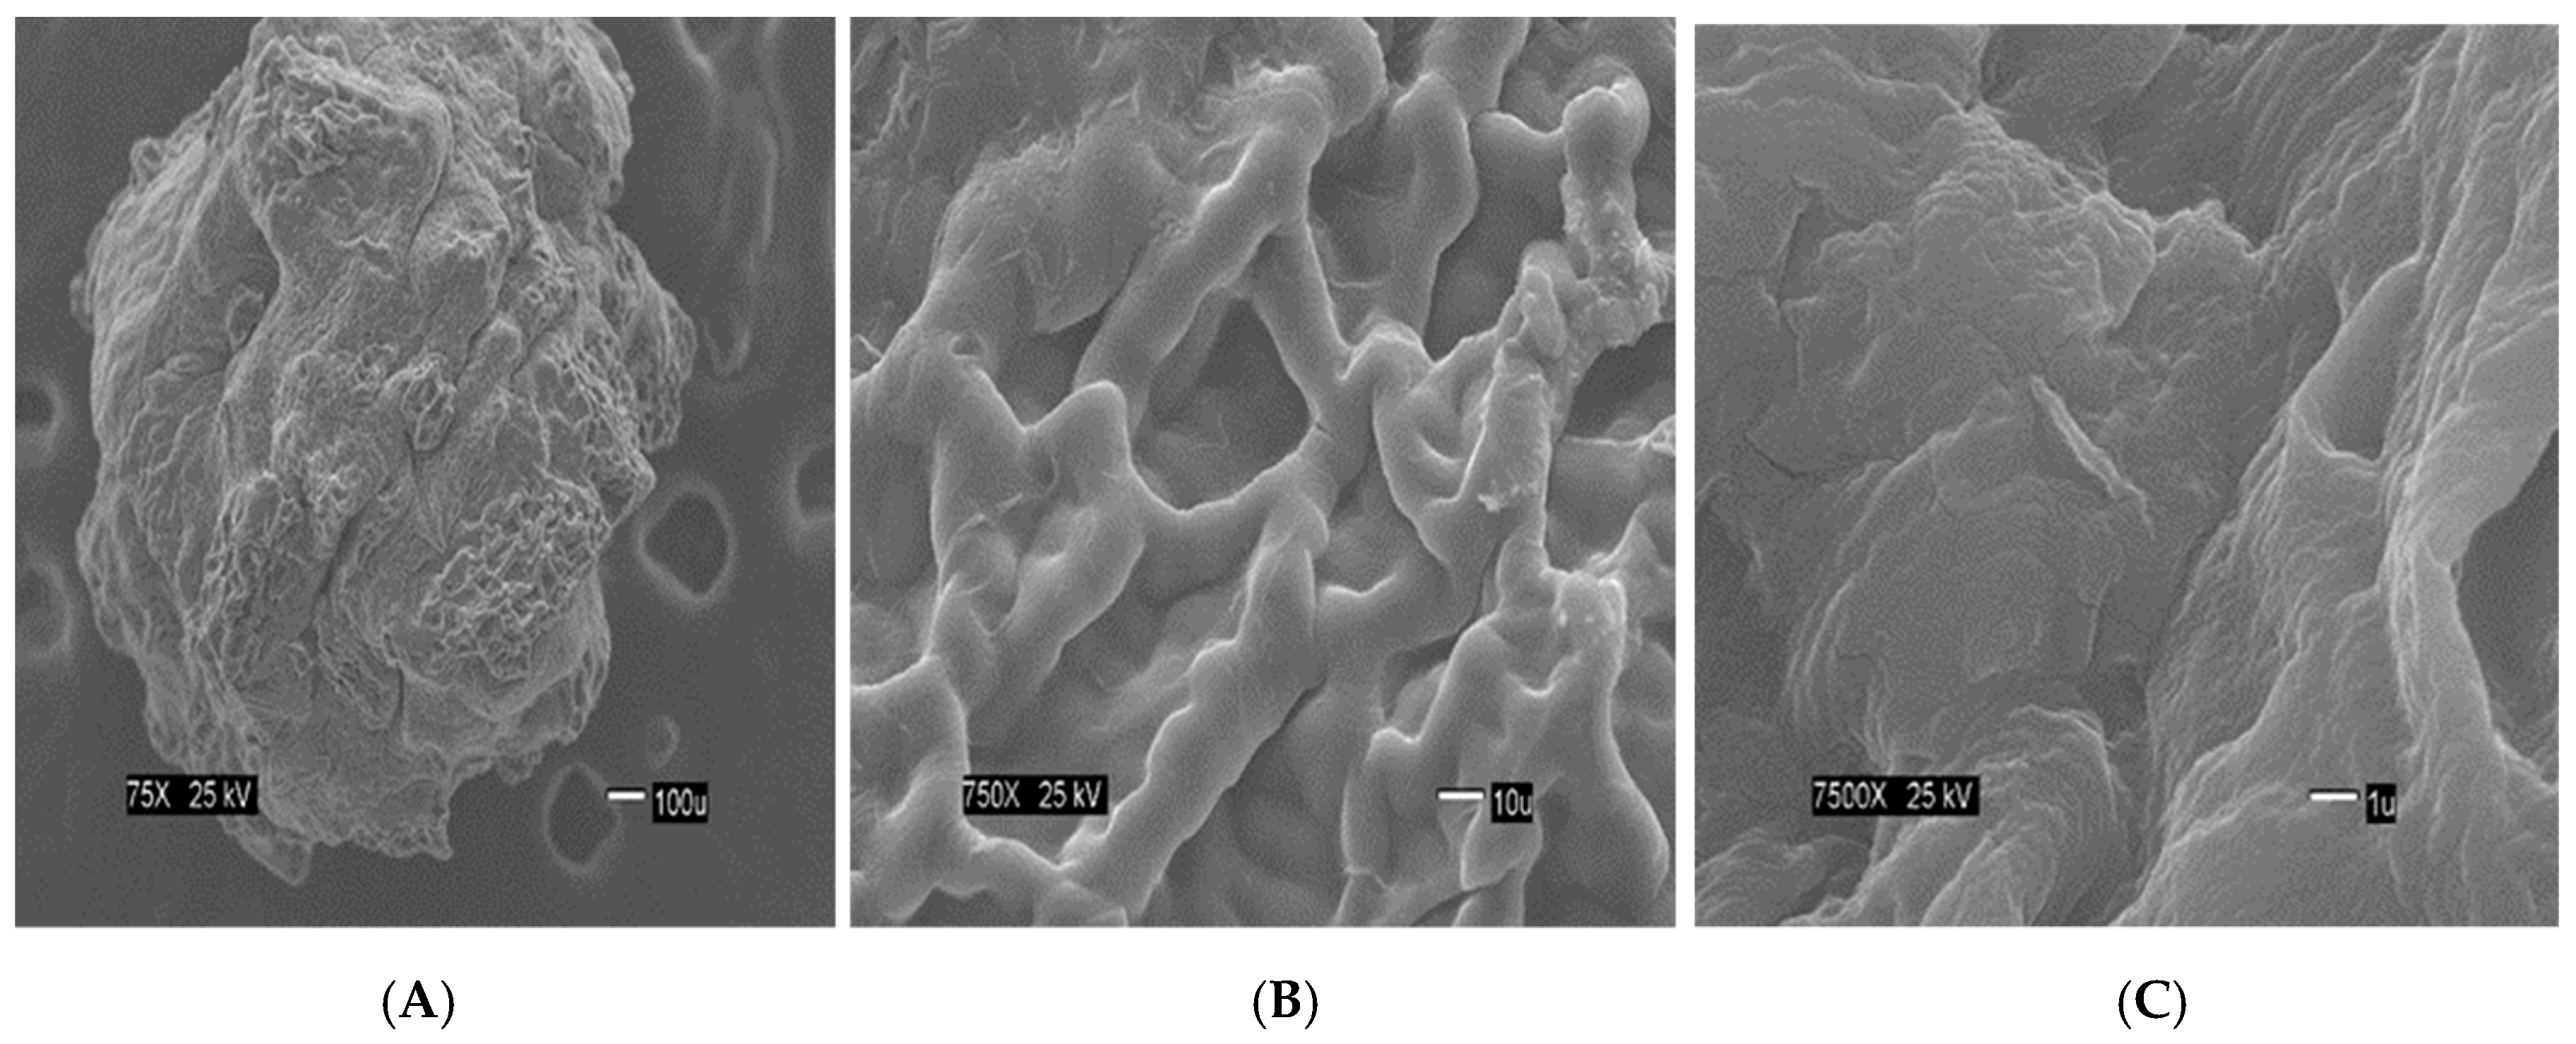
Figure 3A) seems flat with some cracks, but without much porosity. The surfaces of the CA-SCGs (3:3) beads (
Figure 4A) and the CA-SCGs (3:10) beads (
Figure 5A) look rough and porous. At an increment of 10 times the magnification (750×), the surface of the CA beads (
Figure 3B) keeps the flat appearance, but with more visible cracks. At this magnification, the surface of the CA-SCGs (3:3) beads (
Figure 4B) looks branched, while the surface of the CA-SCGs (3:10) beads (
Figure 5B) does not look branched, but looks porous. At the highest magnification (7500×), the appearance of the surface of the CA beads (
Figure 3C) is no longer a flat surface. At this magnification, the porosity in the surface of the CA beads can be seen. The surface of the CA-SCGs (3:3) beads (
Figure 4C) loses its branching appearance, but some porosity and roughness can be still observed. The surface of the CA-SCGs (3:10) beads (
Figure 5C) exhibits less roughness and porosity than the surface of the CA-SCGs (3:3) beads.
3.3. Analysis of Adsorption Isotherms
An adsorption isotherm could be defined as an equilibrium relationship, since describes how pollutants interact with the adsorbent materials at a constant temperature. In a non-linear form, the isotherm equation is a relation between the amount of pollutant adsorbed at equilibrium versus the concentration of pollutant at equilibrium (
qe vs.
Ce). The units of q
e are milligrams of pollutant per grams of adsorbent (mg/g). The units of
Ce are parts per million (ppm) of pollutant. A variety of equilibrium isotherm models (Langmuir, Freundlich, Brunauer–Emmett–Teller, Redlich–Peterson, Dubinin–Radushkevich, Temkin, Toth, Koble–Corrigan, Sips, Khan, Hill, Flory–Huggins and Radke–Prausnitz isotherm), have been formulated [
26]. In this study, three models were used: Langmuir, Freundlich and Sips.
Langmuir equation, the most used model of adsorption isotherm, assumes monolayer adsorption (the adsorbed layer is one molecule in thickness). The adsorption can only occur at a finite (fixed) number of definite localized sites that are identical and equivalent. No lateral interaction and steric hindrance between the adsorbed molecules. Langmuir isotherm refers to homogeneous adsorption, which each molecule possesses constant enthalpies and sorption activation energy, all sites possess equal affinity for the adsorbate, with no transmigration of the adsorbate in the plane of the surface. The non-linear Langmuir equation is described below, Equation (3) [
15]:
where
qmax is the maximum monolayer coverage capacity (mg/g) and
bL is the Langmuir isotherm constant (L/mg) related to the affinity.
Freundlich equation can be applied to multilayer adsorption, with non-uniform distribution of adsorption heat and affinities over the heterogeneous surface. The stronger binding sites are occupied first, until adsorption energy is exponentially decreased upon the completion of adsorption process. The non-linear Freundlich equation is described below, Equation (4) [
5]:
where
Kf is the adsorption capacity (L/mg) and 1/
n is the adsorption intensity, which also indicates the relative distribution of the energy and the heterogeneity of the adsorbate sites, becoming more heterogeneous as its value gets closer to zero.
Sips equation is a combination of the Langmuir and Freundlich isotherms. The non-linear Sips equation is described below, Equation (5) [
27,
28]:
where
qe is the adsorbed amount at equilibrium (mg/g),
Ce the equilibrium concentration of the adsorbate (mg/L),
qmax is the Sips maximum adsorption capacity (mg/g),
bS is the Sips equilibrium constant (L/mg), and 1/
n is the Sips model exponent. Values for 1/
n < 1 indicate heterogeneous adsorbents, while values closer to 1.0 indicate a material with homogenous binding sites. If 1/
n = 1, the Sips model is reduced to the Langmuir equation [
27].
The Sips model is appropriate for predicting adsorption on heterogeneous surfaces while the model at the same time avoids the limitation of increased adsorbate concentration normally associated with the Freundlich model. At low adsorbate concentrations, the Sips model reduces to the Freundlich model, but at high concentrations of adsorbate, it predicts the Langmuir model (monolayer adsorption) [
29]. For heterogenous surfaces, the problem of the continuing increase in the adsorbed amount with an increase in concentration in the Freundlich equation, is corrected by the Sips equation because it has a finite limit when the concentration is sufficiently high [
30]. The parameters of the Sips isotherm are dependent of the concentration of adsorbate. This could explain the behavior of the CA/SCGs beads (3:10) in the plot of the
Figure 6 (adsorbent dose effect).
Non-lineal forms were used for the three models. All model parameters were evaluated by nonlinear regression using an optimization routine to minimize the sum of squared errors (SSE) in the concentration range used in adsorption experiments by the Microsoft Excel solver tool. This method seeks to minimize the sum of the squared errors (SSE) between observed and calculated values of the dependent variable. The sum of squared errors (SSE) was calculated from the following equation, Equation (6) [
30]:
where q
exp is the experimental data, and q
model is the value predicted by the models at corresponding C
e. In order to compare the applicability of isotherm equations and fitting it to the data; nonlinear correlation coefficient R
2, relative error ∆
q and nonlinear chi-square test χ
2 were calculated.
Relative error ∆
q, Equation (7) [
27]:
Nonlinear chi-square test χ
2, Equation (8) [
31]:
Nonlinear correlation coefficient R
2, Equation (9) [
31]:
where, q
e.exp is the equilibrium sorption capacity found from the batch experiment, q
e.model is the prediction from the isotherm model for corresponding to C
e, and n is the number of observations. The
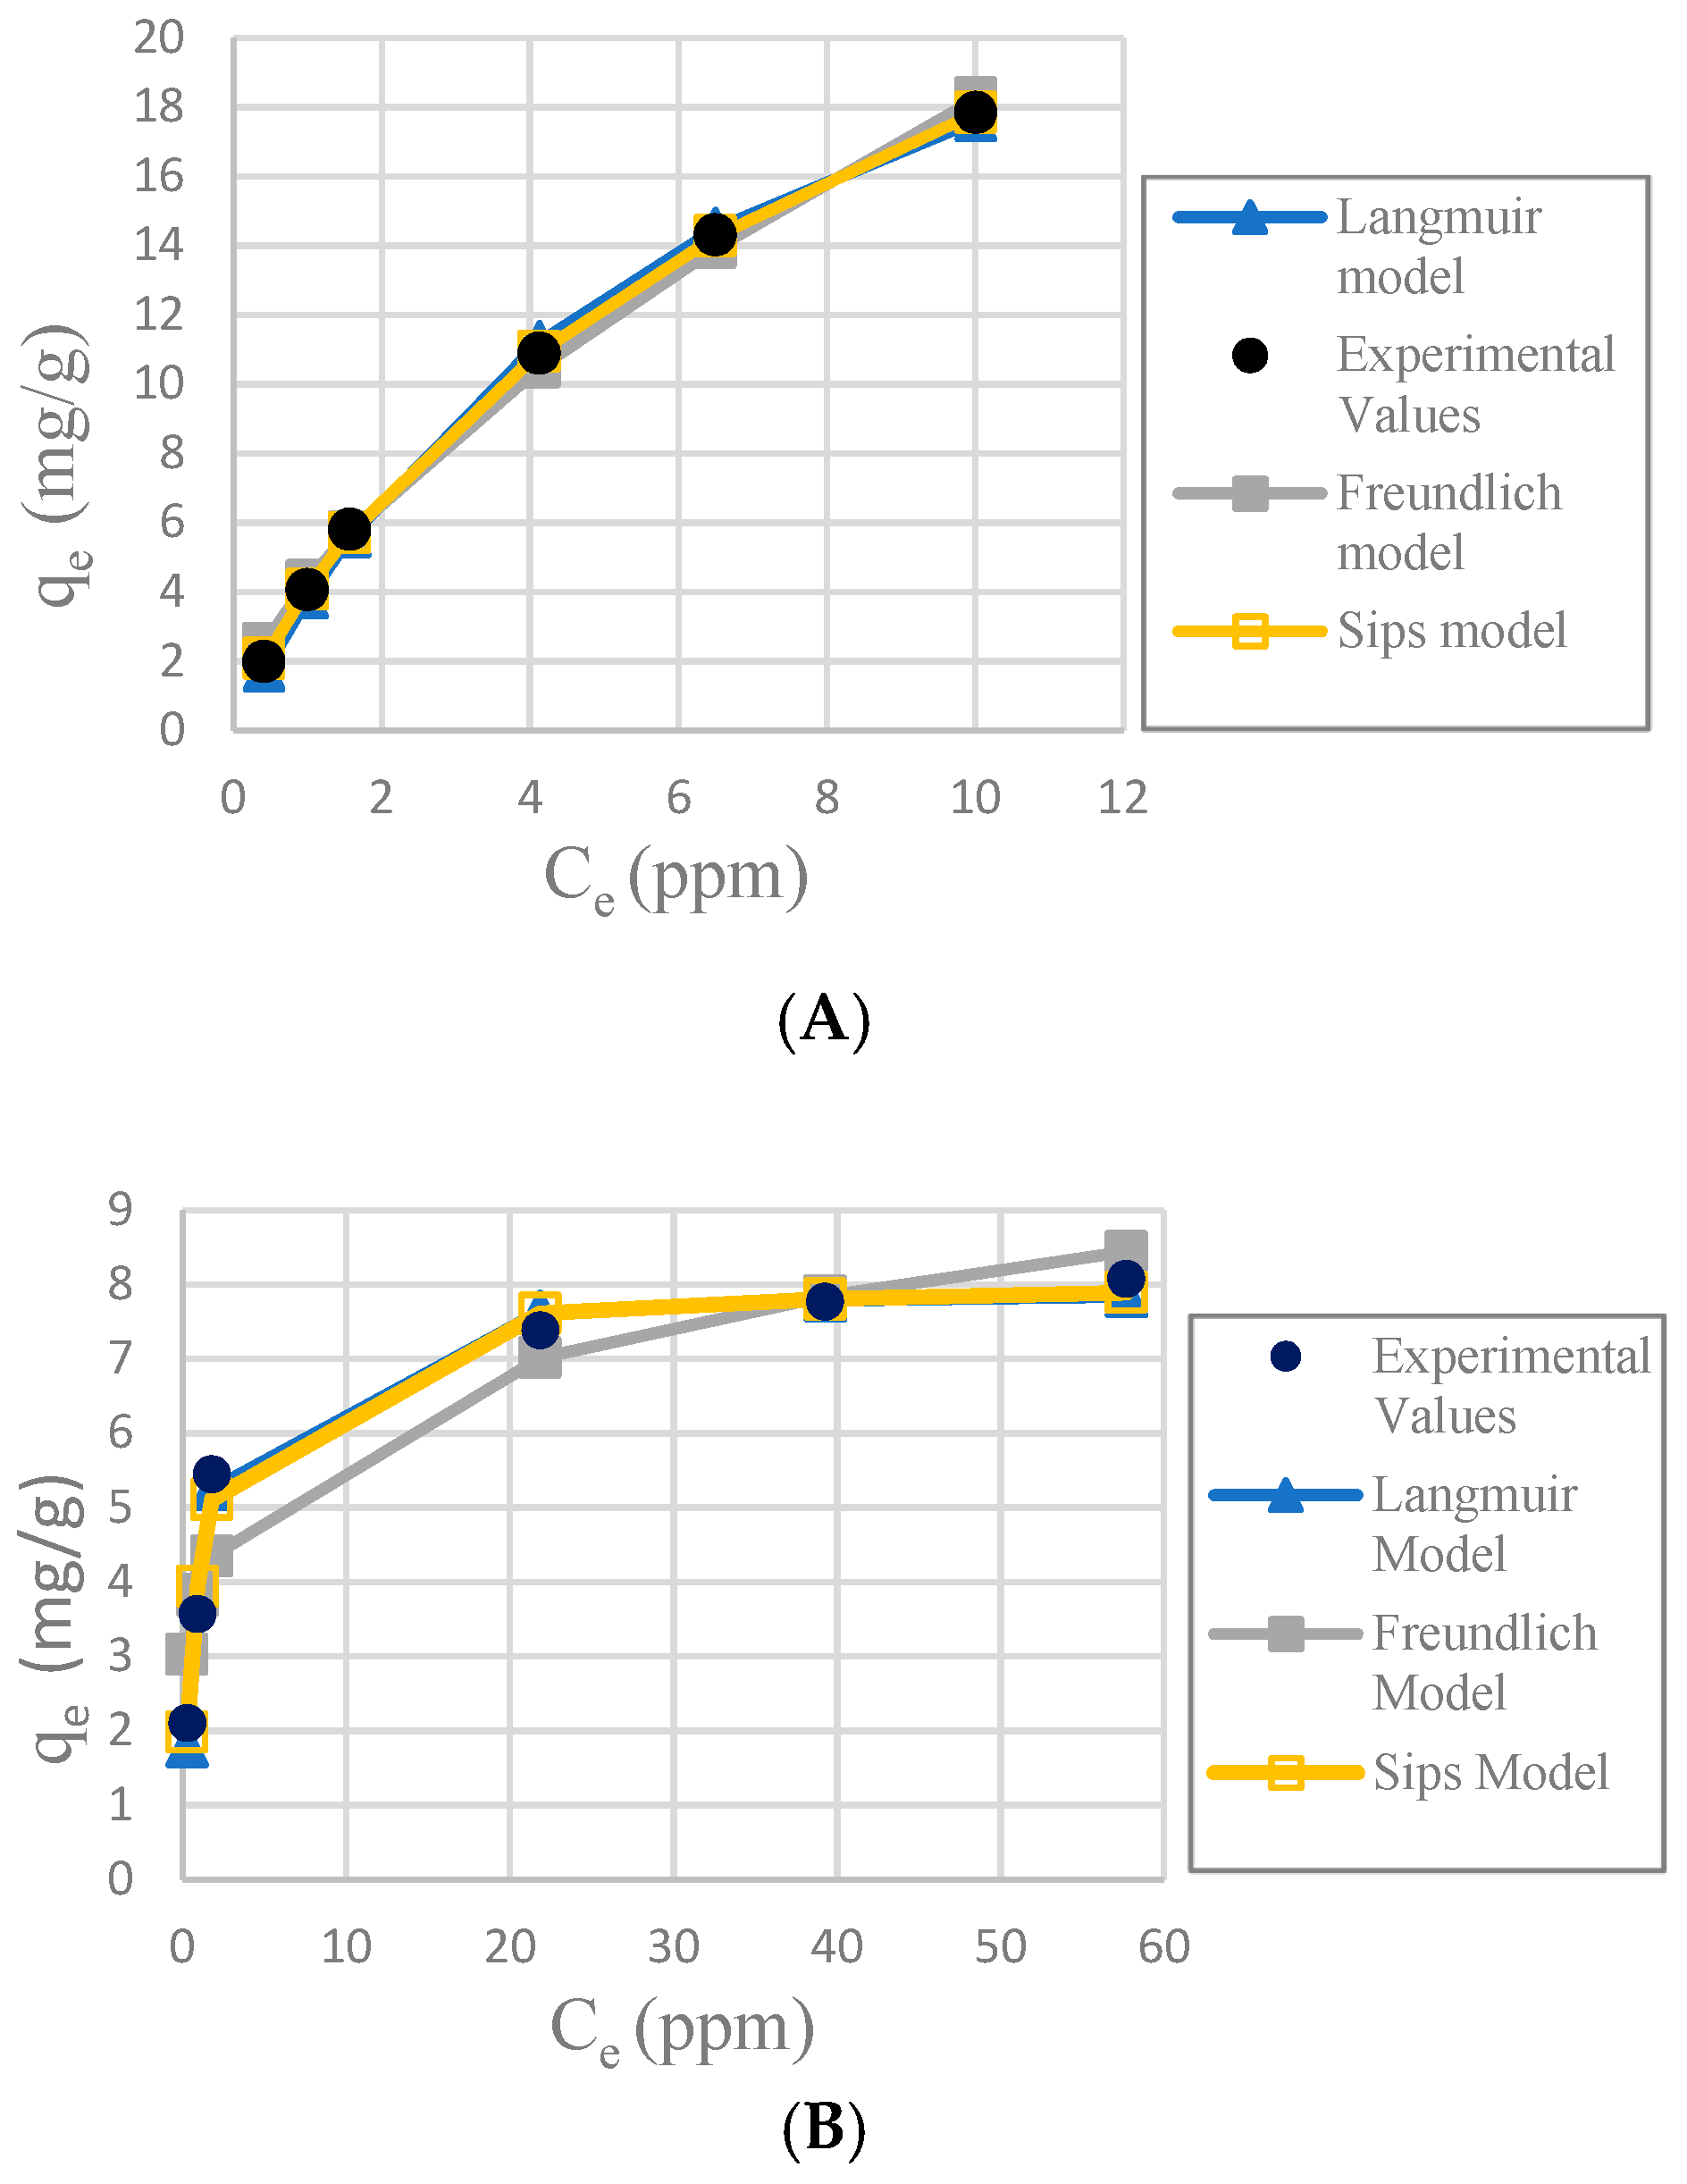
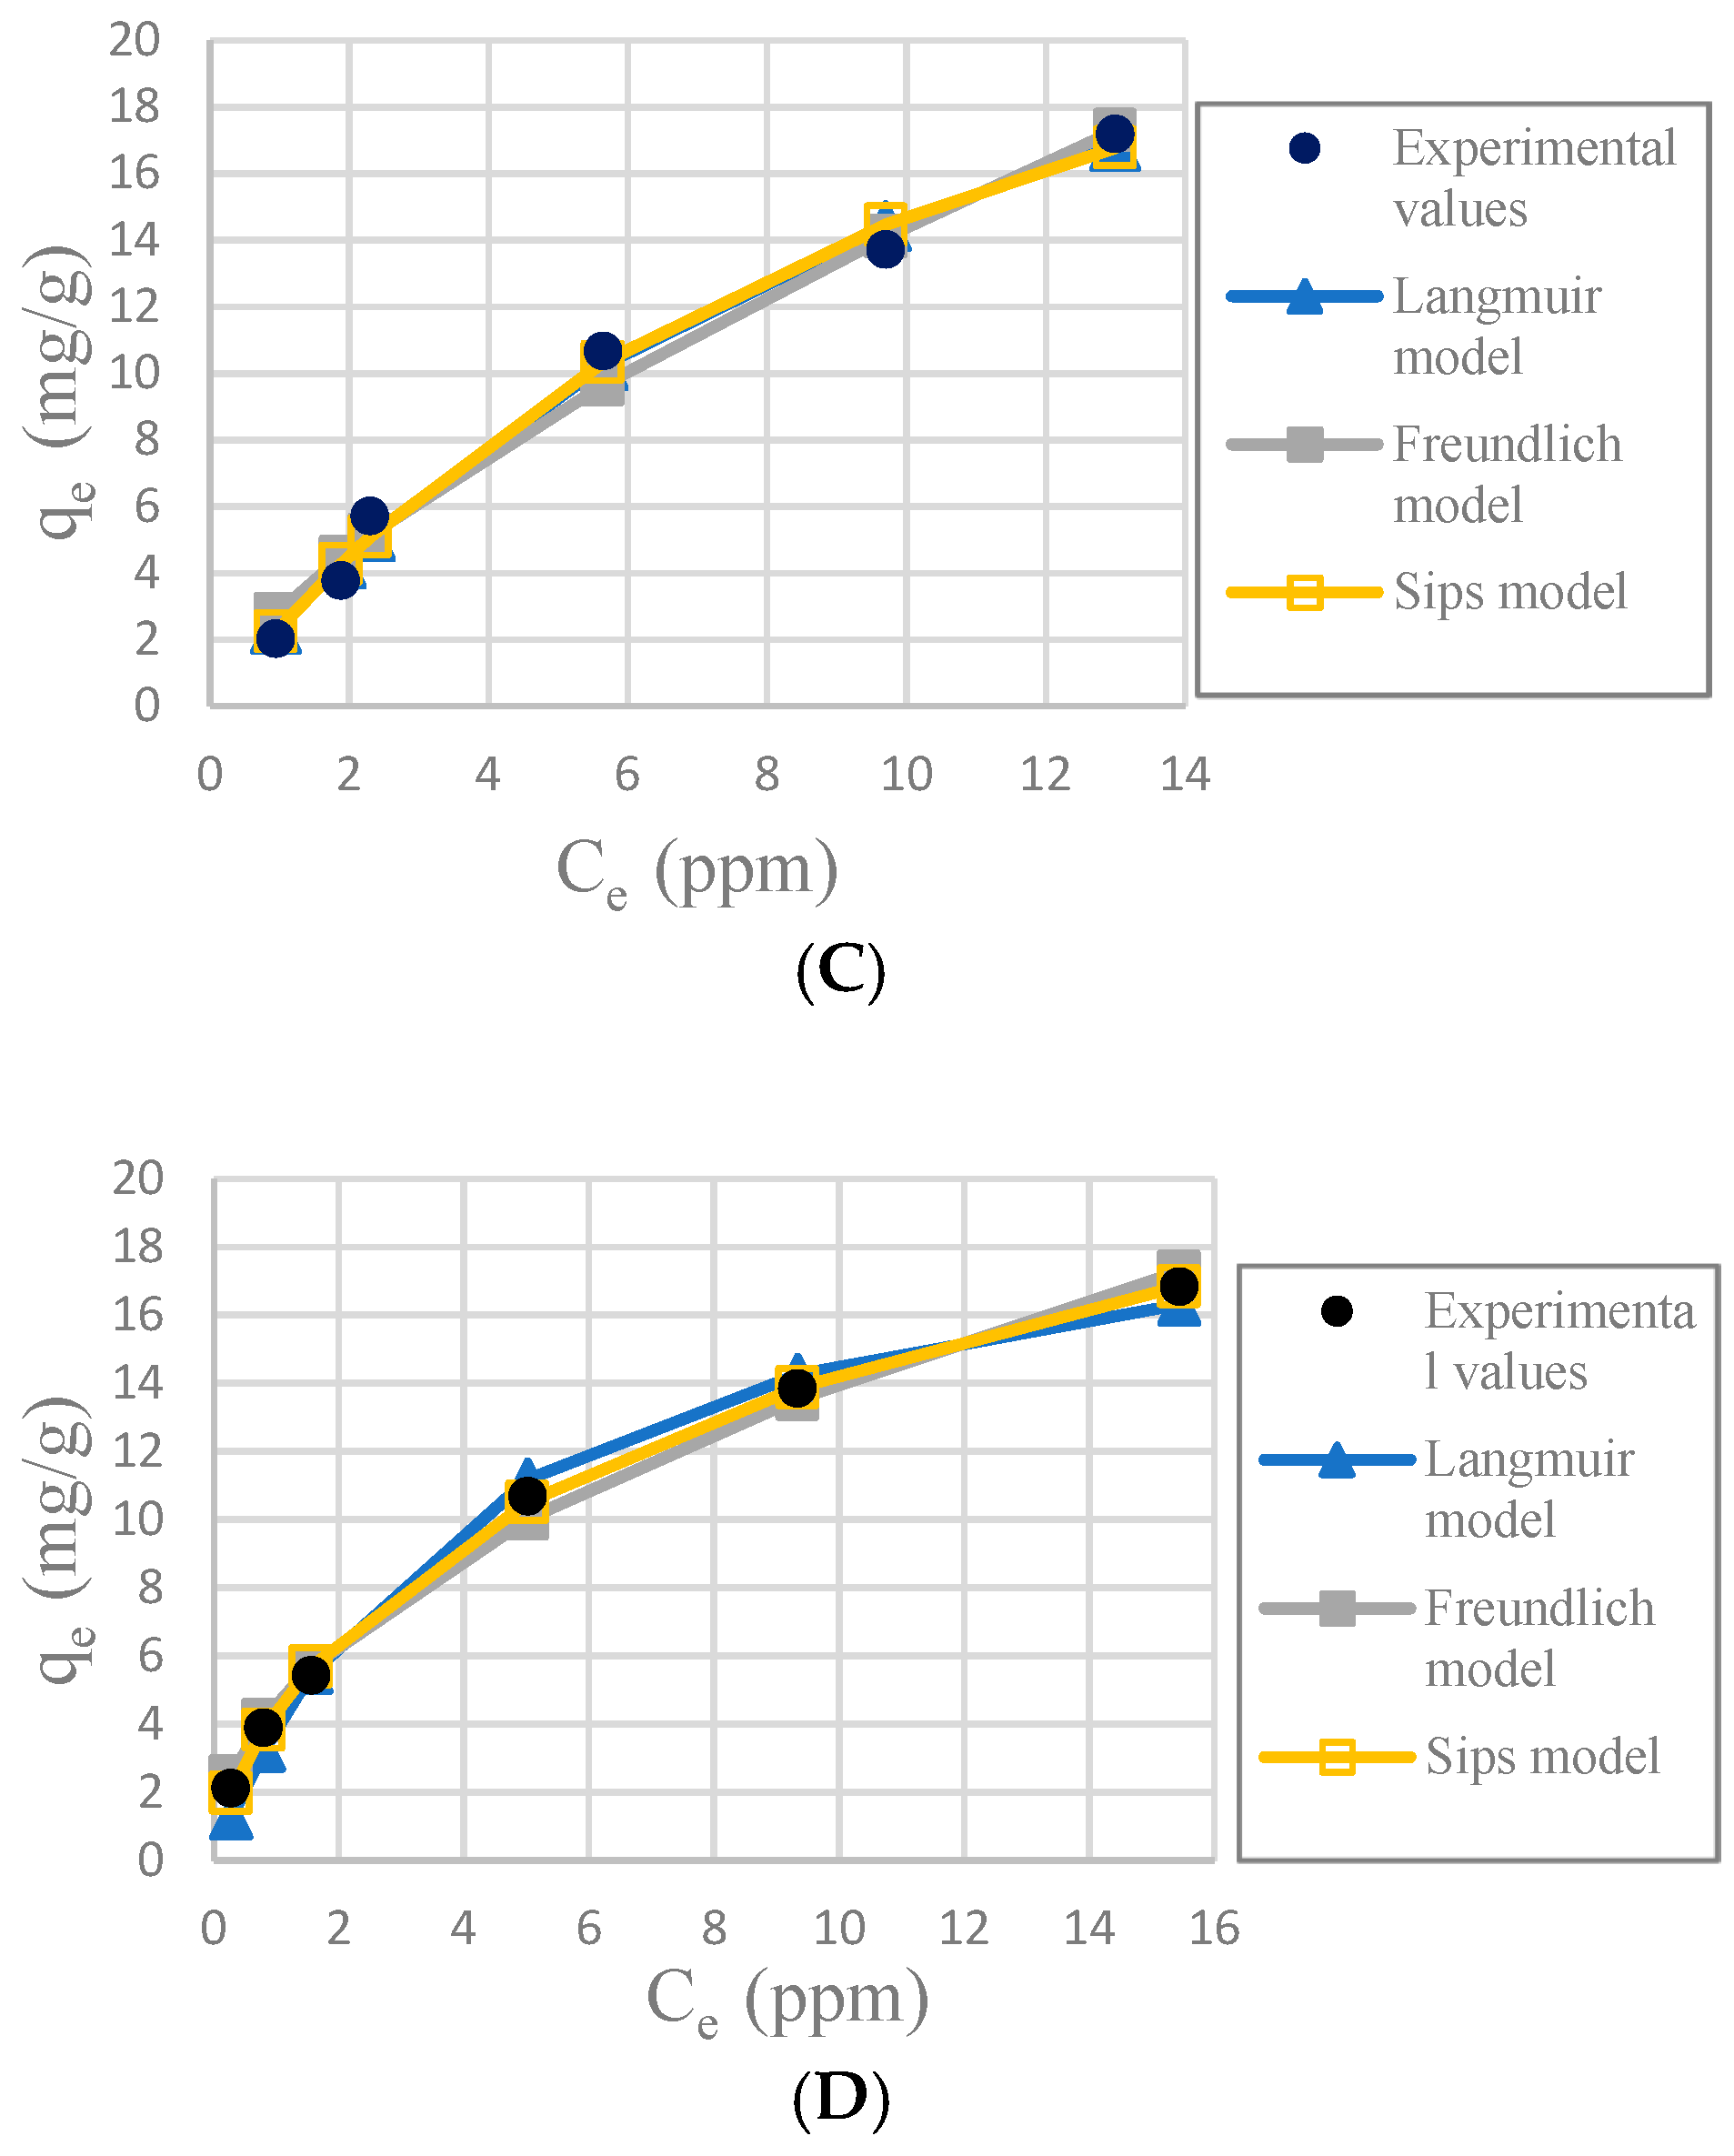
Table 1 shows the results of the adsorption models for each adsorbent. The
Figure 7 shows the graphs from the equations of the models for each adsorbent.
3.4. Comparison of Isotherms
It was determined that the best fit adsorption isotherm model for all the adsorbents used in this study was Sips, considering the nonlinear correlation coefficient R2, relative error ∆q and nonlinear chi-square test χ2. Sips has better values in the three parameters. The fitness of the other models is more difficult to observe because the three parameters did not always follow the same pattern, but some observations can be made. Freundlich model fit better with CA-SCGs beads (3:3) and CA-SCGs beads (3:10); this is proof of a more heterogenous surface, but it did not fit well for SCGs and CA beads.
The SCGs and CA beads fit better with Langmuir and Sips models. This suggests a more homogeneous surface. The values of the three statistical comparison parameters (R2 nonlinear, χ2 and ∆q) of SCGs and CA beads for the Langmuir and Sips model are similar. In fact, the experimental maximum value of adsorption (mg/g), the Sips qmax (mg/g) and the Langmuir qmax (mg/g) of SCGs; have a similar value around 8.000 mg/g ± standard deviation (8.079 ± 0.074, 8.113 ± 0.191 and 7.964 ± 0.035; respectively). In the case of CA beads, the Sips qmax (mg/g) and the Langmuir qmax (mg/g) for the CA beads are not so different; 30.388 ± 0.731 and 33.263 ± 0.922, respectively. Another factor to consider are the values of 1/n in the Sips model, a factor related to heterogeneity on the surface, for SCGs and CA beads (0.875 and 1.047, respectively). These values are closer to 1 than the values of the CA-SCGs beads. When this value is closer to one, the Sips equation is reduced to the Langmuir equation. The photos of SEM also suggest a more homogeneous surface for the CA beads. The Langmuir and Sips qmax values for CA beads are lower than other values in the literature, but as it was explained in the introduction, many variables in the synthesis of the beads can affect this value and the only purpose of CA in this study is as a matrix of encapsulation of SCGs.
The values of adsorption capacity obtained by the Sips model and the Langmuir model for the CA-SCGs beads are very different. The
qmax values (mg/g) of the Sips model for CA-SCGs (3:3) and CA-SCGs (3:10) beads are 42.059 ± 0.802 and 35.669 ± 0.973, respectively. The
qmax values (mg/g) of the Langmuir model for CA-SCGs (3:3) and CA-SCGs (3:10) beads are 29.266 ± 0.683 and 20.921 ± 0.222, respectively. Although the experimental results of the isotherms show a better correlation with the Sips model, the results of the Langmuir model cannot be ignored in the analysis of the isotherms, especially in the case of the CA-SCGs (3:10) beads. First,
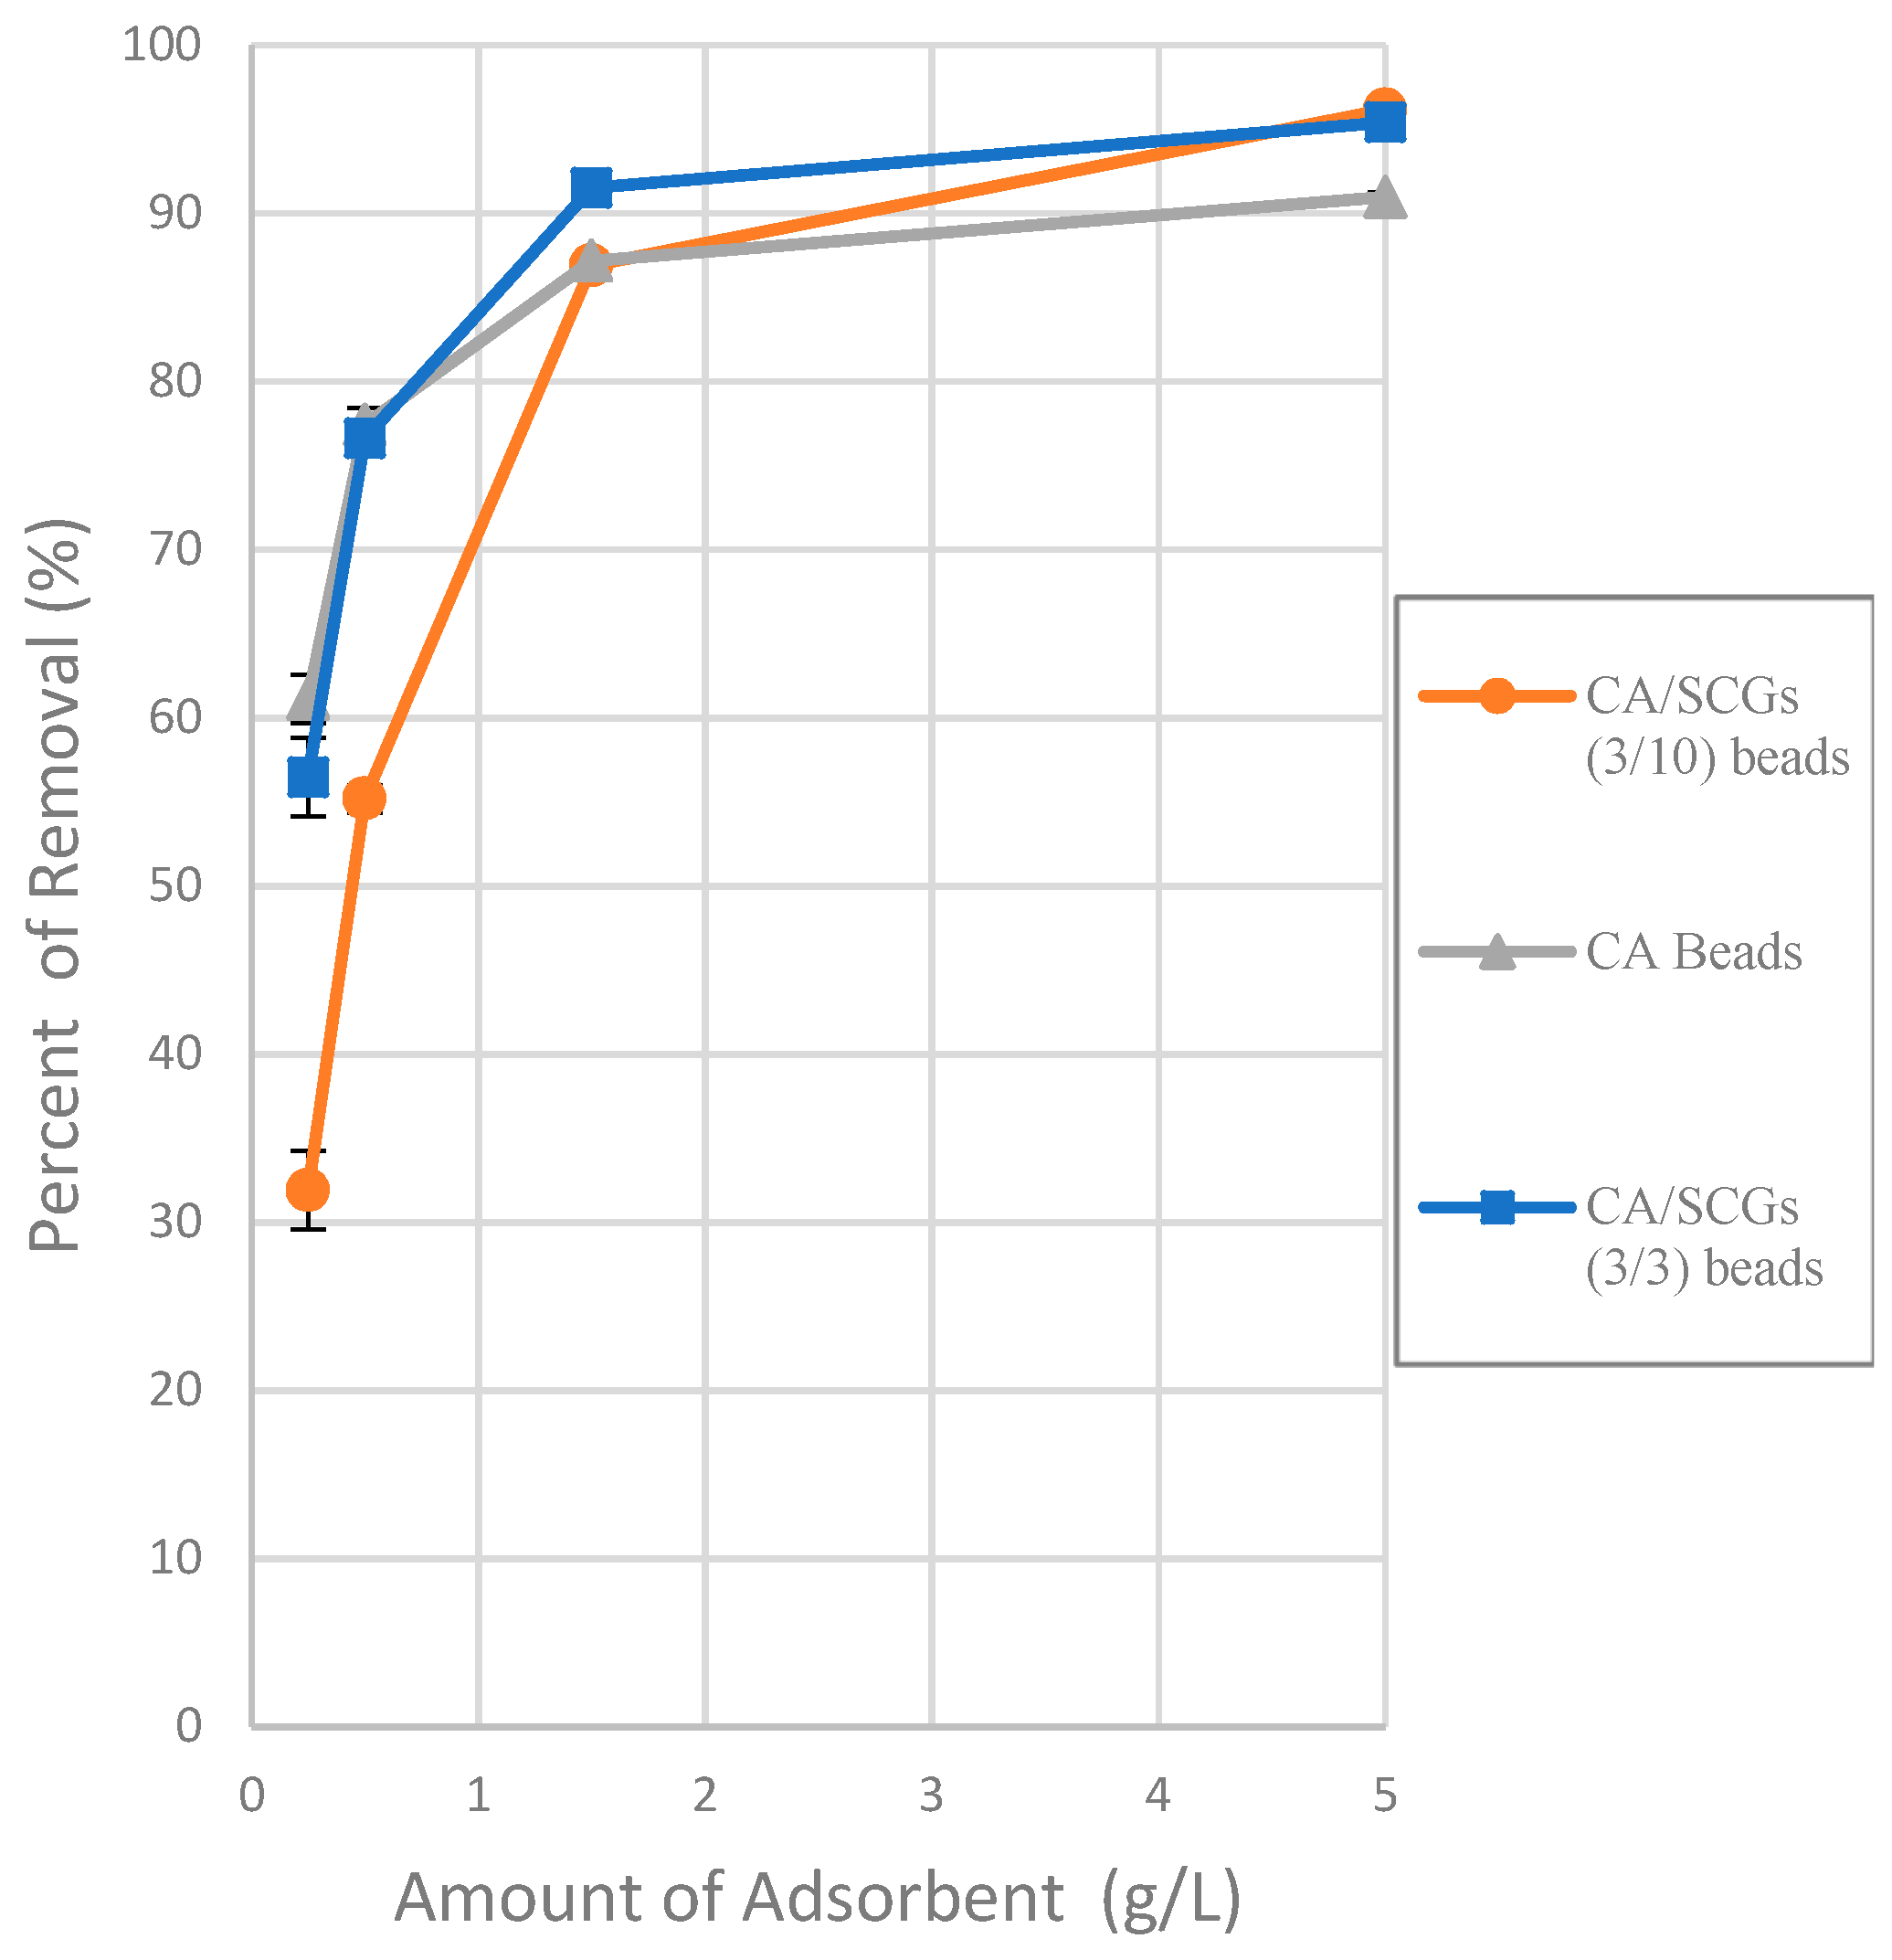
Figure 6 (The effect of different doses of beads in a solution of 20 ppm Cu
2+) shows that the smallest amount of CA-SCGs (3:10) beads in the solution of 20 ppm Cu
2+ has a diminished capacity of adsorption than the same amount of CA beads in the same solution, in spite of the CA-SCGs (3:10) beads having a somewhat higher adsorption capacity than the CA beads according the Sips model used for the analysis of the isotherms (35.669 mg/g ± 0.973 mg/g versus 30.388 mg/g ± 0.731 mg/g). In the same figure, it can be seen that while the amount of CA-SCGs (3:10) beads is increasing, its capacity of adsorption equals and exceeds the capacity of adsorption of the CA beads. Using the lowest amount of adsorbent in
Figure 6, would be equivalent to a concentration of 400 ppm of adsorbate, that is out of the range of concentrations of the isotherms in this study (10 ppm to 100 ppm Cu
2+). The parameters of the Sips model are dependent of the level of concentration of adsorbate.
The CA-SCGs (3:3) beads have a good fitting with the Langmuir model. On the other hand, the CA-SCGs (3:10) beads did not have a good fitting with this model. Nevertheless, both types of beads show similar fitting with the Freundlich model (
Table 1). This fact and other observations in this study such as the photos of SEM, suggest a more heterogenous than homogenous surface for the CA-SCGs (3:3) beads. The differences between the Langmuir model and the Sips model for the CA-SCGs beads can be the product of the heterogeneous surface of these beads. This heterogeneity is supported by the better fitting with the Freundlich model of these beads in comparison with SCGs and CA beads. The SCGs and the CA beads did not have a good fitting with the Freundlich model. This is seen especially in the similar large values of ∆
q (%) and χ
2 for SCGs and the CA beads using the Freundlich model (
Table 1). Also, as it was mentioned before, both adsorbents have a value of 1/
n in the Sips model closer to 1. Another reason to support the idea of a heterogeneous surface is the combination of amino functional groups and lipids from SCGs with the structure of CA in the CA-SCGs beads, as was mentioned in the FT-IR characterization.
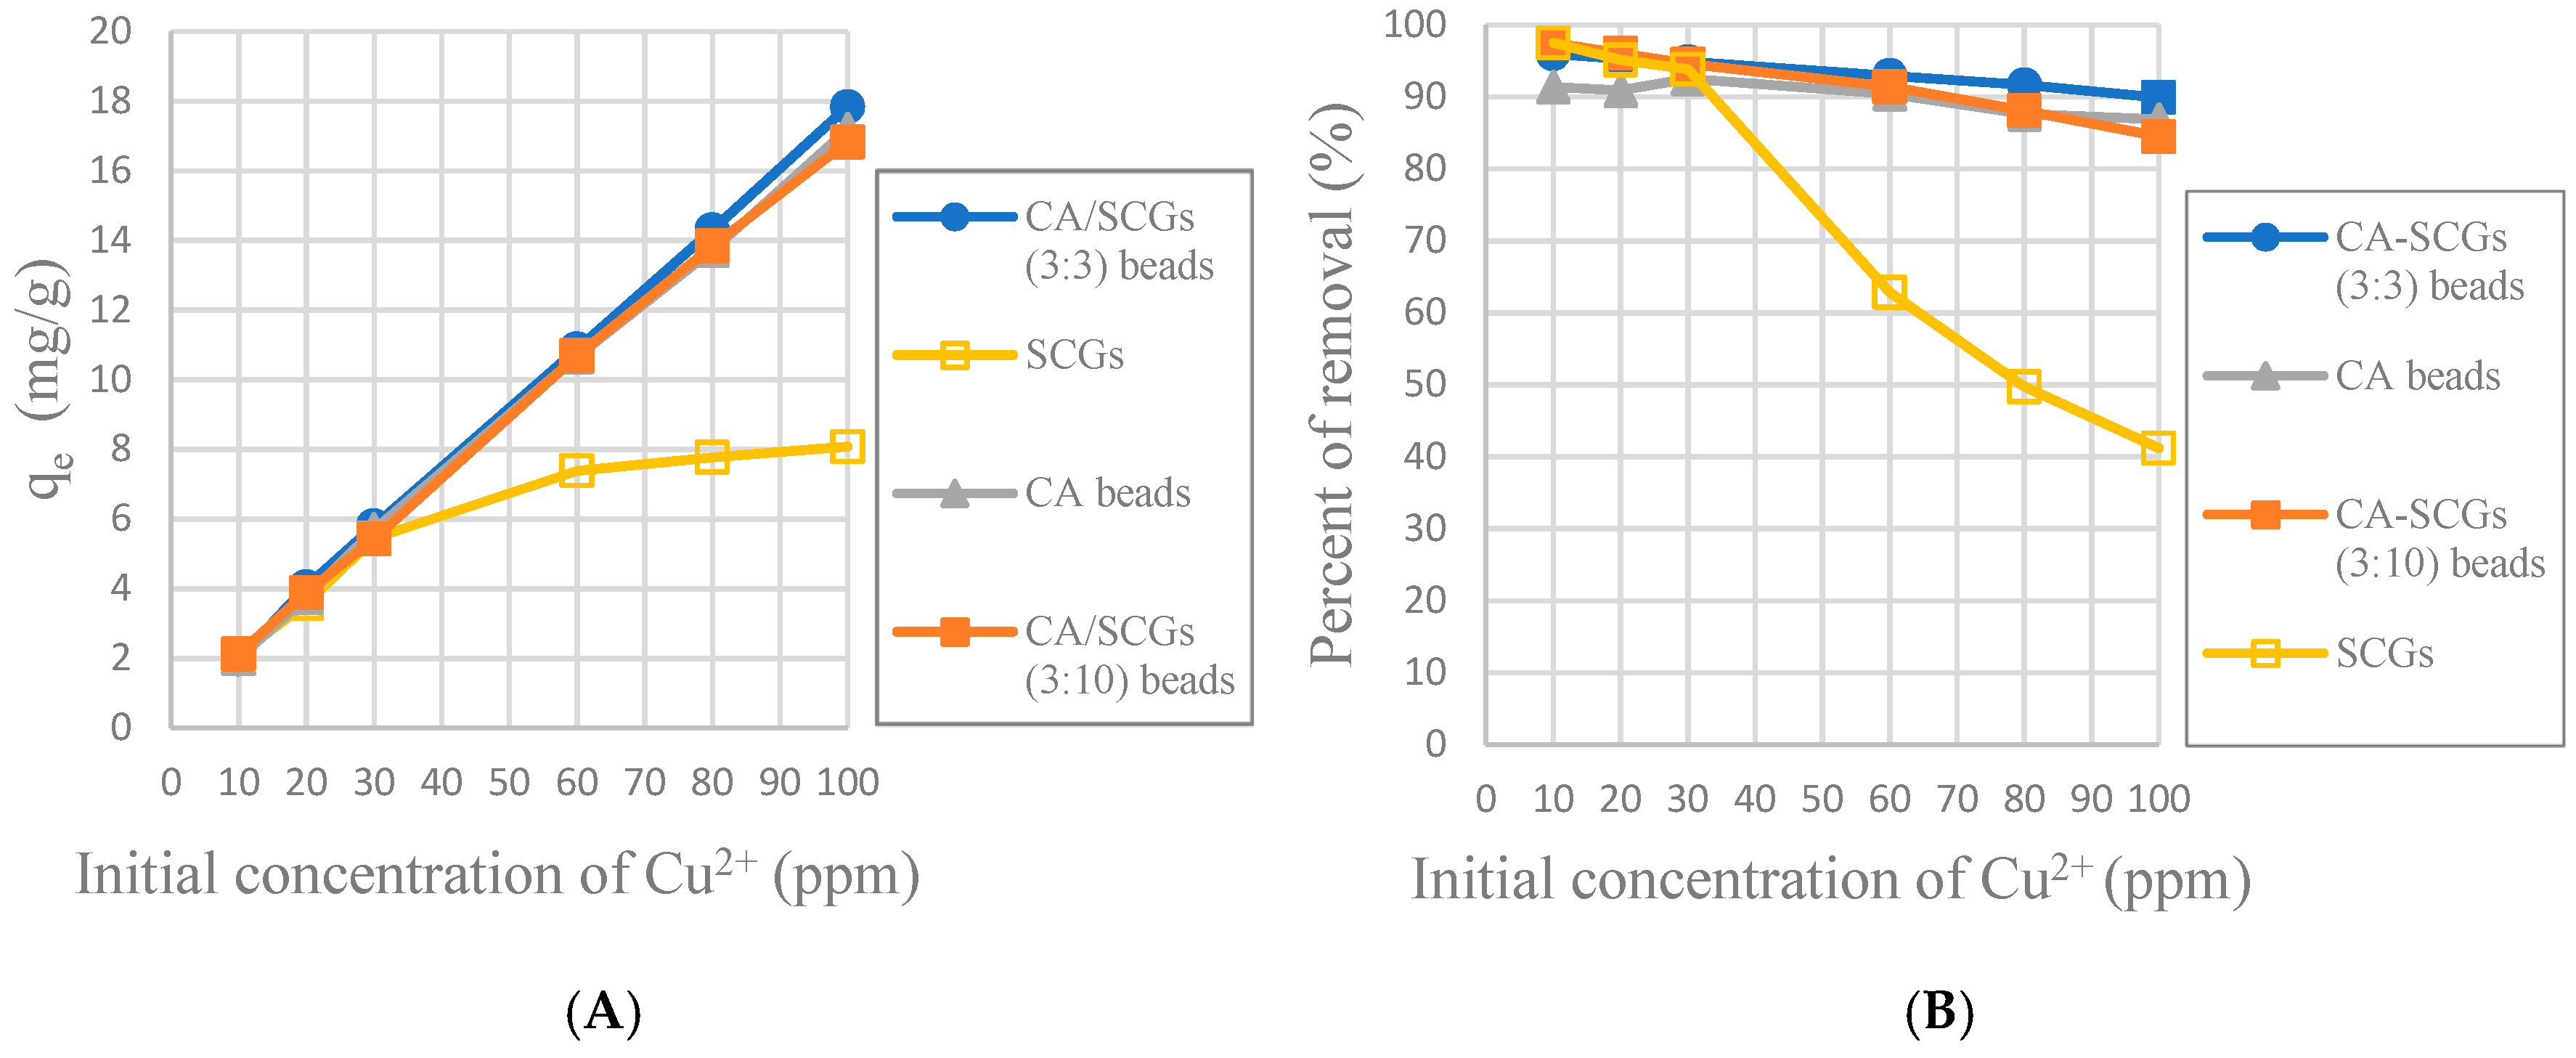
The CA-SCGs (3:3) beads have larger values of experimental amounts of Cu
2+ adsorbed at equilibrium (q
e) and percentages of removal (%) than the CA beads in the six initial concentrations used in this study as seen in
Figure 8. It is proof that in the range of concentration of Cu
2+ used in the isotherms of this study (10 ppm to 100 ppm Cu
2+), the CA-SCGs (3:3) beads have the largest adsorption capacity as indicated by the Sips model.
The maximum adsorption capacity value of the Sips model was 42.050 mg/g ± 0.802 mg/g for the CA-SCGs (3:3) beads. Other materials encapsulated in Calcium Alginate (CA) have shown higher capacities of adsorption such as 60.2 mg/g with graphene oxide [
19], 60.0 mg/g with magnetic sorbents [
32], and 53.6 mg/g with kaolin [
23], but are not considered pollutants.
The spent coffee grounds reach the saturation at 8 mg/g. This result could be compared with the result obtained by Dávila-Guzmán, N. E et al. [
18]. The result of that study was 0.216 mmol/g, equivalent to 13.72 mg/g with a pH of 4.5. The pH used in this study was 4.0. At a lower pH, H
+ is competing with Cu
2+ for the adsorption sites. This could be a reason for the lower value of adsorption in our study. Other waste of natural materials such as banana and orange peels have an adsorption of 4.75 mg/g and 3.65 mg/g, respectively [
33]. The adsorption of a natural component such as lignin is 22.88 mg/g [
34].
The mechanism for adsorption by SCGs suggested by the study by Dávila-Guzmán, N. E et al. is similar to the mechanism suggested by Papageorgiou, S. K. et al. [
15] for the adsorption by the CA beads. This mechanism of divalent metal adsorption on CA beads is dominated by ion exchange involving mainly the carboxyl groups present in the alginate molecule, with hydroxyl groups playing a secondary role. SCGs have a lesser amount of carboxyl groups, it could be the reason of the lower adsorption capacity by SCGs but it cannot explain the better affinity and kinetics of SCG below of the saturation level of 8 mg/g. A possible explanation is that not only the carboxylic groups play a major role in the adsorption by SCGs but other functional groups such as phenol groups among others. Alginate has a homogeneous composition of β-D mannuronic Acid(M) and α-L-glucuronic acid (G), where the carboxylic groups are omnipresent in the adsorption sites, and the ion exchange between calcium and copper is necessary for the adsorption. SCGs have a more heterogeneous composition and lignin is present in a significant amount in SCGs. The main acidic compounds of the SCGs analyzed in the study of Pujol, D. et al. [
25] are phenolic groups which are mostly located in lignin. The phenolic groups are weakly acidic. The protonated phenolic group is not a particular good ligand for metals cations, but once deprotonated, an oxygen center is generated with a high charge density. The pKa value of the most of phenols is in the region of 9.0–10.0 but in the presence of cations such as Fe
3+ or Cu
2+, the proton is displaced at much lower pH values. The phenoxide group favors interaction with cations of high charge density, e.g., Fe
3+, Fe
2+, Cu
2+, and Zn
2+. Polyphenols do not chelate alkali and alkaline earth cations such as Na
+, K
+, and Ca
2+ [
35]. The fact that polyphenols do not chelate Ca
2+ means that an ion exchange between Ca
2+ and Cu
2+ is not expected if the adsorption of Cu
2+ is by polyphenols. The mechanism would be deprotonation of the phenolic groups and the later binding of Cu
2+. Calcium is a metal found in large amounts in SCGs relative to other metals. Calcium ions were released during the adsorption of Cu
2+ by SCGs in the study by Dávila-Guzmán, N. E et al. [
18]. This could suggest that the model of carboxylic groups releasing Ca
2+ ions during the adsorption of Cu
2+ could be correct because the phenolic groups cannot be bonded to Ca
2+. Nevertheless, a greater amount of H
+ ions were released during the same adsorption. This release could be product of the carboxylic groups but also of the phenolic groups. The carboxylic groups in SCGs could be part of hemicellulose and other components of SCGs but they are not ubiquitous in the structure of SCGs as in the case of CA. Xueyan Guo et al. studied the adsorption of heavy metals by lignin and concluded that this material has two types of adsorption sites: carboxylic groups and phenolic groups but the phenolic groups have higher affinity to metal ions [
34].
Melanoidins, another component of SCGs, are polymeric macromolecules formed by interactions between carbohydrates and compounds with a free amino group during the roasting process. They have a chelating ability. The mechanism of chelation of melanoidins is not clearly understood because the purification and separation of melanoidins is a complex process. Takenaka, M. et al. separated and characterized a metal chelating substance in coffee using zinc as metal [
36]. The results of this study suggested that the substance was a melanoidin-like polymer formed by the decomposition and polymerization of sugars, amino acids and phenolics. The latter study concluded that the metal-chelating activity of this substance may have been due to phenolic residues. This supports the idea that the adsorption by SCGs is different from the adsorption by CA. Functional groups such as the phenolic groups, that are absent in CA, may have an important role in the adsorption of metals by SCGs. The adsorption of metals by SCGs is not only due to the carboxylic groups and the ion exchange between Ca
2+ and Cu
2+. SCGs may have less adsorption sites, it is reflected in the reduced adsorption capacity. However, these adsorption sites could have more affinity to Cu
2+, it is reflected in the kinetics. These differences in the adsorption by the beads were reflected according to the composition of the beads.
3.5. Adsorption Kinetics
The effect of the contact time during the adsorption of Cu
2+ ions by 0.5g of adsorbent in 0.1 L of solution was investigated with initial concentrations between 10 ppm to 100 ppm of Cu
2+. The pseudo-second-order equation was used because it showed the best fit with the results (R
2 > 0.979). This fact indicated the adsorption process of the Cu
2+ ions was complex for CA beads, CA-SCGs beads and SCGs. More than one mechanism is involved. The pseudo-second-order linear equation was used to evaluate the data, Equation (10) [
37]:
where
k2 (g/ mg-min) is the rate constant of pseudo-second-order adsorption,
qe (mg/g) is the amount of Cu
2+ ions at equilibrium, and
qt (mg/g) is the amount of Cu
2+ ions adsorbed at time t (min). Making a graph
t/qt versus
t, the slope and the intercept give the values of
k2 and the
qe calculated during the adsorption of Cu
+2 ions at a specific initial concentration of Cu
2+.
Another kinetic parameter is
h (mg g
−1min
−1). This parameter is the initial adsorption rate when
t → 0. This parameter can be calculated by the following equation, Equation (11) [
37]:
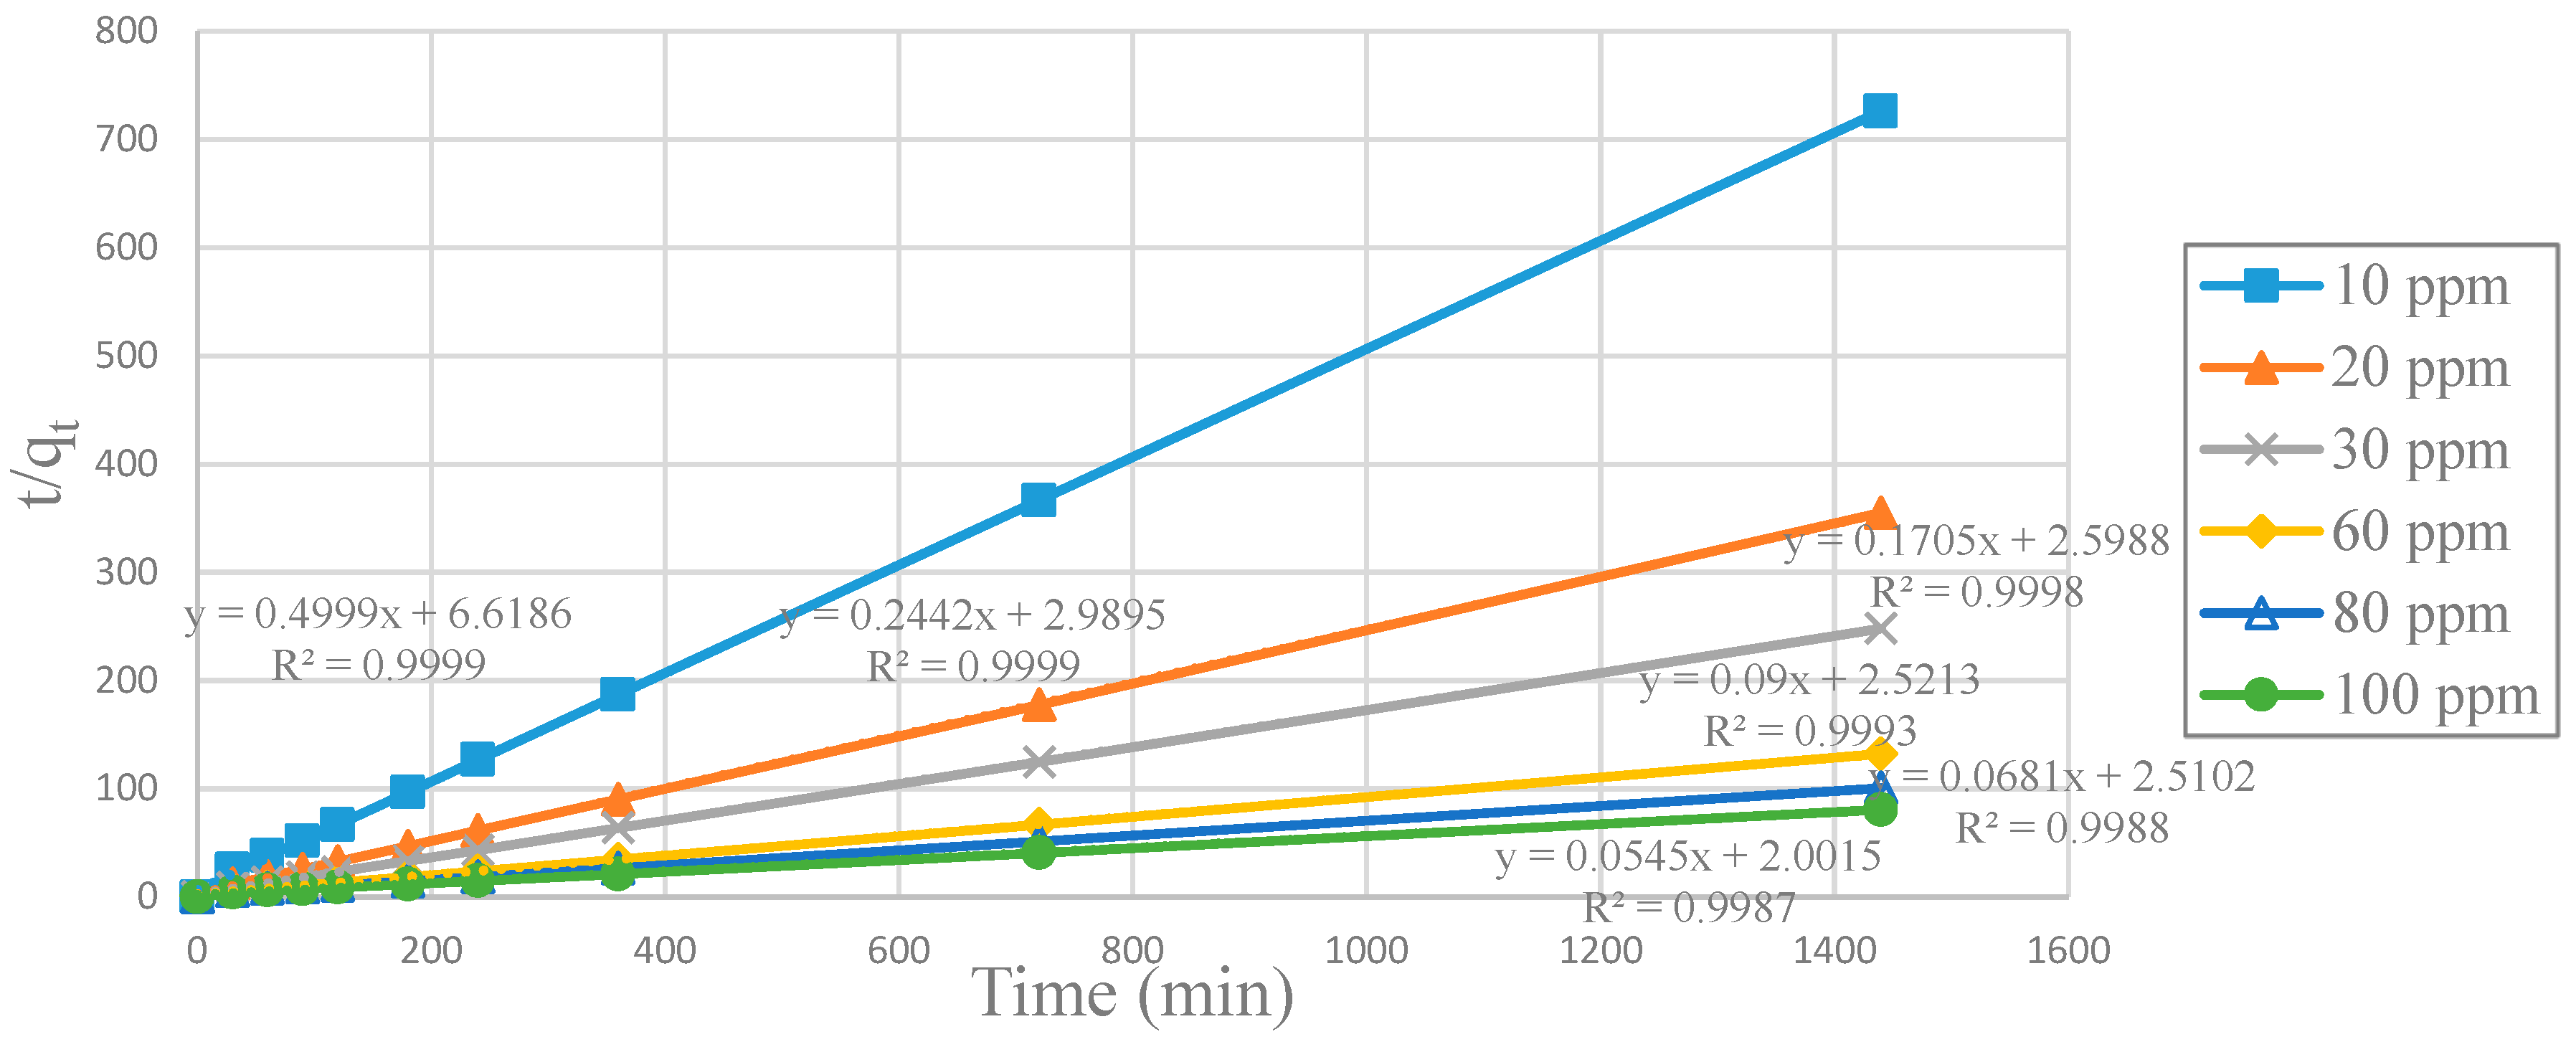
Graphs of
t/
qt versus
t such as the plot in
Figure 9 were made for SCGs, CA beads, CA-SCGs (3:3) beads and CA-SCGs (3:10) beads. Values of
k2,
qe calculated and
h were obtained for each initial concentration of Cu
2+ from each graph.
SCGs is the absorbent with the highest kinetic rate constants (
k2) and initial adsorption rate constants (
h), at all initial concentrations of Cu
2+. In the same way, the CA beads have the lowest values of
k2 and
h at all initial concentrations of Cu
2+. The CA-SCGs beads have much higher kinetic parameters than the CA beads (
Table 2).
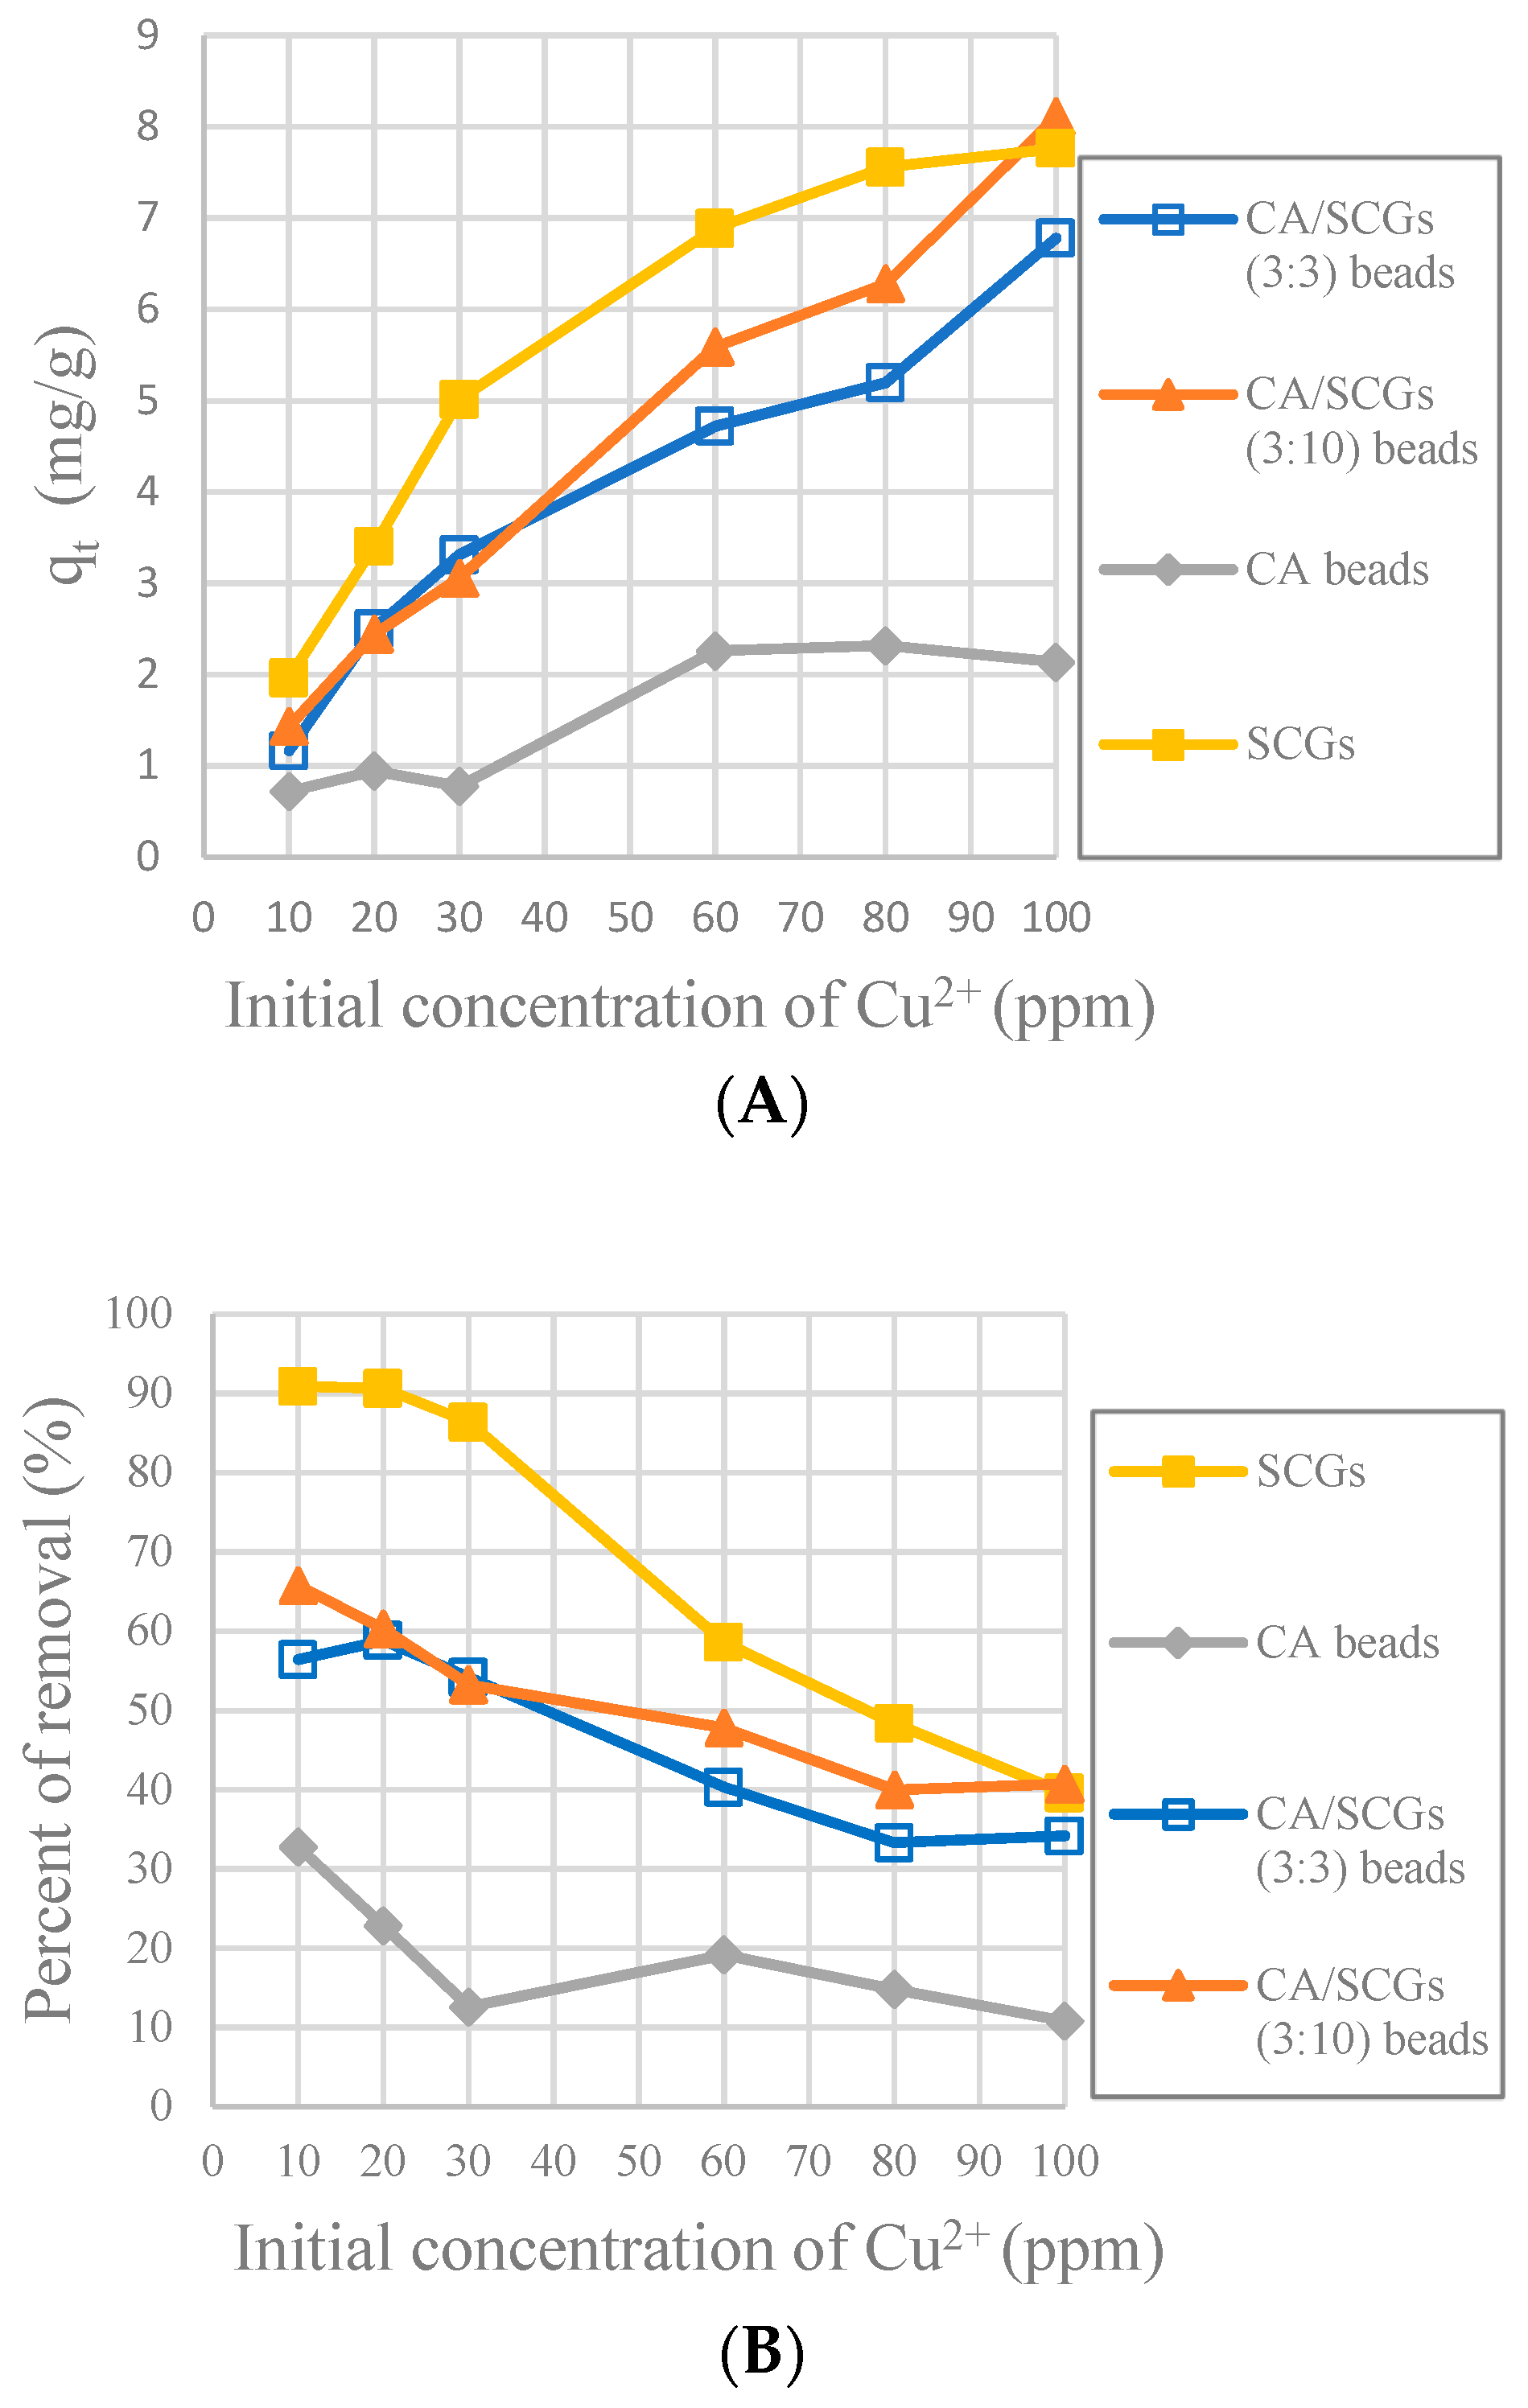
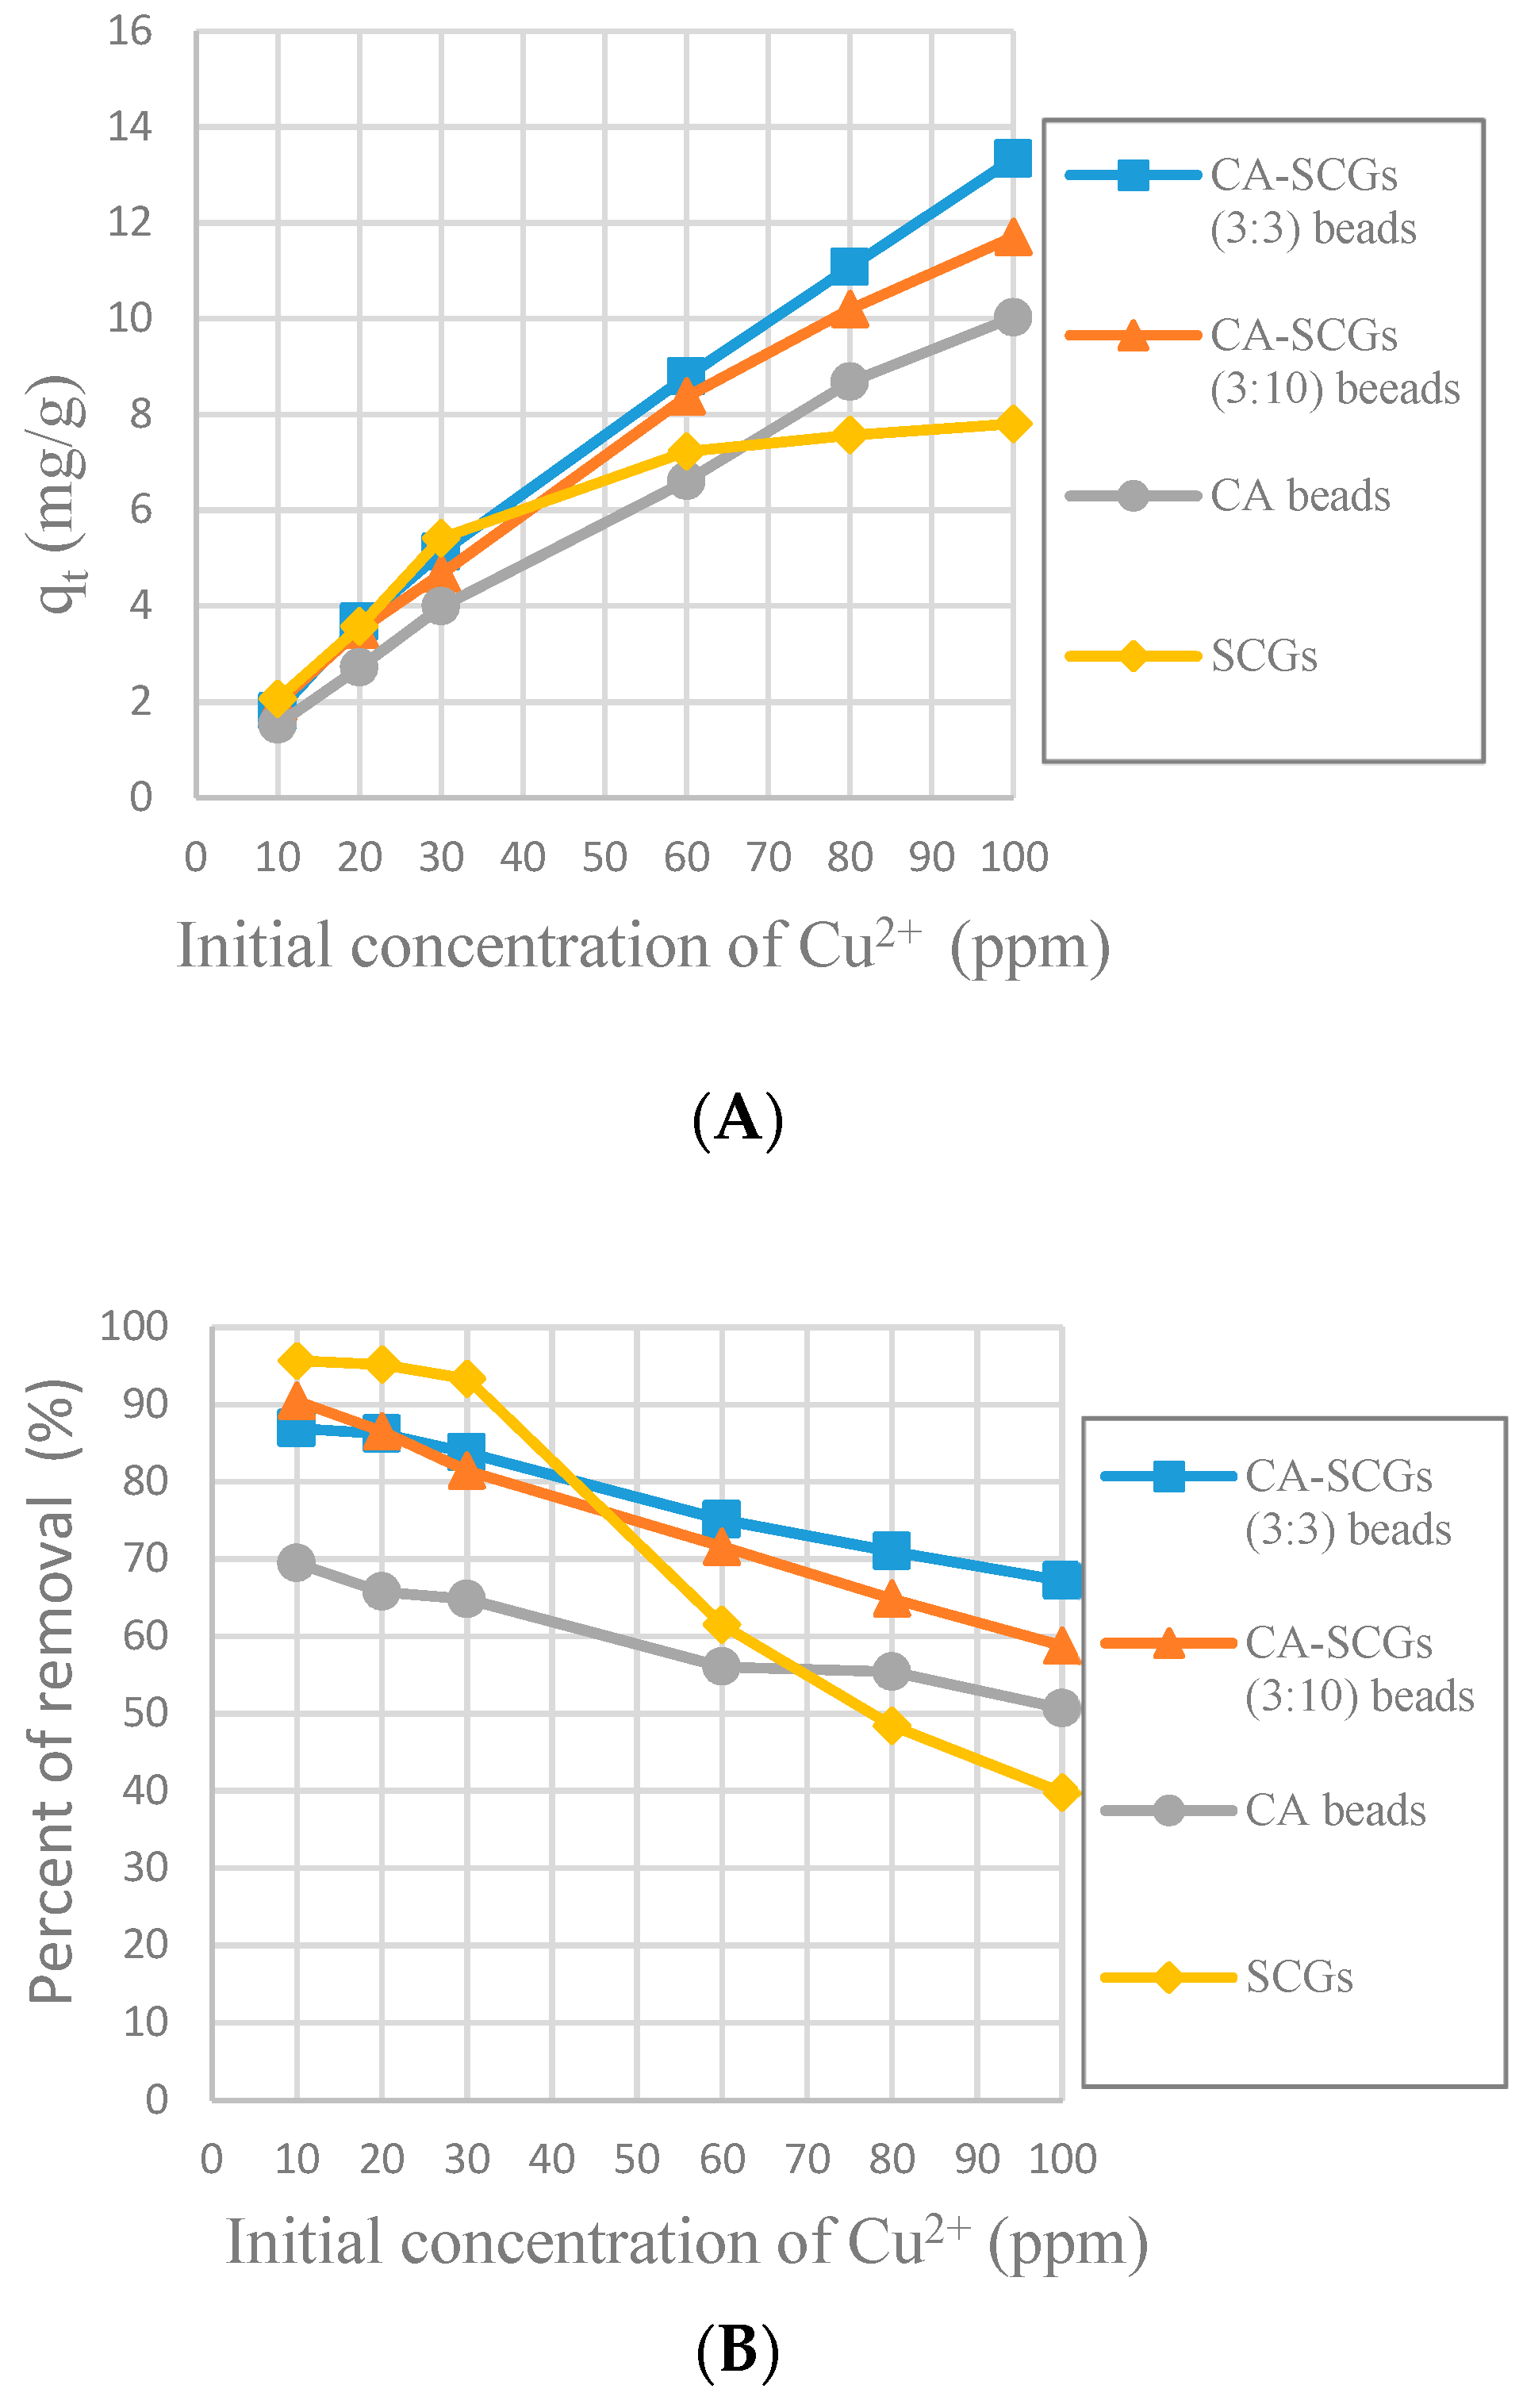
Figure 10 shows that SCGs have the maximum adsorption at the most initial concentrations of Cu
2+ in the first 30 min, but the adsorption by SCGs is limited close to its experimental maximum value of adsorption of 8 mg/g. The CA-SCGs (3:3) beads and CA-SCGs (3:10) beads have a much better adsorption than the CA beads in the first 30 min. At 30 min, the adsorbent with the largest q
t are the CA-SCGs (3:10) beads with a q
t of 8.111 mg/g at an initial concentration of Cu
2+ of 100 ppm.
The purpose of the plots in
Figure 11 is to see the adsorption performance of the CA-SCGs beads beyond the equilibrium time of SCGs and the level of saturation of SCGs at 8 mg/g. At 120 min, the CA-SCGs beads still have a better adsorption performance than the CA beads. The adsorption by the CA-SCGs (3:3) beads maintains an almost linear correlation with the initial concentration of Cu
2+ beyond of the level of 8 mg/g.
In
Figure 8, it was seen that even at 24 h, the CA-SCGs (3:3) beads have better adsorption than the CA beads. With an initial concentration of 100 ppm of Cu
2+, the CA-SCGs (3:3) beads have a q
e of 17.839 mg/g ± 0.258 mg/g, more than the q
e of the CA beads of 17.184 mg/g ± 0.384 mg/g, the q
e of the CA-SCGs (3:10) beads of 16.828 mg/g ± 0.397mg/g and much more than the q
e of SCGs of 8.079 mg/g ± 0.074 mg/g.
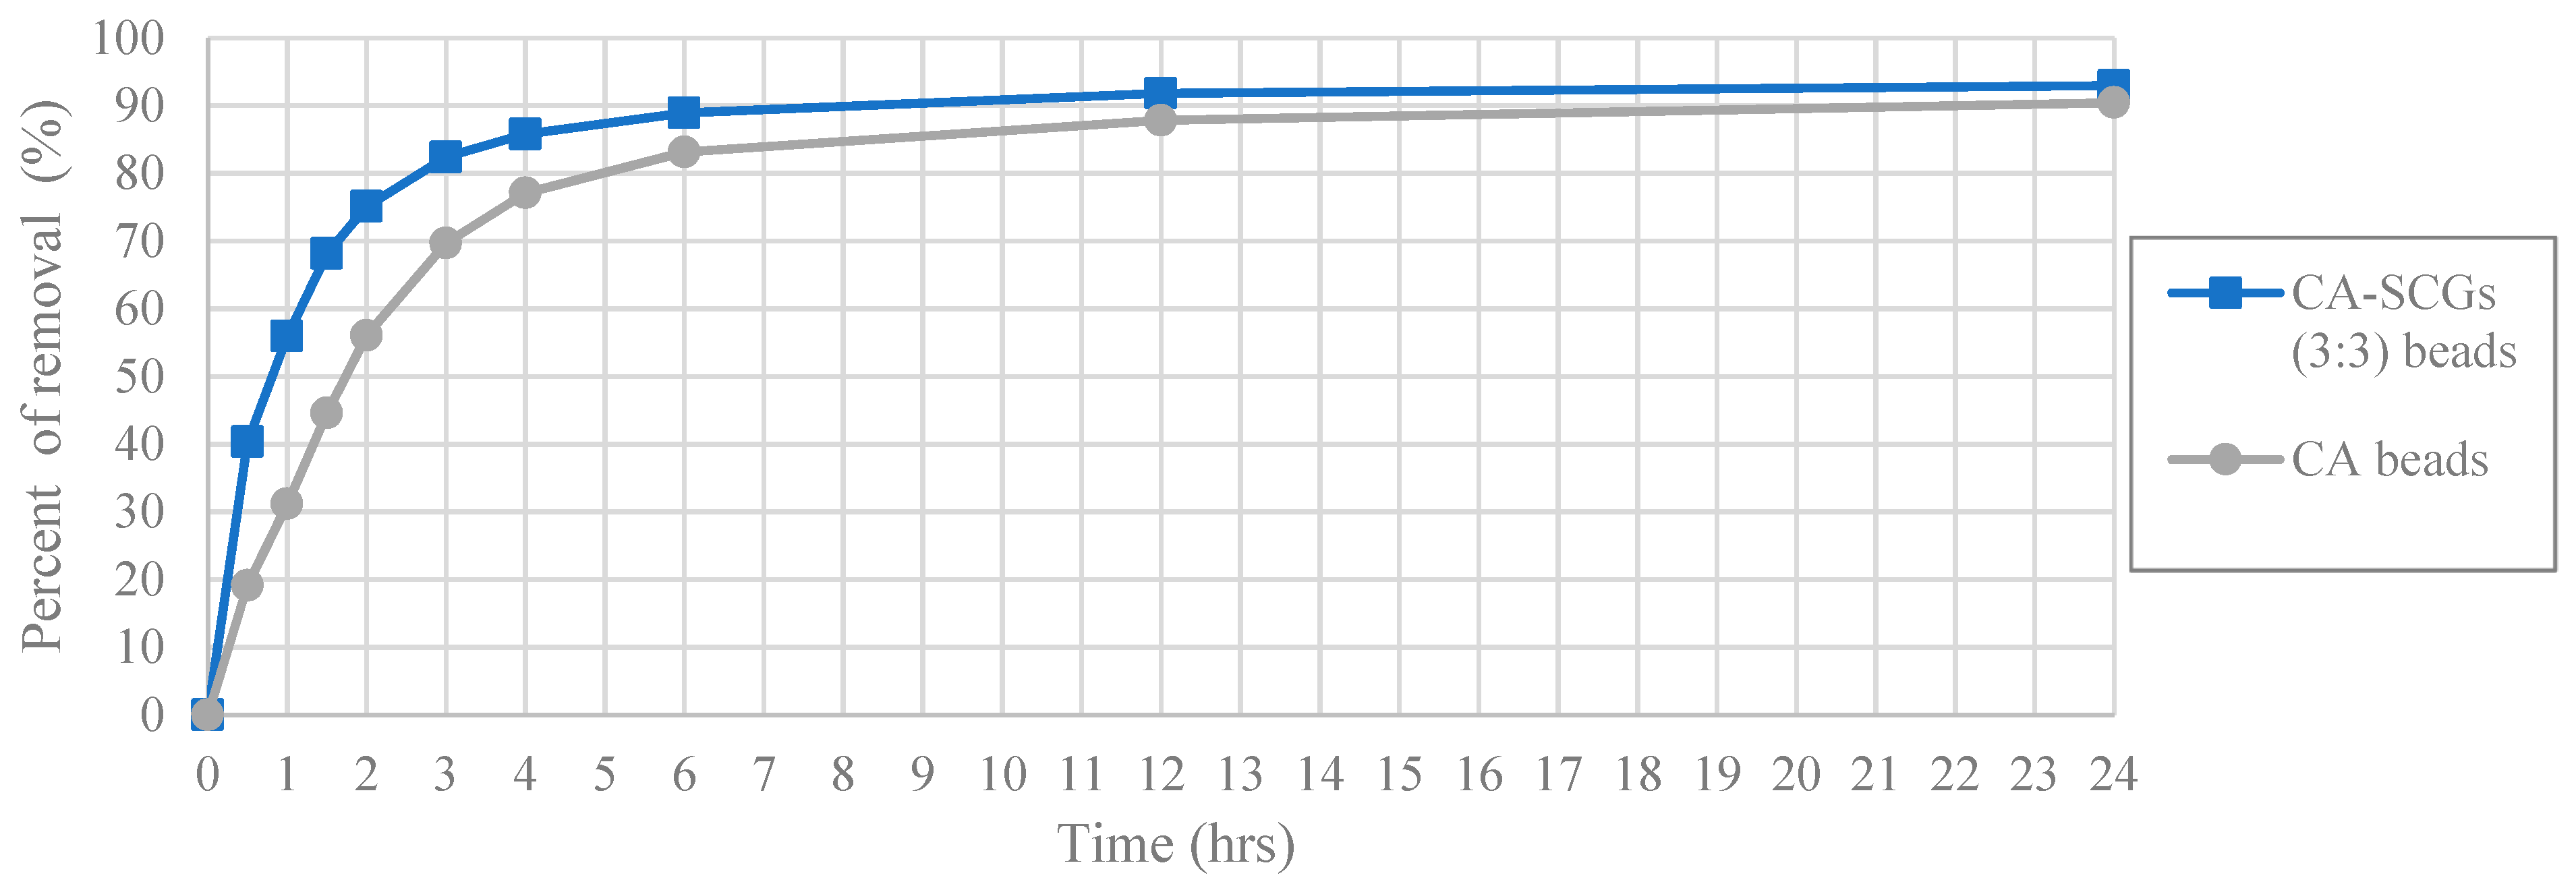
The worst results of adsorption by CA/SCG beads are expected at concentrations of 60 ppm or more because the spent coffee grounds achieve the saturation level of 8 mg/g at these concentrations as seen in the
Figure 8. The plot in
Figure 12 is an example of how the CA beads need more time to achieve the same percentages of removal than the CA-SCGs (3:3) beads. The CA-SCGs (3:3) beads achieve 55.95% (6.550 mg/g) at 1 h and the CA beads achieve 56.05% (6.612 mg/g) at 2 h. The CA-SCGs (3:3) beads achieve 75.09% (8.790 mg/g) at 2 h and the CA beads achieve 77.08% (9.092 mg/g) at 4 h. The CA beads need double the time to achieve similar percentages of removal than the CA-SCGs (3:3) beads during the first hours of the experiment, at an initial concentration of 60 ppm Cu
2+.
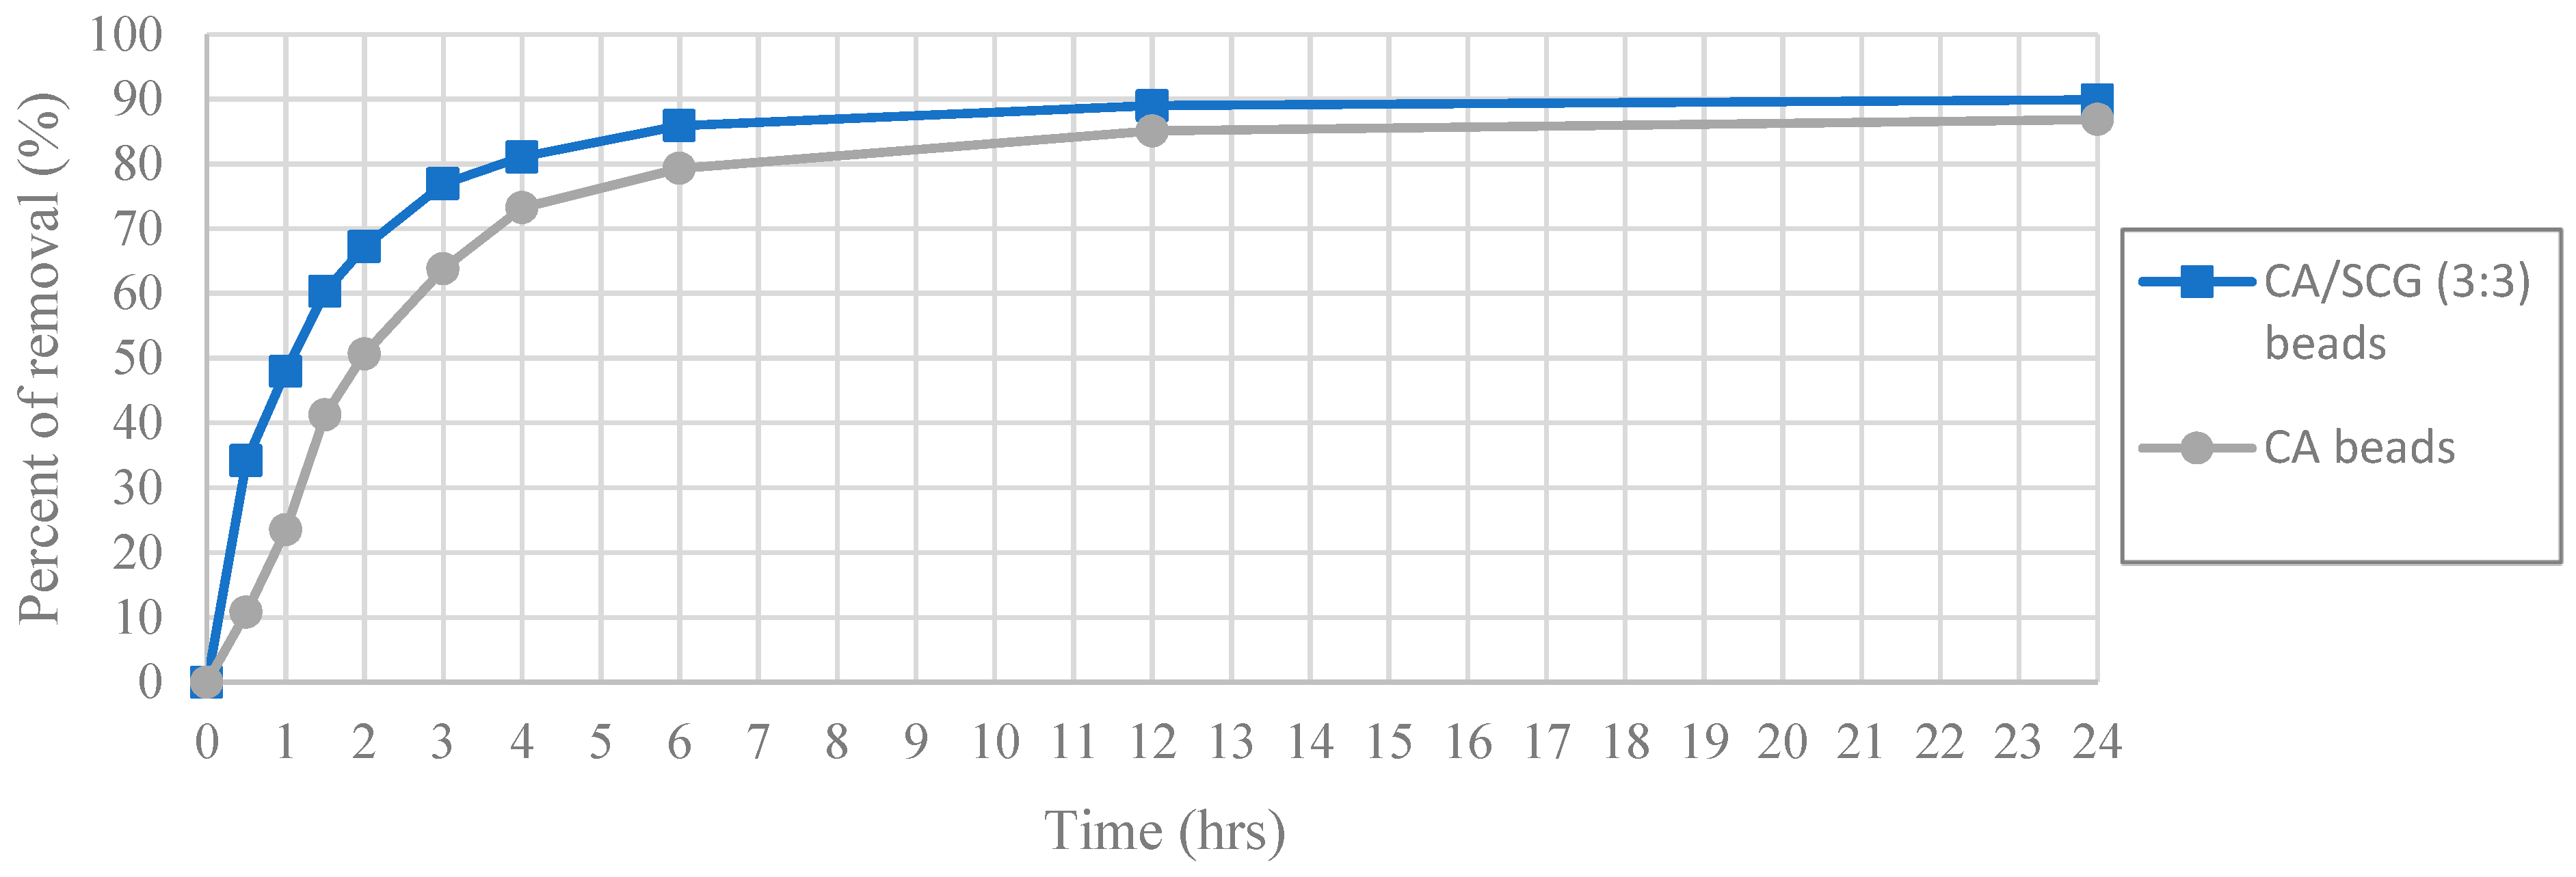
The same pattern is repeated at the highest initial concentration of 100 ppm of Cu
2+ (
Figure 13). The CA-SCGs (3:3) beads achieve 47.97% (9.518 mg/g) at 1 h and the CA beads achieve 50.67% (10.024 mg/g) at 2 h. The CA-SCGs (3:3) beads achieve 67.21% (13.336 mg/g) at 2 h and the CA beads achieve 73.23% (14.488 mg/g) at 4 h. Although the CA beads achieve a little more removal of Cu
2+ relative to the CA-SCGs (3:3) beads at this higher concentration of Cu
2+.
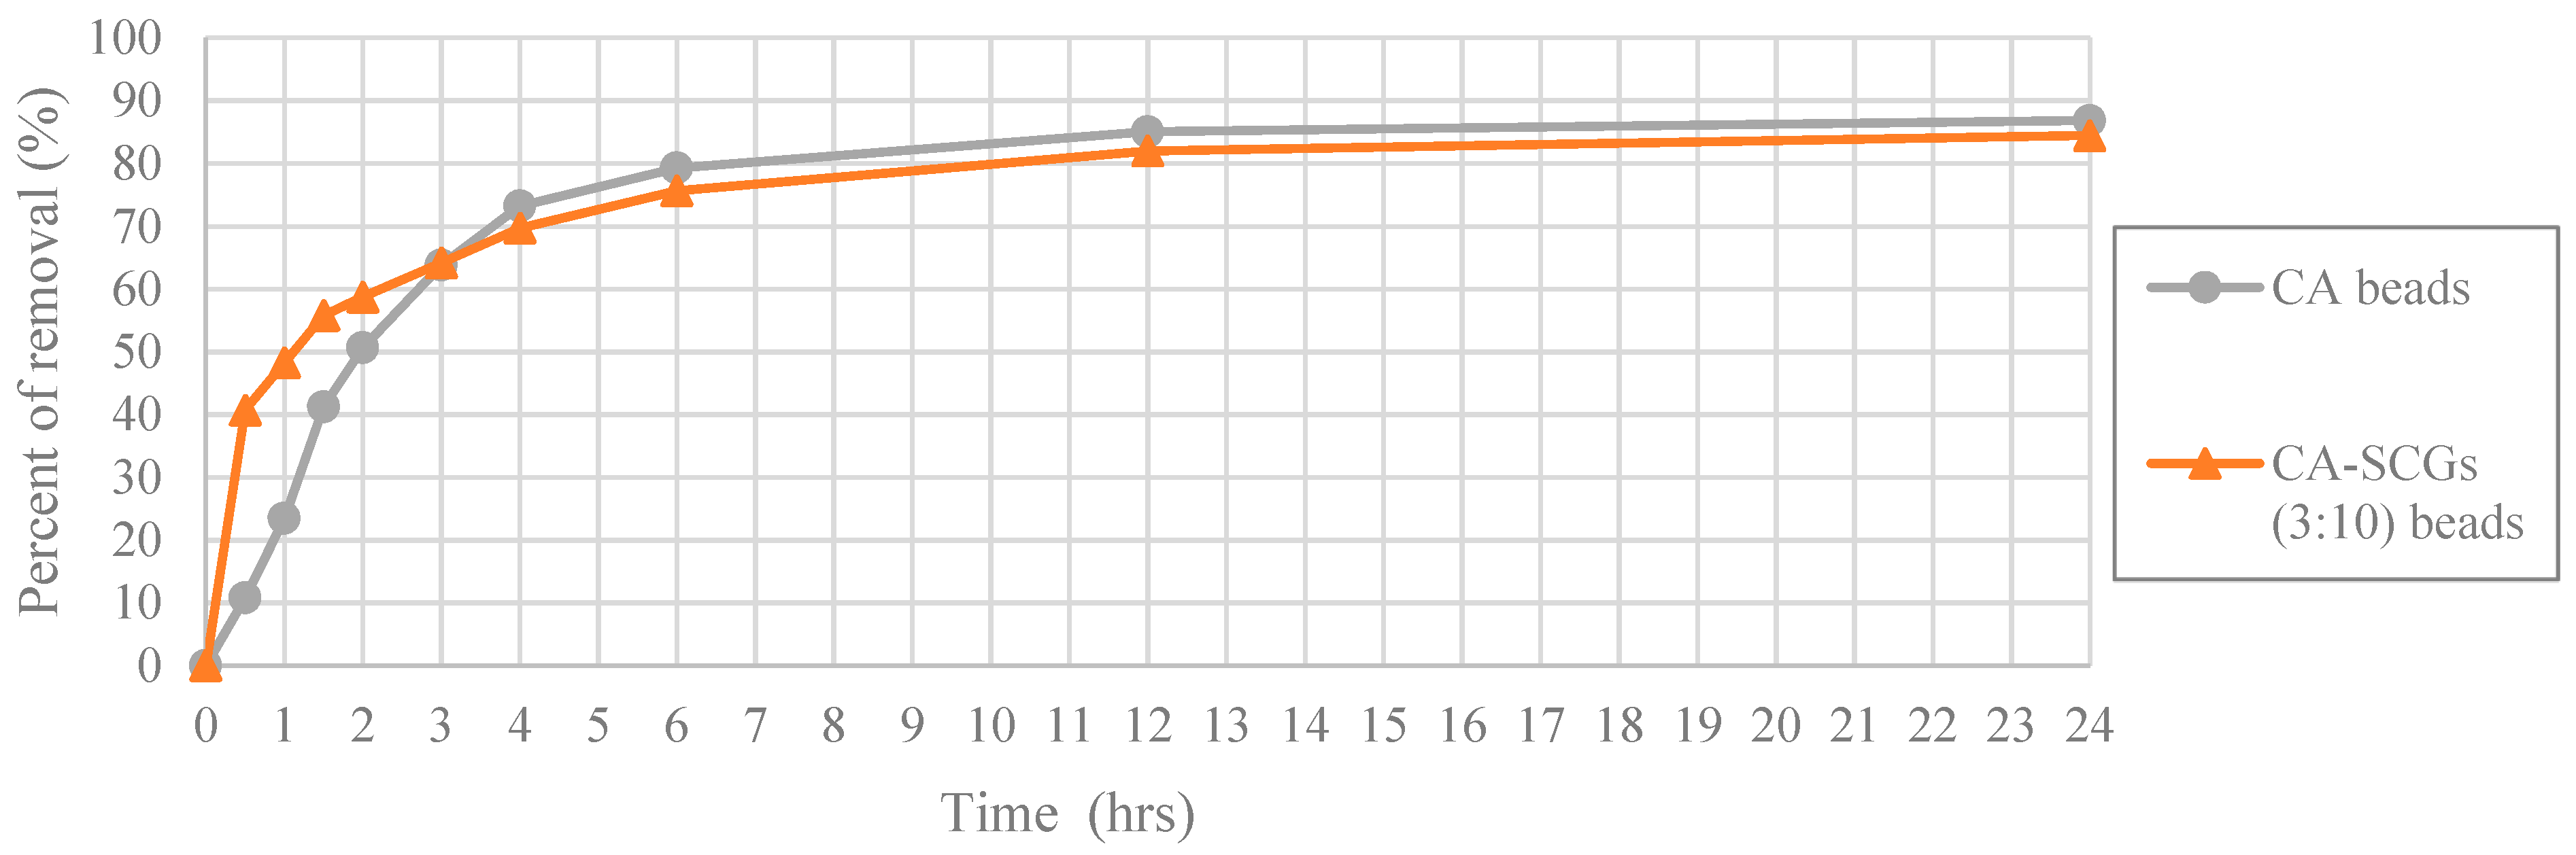
In
Figure 14, at the highest initial concentration of 100 ppm of Cu
2+; the CA-SCGs (3:10) beads and the CA beads achieve percentages of removal of 40.72% (8.111 mg/g) and 10.80% (2.136 mg/g) at 0.5 h, respectively. The CA-SCGs (3:10) beads achieve almost four times the percent of removal of Cu
2+ by the CA beads at this time. The CA beads achieve 41.24% (8.160 mg/g) at 1.5 h, the triple of time needed by the CA-SCGs (3:10) beads to achieve a similar percent of removal. However, the speed of adsorption of the CA-SCG (3:10) beads starts to slow down as more adsorbate is removed from the solution. The CA beads and the CA-SCGs (3:10) beads achieve similar percentages of removal at 3 h, 63.81% (12.625 mg/g) and 64.20% (12.787 mg); respectively. The excess of SCGs used in the synthesis of CA-SCGs (3:10) beads improves the kinetics of adsorption at the beginning of the experiment, but it affects the capacity of adsorption of the CA-SCGs (3:10) beads as more adsorbate is removed. This can be due to the saturation of the SCGs in the beads. An interesting fact is that the CA-SCGs (3:10) beads are composed mostly of SCGs, not CA. When the bead was formed, the SCGs used in the synthesis of the bead were trapped inside the bead. Nevertheless, the capacity of adsorption of the CA-SCGs (3:10) beads is not so low as the capacity of adsorption of SCGs alone (8.079 mg/g), and it is similar to the capacity of adsorption of the CA beads at this initial concentration of 100 ppm of Cu
2+. The values of q
e of the CA beads and the CA-SCGs (3:10) beads are 17.184 mg/g ± 0.384 mg/g and 16.828 mg/g ± 0.397 mg/g, respectively. The percentages of removal were 86.86% and 84.49%. Possibly, the encapsulation of the SCGs in a matrix of CA changes the equilibrium of adsorption of Cu
2+ by the SCGs. The interaction between SCGs and CA during the formation of the CA/SCG beads deserves further investigation to see why the capacity of adsorption of the CA/SCG (3:10) beads and the CA beads is similar at that range of concentrations, in spite that the CA/SCG (3:10) beads have an excess of SCGs and the SCGs have lower capacity of adsorption than CA at the same range of concentrations.
According the pseudo-second-order adsorption kinetic parameters of
k2 and
h (
Table 2), the CA-SCGs beads have a faster adsorption rate of Cu
2+ than the CA beads. This fact could be seen experimentally in
Figure 10 and
Figure 11. This adsorption rate is maintained beyond the equilibrium time and the level of saturation of SCGs at 8 mg/g (
Figure 11). The CA-SCGs (3:3) beads exhibit the best adsorption capacity through the 24 h of the study at all initial concentrations of Cu
2+ (
Figure 8) and keep the fastest rate of adsorption through the same time (
Figure 12 and
Figure 13).

 ,
, 


