The Fabrication of Fragrance Microcapsules and Their Sustained and Broken Release Behavior


Abstract
1. Introduction
2. Materials and Methods
2.1. Materials
2.2. Preparation of MMF Microcapsules
2.3. Impregnation of Microcapsules on Fabric Substrate
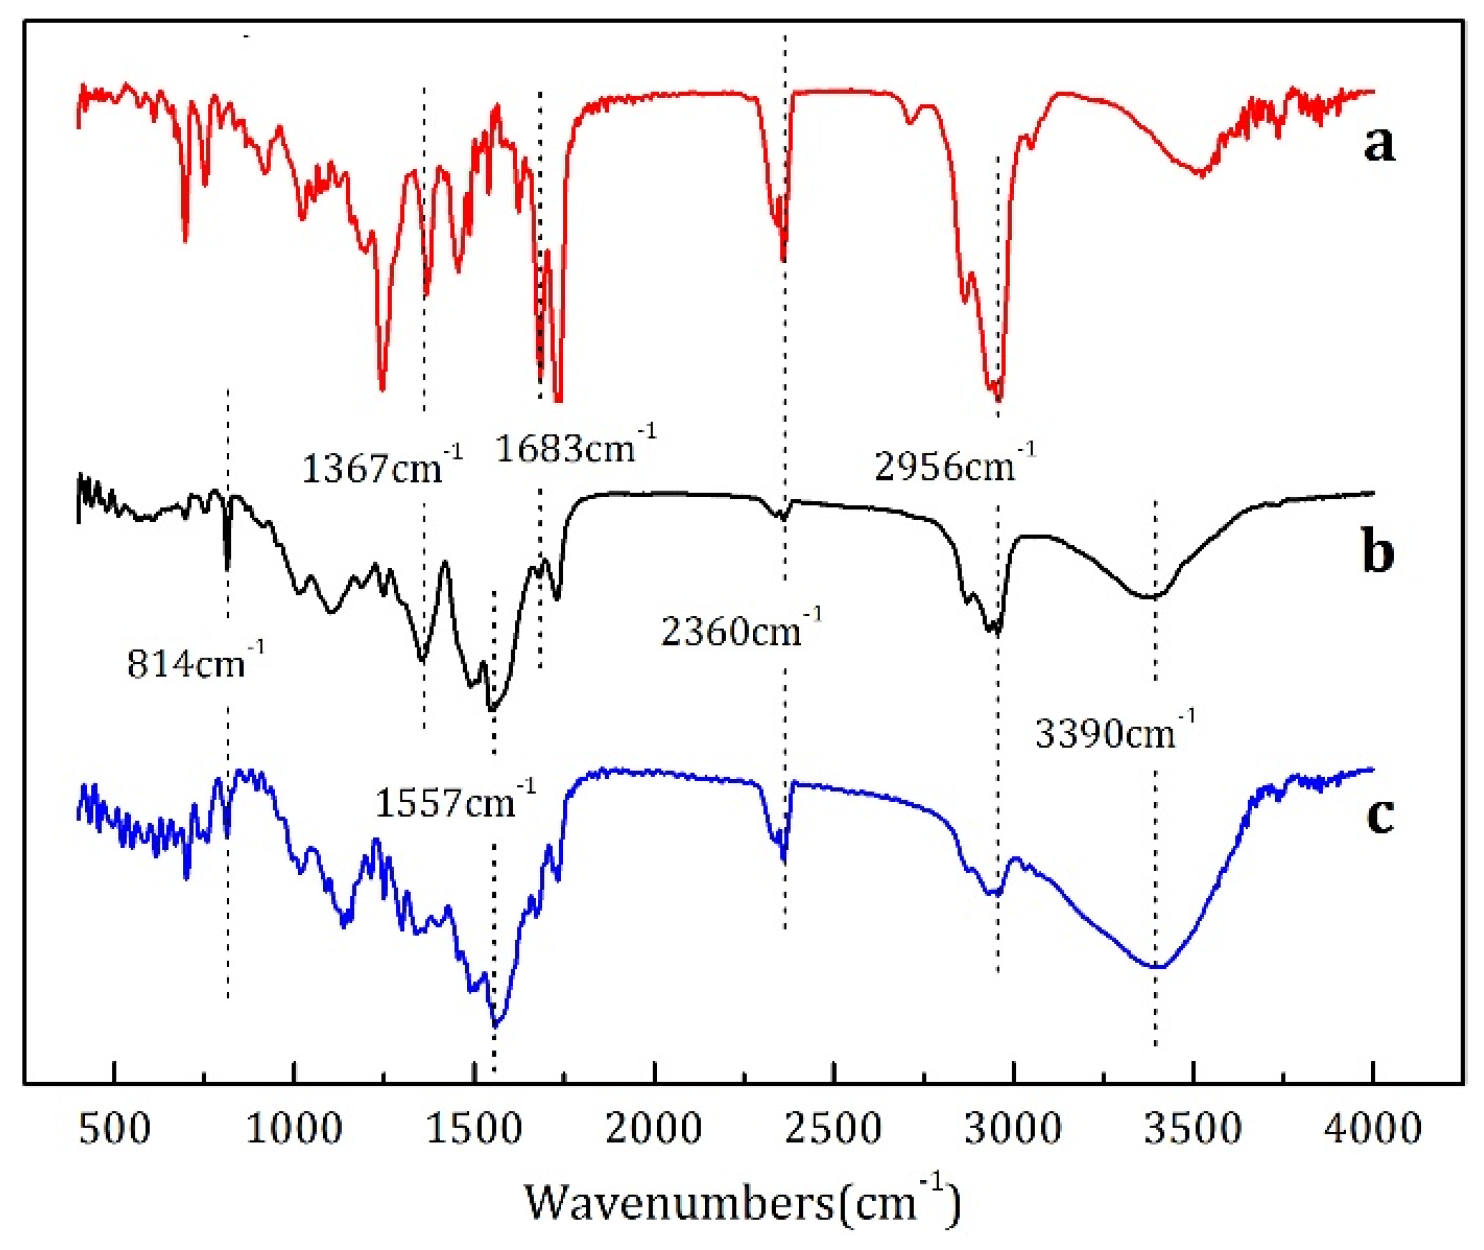
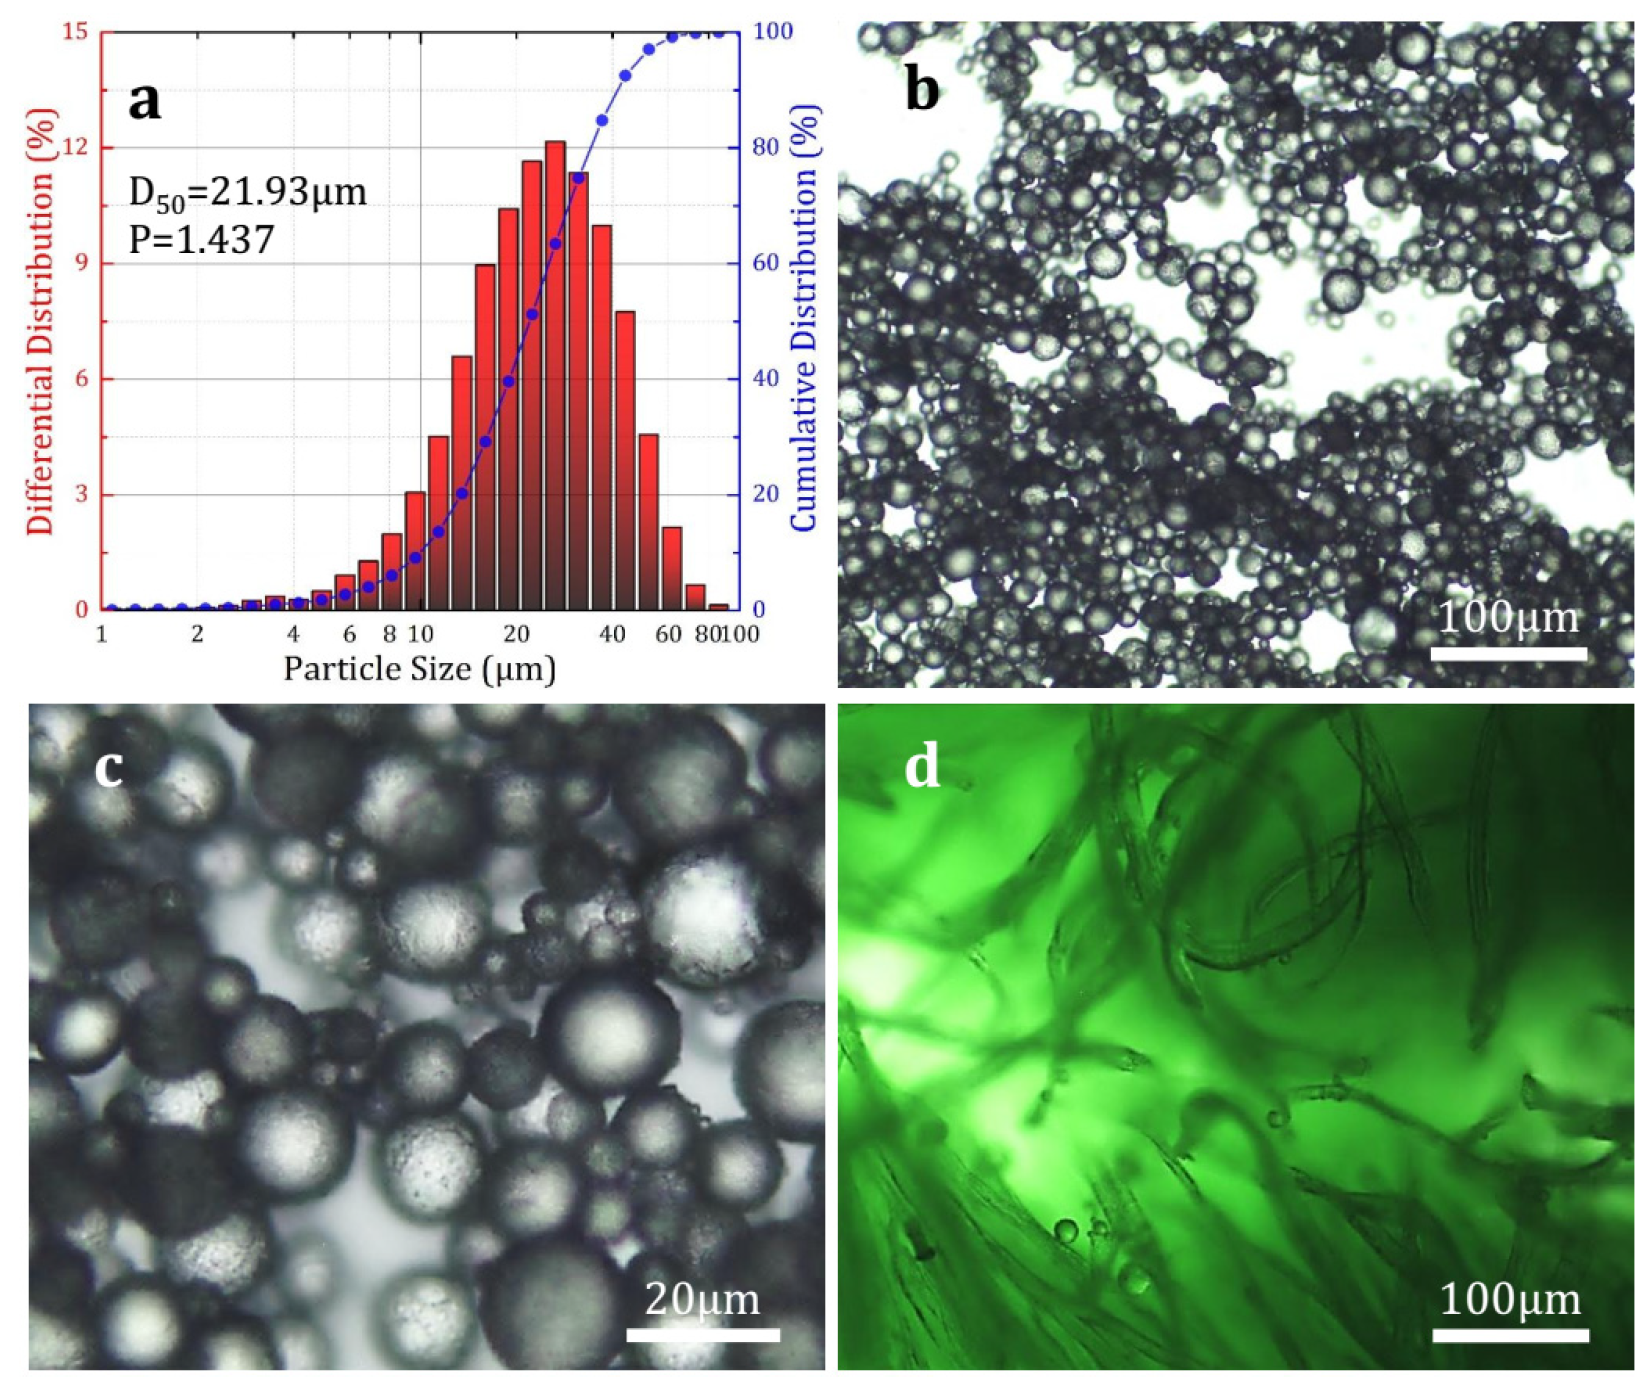
2.4. Chemical Structure and Morphology Characterization
2.5. Odor Evaluation
2.6. Sustained Release Performance Evaluation
3. Results and Discussion
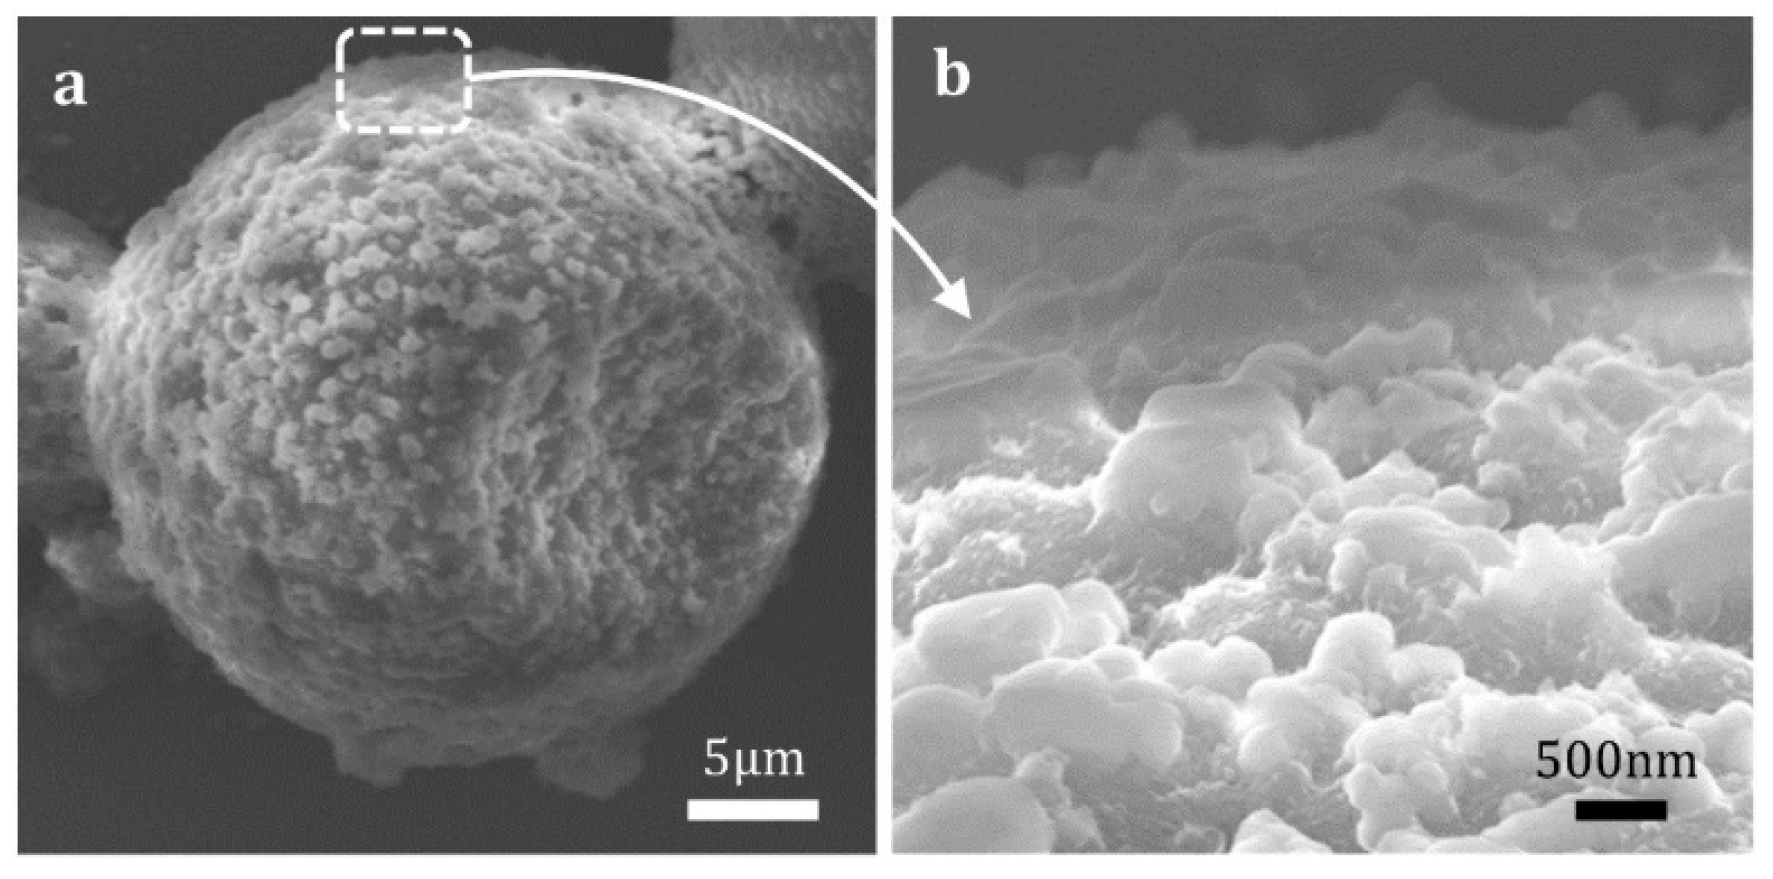
3.1. Characterization of Microcapsules
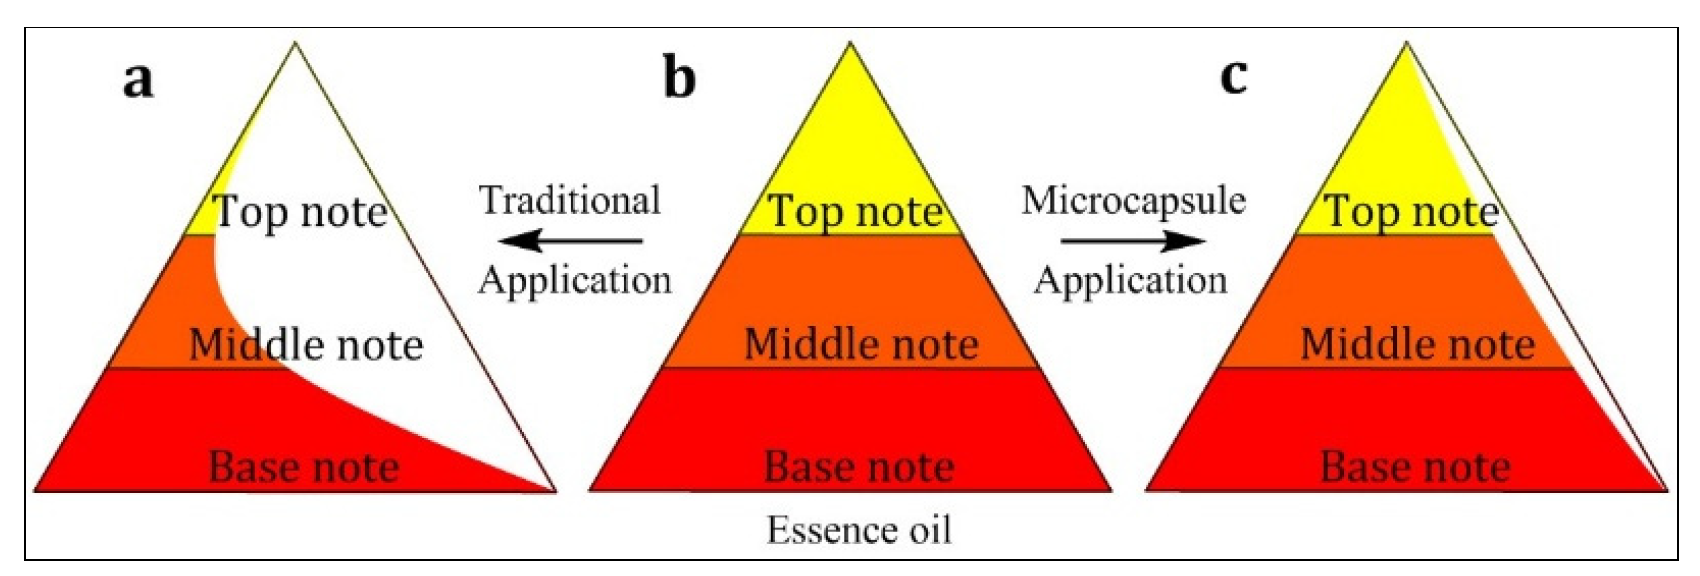
3.2. Odor Release Behavior of Prepared Microcapsules
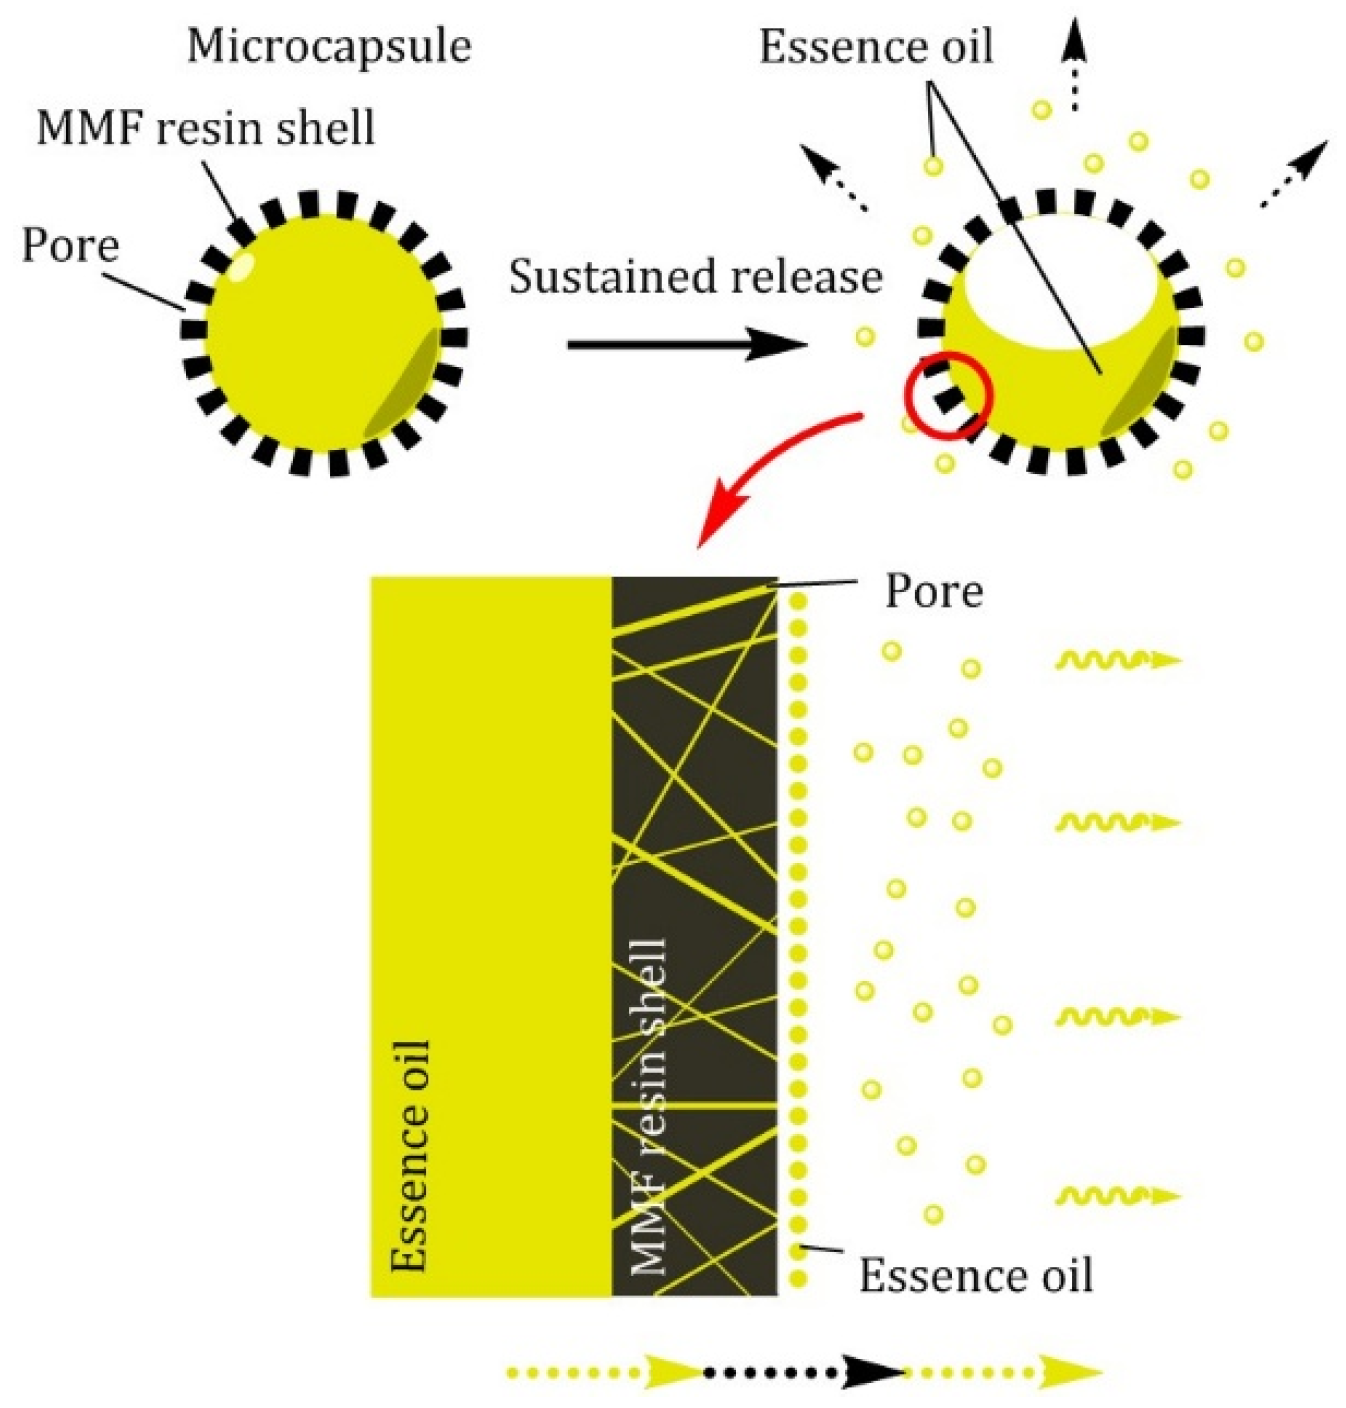
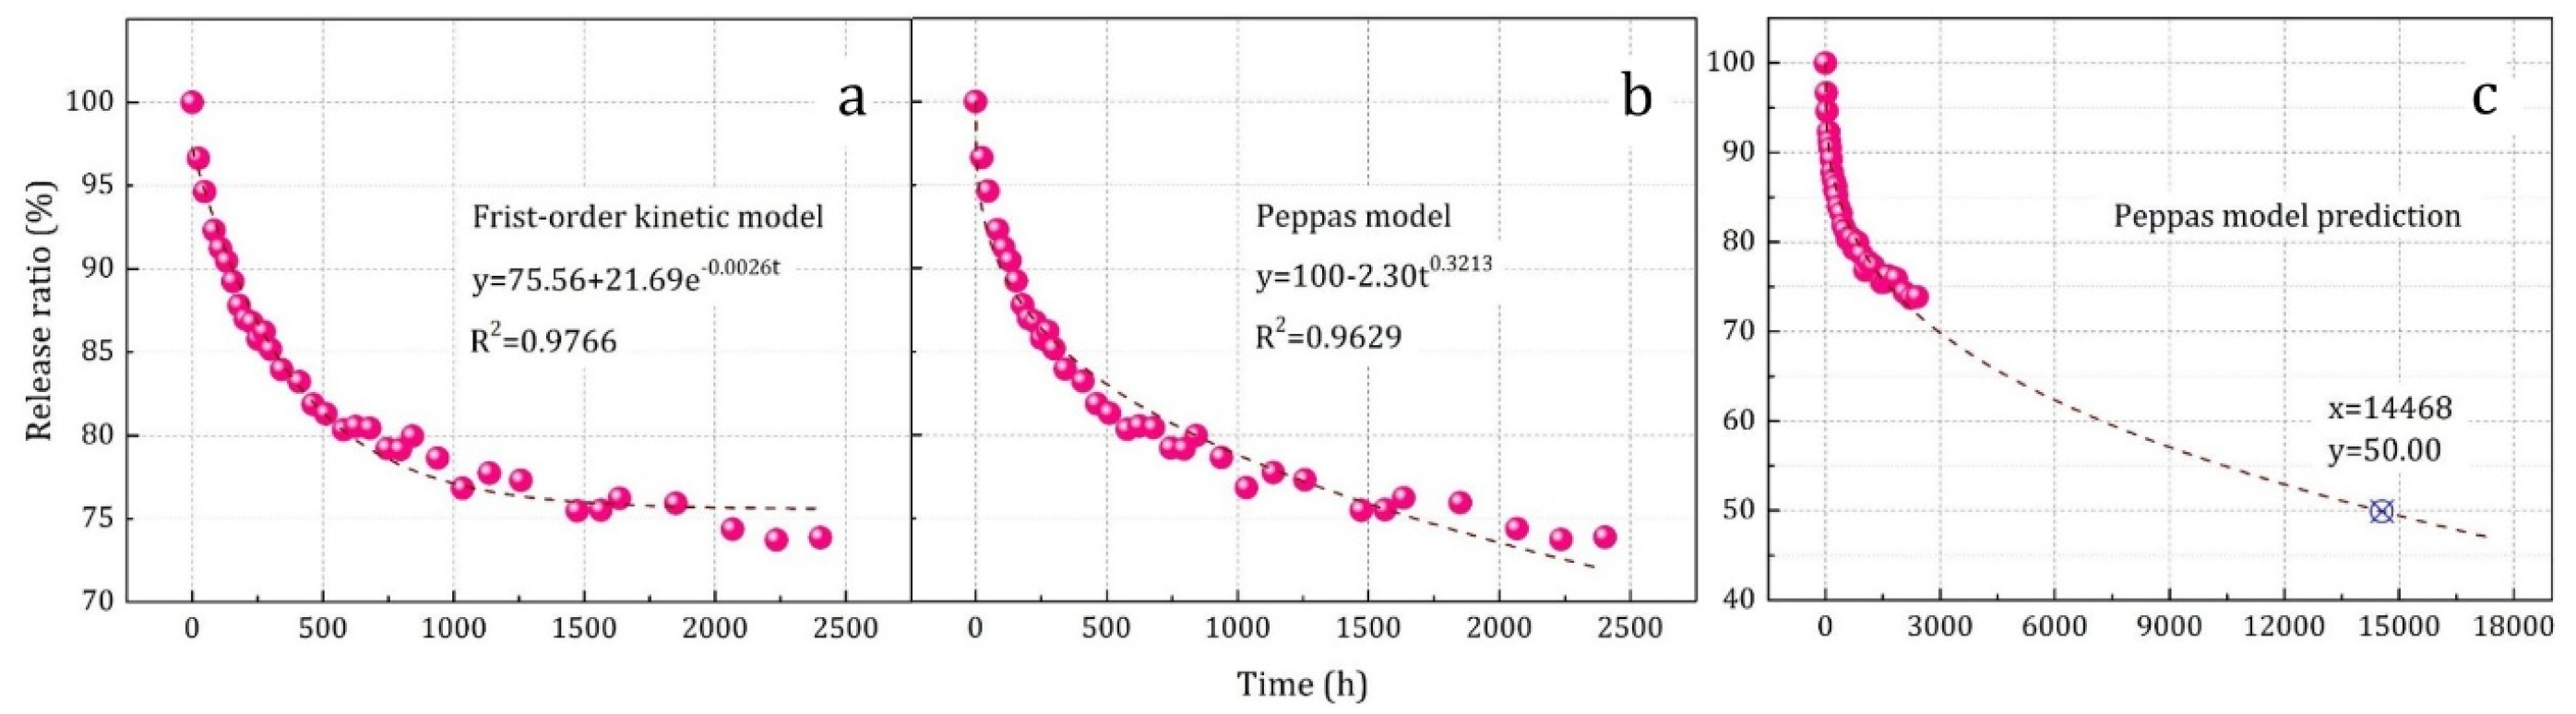
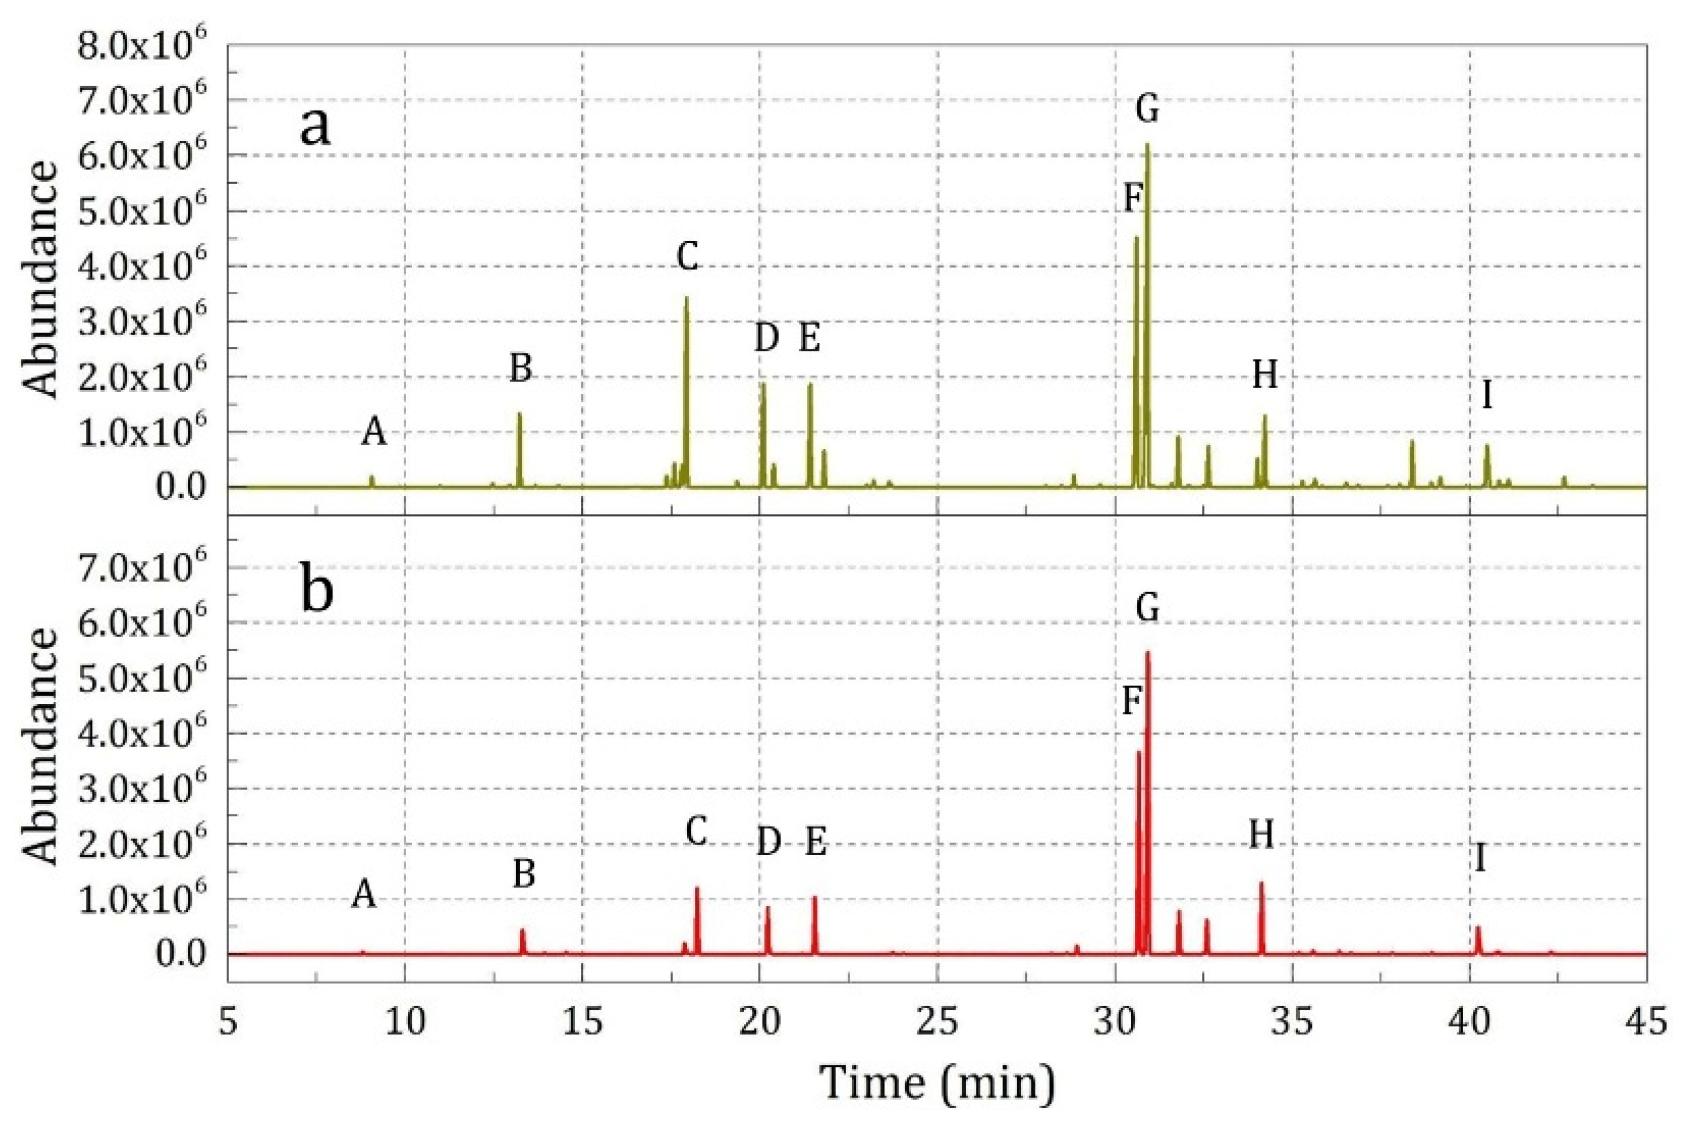
3.2.1. Sustained Release
Result: y = 75.56 + 21.69·e−0.0026t (R2 = 0.9766).
Result: y = 100 − 2.30t0.3213 (R2 = 0.9629).
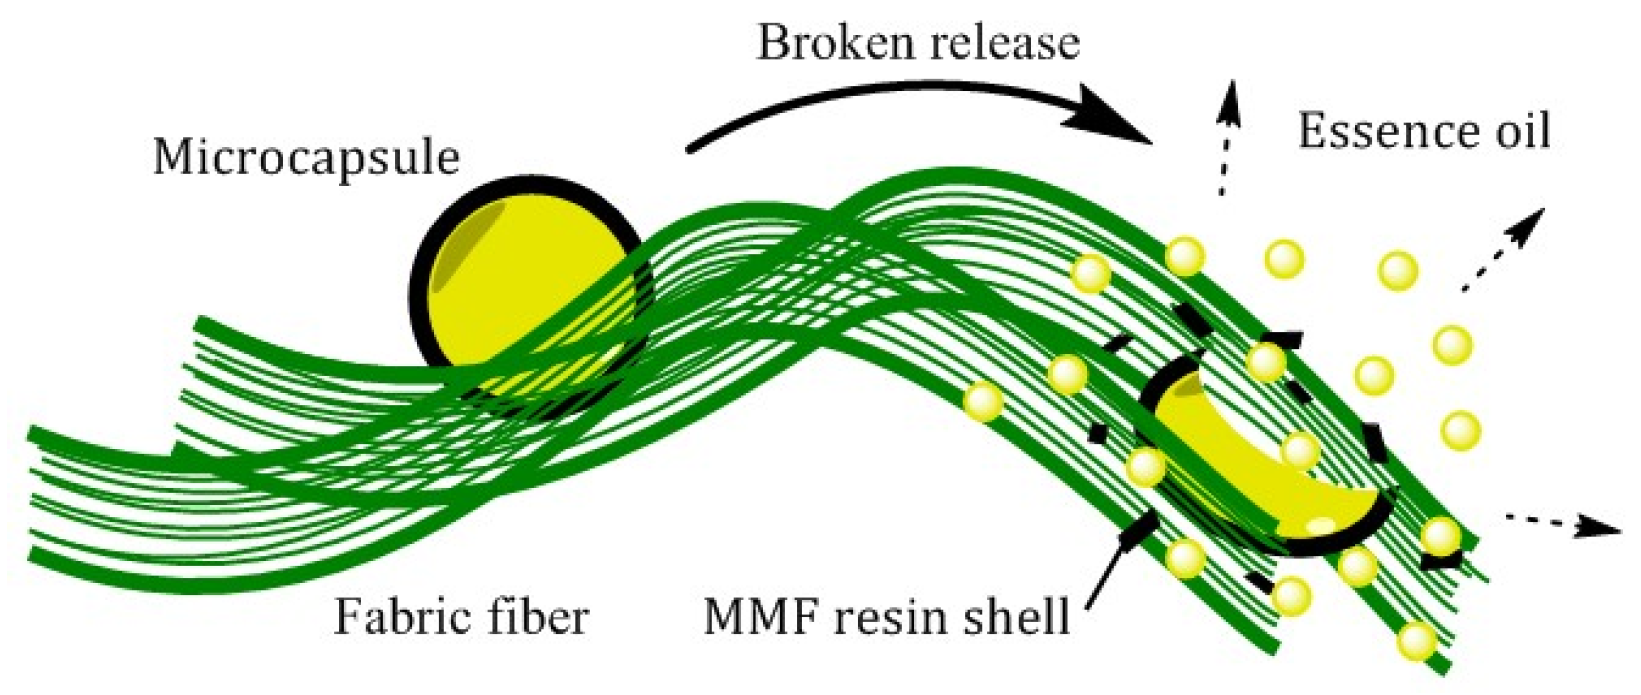
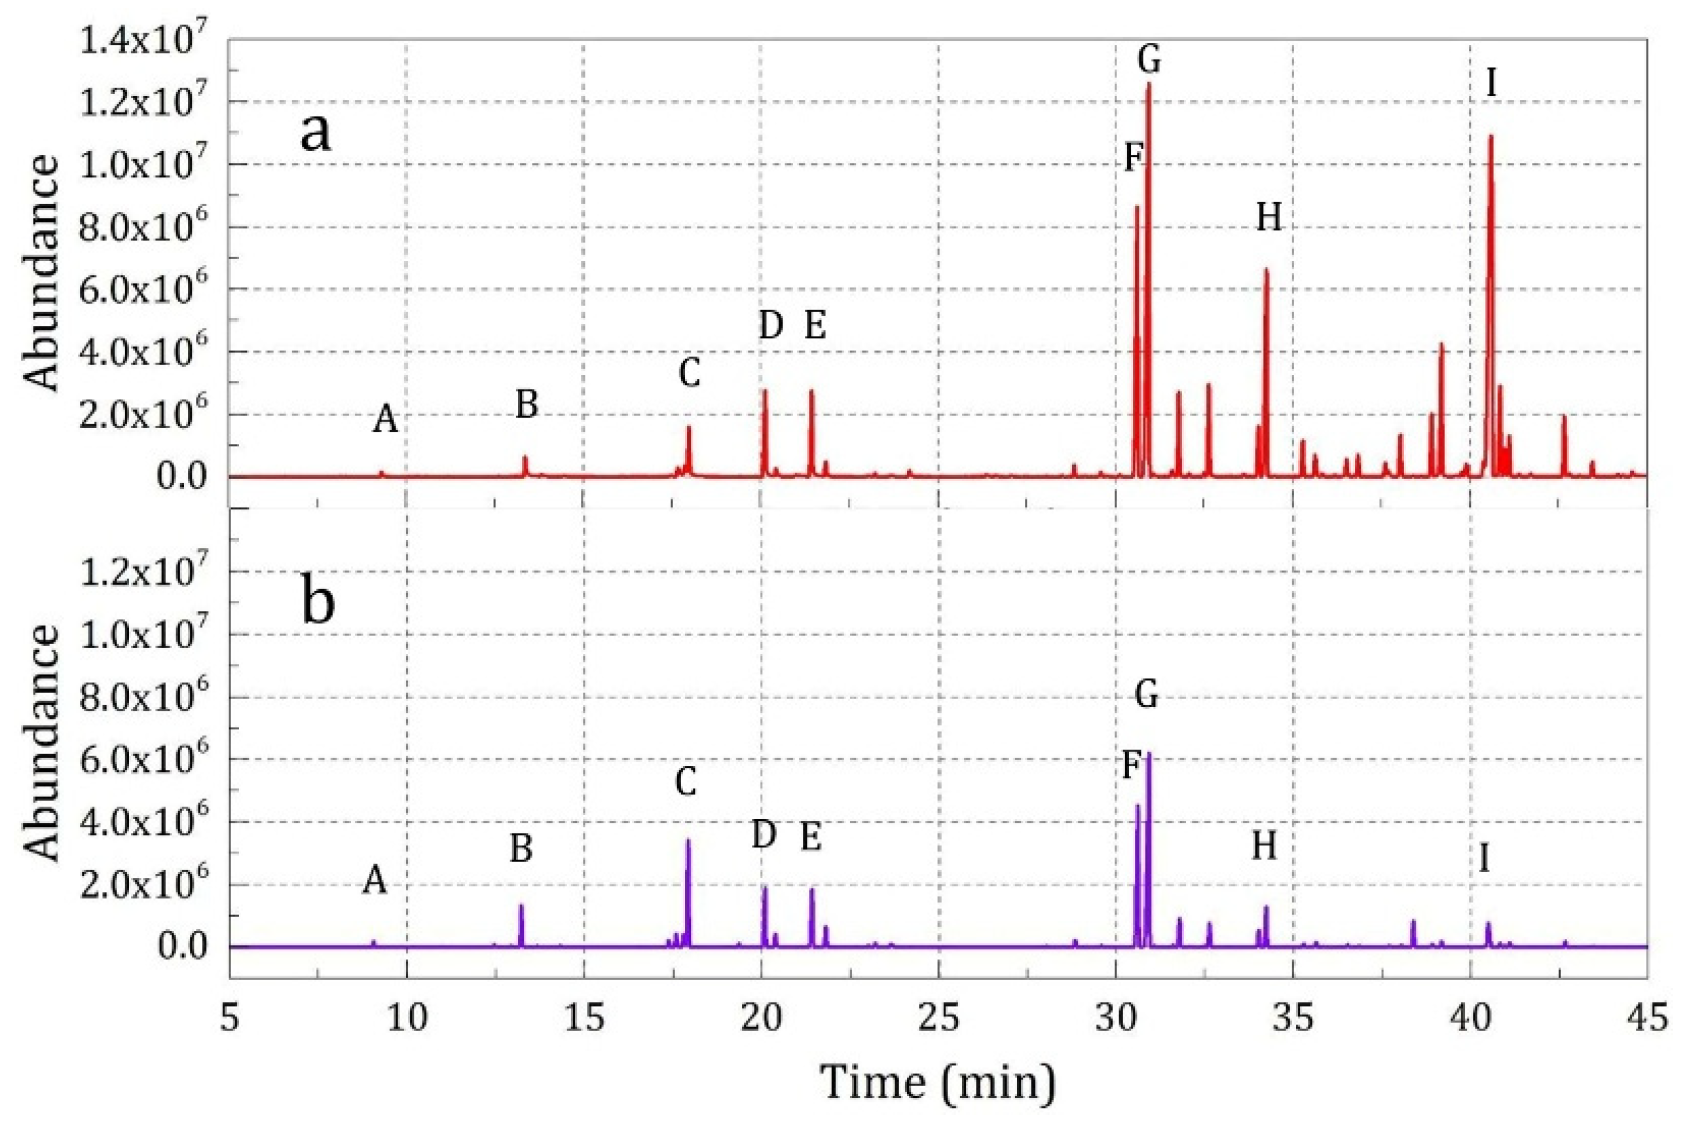
3.2.2. Broken Release
3.2.3. Sustained–Broken Release Comparison
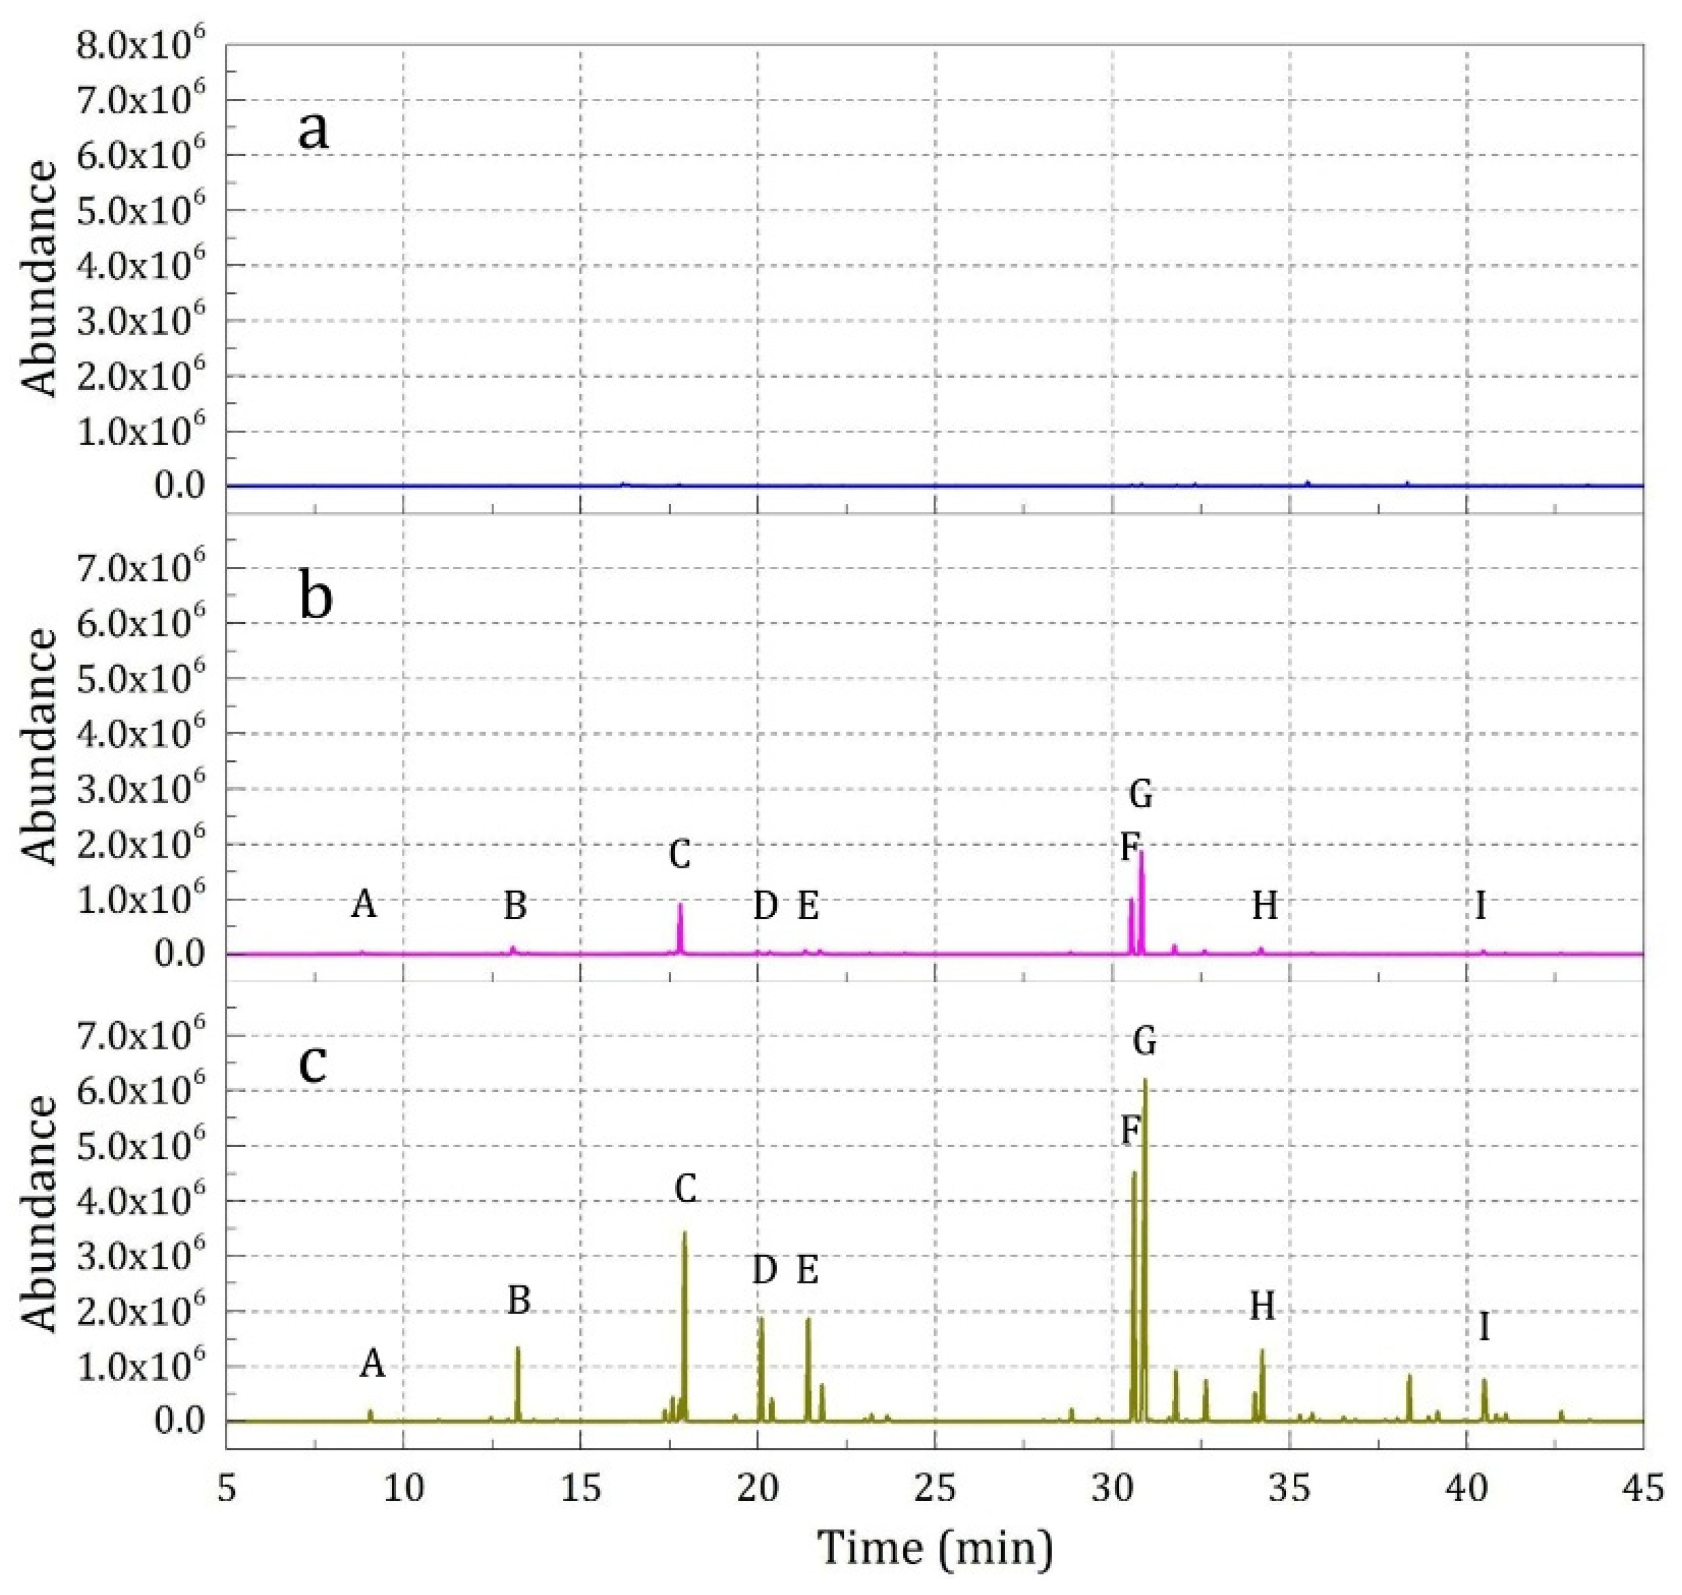
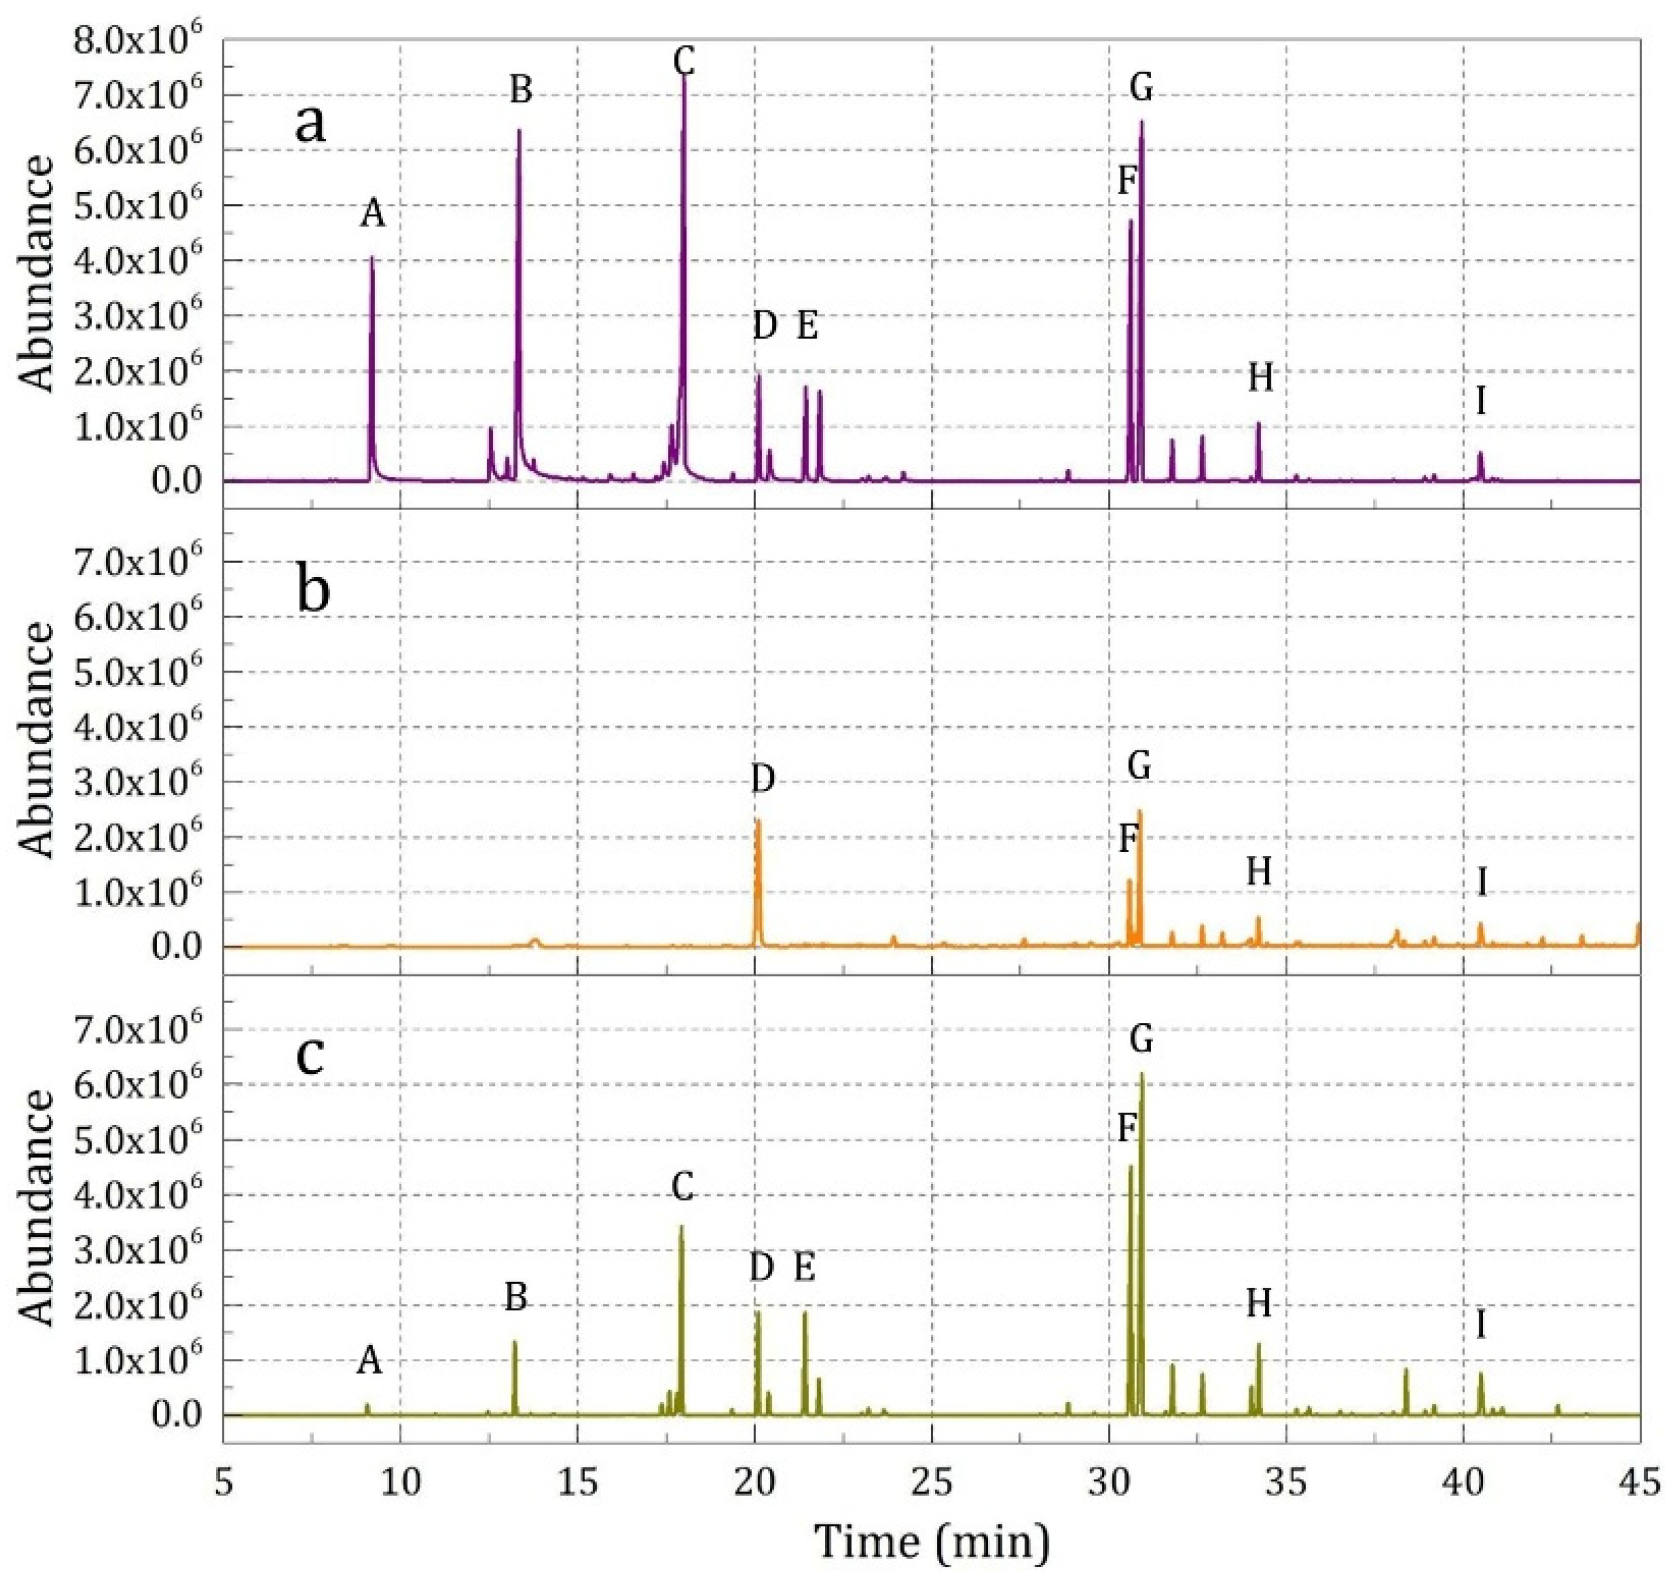
3.2.4. Release Property of Fabrics Finished by Essence Oil and Microcapsules
4. Conclusions
Author Contributions
Funding
Conflicts of Interest
References
- Kaur, R.; Kukkar, D.; Bhardwaj, S.K.; Kim, K.H.; Deep, A. Potential use of polymers and their complexes as media for storage and delivery of fragrances. J. Control. Release 2018, 285, 81–95. [Google Scholar] [CrossRef] [PubMed]
- Ghayempour, S.; Montazer, M. Micro/nanoencapsulation of essential oils and fragrances: Focus on perfumed, antimicrobial, mosquito-repellent and medical textiles. J. Microencapsul. 2016, 33, 497–510. [Google Scholar] [CrossRef] [PubMed]
- Son, K.; Yoo, D.I.; Shin, Y. Fixation of vitamin E microcapsules on dyed cotton fabrics. Chem. Eng. J. 2014, 239, 284–289. [Google Scholar] [CrossRef]
- Du, Q.; Ma, T.; Fu, C.; Liu, T.; Huang, Z.; Ren, J.; Shao, H.; Xu, K.; Tang, F.; Meng, X. Encapsulating Ionic Liquid and Fe3O4 Nanoparticles in Gelatin Microcapsules as Microwave Susceptible Agent for MR Imaging-guided Tumor Thermotherapy. ACS Appl. Mater. Inter. 2015, 7, 13612–13619. [Google Scholar] [CrossRef] [PubMed]
- Sánchez, P.; Sánchez-Fernandez, M.V.; Romero, A.; Rodríguez, J.F.; Sánchez-Silva, L. Development of thermo-regulating textiles using paraffin wax microcapsules. Thermochim. Acta 2010, 498, 16–21. [Google Scholar] [CrossRef]
- Tian, R.; Fu, X.; Zheng, Y.; Liang, X.; Wang, Q.; Ling, Y.; Hou, B. The preparation and characterization of double-layer microcapsules used for the self-healing of resin matrix composites. J. Mater. Chem. 2012, 22, 25437–25446. [Google Scholar] [CrossRef]
- Lavrenova, A.; Farkas, J.; Weder, C.; Simon, Y.C. Visualization of polymer deformation using microcapsules filled with charge-transfer complex precursors. ACS Appl. Mater. Inter. 2015, 7, 21828–21834. [Google Scholar] [CrossRef] [PubMed]
- Wang, N.; Wu, Y.; Mi, L.; Zhang, J.; Li, X.; Fang, Q. The influence of silicone shell on double-layered microcapsules in intumescent flame-retardant natural rubber composites. J. Therm. Anal. Calorim. 2014, 118, 349–357. [Google Scholar] [CrossRef]
- Zhang, W.; Deng, L.; Wang, G.; Guo, X.; Li, Q.; Zhang, J.; Khashab, N.M. Low-magnetization magnetic microcapsules: A synergistic theranostic platform for remote cancer cells therapy and imaging. Part. Part. Syst. Charact. 2014, 31, 985–993. [Google Scholar] [CrossRef]
- Ma, Y.; Li, Z.; Wang, H.; Li, H. Synthesis and optimization of polyurethane microcapsules containing [BMIm]PF6 ionic liquid lubricant. J. Colloid Interface Sci. 2019, 534, 469–479. [Google Scholar] [CrossRef] [PubMed]
- Yang, Z.; Ding, L.; Wu, P.; Liu, Y.; Nie, F.; Huang, F. Fabrication of RDX, HMX and CL-20 based microcapsules via in situ polymerization of melamine-formaldehyde resins with reduced sensitivity. Chem. Eng. J. 2015, 268, 60–66. [Google Scholar] [CrossRef]
- Zhang, X.-P.; Luo, J.; Zhang, D.-X.; Jing, T.-F.; Li, B.-X.; Liu, F. Porous microcapsules with tunable pore sizes provide easily controllable release and bioactivity. J. Colloid Interface Sci. 2018, 517, 86–92. [Google Scholar] [CrossRef]
- Teixeira, M.A.; Rodríguez, O.; Rodrigues, S.; Martins, I.; Rodrigues, A.E. A case study of product engineering: Performance of microencapsulated perfumes on textile applications. AlChE J. 2012, 58, 1939–1950. [Google Scholar] [CrossRef]
- Peña, B.; Panisello, C.; Aresté, G.; Garcia-Valls, R.; Gumí, T. Preparation and characterization of polysulfone microcapsules for perfume release. Chem. Eng. J. 2012, 179, 394–403. [Google Scholar] [CrossRef]
- Sansukcharearnpon, A.; Wanichwecharungruang, S.; Leepipatpaiboon, N.; Kerdcharoen, T.; Arayachukeat, S. High loading fragrance encapsulation based on a polymer-blend: Preparation and release behavior. Int. J. Pharm. 2010, 391, 267–273. [Google Scholar] [CrossRef]
- Yeh, K.-W.; Chang, C.P.; Yamamoto, T.; Dobashi, T. Release model of alginate microcapsules containing volatile tea-tree oil. Colloids Surf. Physicochem. Eng. Aspects 2011, 380, 152–155. [Google Scholar] [CrossRef]
- Yeh, K.W.; Chang, C.P.; Yamamoto, T.; Dobashi, T. Release behavior of capsules loaded by volatile liquid in multicores. Colloid Polym. Sci. 2012, 290, 1583–1591. [Google Scholar] [CrossRef]
- Mercadé-Prieto, R.; Pan, X.; Fernández-González, A.; Zhang, Z.; Bakalis, S. Quantification of microcapsules deposited in cotton fabrics before and after abrasion using fluorescence microscopy. Ind. Eng. Chem. Res. 2012, 51, 16741–16749. [Google Scholar] [CrossRef]
- Bezerra, F.M.; Carmona, O.G.; Carmona, C.G.; Lis, M.J.; de Moraes, F.F. Controlled release of microencapsulated citronella essential oil on cotton and polyester matrices. Cellulose 2016, 23, 1459–1470. [Google Scholar] [CrossRef]
- Ebadi, A.; Rafati, A.A.; Bavafa, S.; Mohammadi, M. Kinetic and theoretical studies of novel biodegradable thermo-sensitive xerogels based on PEG/PVP/silica for sustained release of enrofloxacin. Appl. Surf. Sci. 2017, 425, 282–290. [Google Scholar] [CrossRef]
- Maleki, M.; Amani-Tehran, M.; Latifi, M.; Mathur, S. Drug release profile in core-shell nanofibrous structures: A study on Peppas equation and artificial neural network modeling. Comput. Methods Programs Biomed. 2014, 113, 92–100. [Google Scholar] [CrossRef]
- Fei, X.; Zhao, H.; Zhang, B.; Cao, L.; Yu, M.; Zhou, J.; Yu, L. Microencapsulation mechanism and size control of fragrance microcapsules with melamine resin shell. Colloids Surf. Physicochem. Eng. Aspects 2015, 469, 300–306. [Google Scholar] [CrossRef]
- Zhao, H.; Fei, X.; Zhang, B.; Zhao, S.; Li, G.; Cao, L. Controlling the size of fragrance microcapsules using designed agitator paddles: Experiment and CFD simulation. Particuology 2018. [Google Scholar] [CrossRef]
- Howard, G.M.; Poucher, W.A. The Raw Materials of Perfumery, 7th ed.; Chapman and Hall: London, UK, 1974. [Google Scholar]
- Poucher, W.A. The Production, Manufacture, and Application of Perfumes, 9th ed.; Chapman and Hall: London, UK, 1993. [Google Scholar]
- Fu, D.; Su, Y.; Xie, B.; Liu, G.; Li, Z.; Jiang, K.; Wang, D. Pore decoration on microcapsule surface using nonionic surfactant micelles as template: Temperature effect and encapsulation mechanism investigation. Colloids Surf. Physicochem. Eng. Aspects 2011, 384, 219–227. [Google Scholar] [CrossRef]


| Style | Weave | Weight (g·m−2) | Thickness (mm) | width (mm) | Length (mm) |
|---|---|---|---|---|---|
| 100% Cotton | Plain | 156 | 0.4 | 6 | 18 |
| Sample | Substrate | Finishing Agent | Treatment | Absorption Time |
|---|---|---|---|---|
| 1 | Fabric | Microcapsule | No hitting1 | 10 min |
| 2 | Fabric | Microcapsule | No hitting | 12 h |
| 3 | Fabric | Microcapsule | Hitting 1 time | 10 min |
| 4 | Fabric | Microcapsule | Hitting 5 times | 10 min |
| 5 | Fabric | Essence oil + emulsifier | No hitting | 10 min |
| 6 | 5 drops essence oil | Null | No hitting | 10 min |
| 7 | Fabric | Microcapsule | Standing for 2400 h at 25 °C, hitting 5 times | 10 min |
| Notes | Peaks | Substances |
|---|---|---|
| Top note | A | Ethyl-2-Methylbutyrate |
| B | Ethy2-Methylvalerate | |
| Middle note | C | 1,8-Cineole |
| D | Dihydromyrcenol | |
| E | Tetrahydrolinalool | |
| Base note | F | Isobornyl acetate |
| G | 4-tert-Butylcyclohexyl acetate | |
| H | 3,5,5-Trimethylhexyl Acetate | |
| I | Tricyclodecenyl propionate |
| Peaks | Samples | b/a | |
|---|---|---|---|
| (a) Sample 1 | (b) Sample 2 | ||
| A | — | 141935 | — |
| B | — | 579547 | — |
| C | 22765 | 1583204 | 69.55 |
| D | — | 2803734 | — |
| E | — | 2759339 | — |
| F | 16756 | 8256025 | 492.72 |
| G | 33312 | 11431463 | 343.16 |
| H | — | 6143374 | — |
| I | 9979 | 10876780 | 1089.97 |
| Peaks | Samples | c/b | ||
|---|---|---|---|---|
| (a) Sample 1 | (b) Sample 3 | (c) Sample 4 | ||
| A | — | 30239 | 183224 | 6.06 |
| B | — | 123145 | 1325714 | 10.77 |
| C | 22765 | 898194 | 3501869 | 3.90 |
| D | — | 51882 | 1844140 | 35.54 |
| E | — | 64510 | 1808735 | 28.04 |
| F | 16756 | 992325 | 4448527 | 4.48 |
| G | 33312 | 1843702 | 5872087 | 3.18 |
| H | — | 111938 | 1294174 | 11.56 |
| I | 9979 | 60428 | 754148 | 12.48 |
| Peaks | Samples | a/b | |
|---|---|---|---|
| (a) Sample 4 | (b) Sample 7 | ||
| A | 183224 | 48438 | 3.78 |
| B | 1325714 | 440152 | 3.01 |
| C | 3501869 | 1187322 | 2.95 |
| D | 1844140 | 843829 | 2.19 |
| E | 1808735 | 1027600 | 1.76 |
| F | 4448527 | 3641310 | 1.22 |
| G | 5872087 | 5425702 | 1.08 |
| H | 1294174 | 1271108 | 1.02 |
| I | 754148 | 481820 | 1.57 |
| Peak | Samples | b/a | |
|---|---|---|---|
| (a) Sample 2 | (b) Sample 4 | ||
| A | 141935 | 183224 | 1.29 |
| B | 579547 | 1325714 | 2.29 |
| C | 1583204 | 3501869 | 2.21 |
| D | 2803734 | 1844140 | 0.66 |
| E | 2759339 | 1808735 | 0.66 |
| F | 8256025 | 4448527 | 0.54 |
| G | 11431463 | 5872087 | 0.51 |
| H | 6143374 | 1294174 | 0.21 |
| I | 10876780 | 754148 | 0.07 |
| Peaks | Samples | c/a | b/a | ||
|---|---|---|---|---|---|
| (a) Sample 6 | (b) Sample 5 | (c) Sample 6 | |||
| A | 4042352 | — | 183224 | 0.05 | — |
| B | 5783880 | — | 1325714 | 0.23 | — |
| C | 6839605 | — | 3501869 | 0.51 | — |
| D | 1804020 | 2286585 | 1844140 | 1.02 | 1.27 |
| E | 1619746 | — | 1808735 | 1.12 | — |
| F | 4469289 | 1167465 | 4448527 | 1.00 | 0.26 |
| G | 5931929 | 2308449 | 5872087 | 0.99 | 0.39 |
| H | 1050035 | 513144 | 1294174 | 1.23 | 0.49 |
| I | 483660 | 374041 | 754148 | 1.56 | 0.77 |
© 2019 by the authors. Licensee MDPI, Basel, Switzerland. This article is an open access article distributed under the terms and conditions of the Creative Commons Attribution (CC BY) license (http://creativecommons.org/licenses/by/4.0/).
Share and Cite
Zhao, H.; Fei, X.; Cao, L.; Zhang, B.; Liu, X. The Fabrication of Fragrance Microcapsules and Their Sustained and Broken Release Behavior. Materials 2019, 12, 393. https://doi.org/10.3390/ma12030393
Zhao H, Fei X, Cao L, Zhang B, Liu X. The Fabrication of Fragrance Microcapsules and Their Sustained and Broken Release Behavior. Materials. 2019; 12(3):393. https://doi.org/10.3390/ma12030393
Chicago/Turabian StyleZhao, Hongbin, Xuening Fei, Lingyun Cao, Baolian Zhang, and Xin Liu. 2019. "The Fabrication of Fragrance Microcapsules and Their Sustained and Broken Release Behavior" Materials 12, no. 3: 393. https://doi.org/10.3390/ma12030393
APA StyleZhao, H., Fei, X., Cao, L., Zhang, B., & Liu, X. (2019). The Fabrication of Fragrance Microcapsules and Their Sustained and Broken Release Behavior. Materials, 12(3), 393. https://doi.org/10.3390/ma12030393